Remote Sens. 2022, 14(14), 3252; https://doi.org/10.3390/rs14143252 - 6 Jul 2022
Cited by 7 | Viewed by 2398
Abstract
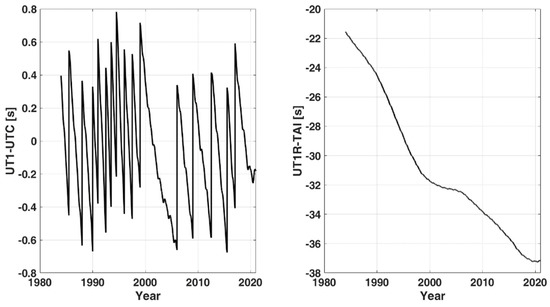
Universal time (UT1-UTC) is a key component of Earth orientation parameters (EOP), which is important for the study of monitoring the changes in the Earth’s rotation rate, climatic variation, and the characteristics of the Earth. Many existing UT1-UTC prediction models are based on
[...] Read more.
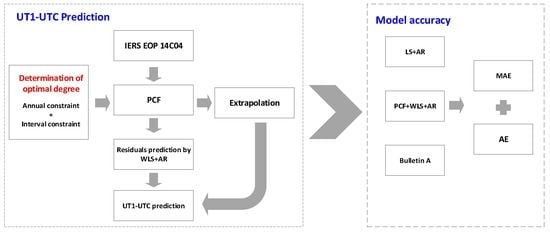
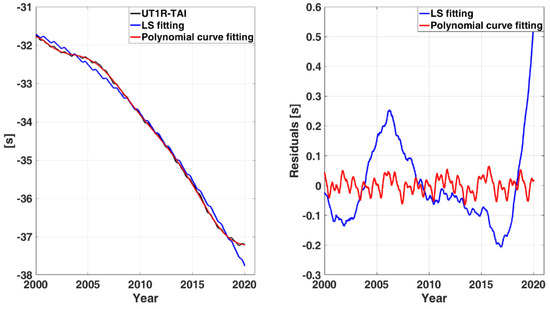
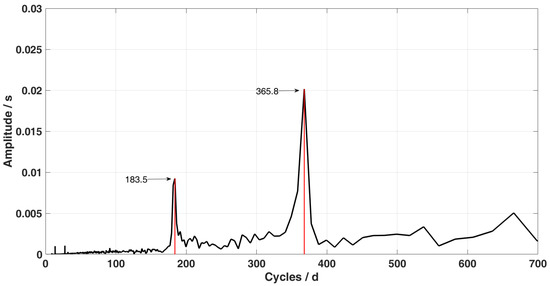
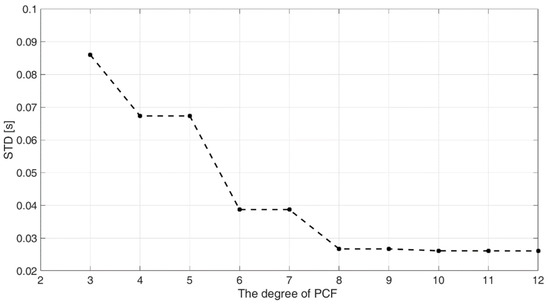
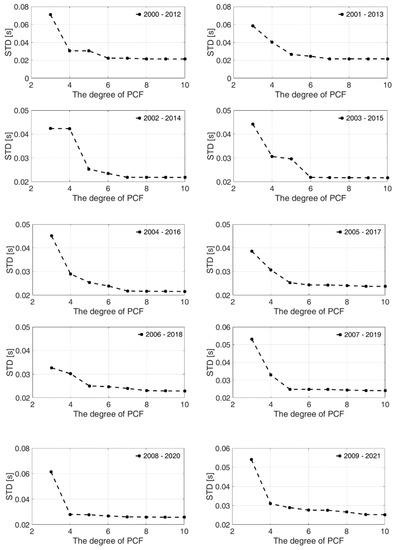
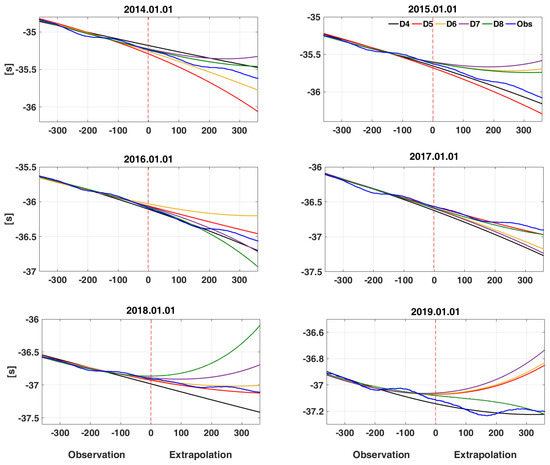
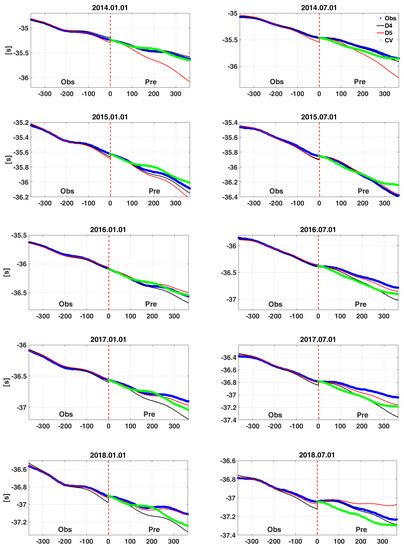
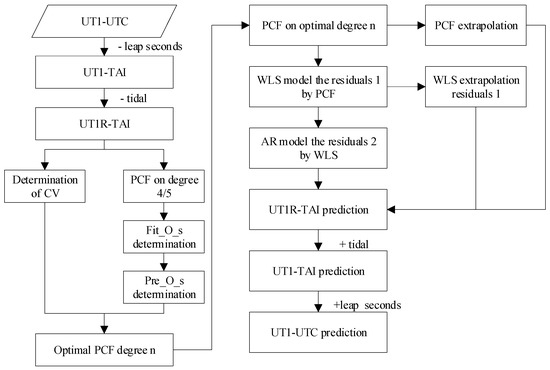
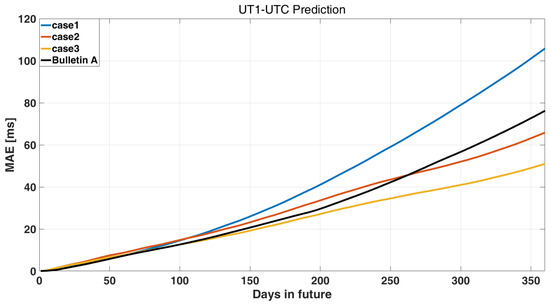
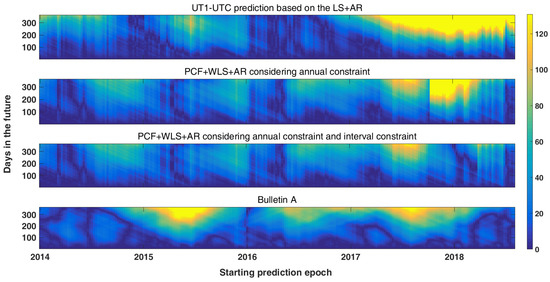
Universal time (UT1-UTC) is a key component of Earth orientation parameters (EOP), which is important for the study of monitoring the changes in the Earth’s rotation rate, climatic variation, and the characteristics of the Earth. Many existing UT1-UTC prediction models are based on the combination of least squares (LS) and stochastic models such as the Autoregressive (AR) model. However, due to the complex periodic characteristics in the UT1-UTC series, LS fitting produces large residuals and edge distortion, affecting extrapolation accuracy and thus prediction accuracy. In this study, we propose a combined prediction model based on polynomial curve fitting (PCF), weighted least squares (WLS), and AR, namely, the PCF+WLS+AR model. The PCF algorithm is used to obtain accurate extrapolation values, and then the residuals of PCF are predicted by the WLS+AR model. To obtain more accurate extrapolation results, annual and interval constraints are introduced in this work to determine the optimal degree of PCF. Finally, the multiple sets prediction experiments based on the International Earth Rotation and Reference Systems Service (IERS) EOP 14C04 series are carried out. The comparison results indicate that the constrained PCF+WLS+AR model can efficiently and precisely predict the UT1-UTC in the mid and long term. Compared to Bulletin A, the proposed model can improve accuracy by up to 33.2% in mid- and long-term UT1-UTC prediction.
Full article
(This article belongs to the Special Issue Space-Geodetic Techniques)
►
Show Figures
Graphical abstract


