Article

Response of Sediment Connectivity to Altered Convergence Processes Induced by Forest Roads in Mountainous Watershed

1
Key Laboratory of Geospatial Technology for the Middle and Lower Yellow River Regions of the Ministry of Education, Henan Dabieshan National Field Observation and Research Station of Forest Ecosystem, College of Geography and Environmental Science, Henan University, Kaifeng 475004, China
2
Administrative Bureau of Jigongshan National Nature Reserve, Xinyang 464133, China
*
Author to whom correspondence should be addressed.
Remote Sens. 2022, 14(15), 3603; https://doi.org/10.3390/rs14153603
Submission received: 9 June 2022 / Revised: 22 July 2022 / Accepted: 24 July 2022 / Published: 27 July 2022
(This article belongs to the Special Issue Remote Sensing of Soil Erosion in Forest Area)

Abstract

:
Forest roads significantly affect sediment connectivity in mountainous catchments by contributing to the production of and disturbing the confluence of sediment-loaded runoff. This study considered forest roads as pathways and sinks of sediment-loaded runoff to understand the effects of forest roads on the confluence characteristics and sediment connectivity in mountainous a catchment using a scenario simulation. In order to determine the contribution and spatial relationship between sediment connectivity and influencing factors, this study utilized buffer analysis, an extremely randomized tree model, and multiscale geographically weighted regression. The results show that the presence of forest roads significantly changes the transport process and connectivity of runoff and sediment in the mountainous catchment. Specifically, flow length increases, but flow accumulation, upslope contributing area, and topographic index decrease with increasing distance from roads and streams. Meanwhile, the effects of roads on convergence characteristics and sediment connectivity are mainly manifested within a certain threshold that varies with different confluence characteristics. Moreover, sediment connectivity increases when considering roads as pathways and sinks of sediment-loaded runoff, especially on the upper hillslopes intercepted by roads and at the road–stream crossings. In addition, the closer the distance to the roads, the greater the impact of road on the confluence characteristics and sediment connectivity. Change in flow length is the most important factor affecting the sediment connectivity among all of the other convergence, terrain, and spatial distance characteristics. The longer the flow length, the lower the sediment connectivity. In conclusion, this study demonstrates that the altered confluence processes by roads increases the possibility that sediment-loaded runoff will be transported to the catchment outlet, which is of significance for the proper management of forest roads in mountainous catchments.

Graphical Abstract

1. Introduction

Roads are one of the most important anthropogenic factors affecting material circulation, energy flow, and information transfer efficiency in watersheds worldwide [1,2]. With the intensification of human activities such as forest logging, tourism development, and mineral mining, road-related soil erosion has increasingly attracted the attention of academic researchers and government management departments [3,4]. Although the area percentage of roads in a watershed is relatively low, they change the topographical and hydrological processes within watersheds by creating and exacerbating soil erosion [5] and affect the generation and transmission of runoff and sediment [6,7], thus significantly influencing the structure, process, and function of the watershed [1]. In mountainous watersheds that are sensitive to human activities and prone to erosion, the continuous expansion of roads through the restoration of old and abandoned roads for logging, the renovation of existing roads, and the construction of new planned roads [4] has led to fragmented forest landscapes in the watershed, disturbed water and sediment transport processes, and aggravated soil erosion, and thus seriously threatens the stability of the mountainous ecosystem [5]. Given the rapid expansion of the global road network, road erosion has become an urgent ecological issue.
Roads not only contribute to the production of sediment, but they also have a profound impact on the confluence process of surface runoff [8,9,10]. On the one hand, road-induced soil erosion is an important sediment source in watersheds [7]. Studies have shown that pavements combined with vegetation removal are bound to reduce infiltration rates and increase the rainfall–runoff coefficient compared to natural hillslopes, thus improving the potential of road erosion, and resulting in considerably higher runoff and sediment loads [11]. On the other hand, as a transport pathway or channel for runoff and sediment, roads can enhance the formation of concentrated flow and improve the connectivity of transporting sediment by influencing the natural drainage networks of the watershed [12], thereby significantly changing the transport mechanisms of sediment-loaded runoff [6].
Previous studies have highlighted the response of water and sediment transport processes to roads [9,13,14]. These studies confirmed that, due to the complex network structure characteristics of the road system itself and its direct or indirect impact on the surrounding landscape as a disturbance, roads can significantly change the sediment production process by changing the landscape pattern, land use, topographical features, and vegetation cover of a watershed [1,2]. However, these studies mostly either highlighted the runoff and sediment-yielding characteristics of pavement and its erosion units at the scale of a plot or road segment [5,12], or qualitatively analyzed the relationship between road network characteristics and runoff and sediment characteristics on the scale of a watershed [15]. In contrast, studies on the driving mechanism and spatial heterogeneity of roads on the transport process of eroded sediment in watersheds are relatively lacking [16].
To reveal the transport mechanism of eroded sediment from roads, it is necessary to clarify the source it originated from, the way it happened, and the environmental conditions it depends on, as well as its efficiency and the connectivity it transported [17,18]. Sediment connectivity characterizes the transport process and transport potential of sediment from source to sink through separation and transport processes [19,20]. As an important representative of human activities in watersheds, roads are expected to affect the degree and spatial distribution of sediment connectivity by changing topography, surface flow direction, and drainage networks [21]. For instance, roads intercept surface runoff [22], collect runoff and sediment from road surfaces and upper hillslopes [23], and form a complex artificial drainage network, thereby changing the confluence of sediment-loaded runoff along the roads. At the same time, the drainage networks will be extended to places previously not reached which will increase the possibility of runoff and sediment reaching the stream [23], ultimately increasing the sediment connectivity of the watershed [24,25]. In addition, a road–stream crossing affects the confluence characteristics by changing the natural properties of a stream network within a watershed [26], which has been shown to be the main way that sediment-loaded runoff is transferred from roads to streams through a direct path with the highest transmission efficiency [27,28].
Roads affect the sediment transport process in watersheds mainly by changing the transport direction of sediment-loaded runoff [5,29]. The existence of a road changes the flow direction and intercepts and collects sediment, so that the sediment originally being transported downstream along the hillslope is transported downstream along the roads [30]. This not only changes the flow length of sediment in the upslope area intercepted by a road, but also alters the magnitude of flow accumulation in the lower hillslope area intercepted by a road, which in turn affects the sediment transport process throughout the entire watershed [31].
At present, several researchers have focused on the influence of roads on sediment connectivity at the watershed scale [23,32,33]. However, few studies quantifying sediment connectivity in watersheds have fully estimated the effects of roads on changing the direction of sediment transport, while also quantifying the changes in the confluence process of sediment and the role of roads in transporting sediment as pathways or sinks. As a result, the complex role of roads cannot be fully reflected in the spatial variation in sediment connectivity.
Therefore, taking the Xiangchagou catchment in the Dabie Mountain area of China as a case study, this research was conducted (1) to clarify the road-induced changes in the confluence direction and transmission pathways of sediment by conceptualizing the drainage networks of the catchment, (2) to comparatively analyze the response of the confluence process and sediment connectivity to roads based on scenario simulation, and (3) to determine the primary factors that contribute to sediment connectivity in a mountainous watershed. This study aids in the understanding of the influencing mechanism of roads on the sediment connectivity in a mountainous watershed, providing a basis for forest management.

2. Materials and Methods

2.1. Study Area

The Xiangchagou catchment (114°1′1″–114°3′30″E, 31°46′5″–31°48′5″N) is located in the Jigongshan National Nature Reserve in Henan Province of China, at the southern foot of Jigong Mountain (Figure 1). The catchment is situated in a typical hilly area with an area of 6.40 km2. The catchment is characterized by a transitional climate between subtropical and warm temperate with a mean temperature of 15.2 °C and annual precipitation of 1119 mm, with most precipitation occurring between April and October (more than 80% of annual precipitation occurs between these months). The soil is dominated by yellow brown and yellow cinnamon soils. This catchment is located in a transitional zone between subtropical plants and warm temperate plants. It is rich in forest resources and contains relatively complete natural secondary vegetation and native plant communities. The typical vegetation types are deciduous broad-leaved forests and deciduous evergreen broad-leaved mixed forests with canopy closure of more than 90%. The dominant tree species mainly include Chinese cork oak (Quercus variabilis Bl.), sawtooth oak (Quercus acutissima Carruth.), mono maple (Acer pictum subsp. mono (Maxim.) H. Ohashi), liquidambar formosana (Liquidambar formosana Hance), and Bunge hackberry (Celtis bungeana Bl.). The Xiangchagou catchment has seminatural characteristics with less human disturbance and well-preserved forests. Forest roads with a total length of 11.26 km and a road density of 1.76 km/km2 in this catchment were constructed for forest production, harvesting, and management. The total stream length in this catchment is 7.15 km, with a stream density of 1.12 km/km2. Due to the low design standards and lack of maintenance, the unpaved forest roads have been severely eroded due to heavy rainfall, causing the formation of numerous rills on the road surfaces. Therefore, forest roads in this catchment serve as a source of and pathway for sediment and runoff, increasing the erosion risk of the downslope area.

2.2. Data Acquisition

The data used in this study mainly include topography, stream network, road network, and vegetation datasets. The topographical data were extracted from the digital elevation model (DEM) with a resolution of 16 m from August 2018. The stream networks were generated based on the DEM using the hydrological analysis tools in ArcGIS 10.2. The road networks were extracted from Google Earth images (with a resolution of 0.5 m from November 2018) using a visual inspection method, which was calibrated and validated using the road map provided by the Administrative Bureau of Jigongshan National Nature Reserve. The vegetation data were provided by the Administrative Bureau of Jigongshan National Nature Reserve. The Google Earth images and DEM datasets were observed from the 91 satellite map assistant software (Google Earth v6.0.3). The confluence process indicators, sediment connectivity, road and stream network characteristics, and topographic characteristics were calculated based on the DEM, stream networks, and road networks datasets.

2.3. Altered Transport Pathways by Road Networks

For this study, we hypothesized that the transport process of sediment-loaded runoff from hillslopes to streams is dominated by the original processes that are influenced by the natural underlying surface, with the pathways and direction of the flow networks not affected by roads (Figure 2a).
If there is a road, the original flow direction will be changed, and the pathways will be interrupted at the intersection of the road and pathways. Therefore, once the sediment-loaded runoff from the upper hillslopes reaches the road, it will select the road as the transmission channel and transmit orientating in the lower direction of the road, while the sediment-loaded runoff originating from hillslopes and lower than the road will still transmit along the original flow direction and pathway with less flow accumulation (Figure 2b).
The sediment-loaded runoff transported along the road will be discharged from the road at the road’s drains or outlets, and then be transported downhill to the road and, finally, transported to the stream (Figure 2b,c). Alternatively, the sediment-loaded runoff transported along the road will be directly discharged into the stream at the road–stream crossing (Figure 2b,c).
Based on the above hypotheses, three scenarios were set up according to the role of roads in the confluence process of sediment-loaded runoff. Using the three scenarios, we determined the spatial differentiation characteristics of sediment confluence processes and the impact of a road on the sediment confluence characteristics to reveal the response mechanism of sediment confluence processes to roads in a mountainous watershed. The three scenarios are as follows.
(1) Scenario 1 (S1, Figure 2a): no consideration is given to the role of roads in changing the flow direction or acting as transport pathways or channels for sediment-loaded runoff. Instead, only considering the topographical factors, the D8 algorithm is used to calculate the transport direction of sediment-loaded runoff based on the original DEM of the watershed. This scenario is considered to be undisturbed by any roads within the watershed.
(2) Scenario 2 (S2, Figure 2b): Given the role of roads in changing flow direction, roads were taken as the transport pathways for sediment-loaded runoff to be transported to the sinks (the streams or channels are considered as the sink of receiving sediment-loaded runoff). Based on the original flow direction of that in S1, the flow lines can be generated using the “Bearing Distance To Line” tool in ArcGIS. The flow lines are a vector layer with attributes such as distance and azimuth and is generated from a raster layer based on the flow direction, which is used to illustrate the delivery trajectory of sediment-loaded runoff moving downhill. The sediment-loaded runoff originating from the upper hillslope is expected to migrate to the road along the flow lines and then transmit along the road. On the way, if the sediment-loaded runoff transported along the roads encounters a drainage outlet, the sediment-loaded runoff will be concentrated at the drainage outlet and be discharged to the sink (stream) through the hillslope between the road and the stream. In cases with a road–stream crossing, the sediment-loaded runoff will be concentrated and directly discharged to the sink (stream). Compared with S1, the original pathways between the road drainage outlet and the stream remains unchanged, but the volume of sediment-loaded runoff increases tremendously.
(3) Scenario 3 (S3, Figure 2c): Given the role of roads on transporting sediment-loaded runoff as streams or channels, roads were taken as the sink for directly receiving sediment-loaded runoff from the upper hillslope. Compared with S2, no consideration is given to the role of roads in changing the flow direction and acting as pathways for transporting sediment-loaded runoff to the sink, but the road is directly taken as the destination of transmission. Accordingly, the transmission distance of sediment-loaded runoff is greatly shortened.
The impact of the road on transporting sediment increases from S1 which does not consider the road, to S2 which takes the road as the pathway for transporting sediment-loaded runoff to the stream (sink), and then to S3 which takes the road as the sink (destination) of the sediment-loaded runoff.

2.4. Response Variables

The impact of roads on the transport process of runoff and sediment is first manifested through changing flow direction, which in turn affects the flow accumulation along the road and the confluence pathways on the lower hillslope, and finally changes the confluence process of the watershed. Therefore, different groups of indicators of susceptibility to roads were calculated to quantify the impact of roads on the confluence process and connectivity of sediment, including flow length (FL), flow accumulation (FA), upslope contributing area (UCA), topographic index (TI), and accessibility (Shimbel index, SHI) which were used to characterize the confluence processes, the elevation (DEM), slope gradient (SG), relative-smoothness index (RS), and terrain relief (TR) that were used to characterize the terrain features in the watershed, as well as distance to stream (Stream_DS), distance to road (Road_DS), stream density (Stream_D), and road density (Road_D) that were used to characterize the spatial structure characteristics of road and stream networks in the watershed.

2.4.1. Flow Length

Flow length (FL) refers to the distance from the grid cell to the sink or outlet of a watershed [34], which is used to reflect the transport distance of runoff and sediment from the source to the sink in the watershed. The shorter the FL, the further distance the runoff and sediment travel from the source to the sink [34]. In this study, the FL of each grid cell was calculated using the hydrological analysis tool of ArcGIS 10.2.

2.4.2. Flow Accumulation

Flow accumulation (FA) represents the amount of the grid cell with unit water flowing into a grid cell in the watershed, which can reflect the capacity of a grid cell to carry sediment downstream [35]. This calculation assumes that each DEM grid cell has a water volume of one unit, which can move to its neighboring grid cells according to differences in elevation. Based on the above movement and the principle that water always flows to the lower grid cell, the flow direction matrix of a watershed can be calculated. Then, the FA within each grid cell can be obtained based on the flow direction matrix. Assuming that the unit water of each grid is 1, FA can be calculated and is equal to the number of all other grid cells that flow through the targeted grid. The calculation of FA of each grid cell is as follow [35]:
A ( i ) = w ( i ) + n e N ( i ) α ( n , i ) A ( n )
where w(i) represents the unit water of the grid i; N(i) represents grid cells adjacent to cell I (no more than 8); and A(n) and A(i) represent the flow accumulation of grid cells n and i.

2.4.3. Upslope Contributing Area

Upslope contributing area (UCA) refers to the summed area of all of the grid cells flowing through a node or grid cell and is used to determine the catchment area within the study area that is connected to a specified node, grid cell, sink, or watershed outlet [36]. The UCA of each node is calculated by multiplying the number of grid cells that flow through the node by the area of the grid cells [36]:
A = ( n + 1 ) × D X 2
where A represents the upslope contributing area, n represents the number of grid cells that flow through the node, and DX represents the node (grid cell) size.

2.4.4. Topographic Index

Topographic index (TI) is an important parameter that was proposed by Beven et al. [37]. It is often used to quantitatively estimate the impact of topography on runoff generation by taking into account different influencing factors such as soil water, soil saturation, soil infiltration, and soil thickness. Including these factors can more accurately reflect the generation process of surface runoff. In this study, the TI of the Xiangchagou catchment was calculated under the three scenarios using a single-flow-direction algorithm based on the changes in flow direction caused by roads. TI is calculated according to the following formula [38]:
T I = l n ( α / t a n β )
where TI represents the topographic index, α represents the catchment area upon unit contour, and tanβ represents the local slope angle along the steepest slope direction. The catchment area upon unit contour (α) is calculated based on the following formulas [38]:
α = A / C
C = { D X     P r i n c i p a l   d i r e c t i o n D X 2     D i a g o n a l   d i r e c t i o n
tan β = Δ H Δ L
where A and DX are the same as in Formula (3), C represents the length of contour, ∆H is the elevation difference of the adjacent grid cells, and ∆L is the centroid distance of the adjacent grid cells.

2.4.5. Accessibility

Accessibility acts as a proxy for the effect of the geometric network [33]. In this study, accessibility is represented by the Shimbel index (SHI). In graph theory, the influence of each grid cell on sediment transport efficiency can be evaluated by considering its position in the sediment cascade. The higher the connectivity, the greater the influence of the node on the whole sediment transport network. Based on this phenomenon, the SHI is used to describe the location of each grid cell in the sediment transport network, so as to reflect the transmission characteristics of grids in hydrological networks. For each grid i, based on a distance matrix, SHI can be calculated by summing the lengths of all of the shortest pathways that connect all other grids j in the graph (dij) [33]. If the SHI is low on the slope, then the grid cell contributes by creating short pathways within the hydrological networks, leading to a high accessibility. By contrast, if the SHI is low along the channel and sink, a low accessibility will be observed. While counterintuitive, this feature has been confirmed by the proposer and is now accepted within the scientific community [33]. Meanwhile, to facilitate spatial and temporal analysis, the value of SHI can be normalized by using the following method:
S h i i = d i j d j k
where dij represents the sum of the lengths of grid cell i connecting all other grid cells j with the shortest pathways in the hydrological networks; djk represents the sum of the lengths of all of the pathways from j to k in the hydrological networks.

2.4.6. Terrain Relief

Terrain relief (TR) is an important indicator for describing and classifying landforms. It is defined as the difference in elevation between the highest and lowest grid cells within a certain surface area [39]. In this study, the neighborhood statistics analysis method was used to calculate the TR of the Xiangchagou catchment, and the mean change point method was used to determine the optimal statistical range. The steps for calculating IC are as follows. Firstly, setting the window size (scale) in increments of 2 (3 × 3, 5 × 5, 7 × 7, …, 23 × 23, 25 × 25). Secondly, calculating TR as the difference between the maximum and the minimum elevation between the grid cell and its neighborhood under different window scales using the neighborhood analysis method. Thirdly, using the mean change point method to determine the inflection point of the response curve between window scales (abscissa) and TR (ordinate). Finally, the window size corresponding to the inflection point is determined as the best analysis window size. According to the above procedures, the best window size of Xiangchagou catchment in this study is 13 × 13; thus, its corresponding TR was considered as the effective TR of Xiangchagou catchment.

2.4.7. Characteristics of Road and Stream Networks

The “Euclidean distance” tool (ArcGIS 10.2) and road and stream network data were used to generate the raster layers of distance to stream (Stream_DS) and distance to road (Road_DS) for the Xiangchagou catchment. Road or stream density was calculated as the length-to-area ratio of roads or streams within the catchment, which could be used to measure the development of roads or streams. Based on the vector data of roads and streams in the Xiangchagou catchment, this study calculated the road density and stream density, participating in the driving analysis of IC spatial variation.

2.5. Sediment Connectivity

The index of connectivity (IC) was calculated to reflect sediment connectivity in this study area. It was proposed by Borselli et al. [40] to describe the dynamics of sediment transport processes at the watershed scale, which allows for exploring variation in the potential for sediment to be transported from source to sink. The main data used for calculating the IC include terrain data (i.e., the DEM), weighting factors, and road and stream network data. Using the above data and the “Analysis Tools” in ArcGIS 10.2, the IC was calculated using and the following equation:
I C = log 10 ( D u p D d n )
where Dup and Ddn represent the upslope and downslope components of IC, respectively. IC values range from [−∞, +∞], with greater values suggesting higher connectivity [40,41]. Dup describes the potential for upslope runoff and sediment to flow downstream based on the following equation [42]:
D u p = W ¯ S ¯ A
where W ¯ is the average weighting factor for the upslope contributing area with an average slope of S ¯ (m/m) and size of A (m2). The downslope component (Ddn) considers the length of the pathways that sediments must travel to reach the nearest target or sink [40]. It describes the potential for downward pathways of sediment produced upslope and is expressed as:
D d n = i d i W i S i
where di represents the length of the flow pathways along the grid cells according to the steepest downslope direction (m). Wi and Si represent the weighting factor and slope of the grid cell i, respectively.
The weighting factor for the original IC is represented by C-factors of USLE-RUSLE models [40]. However, vegetation and litter in the forest watershed can significantly increase surface roughness, thus increasing the resistance of transporting sediment [43]. Although the C factor considers the resistance of land use to runoff and sediment flux, it cannot fully reflect the surface characteristics in mountain forest watersheds [21]. Therefore, in this study, the relative-smoothness index (RS) which reflects the surface characteristics of forest watersheds was introduced as a weighting factor when calculating the IC. The relative-smoothness index is expressed as:
R S = n M i n n
where RS represents the relative-smoothness index, which is a dimensionless parameter ranging from 0.0 to 1.0. It preserves the dimensionlessness of the weighting factor (W) in the IC calculation process [43]. The n represents the Manning roughness coefficient derived from the following relationship [44]:
M = 2.4234 × e 0.3005 ln ( n )
where M represents the terrain roughness derived from the DEM based on the following equation:
M = 1 / cos α
where α is the slope gradient.
It is worth noting that, besides the modification of the weighting factor, all of the other calculating procedures of IC were consistent with Borselli et al. [40]. However, the original IC and its applications in previous studies did not fully consider roads as permanent drainage lines or local sinks affecting sediment transport, and, therefore, might have underestimated the influence of road networks on IC. To address these shortcomings, this study incorporated roads as local pathways (S2) and sinks (S3) by setting different scenarios while calculating the IC. Given the potential for downward routing of sediment produced upslope, these scenarios consider not only the length of the pathways that are required for sediment to reach the nearest sink (S2), but also which sink the sediment will reach (S3).

2.6. Buffer Analysis

Buffer analysis is a useful tool to solve issues related to spatial proximity and the influencing mechanism of geographical features [45]. Using the “Analysis Tools” in ArcGIS 10.2, a buffer analysis was conducted to identify the influence of streams, roads, and road–stream crossings on confluence characteristics and sediment connectivity. Based on the streams and roads data, 7 parallel buffer zones for both streams and roads were established at intervals of 30 m. For road–stream crossings, the same number and interval as the circular buffer zones were conducted. Within each buffer zone, the confluence characteristics, sediment connectivity, terrain features, and structural characteristics of roads and streams were calculated.

2.7. Extremely Randomized Tree Model

Proposed by Geurts et al. [46], the extremely randomized tree model (ERT) is an integrated algorithm based on many decision tree models. It is widely used for regression and classification given it is resistant to over-fitting and noise, has high computational efficiency, and requires fewer iterations for feature selection [46]. It can also handle high-dimensional data and parallel computing and, thus, provides synthetic results by integrating the different decision trees and their corresponding outcomes [47]. Moreover, ERT uses all of the training sets when constructing the decision tree without sampling, which can ensure that all training samples are utilized and helps to reduce the deviation in the model. In this study, the ERT model was implemented using the ExtraTreesRegressor package in the sklearn.ensemble library in Pycharm2021 to determine the relationship between sediment connectivity and confluence characteristics, terrain features, and spatial proximity characteristics of roads and streams. Random numbers of 1000 and eigenvalues of 6 were used to run the ERT model. The performance of the established ERT model was evaluated using the coefficient of determination (R2).

2.8. Multiscale Geographically Weighted Regression

The geographically weighted regression model (GWR) can solve issues of spatial heterogeneity and nonstationarity. However, most geographical phenomena are determined by multiple spatial processes on different scales, which means using just a single bandwidth on the same spatial scale without considering the spatial differences of the predictor variables will lead to a biased estimation. To fill this gap, Fotheringham et al. [48] proposed the multiscale geographically weighted regression model (MGWR) based on GWR. The MGWR model allows the relationships between the response and predictor variables to vary spatially with different bandwidths, thus improving the accuracy of the regression model [49]. In this study, the MGWR model was introduced to determine the spatial variation in the relationships between sediment connectivity and the influencing factors, which can be expressed as:
y i = j = 1 k β b w j x i j + ε i
where y is the response variable (sediment connectivity), βbwj is the bandwidth used for calibration of the jth relationship, Xij is the value of the jth explanatory parameter, and εi is a random error term.
Collinearity between variables needs to be removed before running the MGWR. In this study, the ordinary least squares (OLS) method was used to select the influencing factors and eliminate the indicators with multicollinearity, to achieve the best fitting effect [50]. OLS is a simple linear regression method based on the hypothesis that there is no dependence between spatial data. In general, based on OLS, the VIF statistic is commonly employed to screen for multicollinearity. A VIF greater than 7.5 is a common threshold for detecting multicollinearity. Accordingly, slope gradient (Slope), upslope contributing area (UCA), and relative-smoothness index (RS) were removed from the explanatory parameters. Considering that stream and forest roads are linear in the study area with few confluences, the stream density (Stream_D) and road density (Road_D) were both excluded from the explanatory parameters. Finally, flow length (FL), flow accumulation (FA), topographic index (TI), accessibility (Shimbel index, SHI), elevation (DEM), terrain relief (TR), distance to stream (Stream_DS), and distance to road (Road_DS) were selected to run the MGWR. The MGWR results indicated that the selected eight explanatory parameters all were significantly related to the response variable IC. The R2 of the established MGWR in each scenario was 0.97, 0.97, and 0.95, respectively, and all scenarios had bandwidths of 43, indicating that IC in the study area was sensitive to all of the selected eight explanatory parameters under the three scenarios.

3. Results

3.1. Response of Convergence Processes to Forest Roads

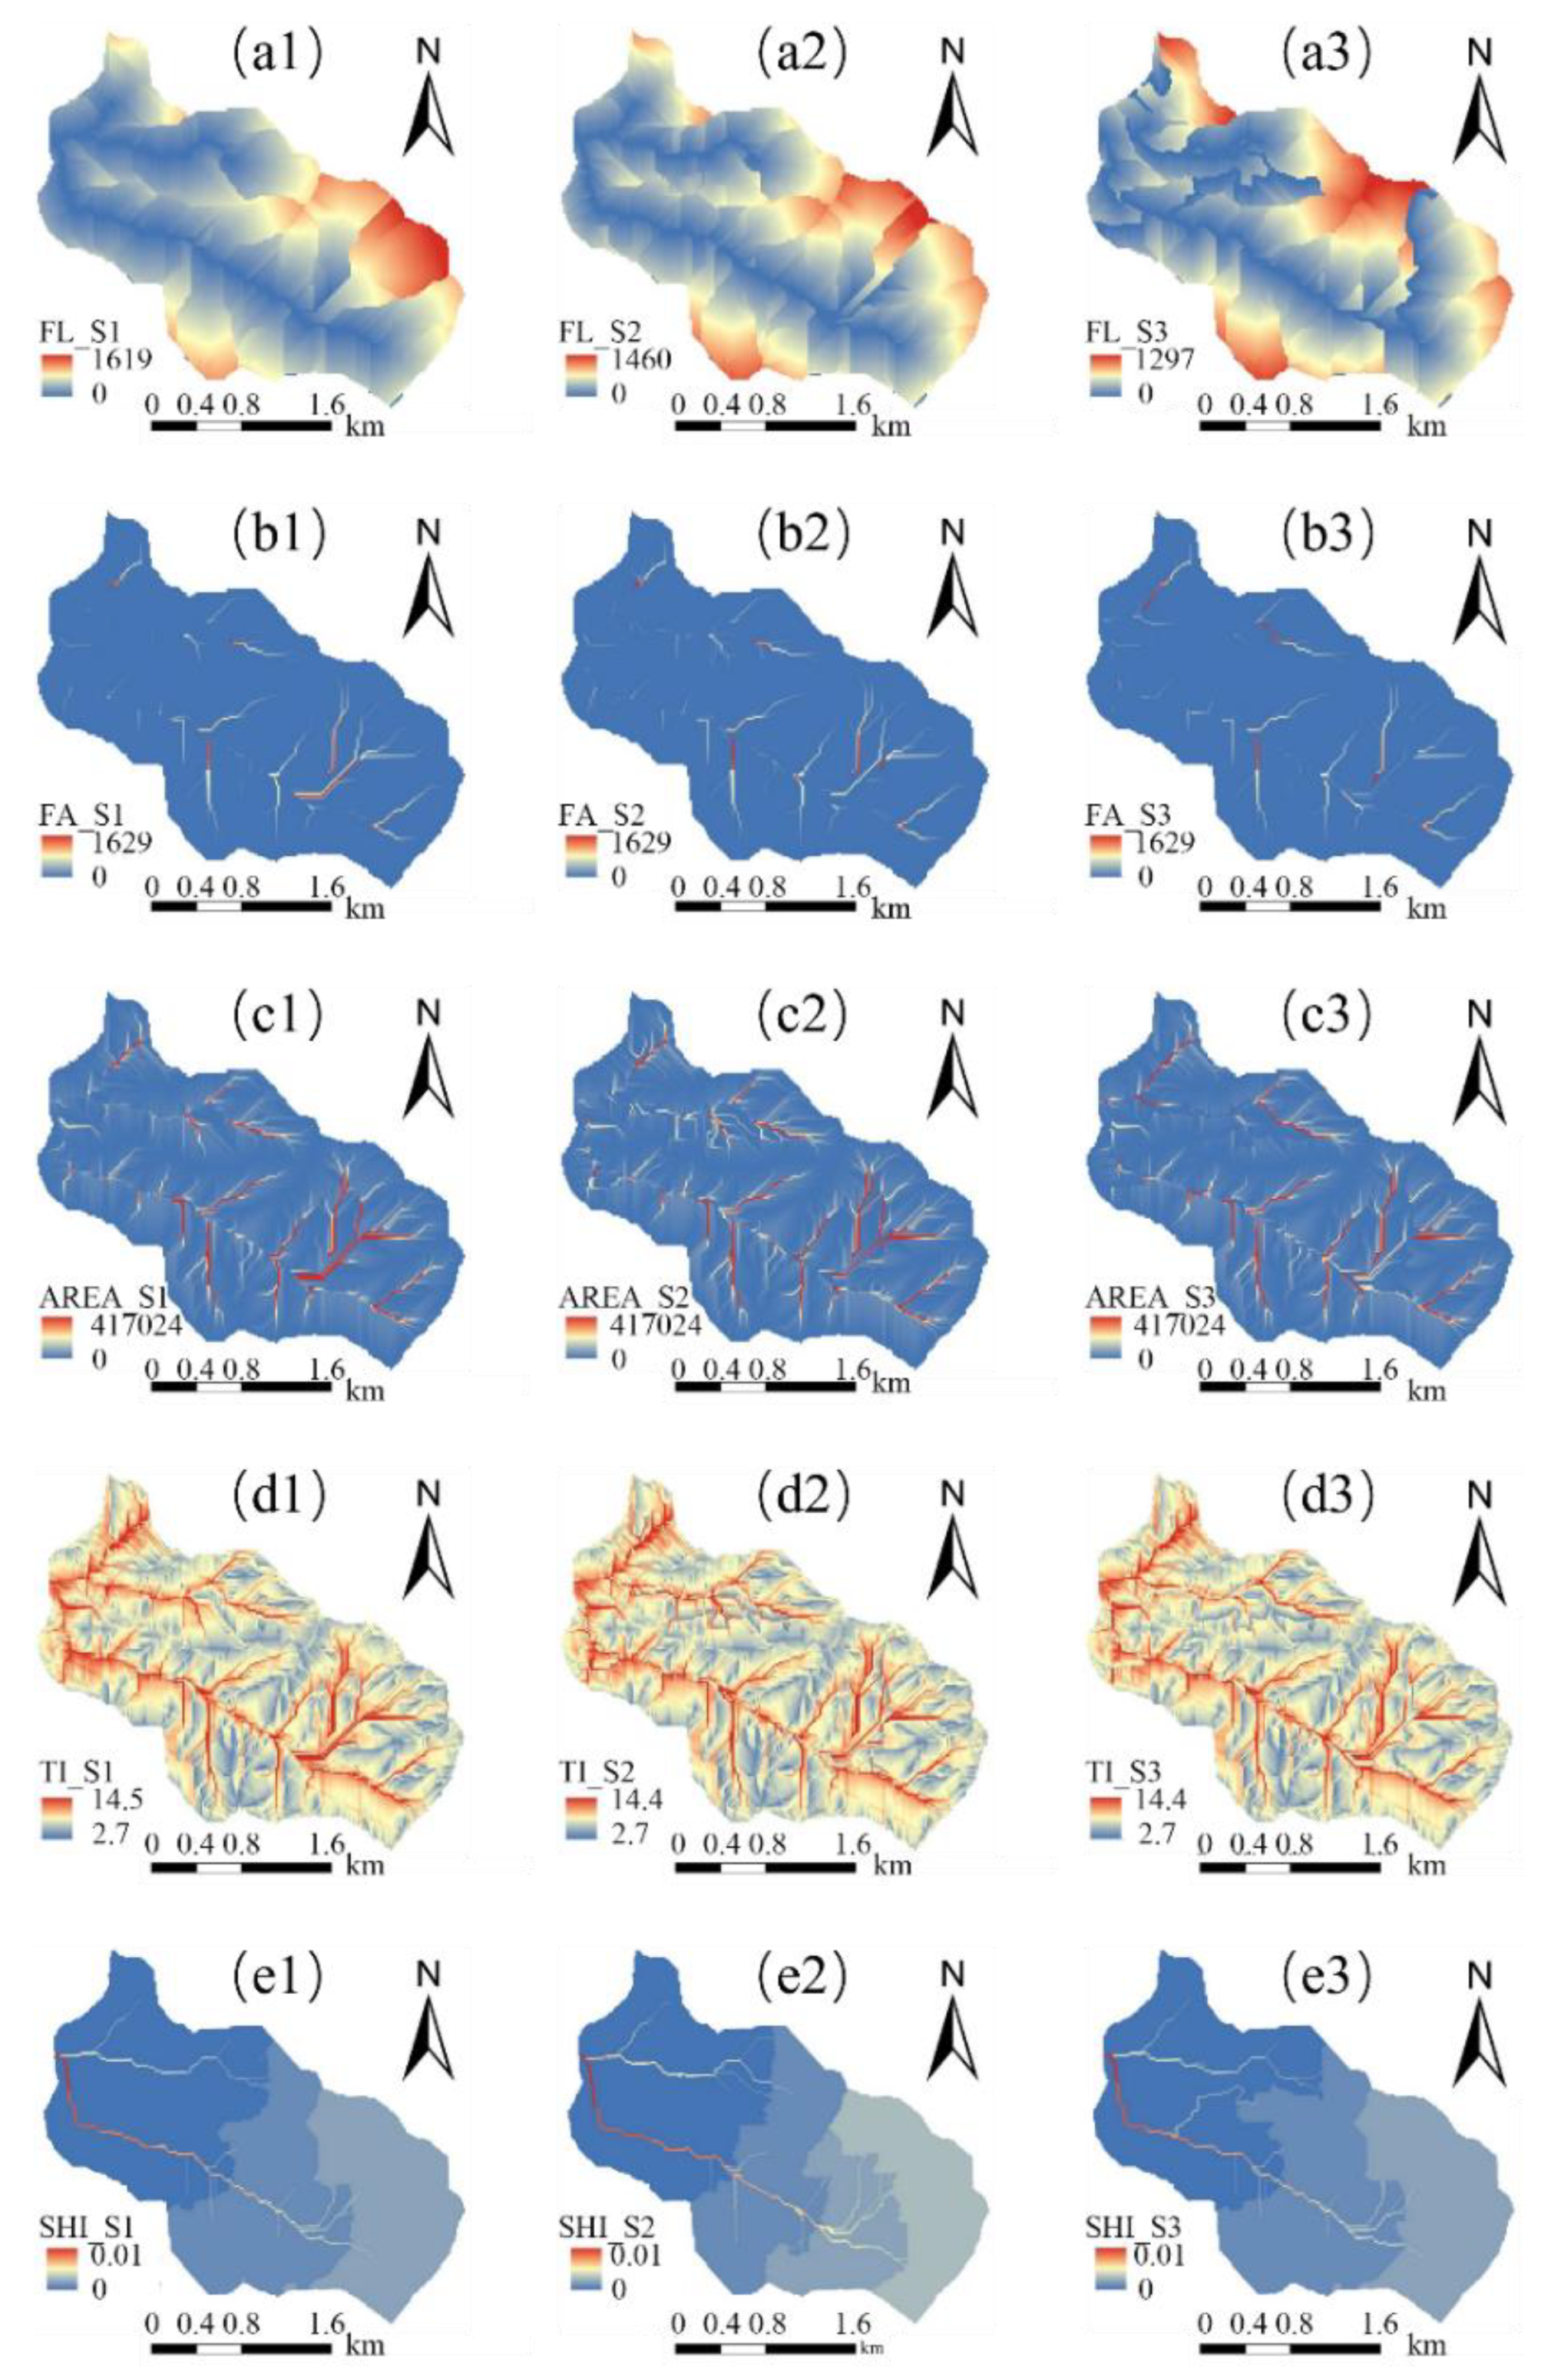
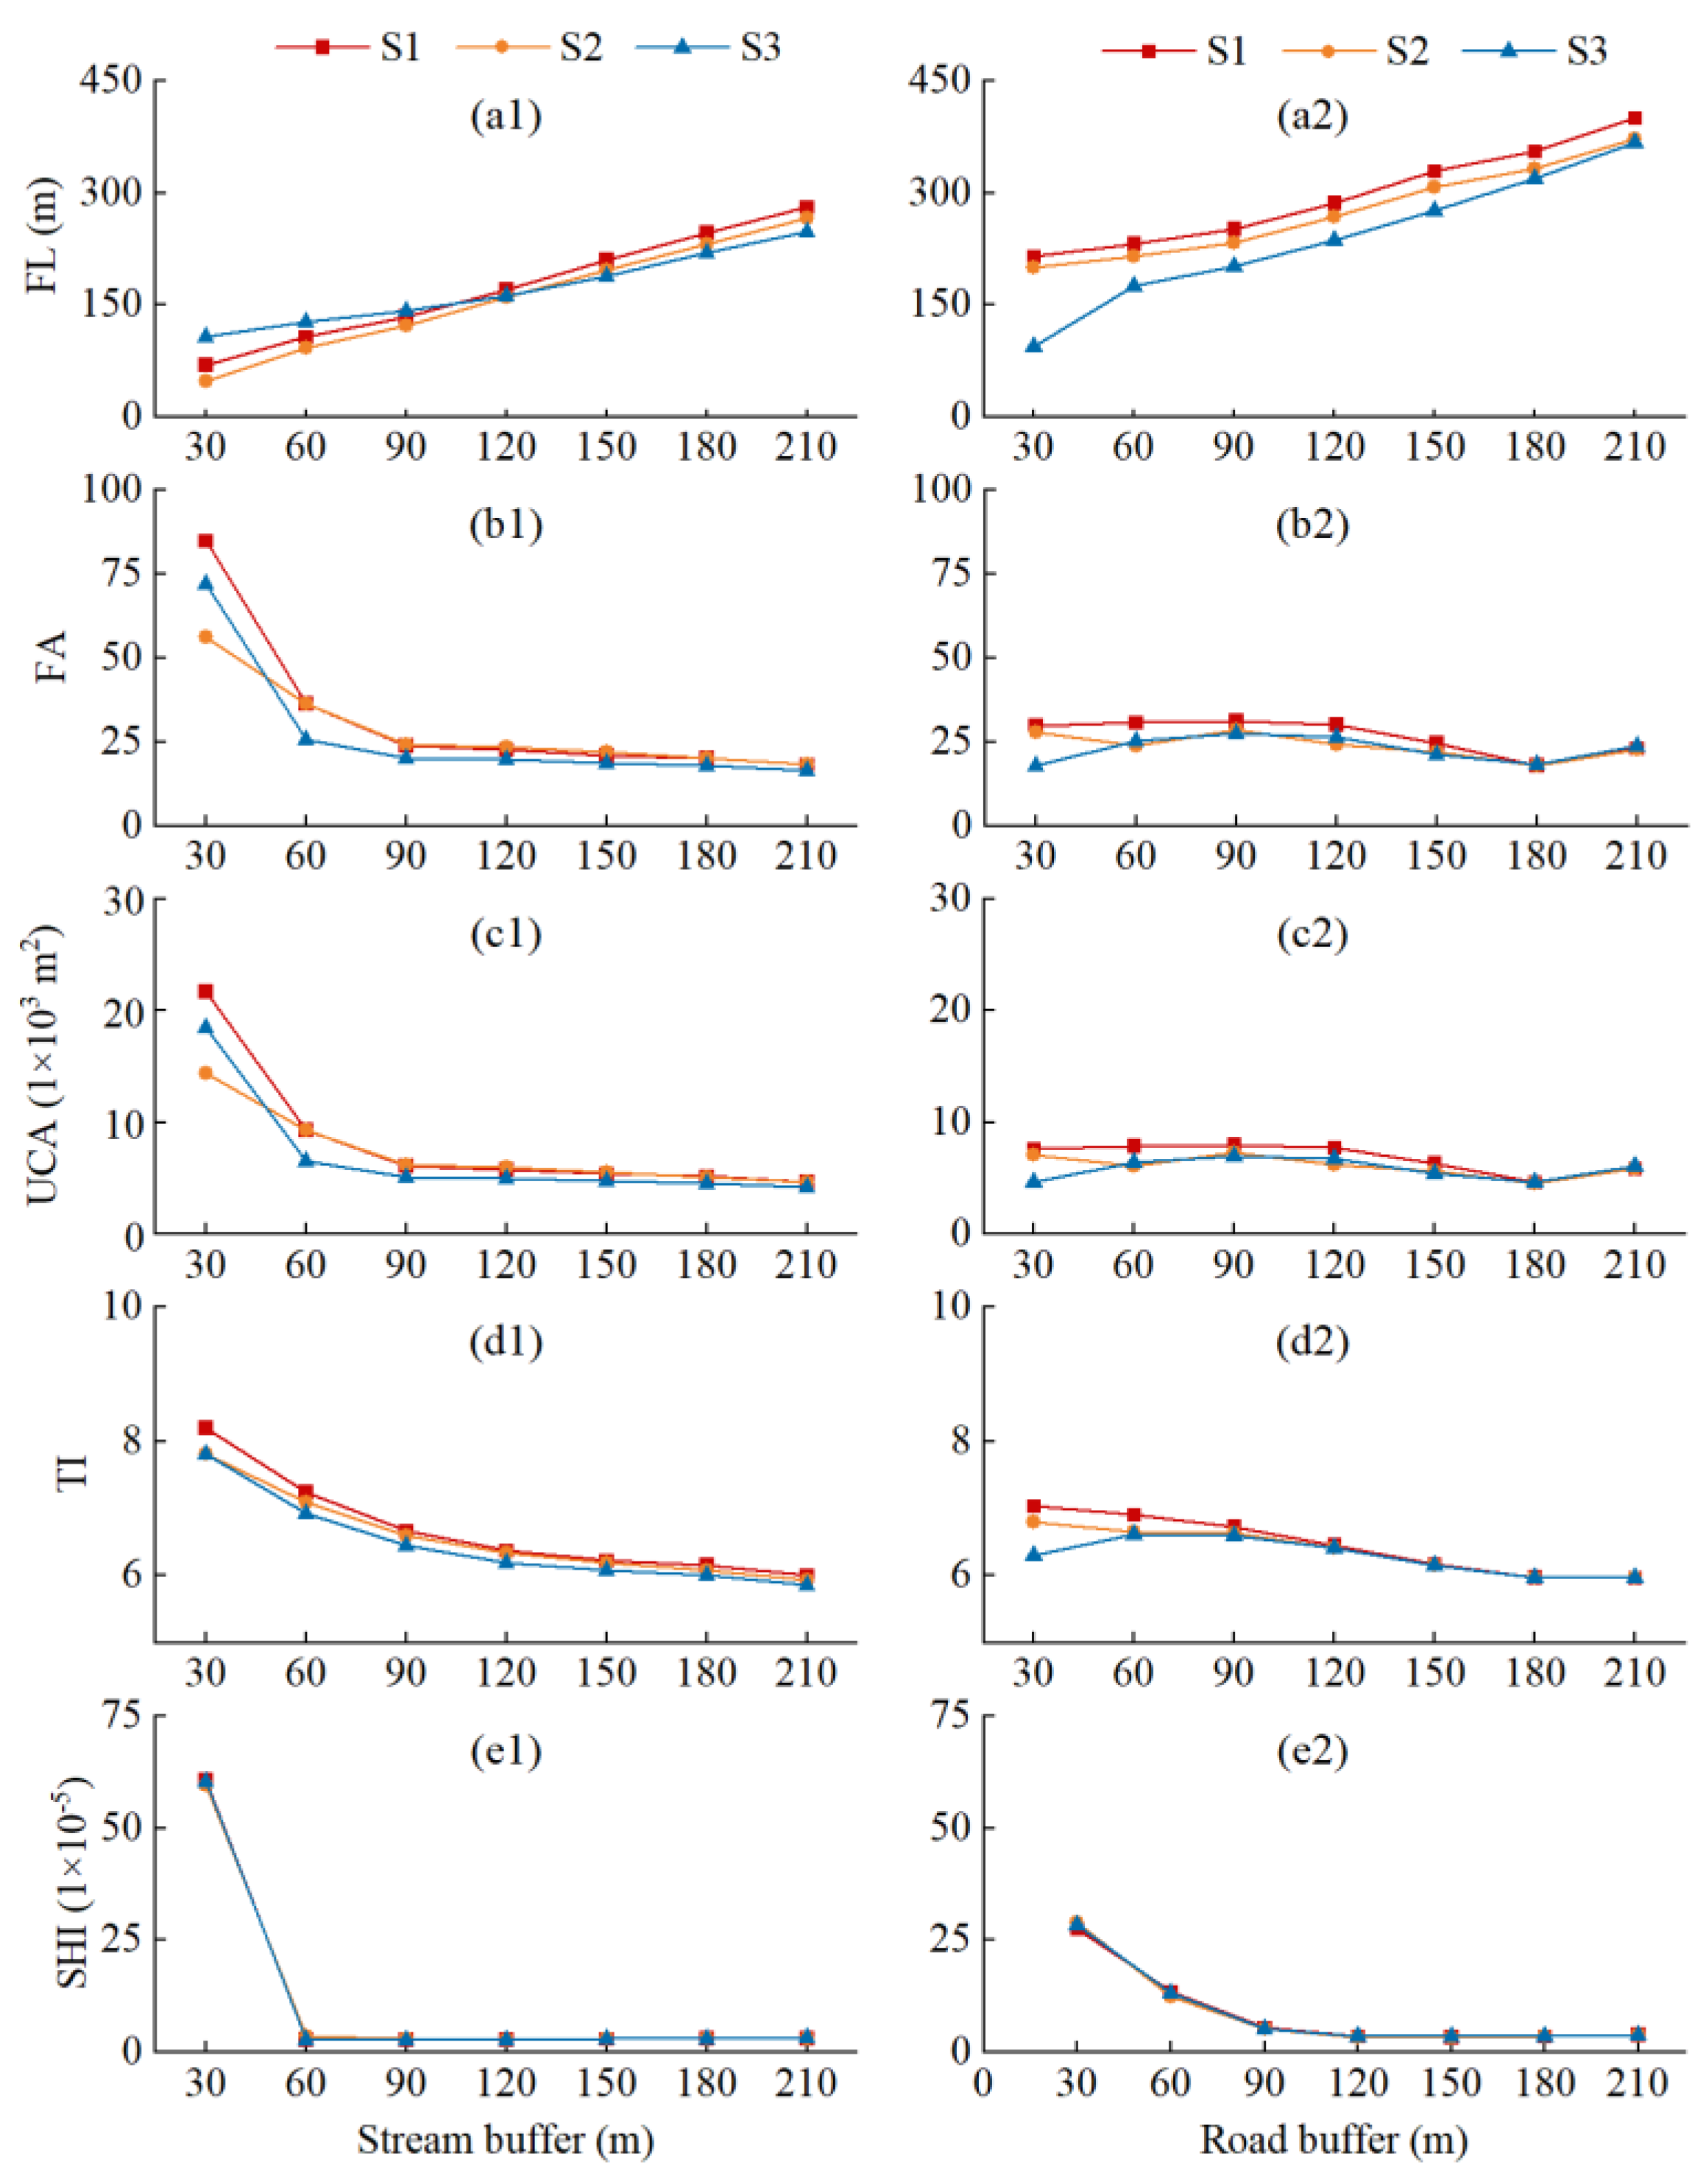
Under the three scenarios, flow length (FL) gradually increases with the increasing distance to a stream or road (Figure 3(a1–a3) and Figure 4(a1,a2)), which indicates that the farther away from the stream or road, the lower the potential for sediment-loaded runoff to reach the stream (sink). When considering the road as the transmission pathways of sediment-loaded runoff (S2), the FL in each buffer zone of a stream or road is lower than that of S1, indicating that roads can shorten the travel distance of sediment-loaded runoff from a hillslope to a stream (sink) by changing its transmission direction. When considering the road as the sink of sediment-loaded runoff (S3), the road significantly shortens the distance from upper hillslope to sink (road and stream), but the influence of the road on the FL of sediment-loaded runoff gradually decreases with increasing distance to the road (Figure 4(a2)). On the contrary, affected by the average distance between the road and stream, the FL in the 0-90 m stream buffer zones in S3 is higher than that in S1 and S2, but the FL in the 120-210 m stream buffer zones in S3 is lower than that in S1 and S2 (Figure 4(a1)).
The upslope contribution area (UCA) has similar spatial variation with FA (Figure 3(b1–b3,c1–c3)). The higher values of FA and UCA are mostly distributed near the streams and roads. With increasing distance to the streams, FA and UCA in the three scenarios both show a gradual downward trend. Meanwhile, at the 90 m stream buffer zones, FA and UCA both appear reach a point in the downward trend, after which the downward trends tend to be gentle in all the three scenarios (Figure 4(b1,c1)). With increasing distance from a stream, the impact of roads on both the accumulation of sediment-loaded runoff and the area contributed by the upper hillslope gradually decreases. With increasing distance to a road, FA and UCA are generally stable, and the trends are relatively consistent under each scenario, with the largest value occurring in S1 (Figure 4(b2,c2)). This means that the presence (intercepting effect) of roads leads to a reduction in FA and UCA, both when considering roads as transmission pathways or when considering roads as sinks as the streams. Specifically, when considering the roads as sinks (S3), the roads have a greater impact on FA and UCA than the other scenarios. However, regarding the impact of roads (intercepting effect) on FA and UCA, there is a certain threshold (180 m), beyond which the influence of roads on FA and UCA gradually weakens. The topographic index (TI) shows similar spatial distribution with FA and UCA (Figure 3(d1–d3)). The higher values of the TI are mostly distributed along the streams, while TI gradually decreases with increasing distance from streams (Figure 4(d1,d2)).
The SHI describes the accessibility of a hillslope node to the catchment outlet. Under different scenarios, accessibility changes in the same way with increasing distance to streams and roads. There is little difference among the three scenarios (Figure 4(e1,e2)). In S1, the low value of SHI (high accessibility) on the hillslope is mainly concentrated on the hillside near the outlet of the catchment (Figure 3(e1)). With increasing distance to the catchment outlet, SHI increases gradually, and namely, the accessibility decreases gradually. When considering the roads as the transmission pathway or sink for sediment-loaded runoff (S2 and S3) (Figure 3(e2,e3)), although the change in accessibility from upstream to downstream is similar to that of S1, SHI values of the transmission pathway or sink in the catchment increased. This indicates that the roads can increase the accessibility of the hillslope sediment to the downstream. As the distance to stream and road increases, the accessibility in S1, S2, and S3 showed a rapid downward trend, with a turning point occurring at the 60 m and 120 m buffer zones for streams and roads, respectively. Beyond the turning point, the accessibility of each scenario tends to be stable, indicating that the influence of streams and roads on the accessibility of the upslope sediment weakens gradually and tends to be stable with increasing distance.

3.2. Response of Sediment Connectivity to Forest Roads

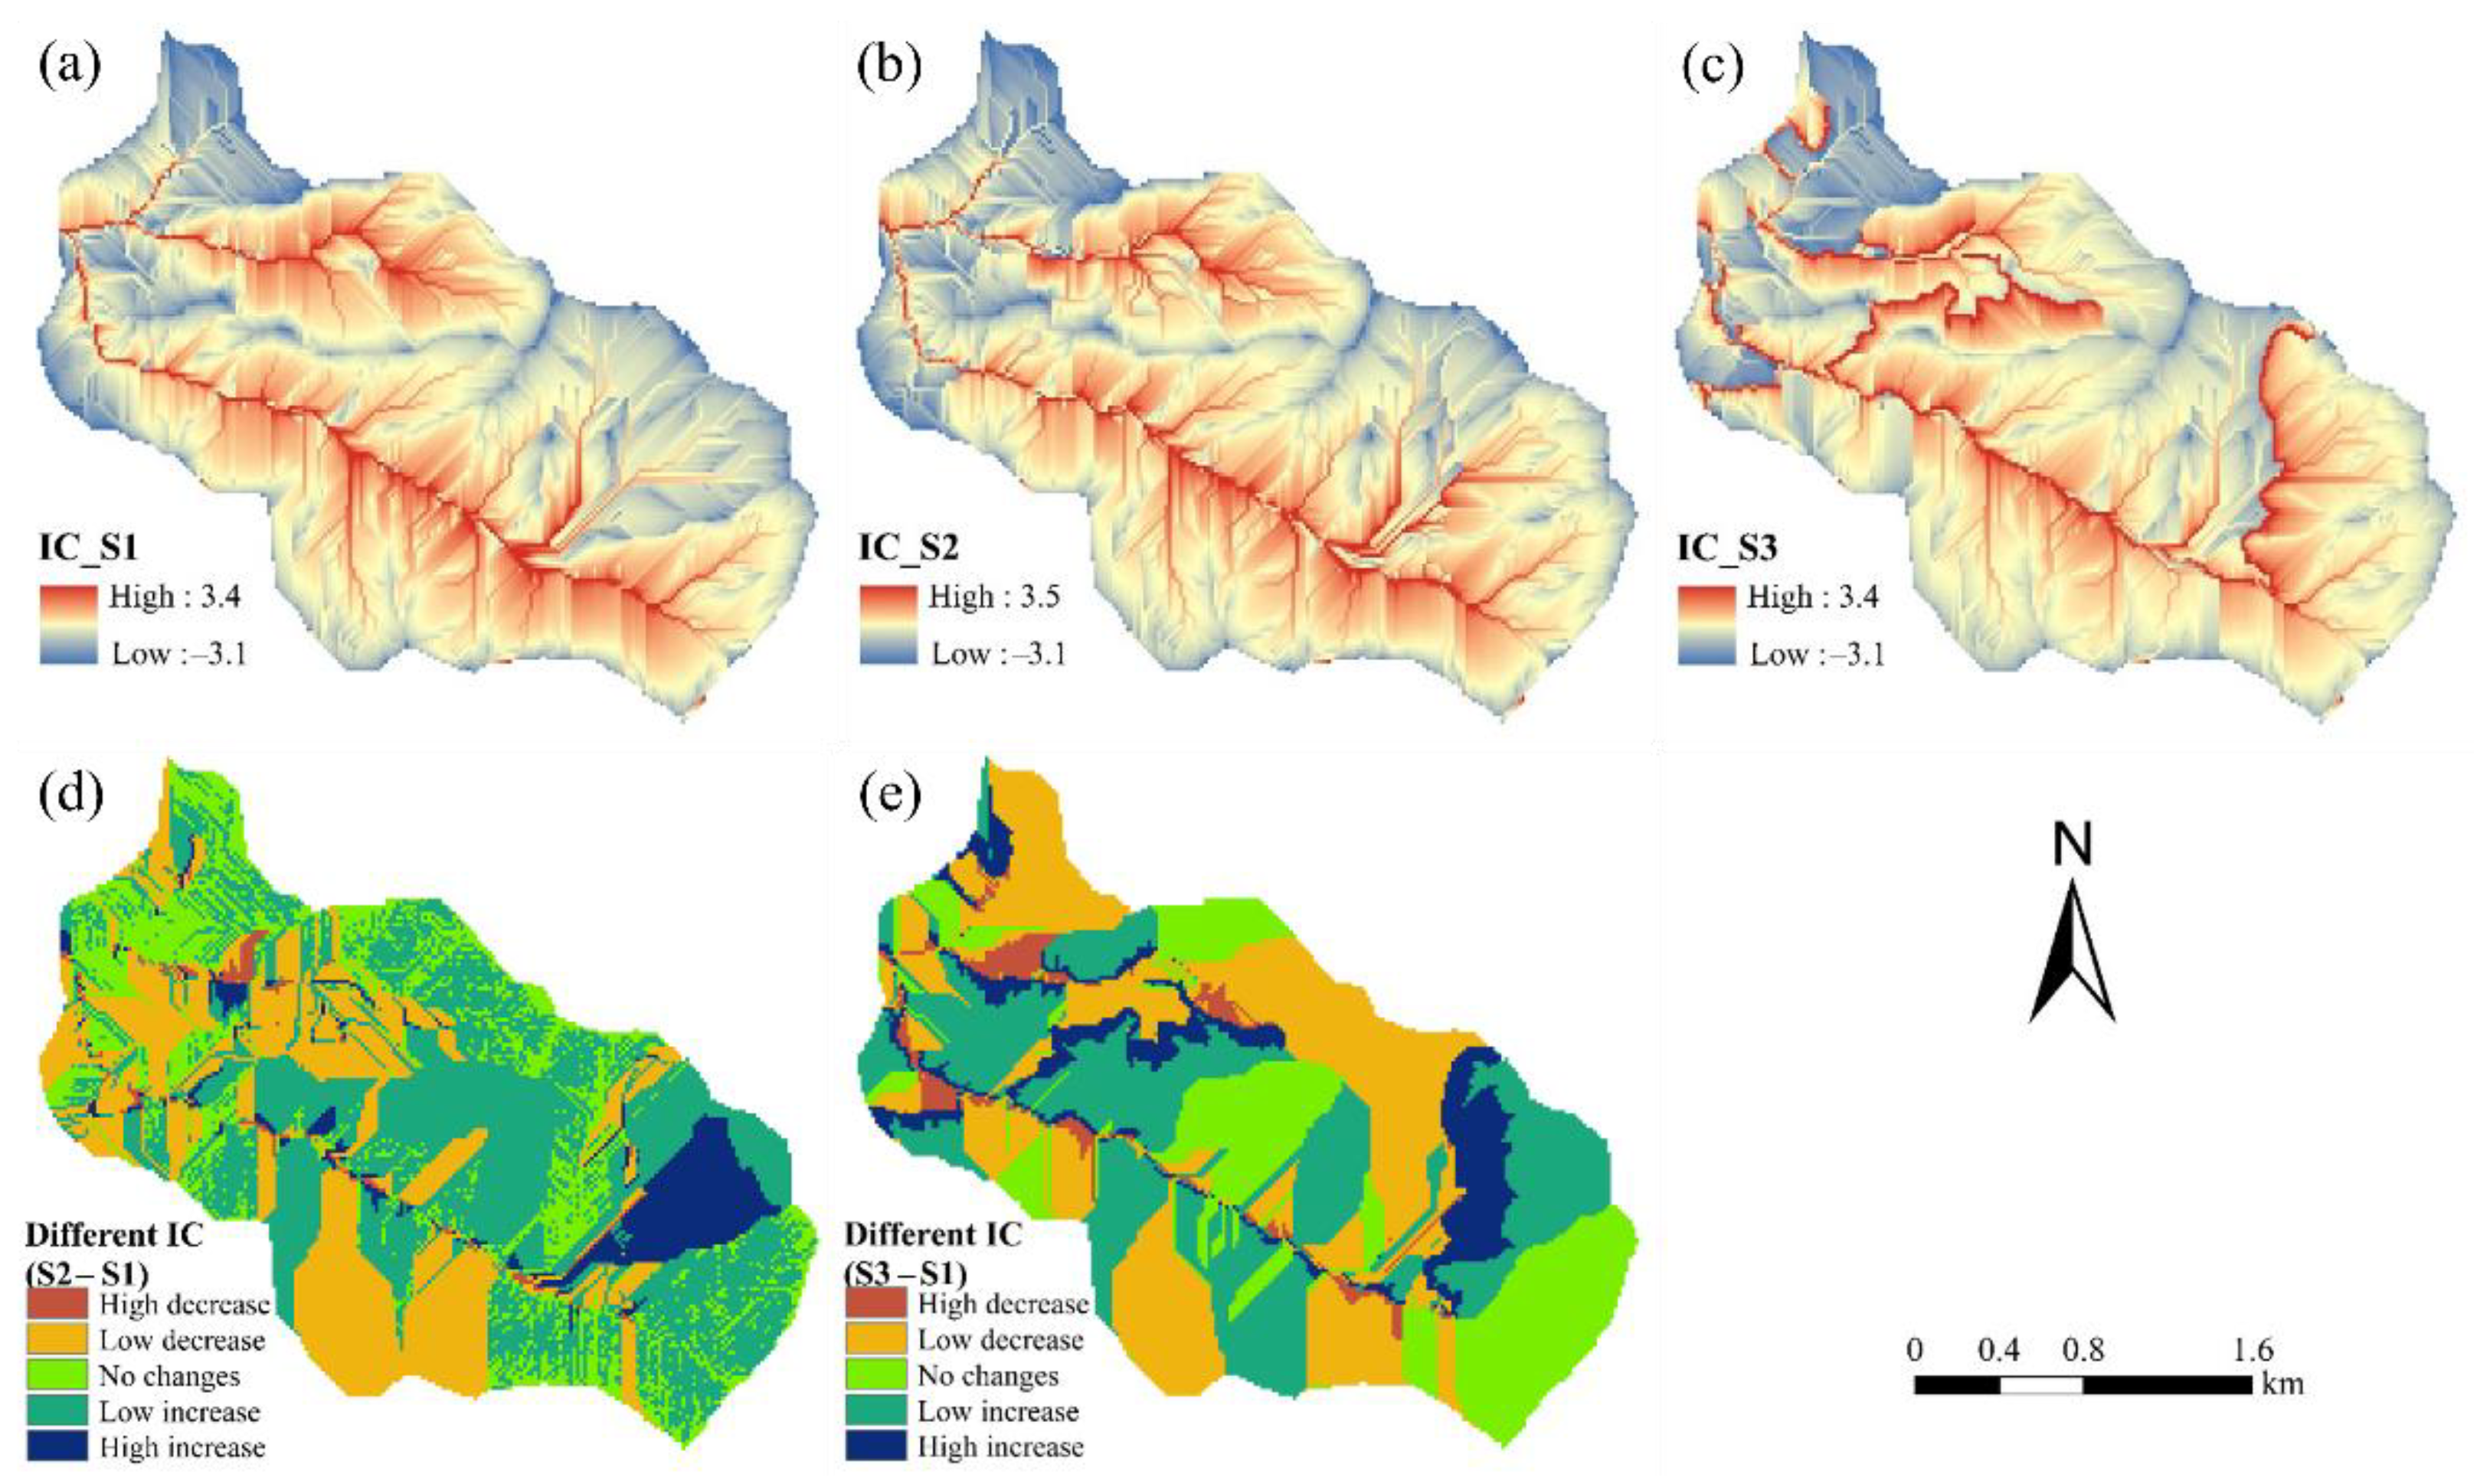
Under the three scenarios, IC ranges from −1.7 to 5.0 with a mean value of 1.02, 1.04, and 1.12 in S1, S2, and S3, respectively. When no consideration is given to the role of roads as shown in S1 (Figure 5a), high values of IC are generally distributed along the streams. By contrast, when consideration is given to the role of roads as pathways (S2, Figure 5b), the high values of IC are still distributed along the streams, while IC values along the roads increase. When considering the road as a sink for the sediment-loaded runoff (S3, Figure 5c), the higher IC values are mainly distributed along the roads, particularly in the upper hillslope intercepting roads in the upstream area (Figure 5d,e). By contrast, the IC value shows a decreasing trend with the transversally downward hillslope of roads. This indicates that, when considering roads as pathways or sinks for sediment-loaded runoff, the IC value is increased, especially in the upper hillslope areas intercepting roads.
To further confirm the correlation between IC and roads and streams, variations in IC with distance to roads, streams, and road–stream crossings were analyzed (Figure 6). The results show that, with increasing distance to streams, IC values under the three scenarios decreased, but with different characteristics. Within the 0–60 m stream buffer zone, IC of S1 and S2 is much higher than that of S3, while it is lower than that of S3 in the 60–210 m stream buffer zones (Figure 6a). This shows that, when roads are considered as the pathways of sediment-loaded runoff, roads have less influence on IC within each stream buffer zone, as the IC values are close to those when not considering roads. However, when considering roads as sinks of sediment-loaded runoff, the impact of roads on IC within different stream buffer zones is more obvious, as roads reduce the IC value in the area close to the stream (0–60 m) and increase the IC value in the area farther from the stream (60–210 m).
The IC decreases gradually with increasing distance from a road in the three scenarios, and the IC value of S3 was always higher than that of S1 and S2 (Figure 6b). However, in different road buffer zones, the decreasing trend in IC under each scenario varies. Specifically, the IC values and the decreasing ratio of IC in the 0–60 m road buffer zones of S3 are greater than those of S1 and S2, while the magnitude and change ratio of IC tend to be consistent under the three scenarios. This shows, to some extent, that when considering a road as the transmission pathway, roads have less influence on IC within different road buffer zones. By contrast, when considering roads as the sinks of sediment-loaded runoff, the IC within different road buffer zones increases, especially in the 0–60 m range. Meanwhile, the influence of roads on the IC may reach a certain threshold, beyond which the effects on the IC will gradually weaken. Within the buffer zones of the road–stream crossings, affected by both roads and streams, IC gradually decreases with increasing distance to the crossings (Figure 6c), and the difference in the downward trend in different scenarios is always small.

3.3. Spatial Relationship between Sediment Connectivity and Convergence Processes

3.3.1. Contribution of Influencing Factors to Sediment Connectivity

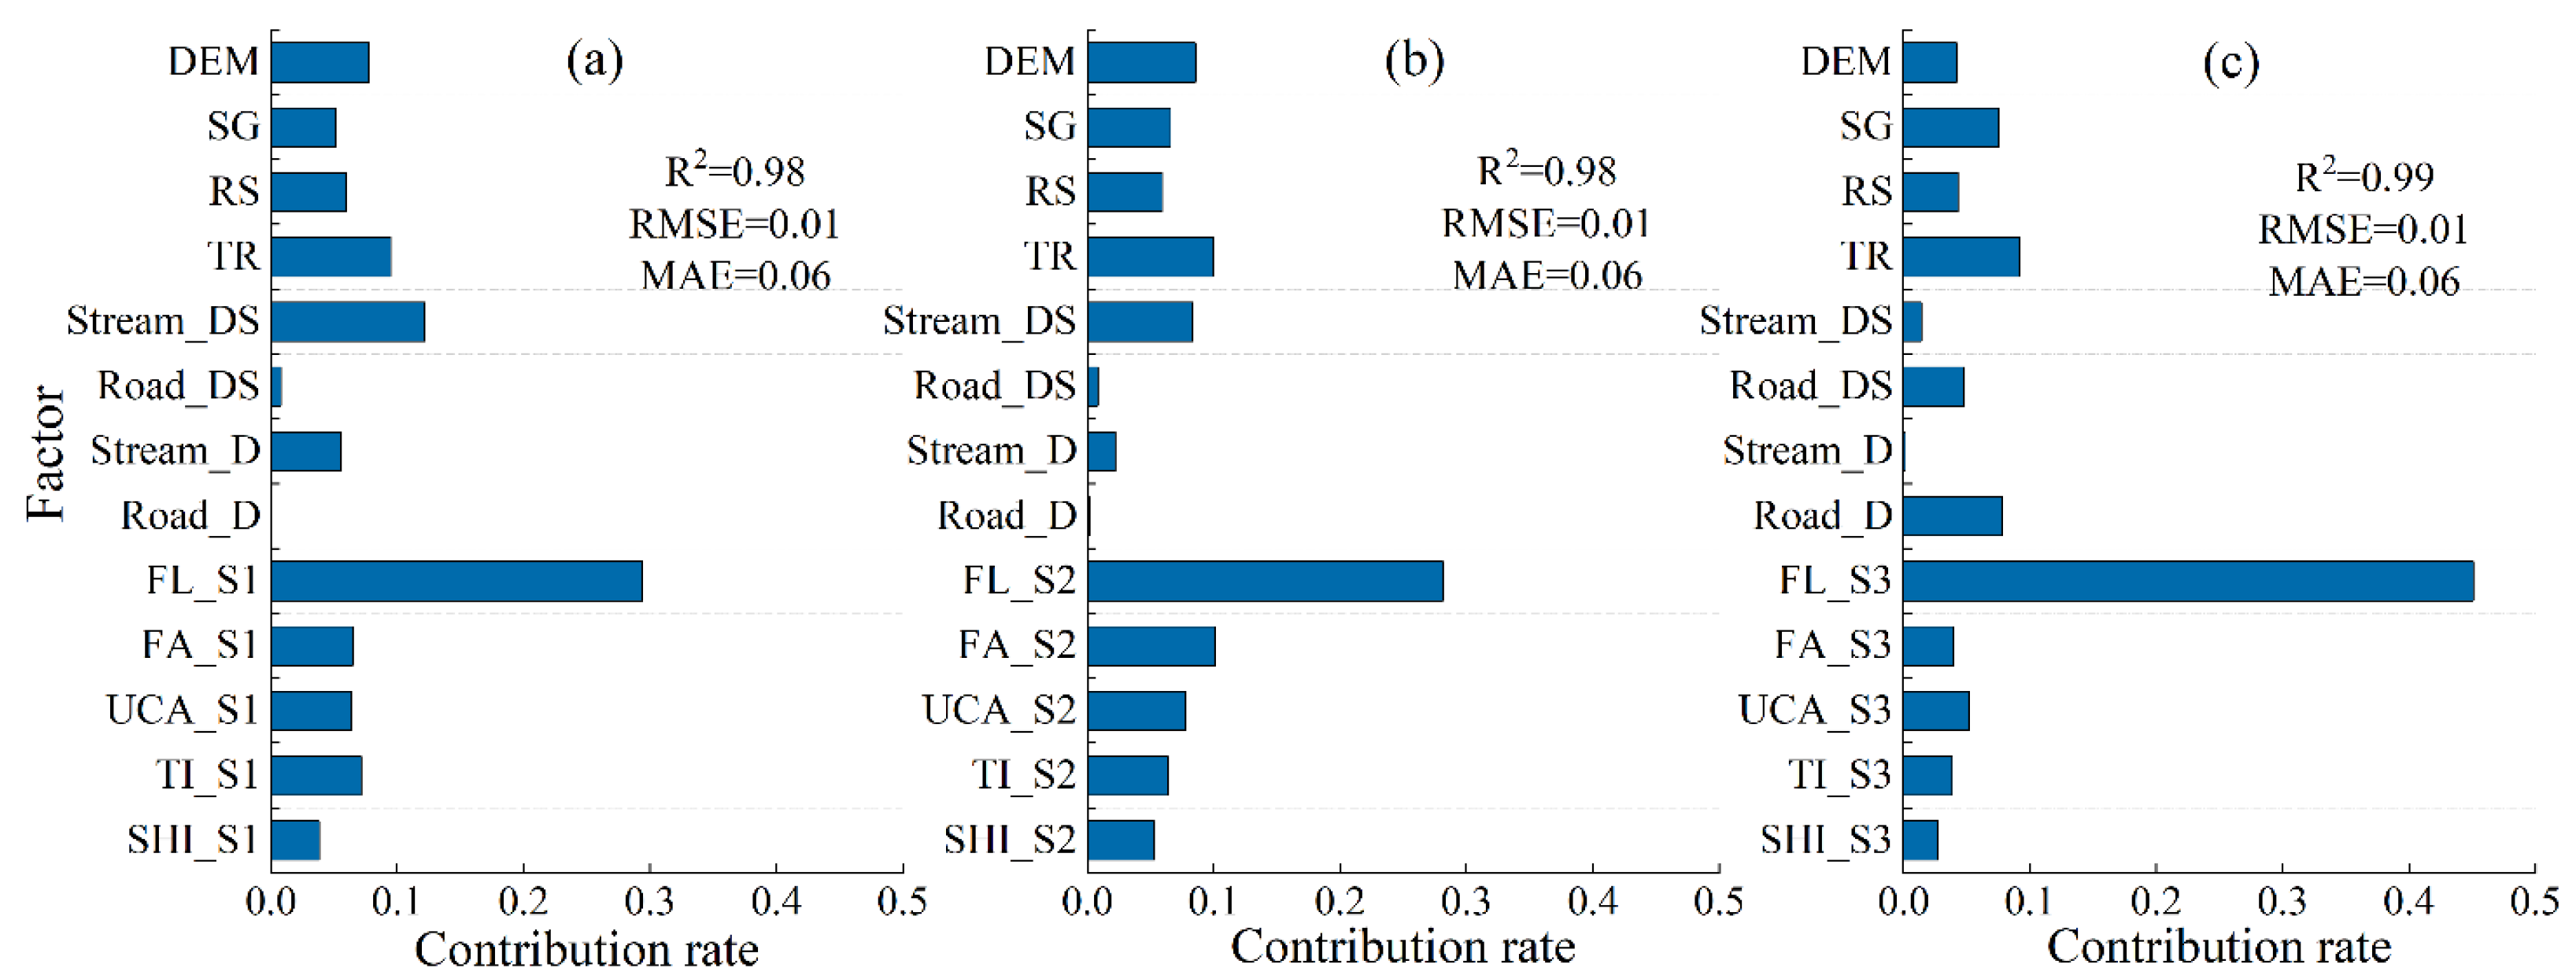
The rankings of the main factors affecting sediment connectivity (IC) distribution under different scenarios based on ERT show that FL (0.29), DS (0.12), and TR (0.09) are the most important factors influencing IC in scenario S1 (Figure 7a). When considering roads as the transmission pathways (S2, Figure 7b), FL (0.28), FA (0.10) and TR (0.10) are the most important influencing factors on IC, and the contribution rate of UCA (0.08), Road_DS (0.008) and Road_D (0.0014) increased in comparison with those in S1. When considering roads as sinks (S3, Figure 7c), FL (0.45), TR (0.09), Road_D (0.08), and Slope (0.08) are the most important influencing factors on IC. Among them, the contribution rate of FL is much higher than that of other factors. Compared with S1, the impact of Road_D and Road_DS on IC in S3 is much higher than that in S1, while the contribution rate of stream_DS (0.014) and stream_D (0.001) to IC is significantly decreased and lower than the other influencing factors. In summary, FL and TR are always the most important influencing factors and the proportion of stream_DS and stream_D in the influencing factors is obviously reduced, while Road_DS and Road_D increase when considering the influence of roads.

3.3.2. Spatial Variation in the Relationships between Sediment Connectivity and Primary Influencing Factors

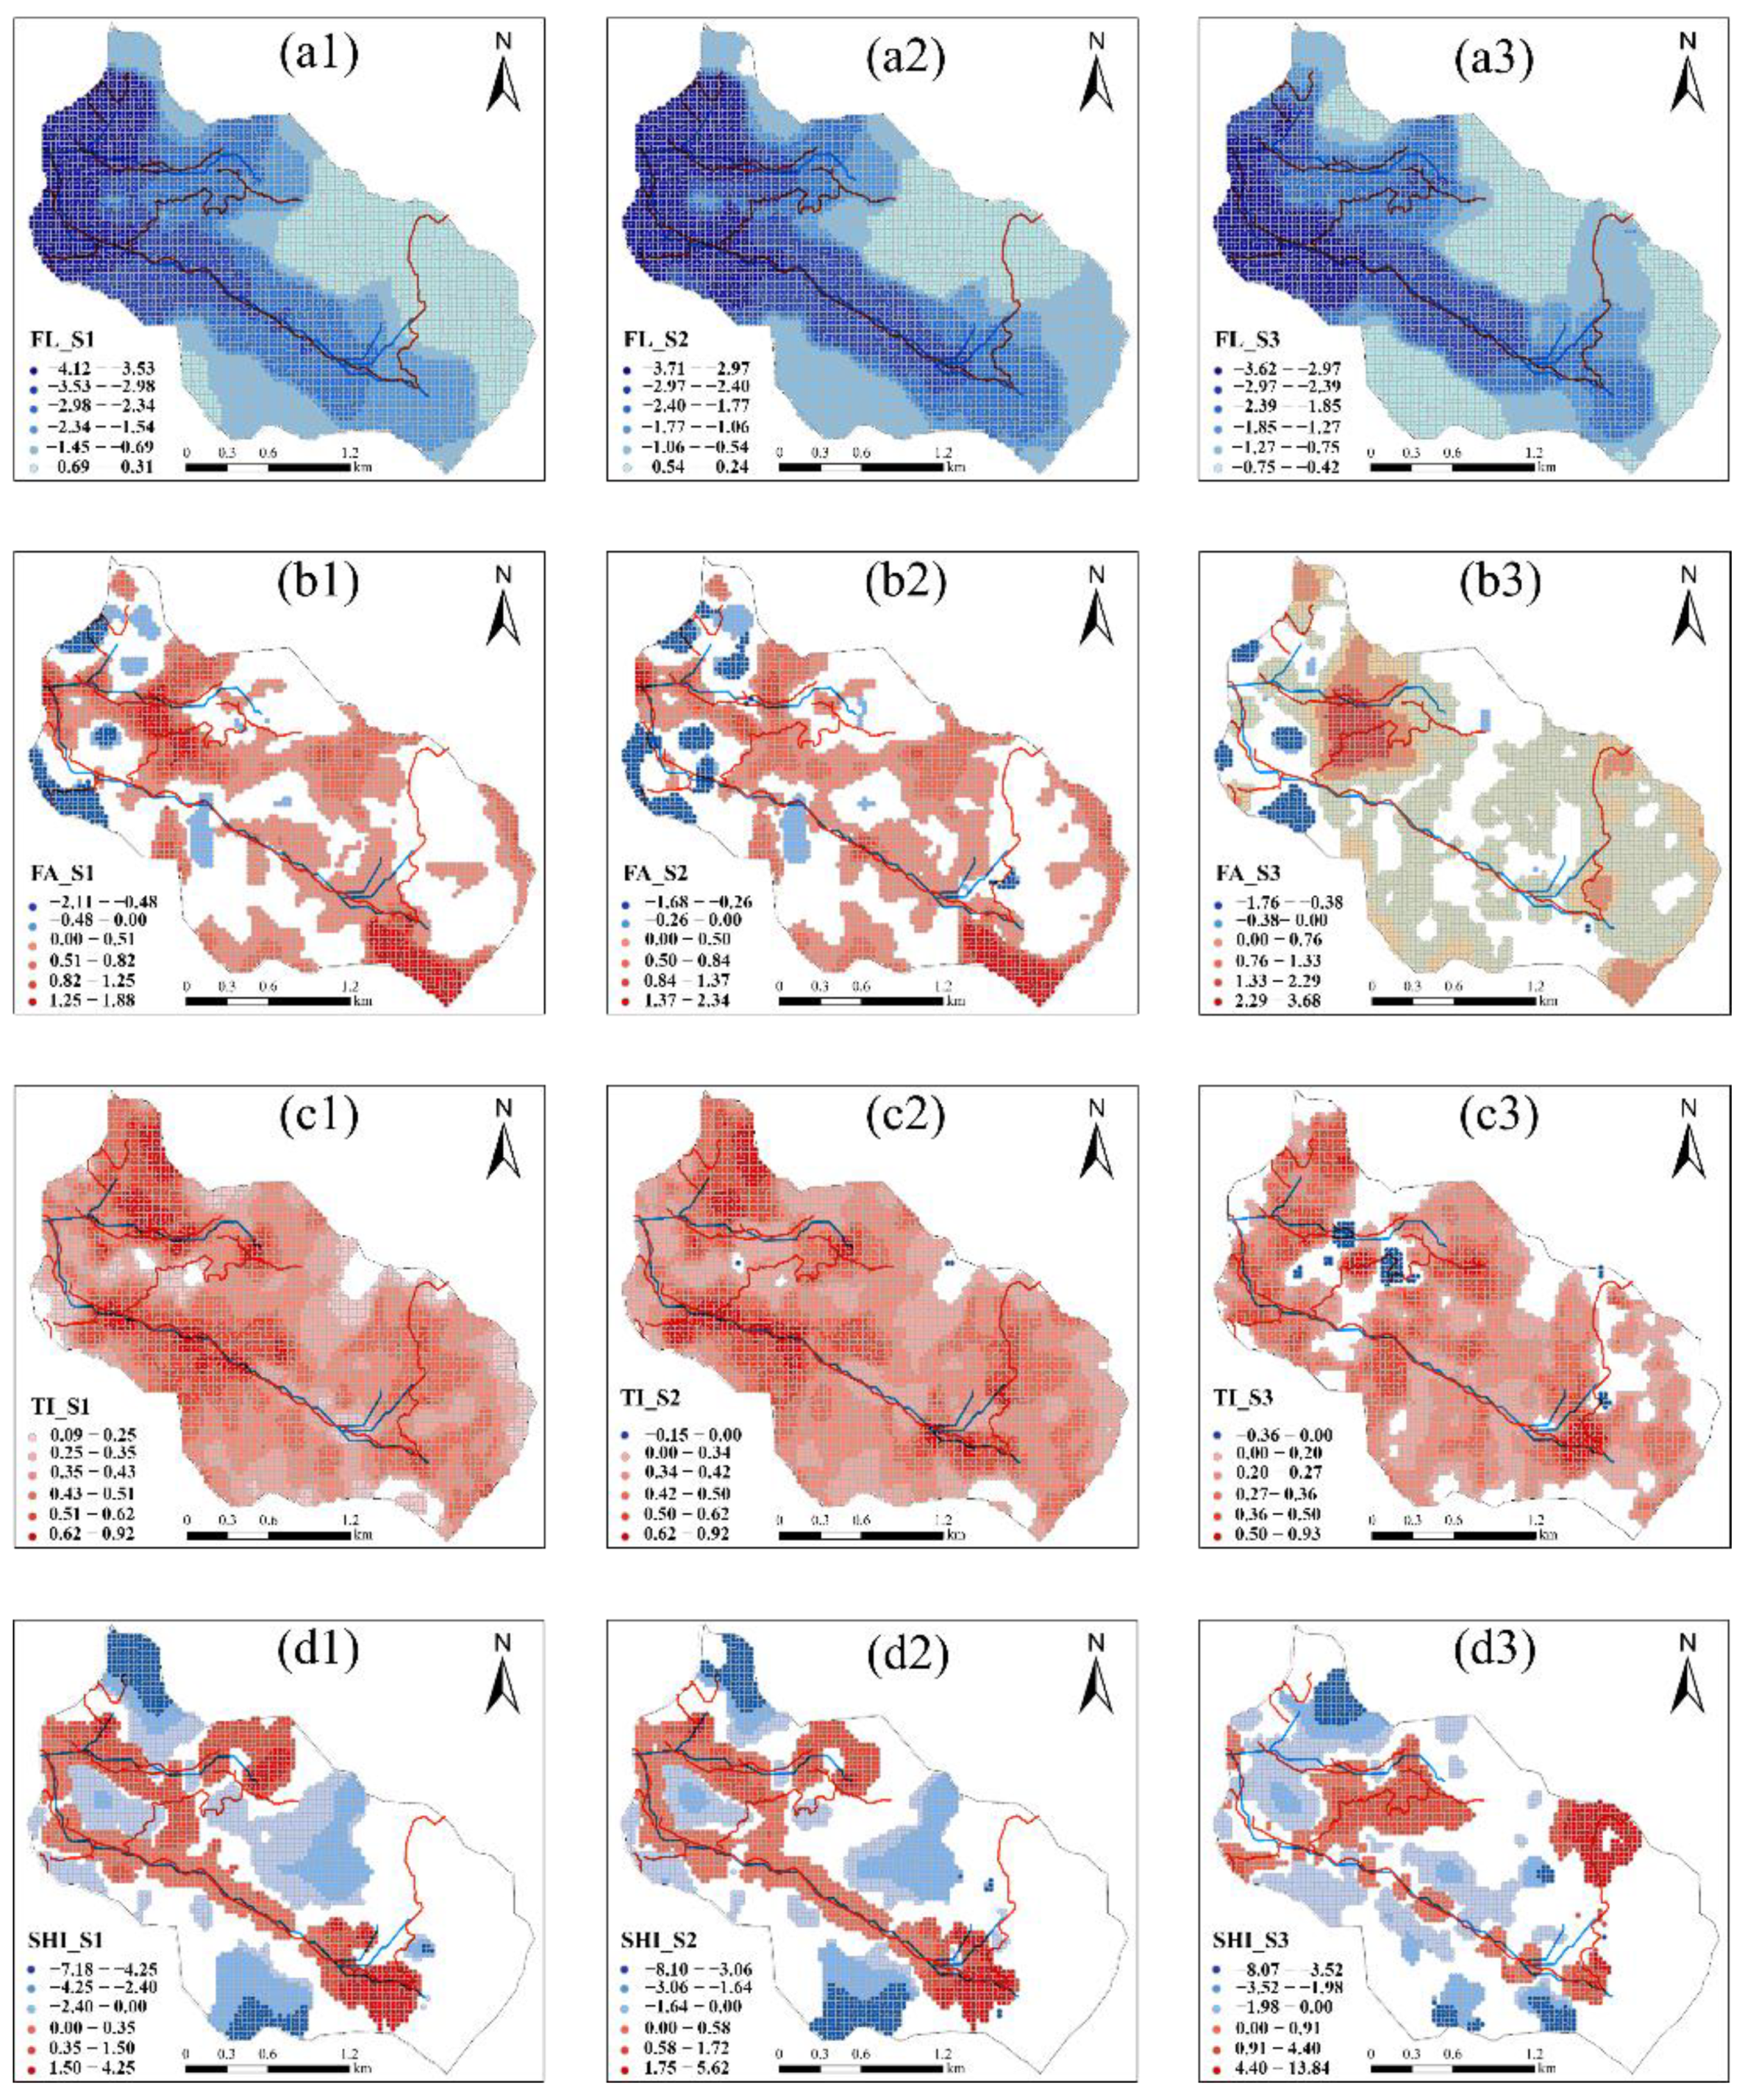
Based on MGWR, the spatial relationships between IC and the influencing factors indicates that FL significantly and negatively affects the spatial distribution of IC (Figure 8(a1–a3)). This indicates that the longer the FL, the greater the resistance encountered by the sediment during the transmission process as well as the lower the probability of reaching the sinks. The regression coefficients between FL and IC are −4.12~−0.31 (−1.97 ± 1.25), −3.71~−0.24 (−1.75 ± 1.08), and −3.62~−0.42 (−1.66 ± 0.99) in S1, S2, and S3, respectively. Meanwhile, the relationship between IC and FL increases from upstream to downstream with the highest absolute value observed at the catchment outlet. When considering the influence of roads (S2 and S3), especially when considering the road as the sink of sediment-loaded runoff (S3), the absolute values of the regression coefficients between IC and FL increase significantly with high values mostly located along the road. This indicates that under the influence of the road, the increase in FL along the road will increase the local IC, which in turn affects the spatial distribution of the IC in the catchment. In the three scenarios, the spatial relationships between FA on IC are both positive and negative. The regression coefficients between FA and IC in S1 (Figure 8(b1)), S2 (Figure 8(b2)), and S3 (Figure 8(b3)) are −2.11~1.88 (0.27 ± 0.45), −1.68~2.34 (0.24 ± 0.41), and −1.76~3.68 (0.50 ± 0.69), respectively. In general, FA positively affects IC; however, the relationship is negative at some locations close to the catchment outlet. When considering the road as the sink of sediment-loaded runoff (S3), the correlation between FA and FA is enhanced. Regarding the spatial relationships between IC and TI, the relationship is more consistently significant and positive (Figure 8(c1–c3)). The regression coefficients between IC and TI are 0.40 ± 0.14, 0.40 ± 0.14, and 0.21 ± 0.14, respectively. The regression coefficient between IC and TI in S3 is lower than those in S1 and S2, suggesting that the effects of topographic features on sediment production and sediment transport weaken under the influence of roads. Similar to FA, the relationship between SHI and IC is both positive and negative (Figure 8(d1–d3)). In the three scenarios, the regression coefficients between IC and SHI are −7.18~4.25 (−0.69 ± 1.92), −8.10~5.62 (−0.69 ± 1.53), and −8.07~13.84 (−0.57 ± 2.34), respectively. The positive values mainly occurred along the stream and road, while the negative values were mainly distributed on hillslopes. This means higher accessibility will lead to a greater IC.
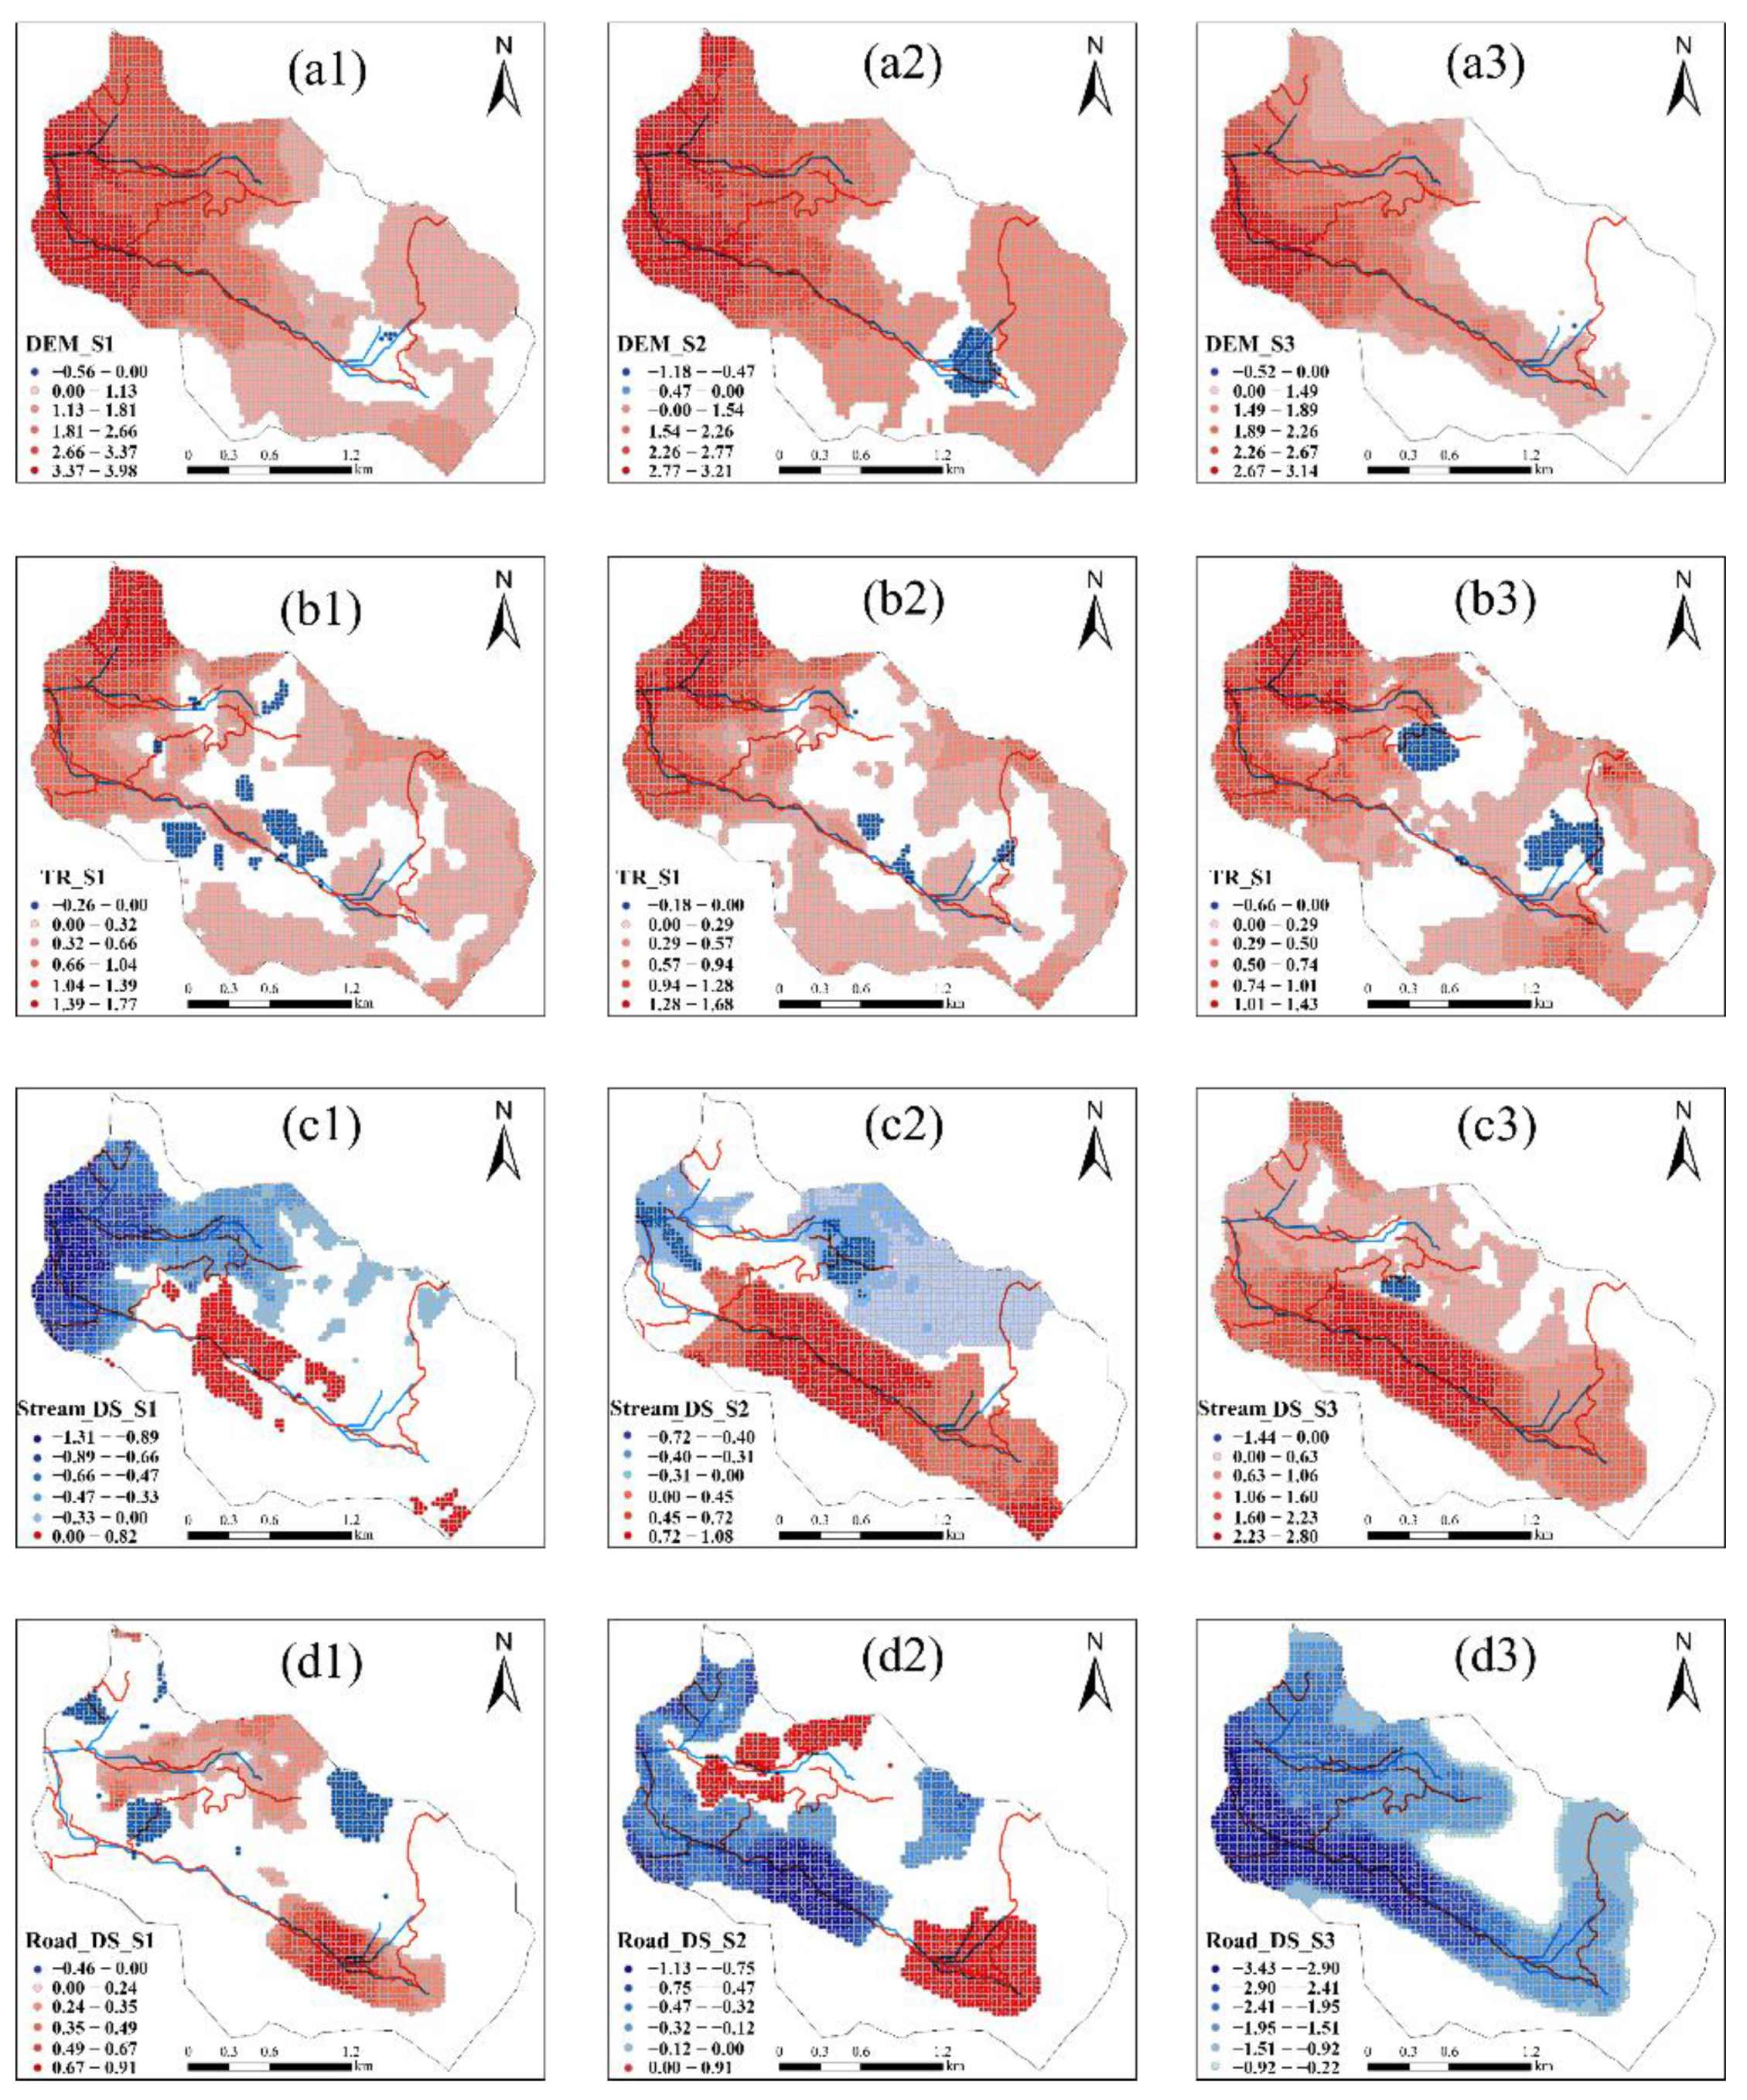
Figure 9 shows the spatial variation in the influences of terrain and spatial proximity characteristics on IC. The influences of elevation and TR on IC are mainly positive and dramatically decrease from upslope to downstream. The regression coefficients between elevation and IC in S1 (Figure 9(a1)), S2 (Figure 9(a2)), and S3 (Figure 9(a3)) are −0.56~3.98 (1.53 ± 1.31), −1.18~3.21 (1.36 ± 1.10), and −0.52~3.14 (1.10 ± 0.93), respectively. For TR and IC, the regression coefficients in S1 (Figure 9(b1)), S2 (Figure 9(b2)), and S3 (Figure 9(b3)) are −0.26~1.77 (0.35 ± 0.45), −0.18~1.68 (0.38 ± 0.45), and −0.66~1.43 (0.35 ± 0.37), respectively. The regression coefficients between elevation and TR on IC decrease from S1 to S3, indicating that the effects of elevation and TR on IC are lowered or reversed under the impacts on roads.
Without considering the influence of roads, the streams act as sinks of sediment-loaded runoff, and the IC is negatively correlated with the distance to stream (−0.12 ± 0.40) (Figure 9(c1)). When considering the road’s impact, the relationships between IC and distance to stream are both positive and negative. This indicates that the presence of roads may disturb the natural distribution of IC along the stream. The regression coefficients of IC and distance to stream in S2 (Figure 9(c2)) and S3 (Figure 9(c3)) were −0.72~1.08 (0.14 ± 0.41) and −1.44~2.80 (0.85 ± 0.85), respectively. Meanwhile, within a certain range on both sides of the stream, IC is positively correlated with the distance to the stream, which is most obvious in S3.
The spatial relationships between IC and distance to road were mainly positive (0.26 ± 0.26) (S1, Figure 9(d1)), indicating that the spatial distribution of IC was less determined by roads than streams or that there was no significant relationship between the spatial distribution of IC and roads, because a positive relationship is unreasonable and inconsistent with common sense. By contrast, when considering roads as transmission pathways (S2, Figure 9(d2)) or considering roads as sinks for the streams (S3, Figure 9(d3)), their relationship is reversed and mainly negative (S2: −0.14 ± 0.35; S3: −1.35 ± 1.14). Moreover, the absolute value of the regression coefficients in S3 is much greater than those in S1 and S2, which further indicates that roads significantly affect the spatial distribution of IC, particularly when considering the roads as the sink of sediment-loaded runoff.

4. Discussion

4.1. Convergence Processes Altered by Forest Roads

Roads are an important interference that cause sediment transport to redirect in mountainous catchments [1]. As a unique land use type, roads impact the soil and hydrological characteristics of the underlying surface which not only aggravates soil erosion, but also significantly changes the transport process of water and sediment [8,9,10]. The degree and mode of roads influence on water and sediment transport are related both to the type and spatial distribution of roads and to the spatial relationship between roads and streams [27]. When the roads and the sediment transmission direction are inconsistent, the road can collect runoff and sediment by intercepting sediment originating from uphill. Meanwhile, roads’ low permeability or infiltration rate make the road act as a flow path that transmits the sediment-loaded runoff that the road originally generated and intercepted from the uphill along the downward direction of the road. As one common way of transmitting runoff and sediment downstream of the road, the road drainage outlet will significantly increase the runoff and sediment content in the downhill direction [17,51]. As a result, the existence of the road not only affects the length of the confluence path, but also the confluence accumulation between the transport path and the stream, thereby changing the spatial distribution of the confluence accumulation in the catchment [26,28]. This phenomenon was further confirmed in this study. Through the comparison of different scenarios, this study found that, when considering the road as the transmission pathways or sinks, the FL and FA of sediment-loaded runoff on the upper hillslopes will be significantly reduced, while FA will significantly increase at the downhill outlet or road–stream crossings. This is mainly because the sediment transported downstream from the road drainage outlet includes not only the sediment produced by the road itself, but also the sediment from the uphill catchment area of the road segment [43,52]. Consequently, when considering the effects of roads on the flow direction of the sediment-loaded runoff, the changes in the pathways’ length and flow accumulation along the roads will affect the confluence process of the entire catchment. These findings can provide a basis for managing road erosion in mountainous catchments.
In addition to FL and FA, the UCA of a stream could be intercepted by roads; thus, the spatial location of roads will alter the confluence pathways of sediment-loaded runoff [53]. This study showed that, like the FA, the presence of roads (intercepting effect) leads to a reduction in the UCA, both when roads are considered as transmission pathways and as sinks. When considering the roads as sinks, roads have a greater impact on the UCA. However, the effect of roads on UCA will not always be significant, and there is a certain threshold beyond which the interception effects of roads are diminished [52,54,55,56,57]. In this study, the influence of roads on FA and UCA may be effective in the 180 m buffer zones, which is consistent with Marcantonio et al. [55] who found that the effect of roads was observed up to 200 m into the forest, and Jing et al. [58] who reported that the effect of roads on improving sediment delivery rates and IC gradually diminished beyond a threshold of 150 m. It is worth noting that we did not try to identify a specific threshold for the effect of roads on these specific processes, given that they are complex processes that are controlled by a wide range of factors, including not only the road itself but also the topography, soil, vegetation, rainfall, and land use at different spatial and temporal scales [55,56,57]. Additionally, the response of different factors to road networks should vary [51,54]; however, to date, little research has focused on the influence of particular distance thresholds on confluence processes. This study provides a good opportunity to explore the influencing threshold of roads on confluence characteristics, particularly for forest roads in mountainous catchment.
Topography is an important factor affecting sediment transport from hillslope (source) to stream (sink) in a watershed. In this study, the topographic index (TI) has a similar variation pattern in spatial distribution to FA and UCA. Specifically, the closer to the road, the more sensitive the FA and TI are to the response of the road, which is not surprising considering that roads are one of the main anthropogenic disturbances or drivers of topographic changes in forest-covered mountainous catchments [52,59]. This finding is consistent with previous research [53]. In addition, roads can increase the sediment transport capacity of the catchment by connecting the originally independent sediment nodes [33]. In particular, the road–stream crossings enable the sediment-loaded runoff collected by roads to directly transmit to the stream at the intersection [3], which not only connects the stream network to more sediment transport nodes, but also makes the sediment transport nodes in the sediment cascade networks more connected [8], thus increasing the accessibility of the sediment-loaded runoff, and improving the possibility of transporting sediment-loaded runoff from the hillslope to the outlet of the catchment [60]. However, the impact of roads on sediment-loaded runoff accessibility peaks at a certain threshold, beyond which the impact of roads on accessibility will gradually weaken and then stabilize. This further demonstrates that the influence of roads on the confluence process is effective within a certain range.

4.2. Sediment Connectivity in Response to Forest Roads

The sediment transmission efficiency along a road is significantly higher than that of the surrounding undisturbed hillslopes, which is likely due to the channel-like characteristics of the roads [14]. Sediment collected by roads can be transported to streams through drain outlets or road–stream crossings, thus significantly affecting the spatial distribution of the IC in mountainous catchments [14,16]. When calculating the IC in the Xiangchagou catchment of this study, roads were considered transmission pathways or sinks for the sediment-loaded runoff based on the way roads alter flow direction. The results show that IC generally decreases with increasing distance from the road or stream. When considering the roads as transmission pathways or sinks, the IC declined differently with increasing distance from the road. When considering the road as the transmission pathways, the IC near the road (within 90 m) is lower than that without considering the influence of roads, while the IC on the hillslope (90–210 m) farther from the road is higher than that without considering the influence of the road. This indicates that the transmission distance of sediment-loaded runoff to the sink (stream) may be extended when the road is taken as the transmission pathways. This result is likely related to the spatial distribution (approximately parallel) of roads and streams [27,51,58], which cause the sediment-loaded runoff to be transported along the road after altering direction, and thus extending the pathway length prior to entering the sink (steam) [13]. However, on a larger scale such as the entire catchment, roads are an efficient transport pathway for sediment-loaded runoff, resulting in higher IC in a larger range (>90 m) farther from the road than that without considering the impact of roads. This is consistent with previous studies [41]. Moreover, when considering the road as a sink, the IC value near the road (60 m) is significantly higher than the values when the road is not considered or when the road is considered as the transmission pathways, indicating that considering the road as a sink of sediment-loaded runoff has a greater impact on IC.

4.3. Relationship between Sediment Connectivity and Environmental Factors Associated with Forest Roads

The impact of roads on IC is not only related to the effect of roads acting as sediment transport pathways on the efficiency of transporting sediment, but also closely related to the confluence process of the catchments [52]. The altered pathways and confluence process significantly influence the erosion and transport processes of sediment [5,6,52]. Using ERT and MGWR, this study further verified this phenomenon. The contribution of FL and UCA to IC increased (based on ERT) from S1 to S3, and the negative effect of FL on IC and the positive effect of FA on IC both became more significant after considering roads (based on MGWR). In addition, this study further indicated that roads and streams acting as pathways and sinks of sediment-loaded runoff can be connected to most sediment nodes in the catchment, thereby increasing the sediment on the hillslope’s access to the sink or catchment outlet [60], leading to a positive correlation between accessibility and IC.
Roads change the spatial distribution of sediment connectivity in catchments by altering the spatial distribution of the confluence characteristics [51]. This study further confirmed this phenomenon. In the Xiangchagou catchment, changes in the direction of sediment-loaded runoff significantly reduces the FL along the road, which, in turn, significantly increases IC. Particularly, at the drain outlet of the road and road–stream crossings, the sediment-loaded runoff transported by the road can efficiently merge into the streams [12], which strongly changes the natural processes and sediment transport efficiency of the catchment [31]. Using MGWR, this study found that FA is significantly positively correlated with the spatial distribution of IC, and this correlation increases significantly from S1 to S3. Therefore, the presence of roads plays an important role in changing the transport direction and FA of sediment-loaded runoff through intercepting effects and expanding the transmission path in the catchment [8,10]. Furthermore, the presence of roads will reconstruct the transport mechanism of the sediment-loaded runoff from the hillslope to the stream [8,10], thereby changing the spatial distribution of sediment connectivity.
In addition to the transport pathways and confluence process of the catchment, the terrain and spatial proximity characteristics of roads and streams were also significantly correlated with IC. Relevant studies have shown that TR should be an important factor affecting the transport efficiency of sediment-loaded runoff [7,61] by altering the velocity and erosion–deposition processes [41], and thus influencing the transport processes [52,59]. This is likely related to the fact that the transmission efficiency (distance) will be higher (farther) as slope and flow velocity increase, while the transmission efficiency (distance) will be lower (shorter) as relief degree and deposition rate increase [21,34,61]. Meanwhile, ICs in this study were mainly positively correlated with TR and elevation, which further confirmed the positive effect of terrain on the IC. However, there was also a negative relationship between these two factors, indicating that the impact of terrain on IC is complex and may be affected by interactions with other factors such as vegetation, surface roughness, soil permeability, transmission channel, and the capacity to store water and sediment [20,62,63]. Therefore, further analysis is needed that focuses on determining the factors that influence the spatial variations in IC.
Previous work has reported an average transport distance of 89 m for the sediment-loaded runoff discharged from the road [16], and indicated that as the distance between the road and stream increases, the proportion of sediment transported into the stream decreases [64]. Thus, the distance between the road and stream significantly affects the connectivity of transporting road-eroded sediment. In this study, with increasing distances to the stream and road, the IC decreased, and, especially, rapidly decreased within the range of 60 m. Similarly, the impact of roads on the IC (whether as a transmission pathway or as a sink) was mainly concentrated within 60 m, which further proves that the transmission distance of road-eroded sediment is limited or that the impact of roads on the IC has a certain distance threshold, which needs to be further confirmed in future work.

5. Conclusions

This study took the Xiangchagou catchment in the Jigongshan National Nature Reserve in Henan Province of China as a case study, and set up different scenarios (S1, did not consider the impact of the road; S2, the road served as the transmission pathways of the sediment-loaded runoff; S3, the road served as the sink of the sediment-loaded runoff) to analyze the response of confluence characteristics and sediment connectivity to roads, and explore the main controlling factors that determine sediment connectivity under the influence of roads, and reveal the spatial differentiation of the relationship between the main influencing factors and sediment connectivity. The results showed that when considering the influence of the road on the flow direction, the road significantly changed the transport process and connectivity of the sediment-loaded runoff, which, in turn, affected the possibility of transporting the sediment from the hillslopes to the catchment outlet. However, the impact of roads on the confluence process (180 m) and sediment connectivity (60 m) might have a certain threshold or be significant within a certain range. Under the influence of the road, changes in the flow length of the confluence path were the most important factor affecting the IC. In conclusion, the present study considered forest road as important transport pathways and sinks when analyzing changes in confluence characteristics and sediment connectivity in a mountainous catchment, and the results help determine the contribution and influencing thresholds of forest roads on the transport of sediment-loaded runoff.

Author Contributions

Conceptualization, Q.Z. and S.D.; methodology, Q.Z. and Y.J.; software, Y.J.; validation, Q.Z.; formal analysis, Q.Z. and Y.J.; investigation, Q.Z., Y.J., A.W., Z.Y., Y.L., J.Y. and G.L.; resources, Q.Z. and Y.J.; data curation, Q.Z. and Y.J.; writing—original draft preparation, Q.Z. and Y.J.; writing—review and editing, Q.Z., Y.J. and S.D.; visualization, Y.J., A.W. and Z.Y.; supervision, Q.Z. and S.D.; project administration, Q.Z. and S.D.; funding acquisition, Q.Z. and S.D. All authors have read and agreed to the published version of the manuscript.

Funding

This research was funded by the National Natural Science Foundation of China (41971229, 42171091), the Natural Science Foundation of Henan Province (202300410050), the Program for Science and Technology Innovation Talents in Universities of Henan Province (22HASTIT013), and the Young Backbone Teachers Foundation of Henan Province (2019GGJS030).

Data Availability Statement

Not applicable.

Acknowledgments

We would like to thank the three anonymous reviewers for their valuable comments on this manuscript.

Conflicts of Interest

The authors declare no conflict of interest.

References

  1. Ballantyne, M.; Pickering, C.M. The impacts of trail infrastructure on vegetation and soils: Current literature and future directions. J. Environ. Manag. 2015, 164, 53–64. [Google Scholar] [CrossRef] [Green Version]
  2. Sugden, B.D. Estimated sediment reduction with forestry best management practices implementation on a legacy forest road network in the northern Rocky Mountains. For. Sci. 2018, 64, 214–224. [Google Scholar] [CrossRef]
  3. Surfleet, C.G.; Marks, S.J. Hydrologic and suspended sediment effects of forest roads using field and DHSVM modelling studies. For. Ecol. Manag. 2021, 499, 119632. [Google Scholar] [CrossRef]
  4. Kazama, V.S.; Corte, A.P.D.; Robert, R.C.G.; Sanquetta, C.R.; Arce, J.E.; Oliveira-Nascimento, K.A.; DeArmond, D. Global review on forest road optimization planning: Support for sustainable forest management in Amazonia. For. Ecol. Manag. 2021, 492, 119159. [Google Scholar] [CrossRef]
  5. Guo, W.; Bai, Y.; Cui, Z.; Wang, W.; Li, J.; Su, Z. The impact of concentrated flow and slope on unpaved loess-road erosion on the Chinese Loess Plateau. Land Degrad. Dev. 2021, 32, 914–925. [Google Scholar] [CrossRef]
  6. Ramos-Scharrón, C.E. Land disturbance effects of roads in runoff and sediment production on dry-tropical settings. Geoderma 2018, 310, 107–119. [Google Scholar] [CrossRef] [Green Version]
  7. Touma, B.R.; Kondolf, G.M.; Walls, S. Impacts of sediment derived from erosion of partially-constructed road on aquatic organisms in a tropical river: The Río San Juan, Nicaragua and Costa Rica. PLoS ONE 2020, 15, e0242356. [Google Scholar]
  8. Ramos-Scharrón, C.E. Impacts of off-road vehicle tracks on runoff, erosion and sediment delivery—A combined field and modeling approach. Environ. Model. Softw. 2021, 136, 104957. [Google Scholar] [CrossRef]
  9. Croke, J.C.; Hairsine, P.B. Sediment delivery in managed forests: A review. Environ. Rev. 2006, 14, 59–87. [Google Scholar] [CrossRef]
  10. Jaafari, A.; Najafi, A.; Rezaeian, J.; Sattarian, A. Modeling erosion and sediment delivery from unpaved roads in the north mountainous forest of Iran. GEM—Int. J. Geomath. 2015, 6, 343–356. [Google Scholar] [CrossRef]
  11. Cao, L.; Zhang, K.; Dai, H.; Liang, Y. Modeling interrill erosion on unpaved roads in the loess plateau of China. Land Degrad. Dev. 2015, 26, 825–832. [Google Scholar] [CrossRef]
  12. Liu, Y.-J.; Hu, J.-M.; Wang, T.-W.; Cai, C.-F.; Li, Z.-X.; Zhang, Y. Effects of vegetation cover and road-concentrated flow on hillslope erosion in rainfall and scouring simulation tests in the Three Gorges Reservoir Area, China. Catena 2016, 136, 108–117. [Google Scholar] [CrossRef]
  13. Mahoney, D.; Blandford, B.; Fox, J. Coupling the probability of connectivity and RUSLE reveals pathways of sediment transport and soil loss rates for forest and reclaimed mine landscapes. J. Hydrol. 2021, 594, 125963. [Google Scholar] [CrossRef]
  14. Fu, B.; Newham, L.T.; Ramos-Scharron, C. A review of surface erosion and sediment delivery models for unsealed roads. Environ. Model. Softw. 2010, 25, 1–14. [Google Scholar] [CrossRef]
  15. Napieralski, J.A.; Giroux, B. Quantifying proximity and conformity between road networks, urban streams, and watershed boundaries. Ann. Am. Assoc. Geogr. 2019, 109, 35–49. [Google Scholar] [CrossRef]
  16. Croke, J.; Mockler, S.; Fogarty, P.; Takken, I. Sediment concentration changes in runoff pathways from a forest road network and the resultant spatial pattern of catchment connectivity. Geomorphology 2005, 68, 257–268. [Google Scholar] [CrossRef]
  17. Sosa-Pérez, G.; MacDonald, L. Wildfire effects on road surface erosion, deposition, and road–stream connectivity. Earth Surf. Process. Landf. 2017, 42, 735–748. [Google Scholar] [CrossRef]
  18. Pechenick, A.M.; Rizzo, D.M.; Morrissey, L.A.; Garvey, K.M.; Underwood, K.L.; Wemple, B.C. A multi-scale statistical approach to assess the effects of connectivity of road and stream networks on geomorphic channel condition. Earth Surf. Process. Landf. 2015, 39, 1538–1549. [Google Scholar] [CrossRef]
  19. Johnson, J.C.; Williams, C.J.; Guertin, D.P.; Archer, S.R.; Heilman, P.; Pierson, F.B.; Wei, H. Restoration of a shrub-encroached semi-arid grassland: Implications for structural, hydrologic, and sediment connectivity. Ecohydrology 2021, 14, e2281. [Google Scholar] [CrossRef]
  20. Alfonso-Torreño, A.; Schnabel, S.; Gómez-Gutiérrez, Á.; Crema, S.; Cavalli, M. Effects of gully control measures on sediment yield and connectivity in wooded rangelands. Catena 2022, 214, 106259. [Google Scholar] [CrossRef]
  21. Persichillo, M.G.; Bordoni, M.; Cavalli, M.; Crema, S.; Meisina, C. The role of human activities on sediment connectivity of shallow landslides. Catena 2018, 160, 261–274. [Google Scholar] [CrossRef]
  22. Negishi, J.N.; Sidle, R.C.; Ziegler, A.D.; Noguchi, S.; Rahim, N.A. Contribution of intercepted subsurface flow to road runoff and sediment transport in a logging-disturbed tropical catchment. Earth Surf. Process. Landf. 2008, 33, 1174–1191. [Google Scholar] [CrossRef]
  23. Fidelus-Orzechowska, J.; Strzyżowski, D.; Żelazny, M. The geomorphic activity of forest roads and its dependencies in the Tatra Mountains. Geogr. Ann. Ser. A Phys. Geogr. 2018, 100, 59–74. [Google Scholar] [CrossRef]
  24. Hernani, H. Application of LiDAR DEM Metrics to Estimate Road-stream Sediment Connectivity in Alberta Eastslopes Salmonid Habitats; University of Alberta: Edmonton, AB, Canada, 2019. [Google Scholar]
  25. Sosa-Pérez, G.; MacDonald, L.H. Reductions in road sediment production and road-stream connectivity from two decommissioning treatments. For. Ecol. Manag. 2017, 398, 116–129. [Google Scholar] [CrossRef]
  26. Lin, H.Y.; Robinson, K.F.; Walter, L. Trade-offs among road–stream crossing upgrade prioritizations based on connectivity restoration and erosion risk control. River Res. Appl. 2020, 36, 371–382. [Google Scholar] [CrossRef]
  27. Lang, A.J.; Aust, W.M.; Bolding, M.C.; McGuire, K.J.; Schilling, E.B. Best management practices influence sediment delivery from road stream crossings to mountain and piedmont streams. For. Sci. 2018, 64, 682–695. [Google Scholar] [CrossRef]
  28. Thomaz, E.L.; Peretto, G.T. Hydrogeomorphic connectivity on roads crossing in rural headwaters and its effect on stream dynamics. Sci. Total Environ. 2016, 550, 547–555. [Google Scholar] [CrossRef] [PubMed]
  29. Llena, M.; Vericat, D.; Cavalli, M.; Crema, S.; Smith, M.W. The effects of land use and topographic changes on sediment connectivity in mountain catchments. Sci. Total Environ. 2019, 660, 899–912. [Google Scholar] [CrossRef] [PubMed] [Green Version]
  30. Trevisani, S.; Cavalli, M. Topography-based flow-directional roughness: Potential and challenges. Earth Surf. Dyn. 2016, 4, 343–358. [Google Scholar] [CrossRef] [Green Version]
  31. Forsyth, A.; Bubb, K.; Cox, M. Runoff, sediment loss and water quality from forest roads in a southeast Queensland coastal plain Pinus plantation. For. Ecol. Manag. 2006, 221, 194–206. [Google Scholar] [CrossRef]
  32. Viel, V.; Delahaye, D.; Reulier, R. Evaluation of slopes delivery to catchment sediment budget for a low-energy water system: A case study from the Lingèvres catchment (Normandy, western France). Geogr. Ann. Ser. A Phys. Geogr. 2014, 96, 497–511. [Google Scholar] [CrossRef]
  33. Fressard, M.; Cossart, E. A graph theory tool for assessing structural sediment connectivity: Development and application in the Mercurey vineyards (France). Sci. Total Environ. 2019, 651, 2566–2584. [Google Scholar] [CrossRef] [PubMed]
  34. Akhtar, M.K.; Corzo, G.A.; Van Andel, S.J.; Jonoski, A. River flow forecasting with artificial neural networks using satellite observed precipitation pre-processed with flow length and travel time information: Case study of the Ganges river basin. Hydrol. Earth Syst. Sci. 2009, 13, 1607–1618. [Google Scholar] [CrossRef] [Green Version]
  35. Barnes, R. Parallel non-divergent flow accumulation for trillion cell digital elevation models on desktops or clusters. Environ. Model. Softw. 2017, 92, 202–212. [Google Scholar] [CrossRef] [Green Version]
  36. Quinn, P.; Beven, K.; Chevallier, P.; Planchon, O. The prediction of hillslope flow paths for distributed hydrological modelling using digital terrain models. Hydrol. Process. 1991, 5, 59–79. [Google Scholar] [CrossRef]
  37. Beven, K.J.; Kirkby, M.; Schofield, N.; Tagg, A. Testing a physically-based flood forecasting model (TOPMODEL) for three UK catchments. J. Hydrol. 1984, 69, 119–143. [Google Scholar] [CrossRef]
  38. Zhang, D.-G.; Wang, K.-L.; Chen, H.-S.; Li, X.; Wang, S.-G. Method and application for extracting topographic index based on DEM. Resour. Environ. Yangtze Basin 2005, 14, 714–719. [Google Scholar]
  39. Feng, Z.; Li, W.; Li, P.; Xiao, C. Relief degree of land surface and its geographical meanings in the Qinghai-Tibet Plateau, China. Acta Geogr. Sin. 2020, 75, 1359–1372. [Google Scholar]
  40. Borselli, L.; Cassi, P.; Torri, D. Prolegomena to sediment and flow connectivity in the landscape: A GIS and field numerical assessment. Catena 2008, 75, 268–277. [Google Scholar] [CrossRef]
  41. López-Vicente, M.; Poesen, J.; Navas, A.; Gaspar, L. Predicting runoff and sediment connectivity and soil erosion by water for different land use scenarios in the Spanish Pre-Pyrenees. Catena 2013, 102, 62–73. [Google Scholar] [CrossRef]
  42. Cavalli, M.; Trevisani, S.; Comiti, F.; Marchi, L. Geomorphometric assessment of spatial sediment connectivity in small Alpine catchments. Geomorphology 2013, 188, 31–41. [Google Scholar] [CrossRef]
  43. Zanandrea, F.; Michel, G.P.; Kobiyama, M. Impedance influence on the index of sediment connectivity in a forested mountainous catchment. Geomorphology 2020, 351, 106962. [Google Scholar] [CrossRef]
  44. Zheng, Z.; He, S.; Wu, F.; Hu, J. Relationship between surface roughness and Manning roughness. Mt. Res. 2004, 22, 236–239. [Google Scholar]
  45. Chakraborty, J.; Armstrong, M.P. Exploring the use of buffer analysis for the identification of impacted areas in environmental equity assessment. Cartogr. Geogr. Inf. Syst. 1997, 24, 145–157. [Google Scholar] [CrossRef]
  46. Geurts, P.; Ernst, D.; Wehenkel, L. Extremely randomized trees. Mach. Learn. 2006, 63, 3–42. [Google Scholar] [CrossRef] [Green Version]
  47. Li, F.; Gong, H.; Chen, B.; Zhou, C.; Guo, L. Analysis of the contribution rate of the influencing factors to land subsidence in the Eastern Beijing plain, China based on extremely randomized trees (ERT) method. Remote Sens. 2020, 12, 2963. [Google Scholar] [CrossRef]
  48. Fotheringham, A.S.; Yang, W.; Kang, W. Multiscale geographically weighted regression (MGWR). Ann. Am. Assoc. Geogr. 2017, 107, 1247–1265. [Google Scholar] [CrossRef]
  49. Yu, H.; Fotheringham, A.S.; Li, Z.; Oshan, T.; Kang, W.; Wolf, L.J. Inference in multiscale geographically weighted regression. Geogr. Anal. 2020, 52, 87–106. [Google Scholar] [CrossRef]
  50. Dormann, C.F.; Elith, J.; Bacher, S.; Buchmann, C.; Carl, G.; Carré, G.; Marquéz, J.R.G.; Gruber, B.; Lafourcade, B.; Leitão, P.J. Collinearity: A review of methods to deal with it and a simulation study evaluating their performance. Ecography 2013, 36, 27–46. [Google Scholar] [CrossRef]
  51. Wemple, B.C.; Clark, G.E.; Ross, D.S.; Rizzo, D.M. Identifying the spatial pattern and importance of hydro-geomorphic drainage impairments on unpaved roads in the northeastern USA. Earth Surf. Process. Landf. 2017, 42, 1652–1665. [Google Scholar] [CrossRef]
  52. Zhao, Y.; Zhang, Y.; Yuan, M.; Yang, M.; Deng, J. Estimation of initiation thresholds and soil loss from gully erosion on unpaved roads on China’s Loess Plateau. Earth Surf. Process. Landf. 2021, 46, 1713–1724. [Google Scholar] [CrossRef]
  53. Sandercock, P.; Hooke, J. Assessment of vegetation effects on hydraulics and of feedbacks on plant survival and zonation in ephemeral channels. Hydrol. Process. Int. J. 2010, 24, 695–713. [Google Scholar] [CrossRef]
  54. Wemple, B.C.; Browning, T.; Ziegler, A.D.; Celi, J.; Chun, K.P.; Jaramillo, F.; Leite, N.K.; Ramchunder, S.J.; Negishi, J.N.; Palomeque, X.; et al. Ecohydrological disturbances associated with roads: Current knowledge, research needs, and management concerns with reference to the tropics. Ecohydrology 2018, 11, e1881. [Google Scholar] [CrossRef]
  55. Marcantonio, M.; Rocchini, D.; Geri, F.; Bacaro, G.; Amici, V. Biodiversity, roads, & landscape fragmentation: Two Mediterranean cases. Appl. Geogr. 2013, 42, 63–72. [Google Scholar]
  56. Rinderer, M.; Ali, G.; Larsen, L.G. Assessing structural, functional and effective hydrologic connectivity with brain neuroscience methods: State-of-the-art and research directions. Earth-Sci. Rev. 2018, 178, 29–47. [Google Scholar] [CrossRef]
  57. Park, E. Characterizing channel-floodplain connectivity using satellite altimetry: Mechanism, hydrogeomorphic control, and sediment budget. Remote Sens. Environ. 2020, 243, 111783. [Google Scholar] [CrossRef]
  58. Jing, Y.; Zhao, Q.; Lu, M.; Wang, A.; Yu, J.; Liu, Y.; Ding, S. Effects of road and river networks on sediment connectivity in mountainous watersheds. Sci. Total Environ. 2022, 826, 154189. [Google Scholar] [CrossRef]
  59. Tarolli, P.; Calligaro, S.; Cazorzi, F.; Fontana, G.D. Recognition of surface flow processes influenced by roads and trails in mountain areas using high-resolution topography. Eur. J. Remote Sens. 2013, 46, 176–197. [Google Scholar] [CrossRef]
  60. Cossart, É.; Fressard, M. Assessment of structural sediment connectivity within catchments: Insights from graph theory. Earth Surf. Dyn. 2017, 5, 253–268. [Google Scholar] [CrossRef] [Green Version]
  61. Brown, K.R.; Aust, W.M.; Mcguire, K.J. Sediment delivery from bare and graveled forest road stream crossing approaches in the Virginia Piedmont. For. Ecol. Manag. 2013, 310, 836–846. [Google Scholar] [CrossRef]
  62. Puigdefábregas, J.; Sole, A.; Gutierrez, L.; Del Barrio, G.; Boer, M. Scales and processes of water and sediment redistribution in drylands: Results from the Rambla Honda field site in Southeast Spain. Earth-Sci. Rev. 1999, 48, 39–70. [Google Scholar] [CrossRef]
  63. Cammeraat, E.L. Scale dependent thresholds in hydrological and erosion response of a semi-arid catchment in southeast Spain. Agric. Ecosyst. Environ. 2004, 104, 317–332. [Google Scholar] [CrossRef]
  64. Thompson, C.J.; Takken, I.; Croke, J.; Schmidt, J.; Cochrane, T.; Phillips, C.; Elliott, S.; Davies, T.; Basher, L. Hydrological and Sedimentological Connectivity of Unsealed Roads. In Proceedings of the 2008 Symposium of the International Commission on Continental Erosion, Christchurch, New Zealand, 1–5 December 2008. [Google Scholar]
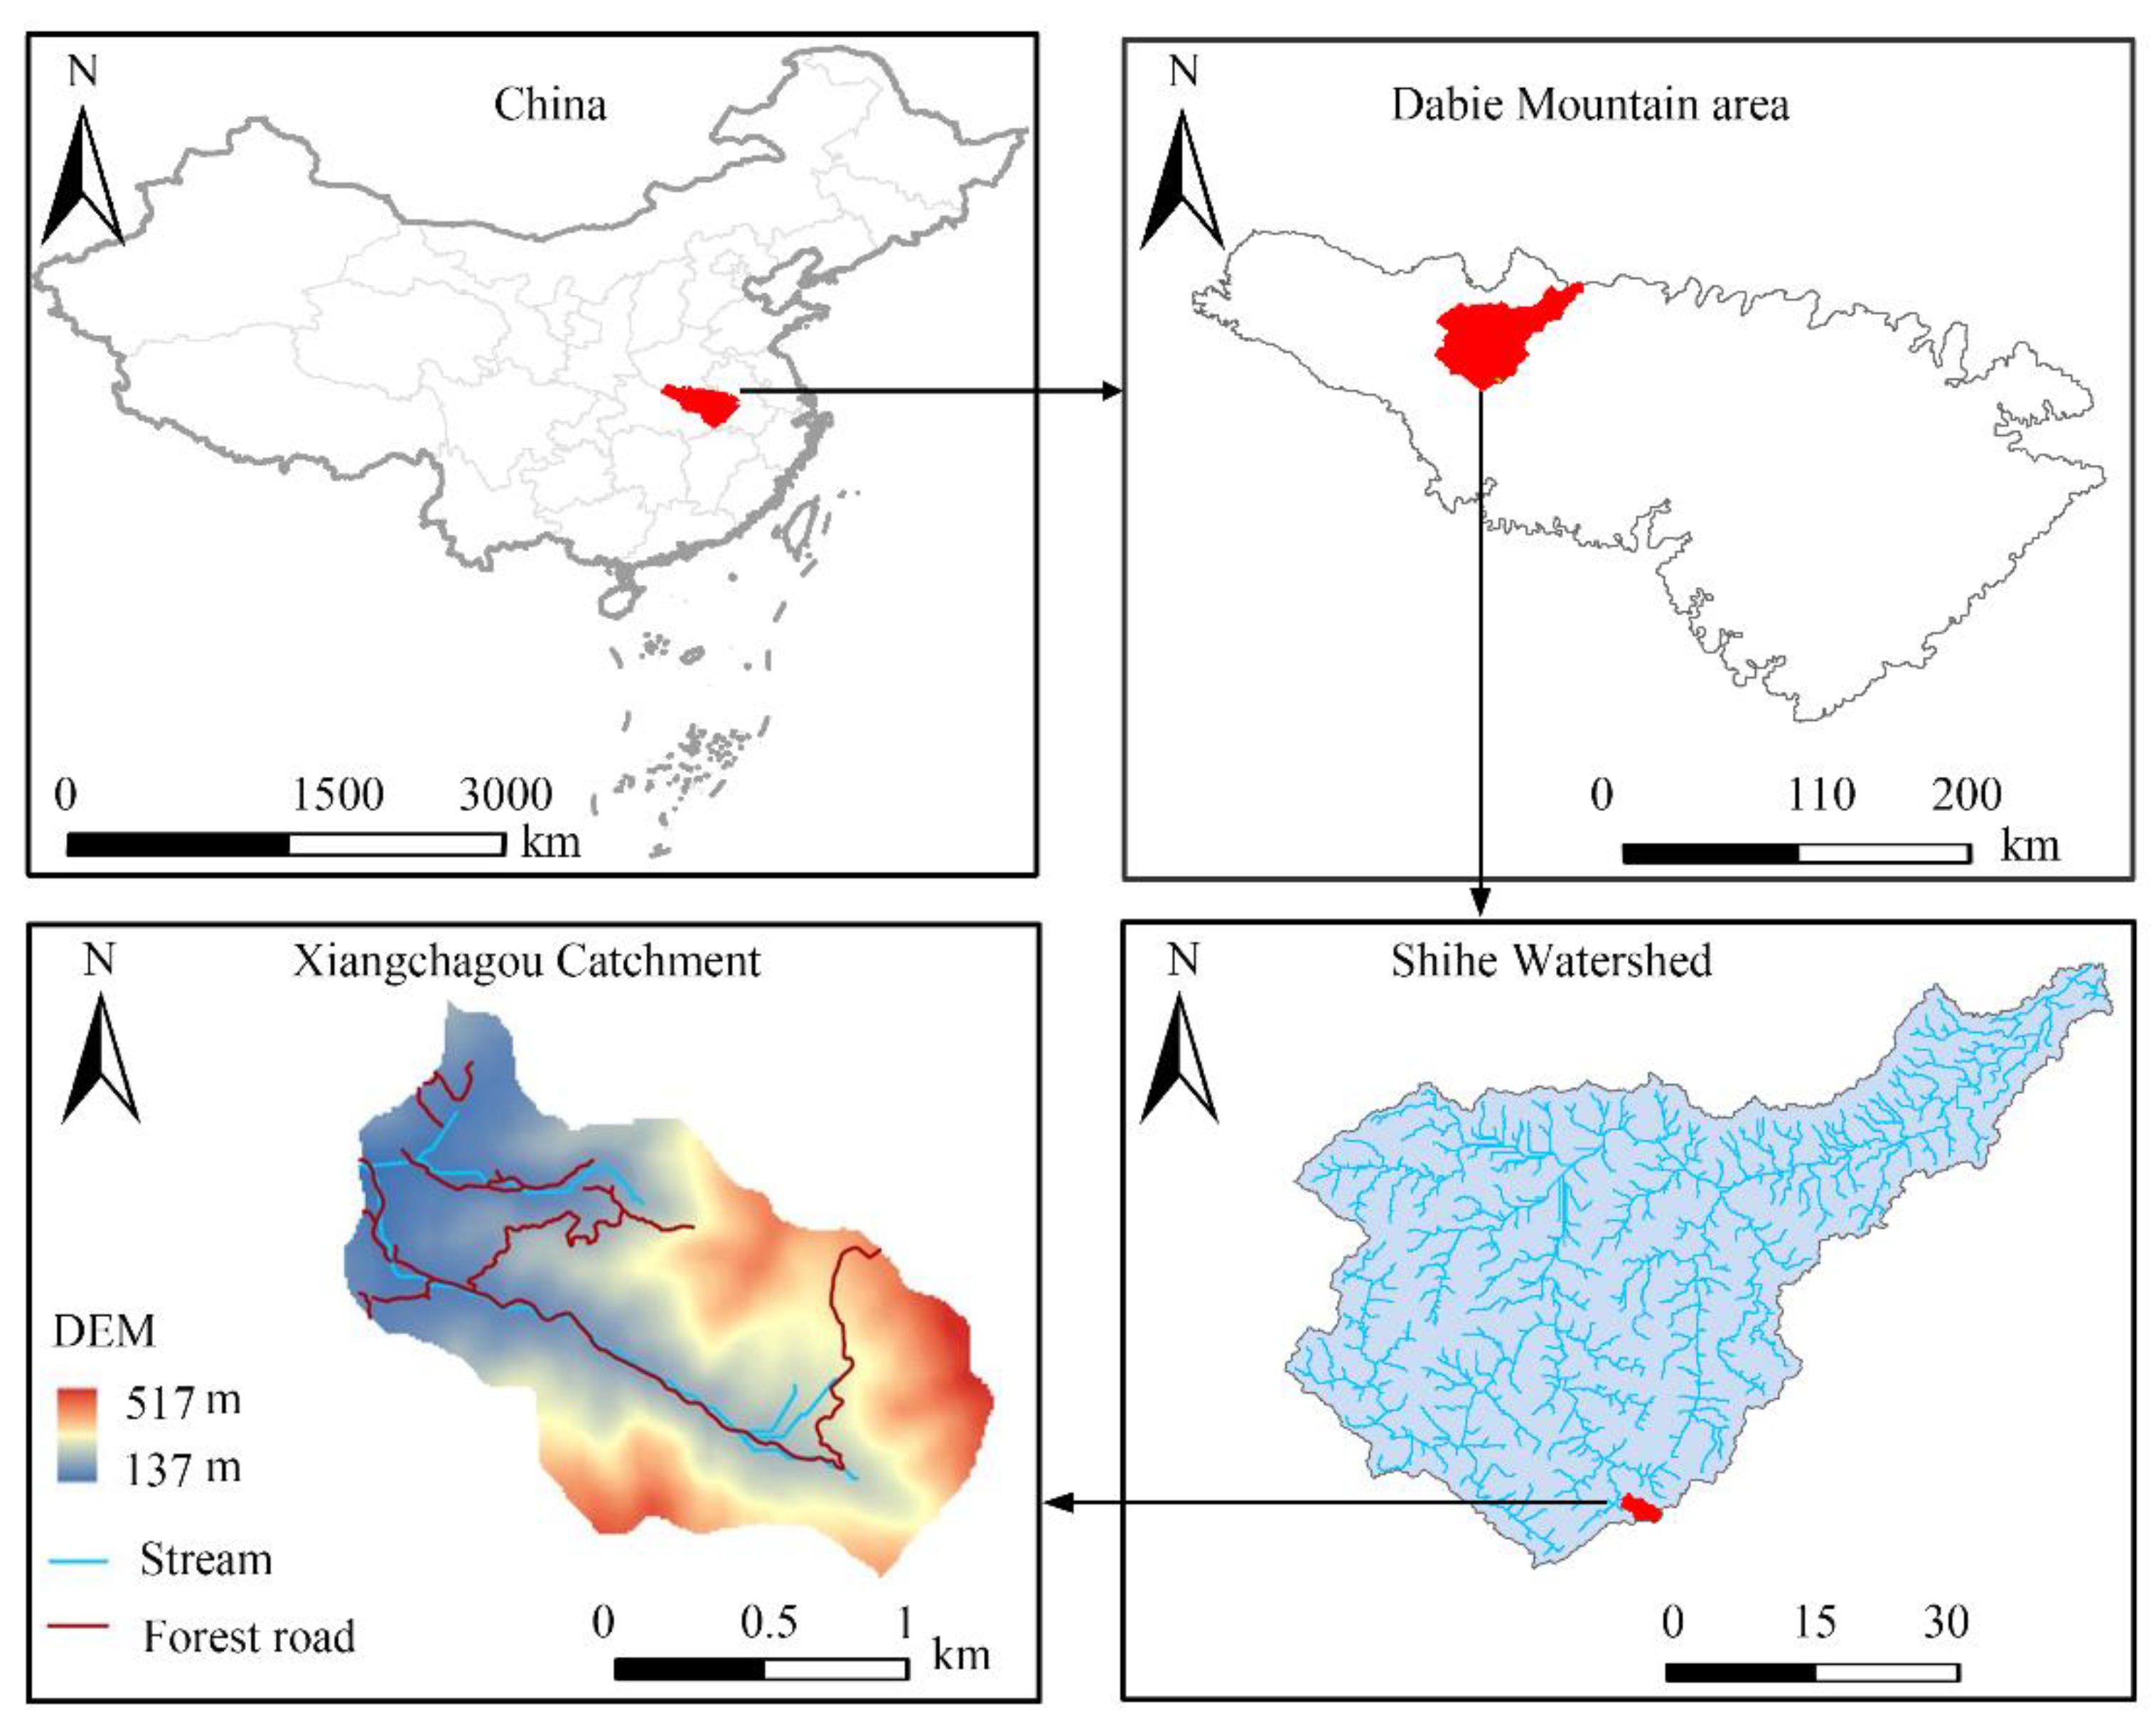
Figure 1. Location of the study area and distribution of forest road networks.
Remotesensing 14 03603 g001
Figure 2. Schematic diagram showing the natural and altered direction and converging pathways of flow and sediment in scenarios S1 (a), S2 (b), and S3 (c).
Remotesensing 14 03603 g002
Figure 3. Spatial distribution of flow length (a1a3), flow accumulation (b1b3), upslope contributing area (c1c3), topographic index (d1d3), and Shimbel index (e1e3) in scenarios S1, S2, and S3.
Remotesensing 14 03603 g003
Figure 4. Variation in flow length (FL, a1,a2), flow accumulation (FA, b1,b2), upslope contributing area (UCA, c1,c2), topographic index (TI, d1,d2), and Shimbel index (SHI, e1,e2) with distance from stream and road in scenarios S1, S2, and S3.
Remotesensing 14 03603 g004
Figure 5. Spatial distribution of sediment connectivity under scenarios of S1 (a), S2 (b), and S3 (c), and changes in sediment connectivity in scenarios S2 (d) and S3 (e) compared to scenario S1.
Remotesensing 14 03603 g005
Figure 6. Changes in sediment connectivity of scenarios S1, S2, and S3 under different buffer zones of stream (a), road (b), and road–stream crossing (c) in Xiangchagou catchment.
Remotesensing 14 03603 g006
Figure 7. Contribution of influencing factors to sediment connectivity in scenarios S1 (a), S2 (b), and S3 (c). DEM, Digital Elevation Model; SG, slope gradient; TR, terrain relief; stream_DS, distance to stream; Road_DS, distance to road; stream_D, stream density; Road_D, road density; FL, flow length; FA, flow accumulation; UCA, upslope contributing area; TI, topographic index; SHI, Shimbel index.
Remotesensing 14 03603 g007
Figure 8. Spatial distribution of regression coefficients between sediment connectivity and convergence processes including flow length (FL, a1a3), flow accumulation (FA, b1b3), topographic index (TI, c1c3), and Shimbel index (SHI, d1d3) under scenarios S1, S2, and S3 based on MGWR model. The colors indicate the relationships between sediment connectivity and convergence processes are significant (p < 0.05).
Remotesensing 14 03603 g008
Figure 9. Spatial distribution of regression coefficients between sediment connectivity and spatial characteristics including elevation (DEM, a1a3), terrain relief (TR, b1b3), distance to stream (Stream_DS, c1c3), and distance to road (Road_D, d1d3) under scenarios S1, S2, and S3 based on MGWR.
Remotesensing 14 03603 g009
Publisher’s Note: MDPI stays neutral with regard to jurisdictional claims in published maps and institutional affiliations.