Article

Flood Inflow Estimation in an Ungauged Simple Serial Cascade of Reservoir System Using Sentinel-2 Multi-Spectral Imageries: A Case Study of Imjin River, South Korea

1
Water Resources and Environmental Research Center, K-Water Research Institute, Daejeon 34045, Korea
2
Department of Civil and Environmental Engineering, Dankook University, Yongin 16890, Korea
3
Interdisciplinary Program in Crisis, Disaster and Risk Management, Sungkyunkwan University, Suwon 16419, Korea
*
Author to whom correspondence should be addressed.
Remote Sens. 2022, 14(15), 3699; https://doi.org/10.3390/rs14153699
Submission received: 26 June 2022 / Revised: 25 July 2022 / Accepted: 29 July 2022 / Published: 2 August 2022
(This article belongs to the Special Issue Measurement of Hydrologic Variables with Remote Sensing)

Abstract

:
The Imjin River is a representative transboundary river in the Korean Peninsula, originating from North Korea and flowing into South Korea. Upstream of Imjin River, on the North Korean side, is the Hwanggang Dam, with a 350 million m3 of storage capacity, which is in operation for power generation and water supply. The sharing of the operation information of Hwanggang Dam has been limited due to political and military tension. South Korea has constructed the Gunnam Flood Control Reservoir downstream of the Imjin River to prevent potential flood damage due to the urgent and unilateral release from the Hwanggang Dam. However, it is difficult to manage the flood of the Imjin River basin under the situation of limited shared real-time information on the Hwanggang Dam operation. In this study, a hydrological analysis system was established to estimate the inflow and release of the Hwanggang Dam by building a lumped hydrological model and an Auto ROM (Reservoir Operation Method)-based reservoir operation algorithm. To estimate the inflow of the Gunnam Flood Control Reservoir, the water level of the Hwanggang Dam was calculated using the Sentinel-2 multi-spectral images, and the hydrological analysis system was calibrated. The evaluation index of the water level of the ungauged Hwanggang Dam derived from January 2017 to August 2020 using the hydrological analysis system was shown to have a coefficient of determination of 0.76 and an RMSE of 3.97 m. In the case of the flood event in August 2020, the coefficient of determination of the flood inflow in the Gunnam Flood Control Zone was calculated to be 0.86.

Graphical Abstract

1. Introduction

The Imjin River is an international transboundary river on the Korean Peninsula that originates from North Korea and flows into South Korea. About 2/3 of the total watershed area of 8117.5 km2 is located in North Korea. The water resource facilities (e.g., dams upstream of the Imjin River in North Korea), directly affect the downstream area in South Korea. Due to unilateral operations such as diversion to other basins and release for flood control from North Korea’s Hwanggang Dam constructed in 2007, the downstream area of the Imjin River in South Korea has suffered water shortages and potential flood damage. The Hwanggang Dam is located 42.3 km north of the demilitarized zone (DMZ) in the upper stream of the Imjin River, and its reservoir capacity is estimated to be about 300 to 400 million m3 [1]. As a countermeasure for the unexpected release from the Hwanggang Dam, the Gunnam Flood Control Reservoir, with about a 70 million m3 capacity was constructed in 2011. However, the flood control operation at the Gunnam Reservoir suffers high risks due to the lack of hydrological information in the upstream region including the Hwanggang Dam in North Korea. On 6 September 2009, a significant release of the Hwanggang Dam caused flooding in Yeoncheon-gun, Gyeonggi-do, resulting in the loss of life and property. On 16 May 2016, the residents were damaged downstream of the Imjin River due to a urgent and unilateral release. On 5 August 2020, the water level of the Hwanggang Dam increased rapidly due to a heavy storm and urgent release, and a record-high water level was observed.
After the construction of the Hwanggang Dam, the hydrological condition changed rapidly in the border area, and several studies on the ungauged basin were carried out. The physically-based distributed hydrology model can be a proper tool for hydrological analysis over an ungauged basin. By using a digital elevation model, the land use and soil map to the distributed hydrologic model was resampled as 1 km, and the flood inflow was calculated based on the natural runoff condition in 2006 before the construction of the Hwanggang Dam [2]. To estimate the release from the Hwanggang Dam in North Korea, the NWS-PC model, a long-term runoff model, was used.
The model was calibrated for the natural runoff from 1999 to 2000 before the construction of the Hwanggang Dam. The Hwanggang Dam release was indirectly estimated by comparing it with the observed flow at the downstream reaches of the Imjin River [3]. In addition, a reservoir operation model was applied to find the optimal operation rule for the Gunnam Reservoir to maximize the flood control capacity in response to the unexpected operation at Hwanggang Dam [4,5].
Until the middle of the 2010s, it was difficult to analyze the impact of the Hwanggang Dam directly, so the model was calibrated using the data before the construction of the Hwanggang Dam, or the spatial scope was limited to the Gunnam Flood Control Reservoir in South Korea. Recently, due to the increased urgent release operation from the Hwanggang Dam, several studies have been conducted to analyze the effect on the downstream Imjin River. Unlike floods, to analyze the effect of the upstream dam on the flow reduction in a downstream area, the daily average flow reduction was quantitatively calculated through the water balance analysis [6]. A hydrological model was built in the Imjin River basin using GIS-based parameters and ground rainfall data, and the reservoir operation model was applied to calculate the inflow and release of ungauged dams [7,8]. Although the operation of the Hwanggang Dam significantly affects the downstream Imjin River, it is limited in obtaining data. Therefore, a study was conducted to simulate the Imjin River by combining models upon several assumptions. With the recent development of remote sensing technology, the demand for flood monitoring and forecasting/prediction through a combination of hydrologic models and remote sensing data for border regions has increased.
This study constructed a coupled model between the rainfall–runoff and the reservoir operation model to estimate the inflow to the downstream dam in a serial cascade reservoir system including ungauged reservoirs. After estimating the change in the ungauged reservoir water level using Sentinel-2 optical satellite imagery and 10 m high-resolution topographic data, the inflow and release of the ungauged dam and the inflow to the downstream dam were derived.

2. Materials and Methodology

2.1. Study Area and Data

2.1.1. The Injin River Basin

The Imjin River is an international transboundary river that originates from North Korea and flows into South Korea. Divided by the Demilitary Zone (DMZ), the watershed area in South Korea is 3008.7 km2, which is 37.1% of the total watershed, and the remaining 62.9% of the watershed area is located in North Korea [9]. As shown in Figure 1, the watershed area of Hwanggang Dam is 2806.0 km2, which occupies 67.4% of the 4164.3 km2 upstream basin area of the Gunnam Flood Control Reservoir.
The Hwanggang Dam is a multi-purpose dam that is 880 m in length and has a 300 to 400 million m3 storage capacity. A significant part of the storage is known to be diverted to the Gaeseong Industrial Complex for industrial and municipal water supply. There is a direct damage risk to the downstream Imjin River in the process of dam operation or in the case of dam failure [3].

2.1.2. Hydrometeorological Data in the North Korean Area

Currently, the hydrologic data are not shared in real-time between South and North Korea. It is possible to estimate the precipitation indirectly from the weather radar stations at the Imjin River and Gwangdeok Mountain. However, considering the uncertainty of the radar observations and the error propagating in the downstream reaches, it would be advantageous to use a semi-distributed model calibrated using rainfall data observed at the ground stations [2]. For this reason, the ground rainfall data were used to minimize the uncertainty of rainfall estimation and a hydrological analysis system that can estimate the inflow from the upper basin of the Hwanggang Dam to the Gunnam Flood Control Reservoir using the observation rainfall records.
The World Meteorological Organization (WMO) provides weather observation data from 27 stations in North Korea through the Global Telecommunication System (GTS). The hourly rainfall data of five stations (Yangdeok, Wonsan, Shingye, Pyeonggang, and Kaesong) were collected from 1 January 2017 to 12 September 2020. They have major impacts on the runoff in the Imjin River basin (Figure 2). The Thiessen weight was calculated as a ratio of the contribution area as shown in Figure 2 and Table 1, and the time series converted to the areal mean rainfall for each watershed was reorganized.

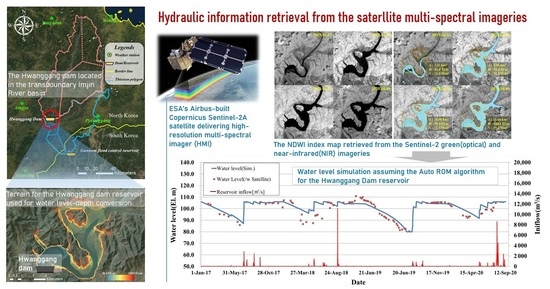
2.1.3. Sentinel-2 Multi-Spectral Data for the Hwanggang Dam Hydraulic Data Retrieval

Since the water level and operation data of Hwanggang Dam are not directly available, the reservoir’s H-A-V (water level–water surface area–storage volume) relationship was derived from the topographic data, a 10 m resolution DEM (digital elevation model) built before the construction of the Hwanggang Dam in 2007. The water level and storage volume were indirectly estimated using the water surface area extracted from the Sentinel-2 satellite imagery. Figure 3 shows the contour lines of the Hwanggang Dam reservoir by synthesizing the Hillshade calculated from the DEM and the satellite image around the Hwanggang Dam reservoir using the GIS tool. The water level–surface area relationship and the water level–storage volume relationship of the Hwanggang Dam reservoir were derived by matching the water surface area captured by the satellite with the water elevation and volume from the topographic information. Due to the imperfect representation of DEM for underwater topography, there was a discontinuous segment in the water level–water surface area relationship between EL.95 m and EL.105 m (Figure 4). A local topographical error that occurred in reconstructing the underwater topography was a limitation of the vertical resolution of the DEM. However, the effect on the results will not be relatively significant compared to the hydrological uncertainties embedded in the rainfall and inflow measurements.
In this study, the Sentinel-2 imageries were used to estimate the water level of the Hwanggang Dam reservoir. Before Sentinel-2, MODIS was widely used as a multispectral sensor, but it was mainly applied for a relatively large-scale area due to the coarse resolution of 250 m [10,11,12]. The Thematic Mapper (TM), the Enhanced Thematic Mapper Plus (ETM+), and the Operational Land Imager (OLI) of the Landsat Satellite with a 30 m resolution were the alternatives for increasing the resolution [13,14,15]. Since 2015, the European Space Agency (ESA) has built the Earth Explorer data portal to provide a series of Sentinel satellite data. Since then, the water body detection capacity has improved significantly.
The Sentinel-2 operates twin satellites (Sentinel-2 A/B) of the exact specification in the same orbit to acquire images of the specific location every five days. The MSI (Multi-Spectral Instrument) was installed to provide images in 13 multispectral bands including visible bands. The provided images had a resolution of 10 m for visible and near-infrared bands and 20 m and 60 m for other infrared images [16].
For water body detection, the NDWI in Equation (1) was applied using the green wave with the highest reflectivity from the waterbody and the NIR (near-infrared) wave with the highest absorption [17]. Figure 5 shows the process from extracting the NDWI imageries from near-infrared images to smoothing the outlines. The MNDWI (modified NDWI) could be an option because SWIR (short wave infrared) waves have the advantage of a better absorption of water bodies than NIR waves [18]. However, the NDWI was used to detect the water surface in this study because the principle of water body detection is essentially the same, and the resolution of the NDWI is rather higher. Table 2 shows the spectral characteristics and spatial resolution of Band 3 (Green), Band 8 (NIR), and Band 12 (SWIR) used for water body detection in various imageries of Sentinel-2.
N D W I = ρ G r e e n ρ N I R ρ G r e e n + ρ N I R
where ρ G r e e n and ρ N I R are the reflectance values of the green light and near-infrared waves, respectively.
For both the NIR imagery and the NDWI imagery, it is necessary to set a threshold for water body detection. The threshold values are the digital number (DN) and the NDWI value for the NIR and the NDWI imageries, respectively. Figure 6 shows the NIR imagery and the water body detected by the NDWI. Figure 7 shows the histogram for water body analysis and the four graphs on the left panel are histograms of the Sentinel-2 optical imageries with the digital number of Band 8 (Near Infrared), which clearly represents the water body. Since the threshold value found in the minimum concave portion of the histogram for detecting the water body is different from imagery to imagery, a certain criteria for detection cannot be readily established. Therefore, it is necessary to detect the water body through statistical analysis or supervisory classification and cluster analysis every time. On the other hand, the four graphs on the right panel were the normalized indices through NDWI, and the positive (+) value was considered to be the water body, so 0 can be clearly identified as the reference value in the concave portion of the histogram, which enables the stable detection of the water body. Satellite imageries were collected from 1 January 2017 to 30 September 2020. The reservoir water level was estimated using 94 imageries excluding imageries that were impossible to observe due to clouds or limited to analysis due to freezing.

2.2. Methodology

2.2.1. Conceptual Rainfall–Runoff Model

The rainfall–runoff model can be classified into a lumped model and a physically-based distributed model, according to the methods of dealing with the numerical analysis of the governing equation, the configuration of the computational grid, the subbasin delineation, and the spatial variation of the parameters. In the lumped model, the modeling parameters are estimated in sub-basin units, and the spatial variability within each sub-basin is assumed to be disregarded. Sometimes, the physical governing equation is replaced by an empirical equation. On the other hand, the distribution model divides the watershed into grid or micro-catchment units and computes the runoff using numerical analysis techniques such as finite difference or finite element. In the case of the lumped model, the hydrological process is simple, and the computational burden is relatively light, so it is possible to derive results with various temporal unit terms from short-term to long-term runoff. However, there are disadvantages in simulating the spatio-temporal changes in the hydrological variables, so the unique parameters for a specific watershed cannot be made readily available.
In the case of the distributed model, the model’s performance depends largely on the grid and data scales rather than the meteorological features, so it is advantageous to apply it to the ungauged basins. However, the distribution model has more parameters, and a higher computational burden will be placed on the watersheds with a larger scale. In addition, real-time operation with a distributed model is limited due to the high influence of the initial hydrological conditions on the predictions. The physically-based distributed model requires high-quality observations for the modeling calibration. However, it is also agreed that the distributed model has limited advantages for ungauged basins due to the lack of observed values. From 2008, when the construction of the Hwanggang Dam was estimated to be completed, the storage effect and operation method of the Hwanggang Dam should be considered when building the hydrological model over the Imjin River basin. A conceptually based quasi-distributed or lumped model that expresses characteristics as adjustable parameters could be an alternative to be considered.
In this study, the CUH (Clark unit hydrograph) model was selected to indirectly estimate the inflow and operation method of the Hwanggang Dam through multispectral satellite imagery. The CUH model is a well-known lumped model based on the time–area equations. The continuity equation (Equation (2)) and the storage–outflow function (Equation (3)) are used as the fundamental equations.
d S t d t = I t Q t
S t = K Q t
where St is water storage (m3); It is the inflow(m3/s); Qt is the outflow (m3/s); K is the storage constant value (h).
Equation (4) is driven through a simple finite difference approximation by combining Equations (2) and (3).
Q t = C A I t + C B Q t 1
where C A = Δ t / ( K + Δ t ) , C B = 1 C A .
The average runoff at time t is the height of the Clark unit hydrograph and is calculated through Equation (5).
Q t ¯ = Q t 1 + Q t 2
The storage constant ( K , Equation (6)) and the time of concentration ( T c , Equation (7)), which are parameters of the Clark unit hydrograph, are presented in the form of empirical formulas so that they can be applied to ungauged basins through the ‘Standard guidelines for flood estimation’ in South Korea [19].
K = α ( A L 2 ) 0.02 T c
T c = 0.214 L H 0.144
where K is the storage constant value (h); α is 1.45 (standard value) in general basins; 1.20 in watersheds with steep slopes and low storage capacity such as in mountainous areas; 1.7 in watersheds with gentle slopes and large storage capacity such as flat land; A is the watershed area (km2); T c is the time of concentration (h); L is the length of the flow path (km), and H is the elevation difference (m) between the elevation of the highest point of the watershed and the elevation of the outlet point.
The study area has a total area of 4164.3 km2 with the Gunnam flood Control Reservoir as the outlet and is divided into seven sub-basins, as shown in Figure 8. The sub-basin characteristics were extracted as shown in Table 3 by using DEM with a resolution of 10 m. As shown in Table 4, the parameters of the Clark unit hydrograph and Muskingum flow routing to larger than 250 km2 were calculated.
Using the hourly rainfall data collected in Section 2.1.2, the hydrological model was built to operate independently for the upstream and downstream areas of the Hwanggang Dam. The Hwanggang Dam releases are routed from the dam inflow through the reservoir simulation algorithm introduced in Section 2.2.2. The direct verification of the inflow of the Hwanggang Dam is limited because the observation data are unavailable. In this study, using the reservoir routing method introduced in Section 2.2.2, the hourly change in the reservoir water level according to the Hwanggang Dam inflow was simulated. Afterward, the Hwanggang Dam inflow was indirectly verified using the satellite-based water level data introduced in Section 2.1.3, and the Hwanggang Dam release was calculated.

2.2.2. Reservoir Routing Model

The reservoir operation model (ROM) is generally classified into Auto ROM, Technical ROM, and Rigid ROM [20,21,22]. Auto ROM is the simplest reservoir operation method. It guarantees only the dam’s safety based on the current reservoir water level so that it is operated within a specific range, not exceeding the planned flood level during the flood season and below the normal water level in the non-flood season. Technical ROM and Rigid ROM utilize the maximum storage capacity by using the predicted reservoir inflow to maximize the flood control effect. In the case of the upstream of the Imjin River, since water level and flow information cannot be obtained, it is practically unreasonable to apply the Technical ROM and Rigid ROM, which require predictive information on the inflow of the reservoir. For this reason, the Hwanggang Dam reservoir operation model was built using Auto ROM, which has a simple operation method.
The Auto ROM stores the inflow below the upper limit and releases the entire inflow above the upper limit, and the current inflow and the reservoir water level are used to determine the outflow. The algorithm for determining the release is described below, as shown in Figure 9.
(1)
If the water level of the reservoir is below the upper limit and above the lower limit, a specific amount of power generation is released regardless of the inflow.
(2)
If the water level of the reservoir is higher than the upper limit, all excess inflow is released.
(3)
If the water level in the reservoir is below the lower limit, stop the power generation and store the inflow.
(4)
It is assumed that the Hwanggang Dam can release a specific discharge through the gate operation regardless of the reservoir water level.
The main parameters of the Hwanggang Dam reservoir operation algorithm are the upper and lower limits of the reservoir ( h m a x , h m i n ) and the generation discharge (E). The reservoir inflow and release information are required to determine parameters, but North Korea is an ungauged area. This was determined indirectly using satellite-based water level data. The upper limit water level was determined using the water level data during the flood season when rainfall is concentrated when the inflow is abundant, and the reservoir’s water level is kept close to the high water level. The power generation discharge was determined using the water level trend, which steadily decreased during the non-flood period when the inflow was small. In addition, the lower limit was determined using the upward trend at which the water level rises due to the concentration of rainfall. Since the release from the Hwanggang Dam cannot be directly verified, it was combined with the rainfall–runoff model downstream of the Hwanggang Dam to calculate the inflow of the Gunnam Flood Control Reservoir. Since the Gunnam Flood Control Reservoir has observation data, it is possible to indirectly verify the flood release from Hwanggang Dam.

3. Results and Discussion

As described in Section 2.1.2, the rainfall–runoff model was driven using the time series of hourly areal rainfall data of the Imjin River basin. As shown in Figure 10, the rainfall of the Imjin River is characterized by a typical rain pattern in the Korean Peninsula, where rainfall is concentrated during the summer flood season. However, the annual cumulative rainfall in 2020 was 2094 mm, exceptionally high considering the average annual rainfall over the entire Korean Peninsula. In particular, about 930 mm of intensive rainfall occurred due to an extended stagnant Monsson front over the central region in August.
The basin runoff was calculated using the rainfall–runoff model described in Section 2.2.1. The upstream runoff from the Hwanggang Dam basin can be regarded as the inflow of the Hwanggang Dam reservoir. However, direct verification is limited because the observation data are not currently shared.
The inflow increase due to rainfall leads to an increase in the water level in the reservoir. In the case of no rain, the water level decline will be accelerated by the continued discharge for power generation. Although the power discharge is released only from morning to evening, it is assumed that the average discharge is continuously released in a row for the convenience of calculation. Figure 11 shows the results of the comparison with the Hwanggang Dam water level data estimated from the satellite observation by continuously simulating the water level change in the Hwanggang Dam as a result of the dam inflow. The dam inflow was indirectly verified using the change in water level in the dam. It was assumed that the satellite-induced Hwanggang Dam water level could represent the actual reservoir water level. The parameters for the Hwanggang Dam reservoir operation were prepared as shown in Table 5. During the winter (November to December) season with the low inflows and the high water level at the Hwanggang Dam, the release for power generation was estimated to be smaller than usual, so the releases during this period were treated as a constant. The coefficient of determination (R2) of 0.76 and RMSE of 3.97 m was evaluated for the continuously simulated water level change compared with the satellite-induced water level data during the entire simulation period, and the statistics for each year are shown in Table 6. In order to reflect the current dam operation, the parameter calibration was performed with respect to the recent years of 2019 and 2020.
The inflow into the Gunnam Flood Control Reservoir is the combined result of the dam releases estimated through the dam operation rules and the runoff computed by the hydrologic model. The final flood inflow hydrograph (Figure 12) was evaluated with the heavy storm events in August 2020. The cumulative 930 mm occurred during one month, and 800 mm or more was concentrated between 1 and 14 August. The coefficient of determination (R2) for dam inflow simulation was 0.86. Between 5 and 7 August 2020, the additional release from the Hwanggang Dam was about 67% of the total inflow in the Gunnam Flood Control Reservoir. The estimated inflows between 10 and 12 August were relatively lower than the observed values. However, pre-storm releases from the Hwanggang Dam were suspected to secure the flood control capacity in preparation for additional storms.

4. Conclusions

In this study, a lumped hydrologic model and Auto-ROM-based Hwanggang Dam reservoir operation algorithm were built to estimate the inflow of the Hwanggang Dam located in the ungauged upstream reaches of the Imjin River, and the flood inflow from the Gunnam Flood Control Reservoir in South Korea. In addition, the water level change in the Hwanggang Dam, transformed from the multi-spectral satellite imagery and high-resolution topographic data, the release of the Hwanggang Dam, and the flood inflow of the Gunnam Flood Control Reservoir were computed inversely based on the assumed reservoir operation rules.
In spite of the low spatial density, the rainfall data provided by the WMO were used as the input data for the hydrology model to overcome the limited availability of rainfall information in North Korea. The high-resolution DEM and Sentinel-2 multispectral imageries were used to estimate the water level of the ungauged dam reservoir indirectly. Due to the limitations of optical sensors (e.g., that clouds can partially shade the imagery), the available images during the target period were insufficient. In addition, since the reservoir characteristics and water level depend on the resolution, the geometric correction of the satellite imageries, and the accuracy of the DEM, the water level estimation should have uncertainties to an extent.
The ungauged dam inflow was indirectly verified by simulating the water level change according to the reservoir operation rules. The method of water level change requires reliable data for the historical reservoir operation. This method could be effective for dam reservoirs that only keep the water level high for power generation and water supply.
Remote sensing techniques can provide essential information on ungauged reservoirs. As shown in the case of the Imjin River in South Korea, it was suggested that the remote sensing imagery could be used to construct a hydrological model in the transboundary river basin including the ungauged reservoir. Future studies are suggested as follows. In transboundary areas where ground rainfall data are unavailable, calibrated rainfall radar can be used as an alternative. The rainfall radar with a short temporal resolution has advantages for flash flood monitoring. In the case of the border in the Korean Peninsula, if the accuracy of radar precipitation is improved, it will be possible to develop a more reliable inflow of the Hwanggang Dam and Gunnam Flood Control Reservoir with real-time estimation. The remote sensing images are expected to improve the accuracy of water level estimation when the resolution, image processing, and geometric correction of satellite imageries are improved. When using SAR (Synthetic Aperture Radar) satellite imagery with little influence from clouds and weather, it is possible to estimate the water level change during the flood period regularly. In the future, using real-time radar rainfall and short-term forecast information, it is expected to be developed into a flood forecasting system that can predict the flood inflow of downstream dams with an ungauged upstream reservoir.

Author Contributions

Conceptualization, B.K.; Methodology, B.K. and J.G.K.; Software, J.G.K. and S.K.; Validation, J.G.K., B.K., and S.K.; Formal analysis, J.G.K.; Investigation, J.G.K.; Resources, S.K.; Data curation, J.G.K. and S.K.; Writing—original draft preparation, J.G.K.; Writing—review and editing, J.G.K. and B.K.; Visualization, J.G.K.; Supervision, B.K.; Project administration, B.K. and S.K.; Funding acquisition, B.K. All authors have read and agreed to the published version of the manuscript.

Funding

This work was supported by the Korea Environment Industry & Technology Institute (KEITI) through the R&D Program for Innovative Flood Protection Technologies against Climate Crisis, funded by the Korean Ministry of Environment (MOE). (Project ID #: 2022003460001).

Data Availability Statement

The Sentinel-2 satellite imageries were downloaded from the Copernicus Open Access Hub (https://scihub.copernicus.eu (accessed on 26 June 2022)). The topographic information with high resolution (10 m scale) for the Hwanggang dam reservoir was provided by the National Geographic Information Institute of Korea. The hydro-meteorological data for the Hwanggang Dam basin were collected from the WMO’s Global Telecommunication System (GTS) echoed by the Open MET Data Portal operated by KMA (Korea Meteorological Administration). The hydrologic data for the Imjin River basin were downloaded from the WAMIS (Water Resources Management Information System) operated by the Han River Flood Control Office of the Ministry of Environment in South Korea.

Acknowledgments

The authors wish to acknowledge the technical and administrative support from Euiho Hwang in the Integrated Water Resources Management Research Center, K-Water Institute.

Conflicts of Interest

The authors declare no conflict of interest.

References

  1. Lee, G.M.; Kang, B.; Hong, I.-P. Cooperative framework for conflict mitigation and shared use of South-North Korean transboundary rivers. KSCE J. Civil Environ. Eng. Res. 2008, 28, 505–514. [Google Scholar]
  2. Park, J.H.; Hur, Y.T. Flood runoff simulation using physical based distributed model for Imjin-River basin. J. Korea Water Res. Ass. 2009, 42, 51–60. [Google Scholar] [CrossRef] [Green Version]
  3. Kim, D.P.; Kim, K.H.; Kim, J.H. Runoff estimation of Imjin river basin through april 5th dam and Hwanggang dam construction of North Korea. J. Environ. Sci. Int. 2011, 20, 1635–1646. [Google Scholar]
  4. Yang, W.; Ahn, J.; Yi, J. A study on the measures to use Gunnam flood control reservoir through a reservoir simulation model. J. Korea Water Res. Ass. 2017, 50, 407–418. [Google Scholar]
  5. Park, S.J.; Lee, C.W. Simulation of the flood damage area of the Imjin River basin in the case of North Korea’s Hwanggang Dam discharge. Korean J. Remote Sens. 2018, 34, 1033–1039. [Google Scholar]
  6. Jang, S.H.; Lee, J.-K.; Jo, J.W. Evaluation of instream flow in the Imjingang River according to the operation of Hwanggang Dam in North Korea. Crisisonomy 2020, 16, 105–118. [Google Scholar] [CrossRef]
  7. Ha, D.T.T.; Kim, S.H.; Bae, D.H. Impacts of upstream structures on downstream discharge in the transboundary Imjin River basin, Korean Peninsula. App. Sci. 2020, 10, 3333. [Google Scholar] [CrossRef]
  8. Kim, J.; Kim, E.; Kang, B. Estimation of ungauged Hwanggang dam inflow using Sentinel-2 optical satellite imagery. J. Korea Water Res. Assoc. 2021, 54, 265–277. [Google Scholar]
  9. Baek, K.O.; Choi, Y.H.; Lim, D.H. A Plan for Preventing Disaster by Water at Imjin River; Gyeonggi Research Institute: Suwon-si, Korea, 2010; pp. 9–13. [Google Scholar]
  10. Carroll, M.L.; Townshend, J.R.; DiMiceli, C.M.; Noojipady, P.; Sohlberg, R.A. A new global raster water mask at 250 m resolution. Int. J. Dig. Earth 2009, 2, 291–308. [Google Scholar] [CrossRef]
  11. Feng, L.; Hu, C.; Chen, X.; Cai, X.; Tian, L.; Gan, W. Assessment of inundation changes of Poyang Lake using MODIS observations between 2000 and 2010. Remote Sens. Environ. 2012, 121, 80–92. [Google Scholar] [CrossRef]
  12. Huang, C.; Chen, Y.; Wu, J. Mapping spatio-temporal flood inundation dynamics at large river basin scale using time-series flow data and MODIS imagery. Int. J. App. Earth Obs. Geoinf. 2014, 26, 350–362. [Google Scholar] [CrossRef]
  13. Hui, F.; Xu, B.; Huang, H.; Yu, Q.; Gong, P. Modelling spatial-temporal change of Poyang Lake using multitemporal Landsat imagery. Int. J. Remote Sens. 2008, 29, 5767–5784. [Google Scholar] [CrossRef]
  14. Du, Z.; Li, W.; Zhou, D.; Tian, L.; Ling, F.; Wang, H.; Gui, Y.; Sun, B. Analysis of Landsat-8 OLI imagery for land surface water mapping. Remote Sens. Lett. 2014, 5, 672–681. [Google Scholar] [CrossRef]
  15. Rokni, K.; Ahmad, A.; Selamat, A.; Hazini, S. Water feature extraction and change detection using multitemporal Landsat imagery. Remote Sens. 2014, 6, 4173–4189. [Google Scholar] [CrossRef] [Green Version]
  16. Drusch, M.; Del Bello, U.; Carlier, S.; Colin, O.; Fernandez, V.; Gascon, F.; Hoersch, B.; Isola, C.; Laberinti, P.; Martimort, P. Sentinel-2: ESA’s optical high-resolution mission for GMES operational services. Remote Sens. Environ. 2012, 120, 25–36. [Google Scholar] [CrossRef]
  17. McFeeters, S.K. The use of the Normalized Difference Water Index (NDWI) in the delineation of open water features. Int. J. Remote Sens. 1996, 17, 1425–1432. [Google Scholar] [CrossRef]
  18. Xu, H. Modification of normalised difference water index (NDWI) to enhance open water features in remotely sensed imagery. Int. J. Remote Sens. 2006, 27, 3025–3033. [Google Scholar] [CrossRef]
  19. Bae, D.H.; Ahn, J.H.; Heo, J.H. Standard Guidelines for Flood Estimation; Ministry of Environment: Sejong-si, Korea, 2019.
  20. Gwon, O.I.; Sim, M.P. Reservoir operation at flood time by transformed reservoir flood(TRF) reservoir operation method(ROM). J. Korea Water Res. Ass. 1998, 31, 105–113. [Google Scholar]
  21. Fu, D.Z.; Li, Y.P.; Huang, G.H. A factorial-based dynamic analysis method for reservoir operation under fuzzy-stochastic uncertainties. Water Res. Manag. 2013, 27, 4591–4610. [Google Scholar] [CrossRef]
  22. Unver, O.I.; Mays, L.W. Model for real-time optimal flood control operation of a reservoir system. Water Res. Manag. 1990, 4, 21–46. [Google Scholar] [CrossRef]
Figure 1. The location of the Imjin River basin including the Hwanggang Dam and Gunnam Flood Control Reservoir.
Remotesensing 14 03699 g001
Figure 2. The Thiessen polygon of the Imjin River basin using weather stations in North Korea.
Remotesensing 14 03699 g002
Figure 3. The contour map of the Hwanggang Dam reservoir in North Korea.
Remotesensing 14 03699 g003
Figure 4. The water level–surface area–storage relationship from the digital elevation model of the Hwanggang Dam reservoir. (a) The water level–surface area relationship for the satellite-based water surface area. (b) The water level–storage relationship for the characteristic analysis of the reservoir.
Remotesensing 14 03699 g004
Figure 5. The process of water body detection using Sentinel-2 imageries.
Remotesensing 14 03699 g005
Figure 6. The near-infrared imagery of the raw Sentinel-2 images (left) and the NDWI water body detection images (right) for water surface variation monitoring.
Remotesensing 14 03699 g006
Figure 7. A comparison of the histograms for Sentinel-2 (Band 8) (left) and NDWI (right) images; highlighted number represents a threshold of the water body.
Remotesensing 14 03699 g007
Figure 8. The sub-basin delineation and drainage network in the study area.
Remotesensing 14 03699 g008
Figure 9. The flow chart of the Auto ROM algorithm for the Hwanggang Dam reservoir.
Remotesensing 14 03699 g009
Figure 10. The time series of cumulative monthly areal rainfall in the Imjin River basin.
Remotesensing 14 03699 g010
Figure 11. The continuous simulation of the water level using the Auto ROM algorithm for the Hwanggang Dam reservoir; the blue line represents the water level variability from the reservoir operation method; the red dot represents the water level derived by Sentinel-2 images; the red line represents the dam inflow from the rainfall–runoff model.
Remotesensing 14 03699 g011
Figure 12. The time series simulation of the Gunnam Flood Control Reservoir; the red dashed line represents the release from the Hwanggang Dam derived by the Auto-ROM algorithm; the blue dashed line represents the runoff from the basin between the Hwanggang Dam and the Gunnam Dam; the purple line represents the flood inflow of Gunnam Flood Control Reservoir by simulation; the green line represents the observed inflow of the Gunnam Flood Control Reservoir. The sum of the red and blue dashed line contributes eventually to the inflow to the Gunnam Dam.
Remotesensing 14 03699 g012
Table 1. Th weights of the weather stations for the Thiessen polygon in the study area.
LocationYangdeokWonsanSingyePyeonggangGaesung
Upstream of Hwanggang Dam0.2250.1840.2100.381-
Downstream of Hwanggang Dam--0.0990.7870.114
Table 2. The spectral bands and spatial resolution of the Sentinel-2 sensors used for the NDWI calculation.
Sentinel-2 BandSentinel-2ASentinel-2BSpatial
Resolution
(m)
Central Wavelength (nm)Bandwidth
(nm)
Central Wavelength (nm)Bandwidth
(nm)
Band 3 (Green)559.836559.03610
Band 8 (NIR)832.8106832.910510
Band 12 (SWIR)2202.11752185.718520
Table 3. The sub-basin characteristics in the study area.
No.Basin NameArea
(km2)
River Length
(km)
Elevation of the
Farthest Point
(EL.m)
Elevation of Outlet Point
(EL.m)
01Upstream of Imjin River1101.585.01285140
02Upstream of Gomitan Stream1093.7108.61086140
03Icheon water level sta.666.157.471467
04Upstream of Pyeongan Stream404.780.0108652
05Confluence of Yeockok Stream244.845.361242
06Lake Bongrae 498.873.049142
07Gumnam Flood Control Reservoir183.021.132635
Table 4. The parameters of the Clark unit hydrograph and Muskingum flow routing.
No.Basin NameClark Unit HydrographMuskingum Flow Routing
Tc (hr)K (hr)C0C1C2
01Upstream of Imjin River6.609.210.02660.41600.5575
02Upstream of Gomitan Stream8.6611.980.01620.40970.5741
03Icheon water level sta.4.846.790.03160.41900.5494
04Upstream of Pyeongan Stream6.308.640.03680.42210.5412
05Confluence of Yeockok Stream3.885.39---
06Lake Bongrae 6.498.970.03030.41820.5515
07Gumnam Flood Control Reservoir1.992.84---
Table 5. The operational conditionsfor the Auto ROM algorithm for the Hwanggang Dam reservoir.
ParameterHigh Water LevelLow Water LevelConstant Release
Nov~DecJan~Oct
State value107.0 EL.m80.0 EL.m20.0 m3/s35.0 m3/s
Table 6. The evaluation of the satellite-based water level and simulated water level.
Index2017201820192020
(~Aug)
Total
R20.940.470.970.750.76
RMSE3.075.812.253.183.97
Publisher’s Note: MDPI stays neutral with regard to jurisdictional claims in published maps and institutional affiliations.

