
Intercomparison of Cloud Vertical Structures over Four Different Sites of the Eastern Slope of the Tibetan Plateau in Summer Using Ka-Band Millimeter-Wave Radar Measurements


Abstract
:
1. Introduction
2. Data and Methodology
2.1. Radar Observations and ERA5 Reanalysis Data
2.2. Radar Data Quality Control
2.3. Profile Classification
3. Results
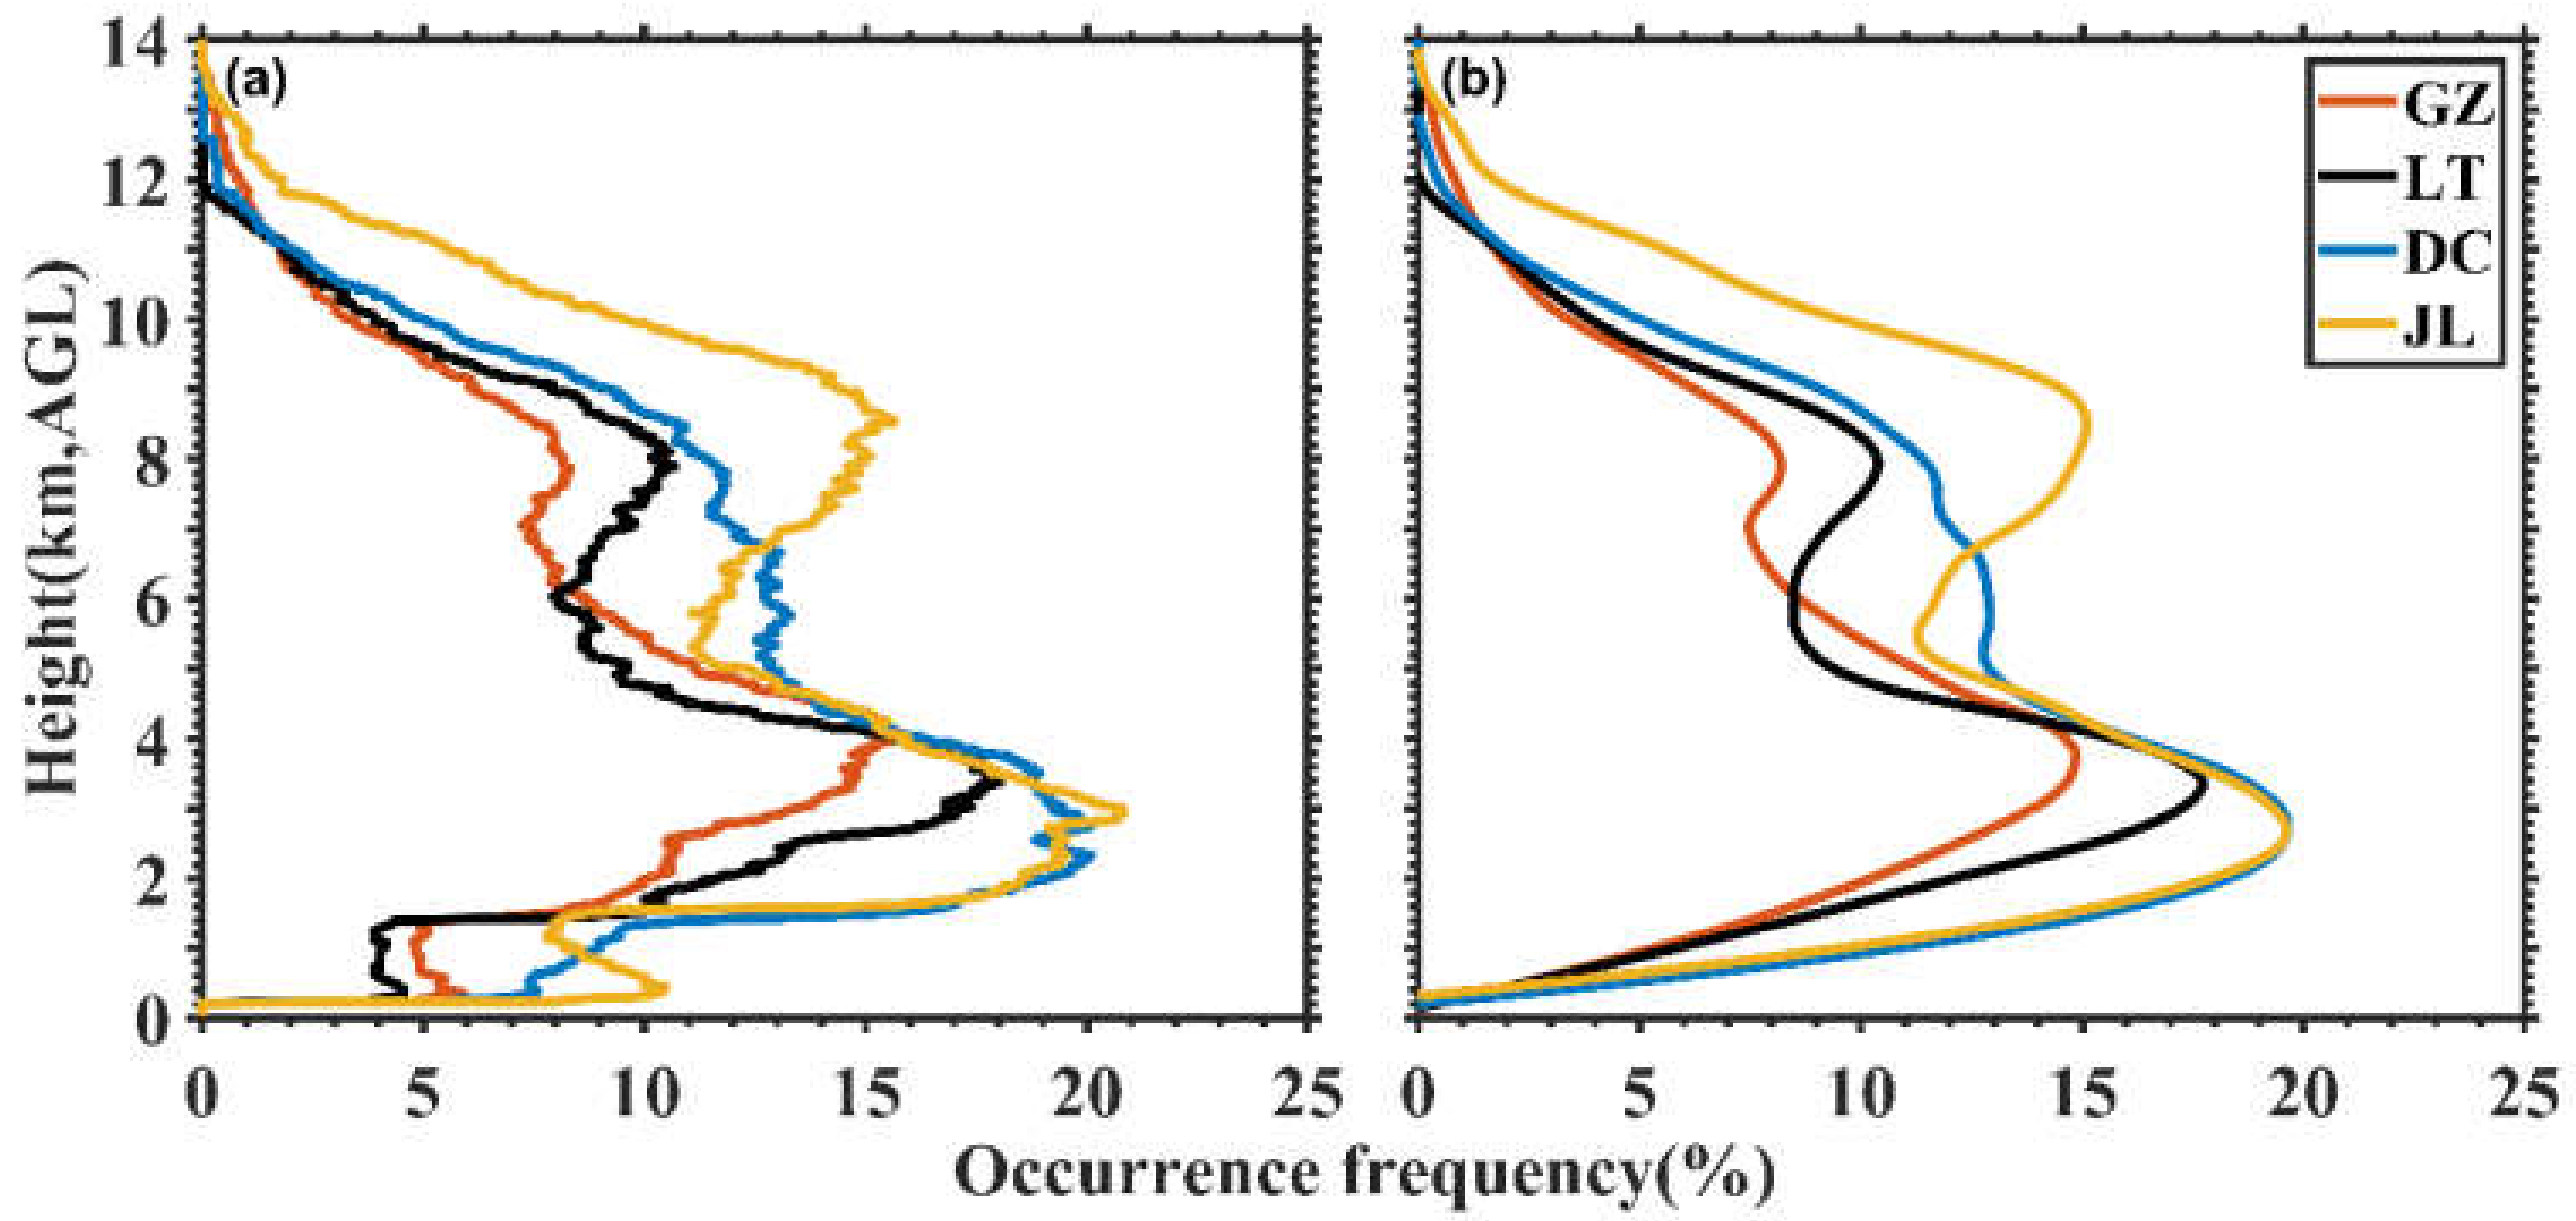
3.1. Cloud Occurrence Frequency
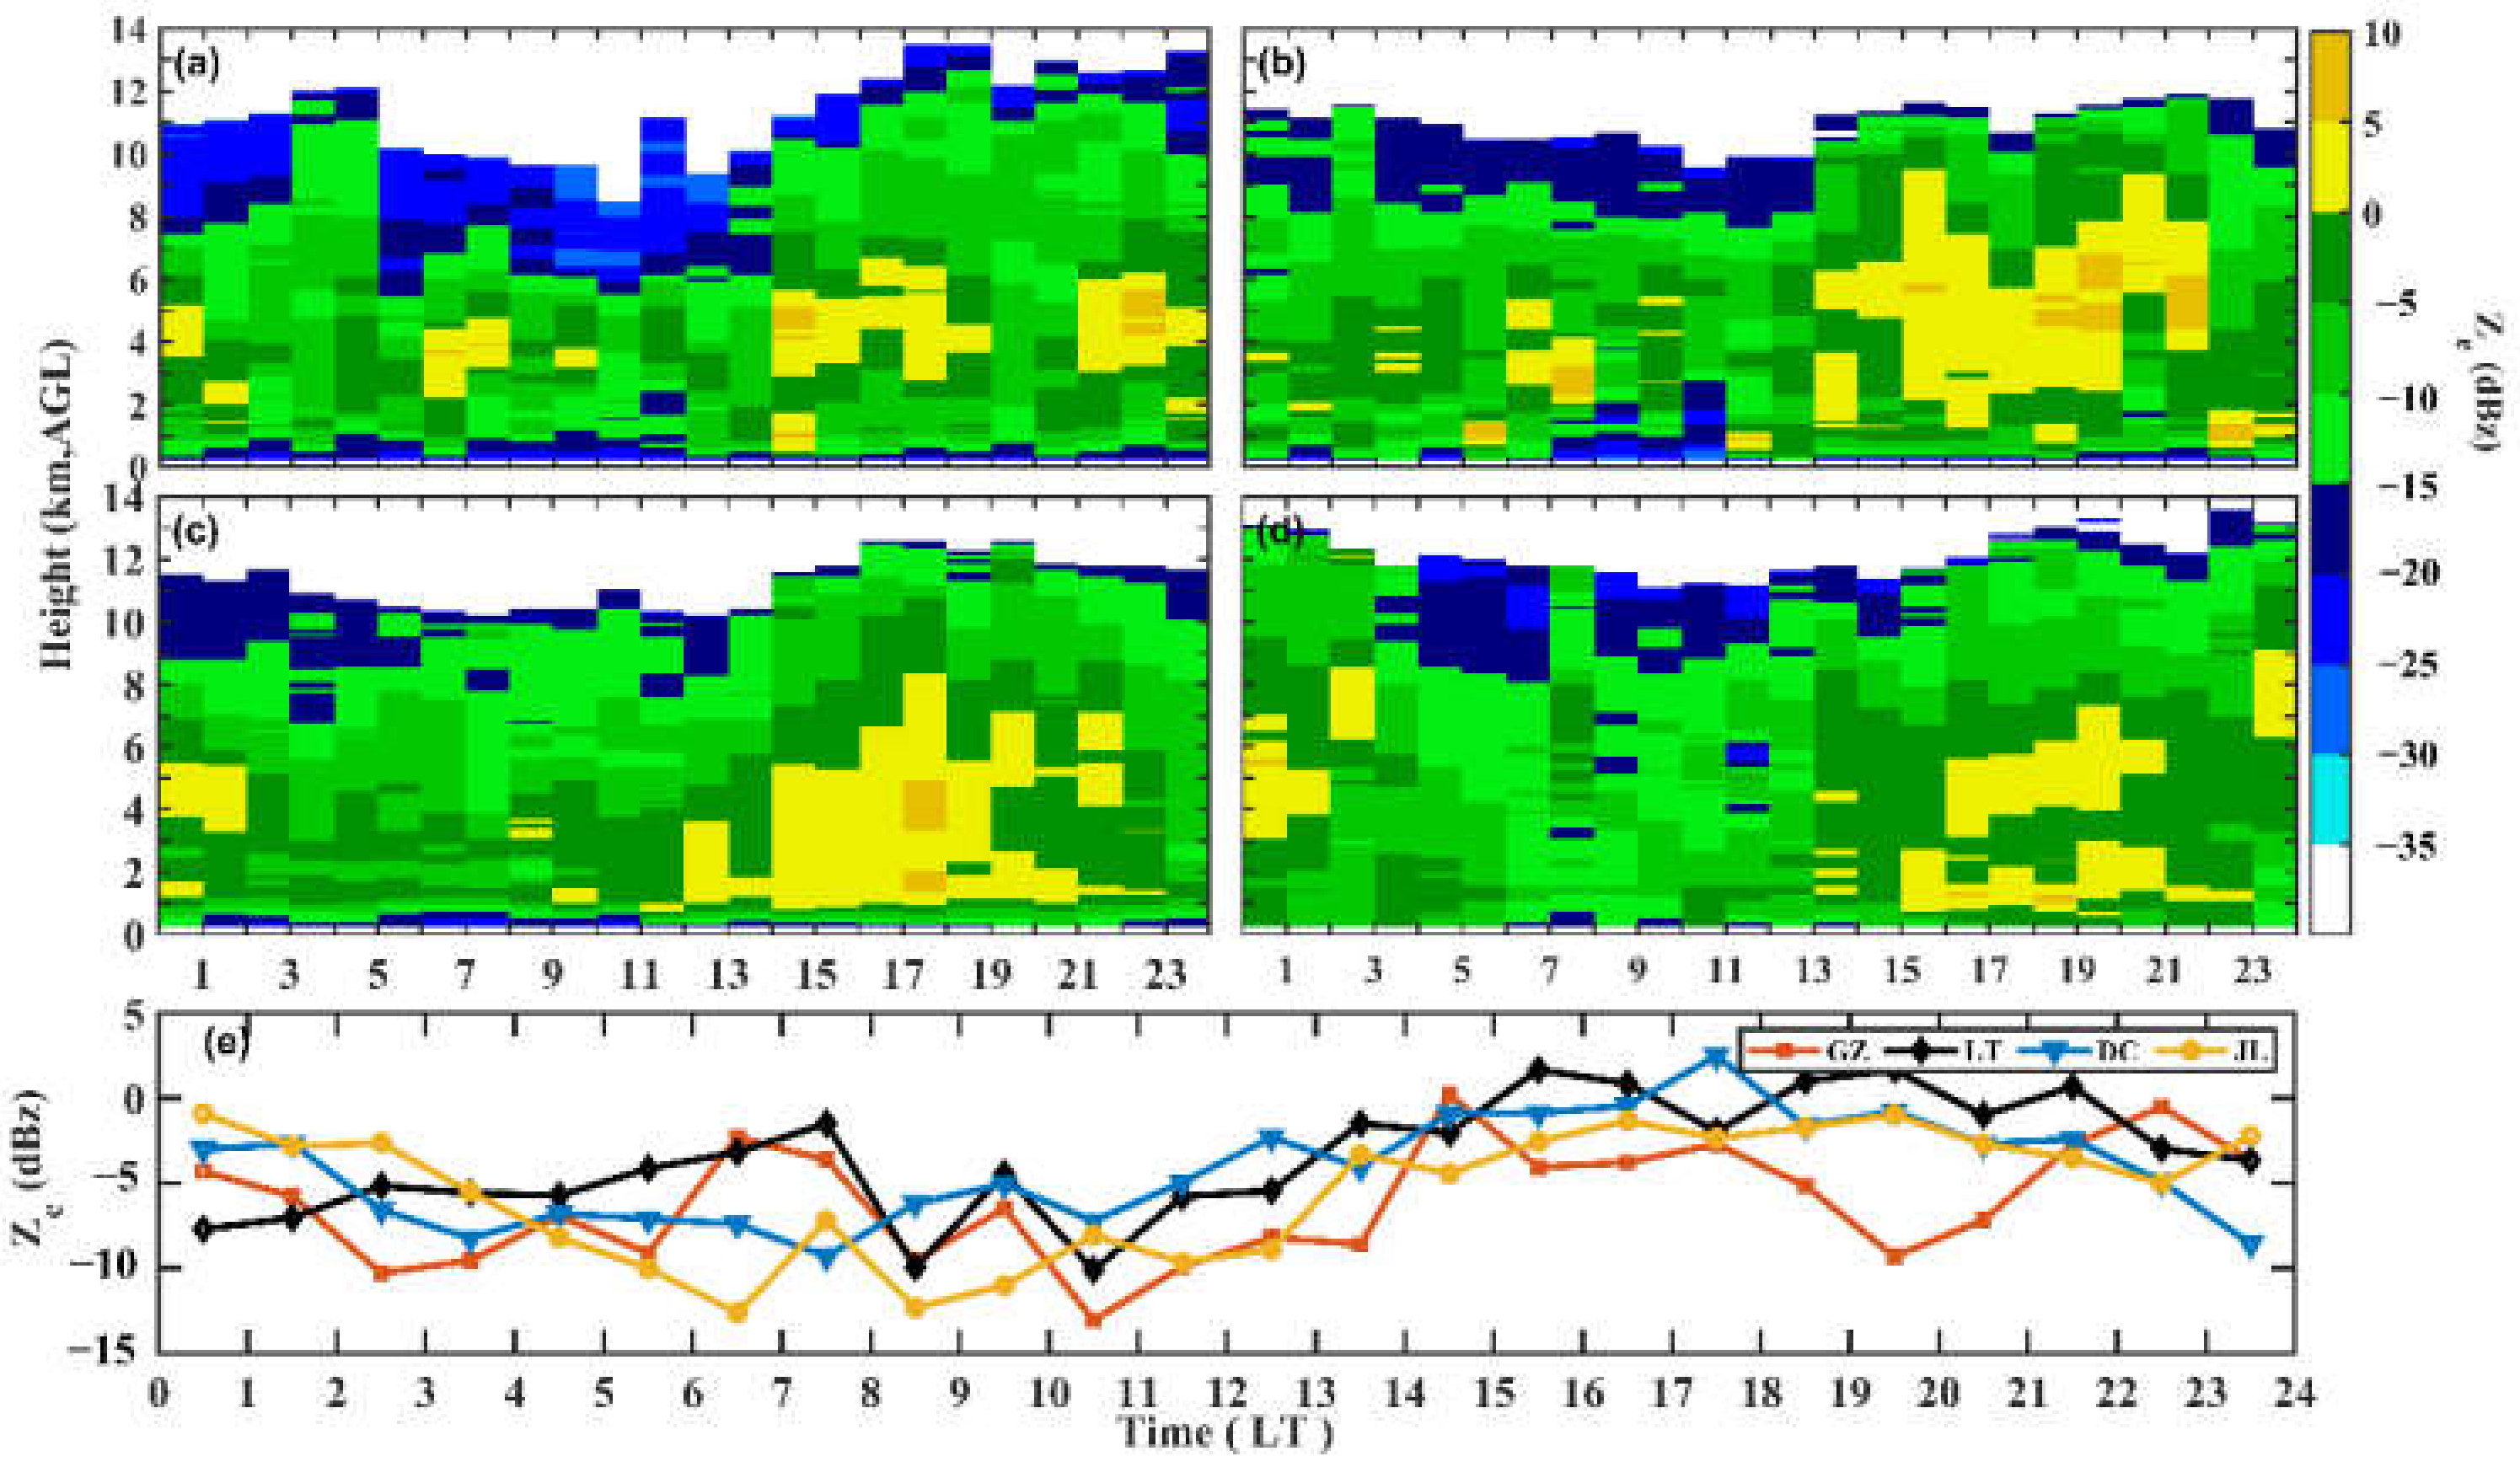
3.2. Radar Reflectivity Factor
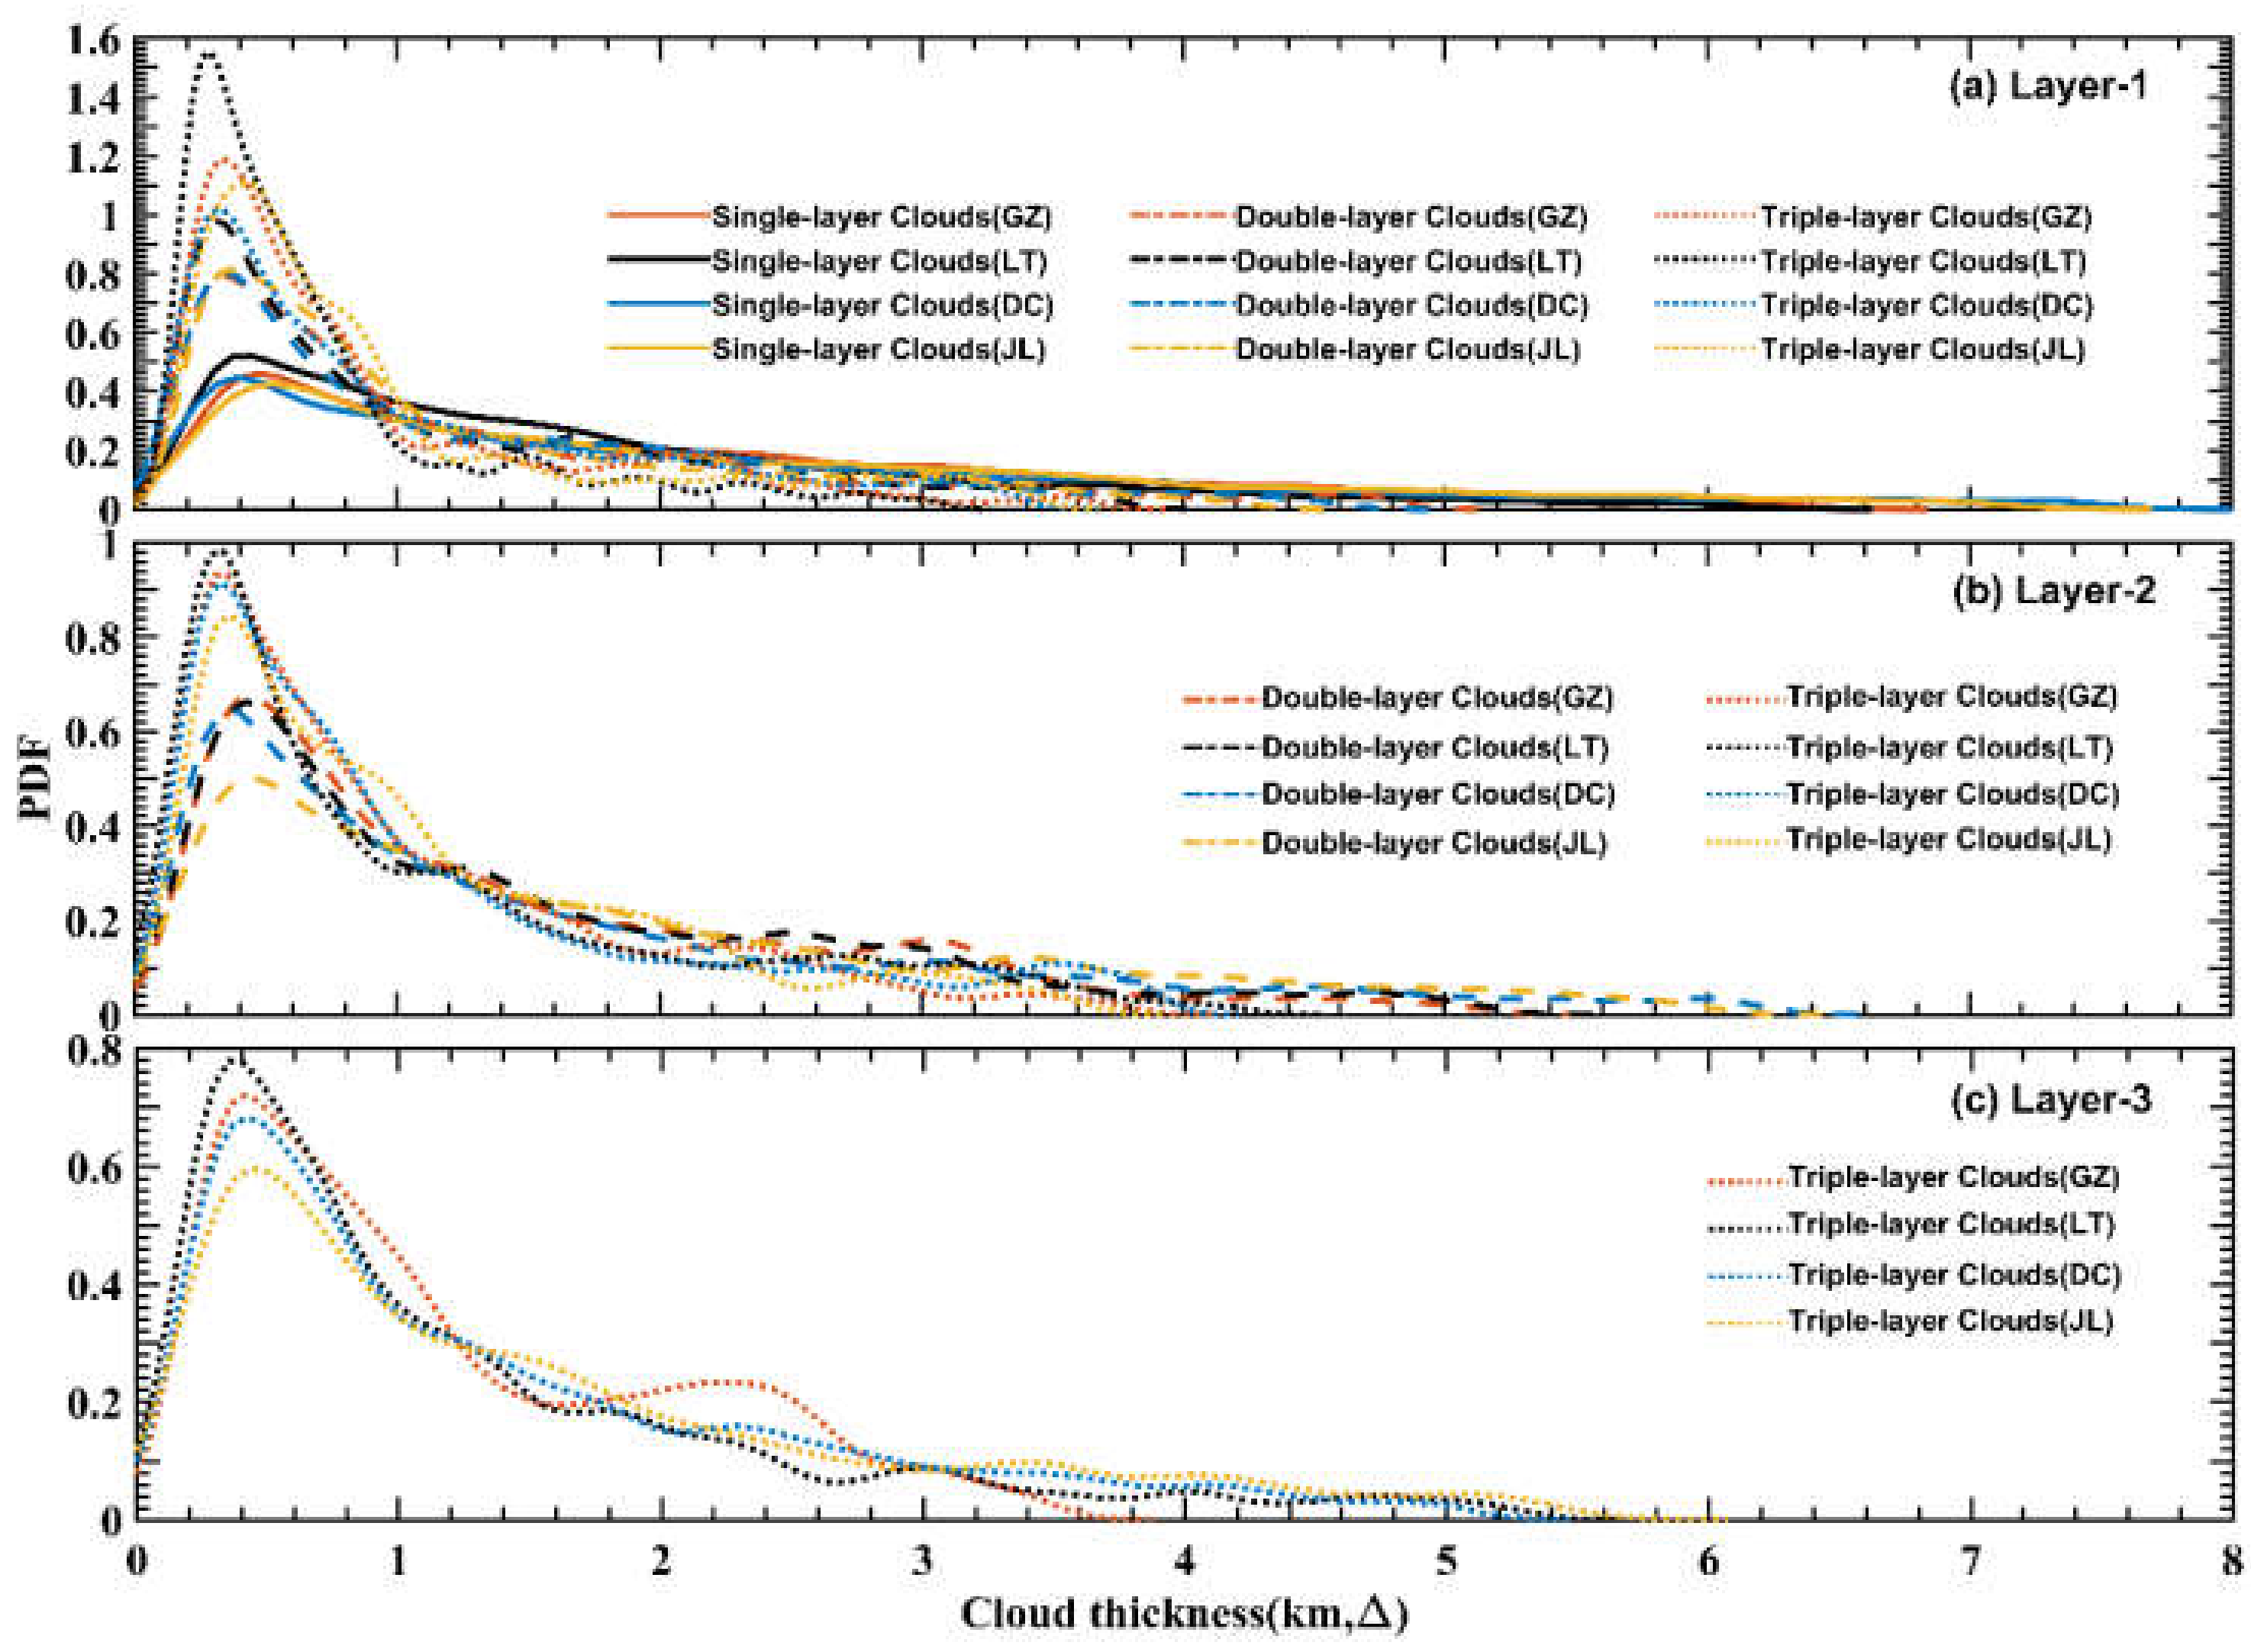
3.3. Cloud Macroscopic Parameters
4. Discussion and Comparison
5. Conclusions
Author Contributions
Funding
Data Availability Statement
Acknowledgments
Conflicts of Interest
References
- Qiu, J. China: The third pole. Nat. News 2008, 454, 393–396. [Google Scholar] [CrossRef] [PubMed] [Green Version]
- Liu, Y.; Bao, Q.; Duan, A.; Qian, Z.; Wu, G. Recent progress in the impact of the Tibetan Plateau on climate in China. Adv. Atmos. Sci. 2007, 24, 1060–1076. [Google Scholar] [CrossRef]
- Michio, Y.N.; Li, C.F.; Song, Z.S. Seasonal heating of the Tibetan plateau and its effects on the evolution of the Asian summer monsoon. J. Meteor. Soc. Jpn. 1992, 70, 319–351. [Google Scholar]
- Fujinami, H.; Yasunari, T. The effects of midlatitude wave over and around the Tibetan Plateau on submonthly variability of the East Asian summer monsoon. Mon. Wea. Rev. 2009, 137, 2286–2304. [Google Scholar] [CrossRef]
- Fan, Y.Y.; Li, G.P.; Lu, H.G. Impacts of abnormal heating of Tibetan Plateau on Rossby wave activity and hazards related to snow and ice in South China. Adv. Meteor. 2015, 2015, 87847. [Google Scholar] [CrossRef]
- Li, L.; Zhang, R.H.; Wen, M.; Duan, J.P. Development and eastward movement mechanism of the Tibetan Plateau vortices moving off the Tibetan Plateau. Clim. Dyn. 2019, 52, 4849–4859. [Google Scholar] [CrossRef]
- Tan, L.; Cai, Y.; Cheng, H.; Edwards, L.R.; Lan, J.; Zhang, H.; Li, D.; Ma, L.; Zhao, P.; Gao, Y. High resolution monsoon precipitation changes on southeastern Tibetan Plateau over the past 2300 years. Quat. Sci. Rev. 2018, 195, 122–132. [Google Scholar] [CrossRef]
- Luo, Y.L.; Zhang, R.H.; Qian, W.M.; Luo, Z.Z.; Hu, X. Intercomparison of Deep Convection over the Tibetan Plateau–Asian Monsoon Region and Subtropical North America in Boreal Summer Using CloudSat/CALIPSO Data. J. Clim. 2011, 24, 2164–2177. [Google Scholar] [CrossRef] [Green Version]
- Qie, X.S.; Wu, X.K.; Yuan, T.; Bian, J.C.; Lu, D.R.S. Comprehensive Pattern of Deep Convective Systems over the Tibetan Plateau–South Asian Monsoon Region Based on TRMM Data. J. Clim. 2014, 27, 6612–6626. [Google Scholar] [CrossRef]
- Yan, Y.F.; Liu, Y.M. Vertical structures of convective and stratiform clouds in boreal summer over the Tibetan Plateau and its neighboring regions. Adv. Atmos. Sci. 2019, 36, 1089–1102. [Google Scholar] [CrossRef]
- Zhang, F.; Yu, Q.R.; Mao, J.L.; Dan, C.; Wang, Y.Y.; He, Q.S.; Cheng, T.T.; Chen, C.H.; Liu, D.W.; Gao, Y.P. Possible mechanisms of summer cirrus clouds over the Tibetan Plateau. Atmos. Chem. Phys. 2020, 20, 11799–11808. [Google Scholar] [CrossRef]
- Yu, L.; Fu, Y.F.; Yang, Y.; Pan, X.; Tan, R. Trumpet-shaped topography modulation of the frequency, vertical structures, and water path of cloud systems in the summertime over the southeastern Tibetan Plateau: A perspective of daytime–nighttime differences. J. Geophys. Res. Atmos. 2020, 125, e2019JD031803. [Google Scholar] [CrossRef]
- Chen, D.D.; Guo, J.P.; Wang, H.Q.; Li, J.; Min, M.; Zhao, W.H.; Yao, D. The cloud top distribution and diurnal variation of clouds over East Asia: Preliminary results from Advanced Himawari Imager. J. Geophys. Res. Atmos. 2018, 123, 3724–3739. [Google Scholar] [CrossRef]
- Guo, J.P.; Liu, H.; Wang, F.; Huang, J.F.; Xia, F.; Lou, M.Y.; Wu, Y.R.; Jiang, J.H.; Xie, T.; Yung, Y.L.; et al. Three-dimensional structure of aerosol in China: A perspective from multi-satellite observations. Atmos. Res. 2016, 178–179, 580–589. [Google Scholar] [CrossRef]
- Gray, W.M.; Jacobson, R.W. Diurnal variation of deep cumulus convection. Mon. Wea. Rev. 1977, 105, 1171–1188. [Google Scholar] [CrossRef]
- Hendon, H.; Woodberry, K. The diurnal cycle of tropical convection. J. Geophys. Res. 1993, 98, 162623–162637. [Google Scholar] [CrossRef]
- Fu, Y.F.; Liu, G.S. Possible misidentification of rain type by TRMM PR over Tibetan Plateau. J. Appl. Meteorol. Climatol. 2007, 46, 667–672. [Google Scholar] [CrossRef]
- Liu, B.; Huo, J.; Lu, D.R.; Wang, X. Assessment of FY-4A and Himawari-8 cloud top height retrieval through comparison with ground-based millimeter radar at sites in Tibet and Beijing. Adv. Atmos. Sci. 2021, 38, 1334–1350. [Google Scholar] [CrossRef]
- Zhang, J.J.; Zhu, B.Z.; Zhu, F.K. Tibetan Plateau Meteorological Progresses; Science Press: Beijing, China, 1988; p. 268. (In Chinese) [Google Scholar]
- Zhou, M.Y.; Xu, X.D.; Bian, L.G.; Chen, J.Y.; Liu, H.Z.; Zhang, H.S.; Li, S.M. The Observation, Diagnosis and Dynamics of the Atmospheric Boundary over the Tibetan Plateau; Meteorological Press: Beijing, China, 2000; 125p. (In Chinese) [Google Scholar]
- Zhao, P.; Xu, X.; Chen, F.; Guo, X.; Zheng, X.; Liu, L.; Hong, Y.; Li, Y.; La, Z.; Peng, H.; et al. The Third Atmospheric Scientific Experiment for understanding the Earth–atmosphere coupled system over the Tibetan Plateau and its effects. Bull. Amer. Meteor. Soc. 2018, 99, 757–776. [Google Scholar] [CrossRef]
- Zhao, C.F.; Liu, L.P.; Wang, Q.Q.; Qiu, Y.M.; Wang, Y.; Wu, X.L. MMCR-based characteristic properties of non-precipitating cloud liquid droplets at Naqu site over Tibetan Plateau in July 2014. Atmos. Res. 2017, 190, 68–76. [Google Scholar] [CrossRef]
- Wang, H.; Guo, X.L. Comparative Analyses of Vertical Structure of Deep Convective Clouds Retrieved from Satellites and Ground-Based Radars at Naqu over the Tibetan Plateau. J. Meteorol. Res. 2019, 33, 446–462. [Google Scholar] [CrossRef]
- Liu, L.P.; Gao, W.H. Statistical Analysis of Microphysical and Dynamical Parameters for Clouds and Precipitation over Nauq Tibetan Plateau in Summertime Using Ka-band Cloud Radar. Atmosphere 2020, 11, 818. [Google Scholar] [CrossRef]
- Uyeda, H.; Yamada, H.; Horikomi, J.; Shirooka, R.; Shimizu, S.; Liu, L.P.; Ueno, K.I.; Fujii, H.; Koike, T. Characteristics of Convective Clouds Observed by a Doppler Radar at Naqu on Tibetan Plateau during the GAME-Tibet IOP. J. Meteorol. Soc. Jpn. Ser. 2001, 79, 463–474. [Google Scholar] [CrossRef] [Green Version]
- Ma, Y.M.; Yao, T.D.; Wan, J.M. Experimental study of energy and water cycle in Tibetan Plateau—The progress introduction on the study of GAME/Tibet and CAMP/Tibet. Plateau Meteorol. 2006, 25, 344–351. (In Chinese) [Google Scholar]
- Chen, Y.L.; Zhang, A.Q.; Zhang, Y.H.; Cui, C.G.; Wan, R.; Wang, B.; Fu, Y.F. A heavy precipitation event in the Yangtze River Basin led by an eastward moving Tibetan Plateau cloud system in the summer of 2016. J. Geophys. Res. Atmospheres 2020, 125, e2020JD032429. [Google Scholar] [CrossRef]
- Wan, X.; Xu, G.R.; Wan, R.; Wang, B.; Ren, J.; Luo, C. Vertical structure of non-precipitation cloud obtained from cloud radar observation at Ganzi in the eastern Qinghai-Tibet Plateau. Torrent. Rain Dis. 2020, 39, 442–450. (In Chinese) [Google Scholar]
- Fu, S.M.; Mai, Z.; Sun, J.H.; Li, W.L.; Ding, Y.; Wang, Y.Q. Impacts of convective activity over the Tibetan Plateau on plateau vortex, southwest vortex, and downstream precipitation. J. Atmos. Sci. 2019, 76, 3803–3830. [Google Scholar] [CrossRef]
- Liu, L.P.; Zheng, J.F. Algorithms for Doppler Spectral Density Data Quality Control and Merging for the Ka-Band Solid-State Transmitter Cloud Radar . Remote Sens. 2019, 11, 209. [Google Scholar] [CrossRef] [Green Version]
- Clothiaux, E.E.; Ackerman, T.P.; Mace, G.G.; Moran, K.P.; Marchand, R.T.; Miller, M.A.; Martner, B.E. Objective determination of cloud heights and radar reflectivities using a combination of active remote sensors at the ARM CART sites. J. Appl. Meteorol. 2000, 39, 645–665. [Google Scholar] [CrossRef]
- Geerts, B.; Miao, Q. The use of millimeter Doppler radar echoes to estimate vertical air velocities in the fair-weather convective boundary layer. J. Atmos. Ocean. Technol. 2005, 22, 225–246. [Google Scholar] [CrossRef]
- Görsdorf, U.; Lehmann, V.; Bauer-Pfundstein, M.; Peters, G.; Vavriv, D.; Vinogradov, V.; Volkov, V. A 35-GHz polarimetric Doppler radar for long-term observations of cloud parameters-description of system and data processing. J. Atmos. Oceanic Technol. 2015, 32, 675–690. [Google Scholar] [CrossRef]
- Zheng, J.F.; Liu, L.P.; Zeng, Z.M.; Xie, X.; Wu, J.; Feng, K. Ka-band millimeter wave cloud radar data quality control. J. Infrared Millim. Waves 2016, 35, 748–757. (In Chinese) [Google Scholar]
- Moran, K.P.; Martner, B.E.; Post, M.J.; Kropfli, R.A.; Welsh, D.C.; Widener, K.B. An unattended cloud-profiling radar for use in climate research. Bull. Am. Meteorol. Soc. 1998, 79, 443–455. [Google Scholar] [CrossRef] [Green Version]
- Hollars, S.; Fu, Q.; Comstock, J.; Ackerman, T. Comparison of cloud-top height retrievals from ground-based 35 GHz MMCR and GMS-5 satellite observations at ARM TWP Manus site. Atmos. Res. 2004, 72, 169–186. [Google Scholar] [CrossRef]
- Kollias, P.; Clothiaux, E.E.; Miller, M.A.; Albrecht, B.A.; Stephens, G.L.; Ackerman, T.P. Millimeter-wavelength radar: New frontier in atmospheric cloud and precipitation research. Bull. Am. Meteorol. Soc. 2007, 88, 1608–1624. [Google Scholar] [CrossRef] [Green Version]
- Oh, S.B.; Kim, Y.H.; Kim, K.H.; Cho, C.H.; Lim, E. Verification and correction of cloud base and top height retrievals from Ka-band cloud radar in Boseong, Korea. Adv. Atmos. Sci. 2016, 33, 73–84. [Google Scholar] [CrossRef]
- Liu, L.P.; Zheng, J.F.; Ruan, Z.; Cui, Z.H.; Hu, Z.Q.; Wu, S.H.; Dai, G.Y.; Wu, Y.H. The preliminary analyses of the cloud properties over the Tibetan Plateau from the field experiments in clouds precipitation with the various radars. Acta Meteorol. Sin. 2015, 73, 635–647. (In Chinese) [Google Scholar]
- Li, G.P. Dynamic Meteorology of the Tibetan Plateau; China Meteorological Press: Beijing, China, 2021. (In Chinese) [Google Scholar]
- Liu, Y.J.; Ding, Y.H. Analysis of Basic Features of the Onset of the Asian Summer Monsoon. J. Meteorol. Res. 2007, 21, 257–276. [Google Scholar]
- Wang, Y.; Wang, C. Features of clouds and convection during the pre- and post-onset periods of the Asian summer monsoon. Theor. Appl. Climatol. 2006, 123, 551–564. [Google Scholar] [CrossRef]
- Reiter, E.R.; Gao, D.Y. Heating of the Tibet Plateau and movements of the South Asian high during spring, Mon. Weather. Rev. 1982, 110, 1694–1711. [Google Scholar] [CrossRef] [Green Version]
- Wu, G.X.; Liu, Y.M.; Wang, T.M.; Wan, R.J.; Liu, X.; Li, W.P.; Wang, Z.Z.; Zhang, Q.; Duan, A.M.; Liang, X.Y. The influence of the mechanical and thermal forcing of the Tibetan Plateau on the Asian climate. J. Hydrometeorol. 2007, 8, 770–789. [Google Scholar] [CrossRef] [Green Version]
- Li, Y.; Zhang, M. Cumulus over the Tibetan Plateau in the summer based on CloudSat–CALIPSO data. J. Clim. 2016, 29, 1219–1230. [Google Scholar] [CrossRef]
- Bouniol, D.; Couvreux, F.; Kamsu-Tamo, P.; Leplay, M.; Guichard, F.; Favot, F.; O’Connor, E.J. Diurnal and Seasonal Cycles of Cloud Occurrences, Types, and Radiative Impact over West Africa. J. Appl. Meteorol. Climatol. 2012, 51, 534–553. [Google Scholar] [CrossRef] [Green Version]
- Zhou, Z.R.; Wang, G.L.; Zhaxi, S.L. Cloud vertical structure measurements from a ground-based cloud radar over the southeastern Tibetan Plateau. Atmos. Res. 2021, 258, 105629. [Google Scholar] [CrossRef]
- Richard, J.D.; Dušan, S.Z. Doppler Radar and Weather Observations, 2nd ed; Dover Publications, Inc.: Mineola, NY, USA, 2006. [Google Scholar]
- Rogers, R.R.; Yau, M.K. A Short Course in Cloud Physics; Butterworth-Heinemann, Burlington: Oxford, UK, 1989; 82p. [Google Scholar]
- Zhang, Y.; Zhou, Q.; Lv, S.S.; Jia, S.Z.; Tao, F.; Chen, D.D.; Guo, J.P. Elucidating cloud vertical structures based on three-year Ka-band cloud radar observations from Beijing, China. Atmos. Res. 2019, 222, 88–99. [Google Scholar] [CrossRef]
- Wu, C.; Liu, L.P.; Zhai, X.C. The Comparison of Cloud Base Observations with Ka-Band Solid-State Transmitter-Based Millimeter Wave Cloud Radar and Ceilometer in Summer over Tibetan Plateau. Chin. J. Atmos. Sci. 2017, 41, 659–672. (In Chinese) [Google Scholar]
- Yan, Y.F.; Liu, Y.M.; Lu, J.H. Cloud vertical structure, precipitation, and cloud radiative effects over Tibetan Plateau and its neighboring regions. J. Geophys. Res. Atmos. 2016, 121, 5864–5877. [Google Scholar] [CrossRef] [Green Version]
- Wang, H.; Luo, Y.L.; Zhang, R.H. Analyzing seasonal variation of clouds over the Asian monsoon regions and the Tibetan Plateau region using CloudSat/CALIPSO data. Chin. J. Atmos. Sci. 2011, 35, 1117–1131. (In Chinese) [Google Scholar]
- World Meteorological Organization. International Cloud Atlas: Abridged atlas; WMO: Geneva, Switzerland, 1956. [Google Scholar]
- Bhatt, B.C.; Nakamura, K. A climatological-dynamical analysis associated with precipitation around the southern part of the Himalayas. J. Geophys. Res. 2006, 111, D02115. [Google Scholar] [CrossRef]
- Zhang, Y.; Zhang, L.J.; Guo, J.P.; Feng, J.M.; Cao, L.J.; Wang, Y.; Zhou, Q.; Li, L.X.; Li, B.; Xu, H.; et al. Climatology of cloud-base height from long-term radiosonde measurements in China. Adv. Atmos. Sci. 2018, 35, 158–168. [Google Scholar] [CrossRef]
- Wu, G.; Liu, Y.; He, B.; Bao, Q.; Duan, A.; Jin, F.F. Thermal controls on the Asian summer monsoon. Sci. Rep. 2012, 2, 404. [Google Scholar] [CrossRef] [PubMed] [Green Version]
- Duan, A.M.; Wu, G.X. Role of the Tibetan Plateau thermal forcing in the summer climate patterns over subtropical Asia. Clim. Dyn. 2005, 24, 793–807. [Google Scholar] [CrossRef]
- Cai, H.K.; Feng, X.; Chen, Q.L.; Sun, Y.; Wu, Z.M.; Tie, X. Spatial and Temporal Features of the Frequency of Cloud Occurrence over China Based on CALIOP. Adv. Meteorol. 2017, 2017, 4548357. [Google Scholar] [CrossRef] [Green Version]
- Guo, J.H.; Xue, H.W.; Liu, X.Y. Characteristics of Cloud Occurrence Frequency and Cloud Base Height in Summer over Beijing. Acta Sci. Nat. Univ. Pekin. 2015, 51, 718–724. (In Chinese) [Google Scholar]
- Ding, S.G.; Zhao, C.S.; Shi, G.Y.; Wu, C.A. Analysis of global total cloud amount variation over the past 20 years. J. Appl. Meteorol. Sci. 2005, 16, 670–677. (In Chinese) [Google Scholar]
- Wang, J.; Houze, R.A.; Fan, J.; Brodzik, S.R.; Feng, Z.; Hardin, J.C. The Detection of Mesoscale Convective Systems by the GPM Ku-Band Spaceborne Radar. J. Meteorol. Soc. Jpn. Ser. 2019, 97, 1059–1073. [Google Scholar] [CrossRef] [Green Version]


| Site | Latitude | Longitude | Altitude | |||
|---|---|---|---|---|---|---|
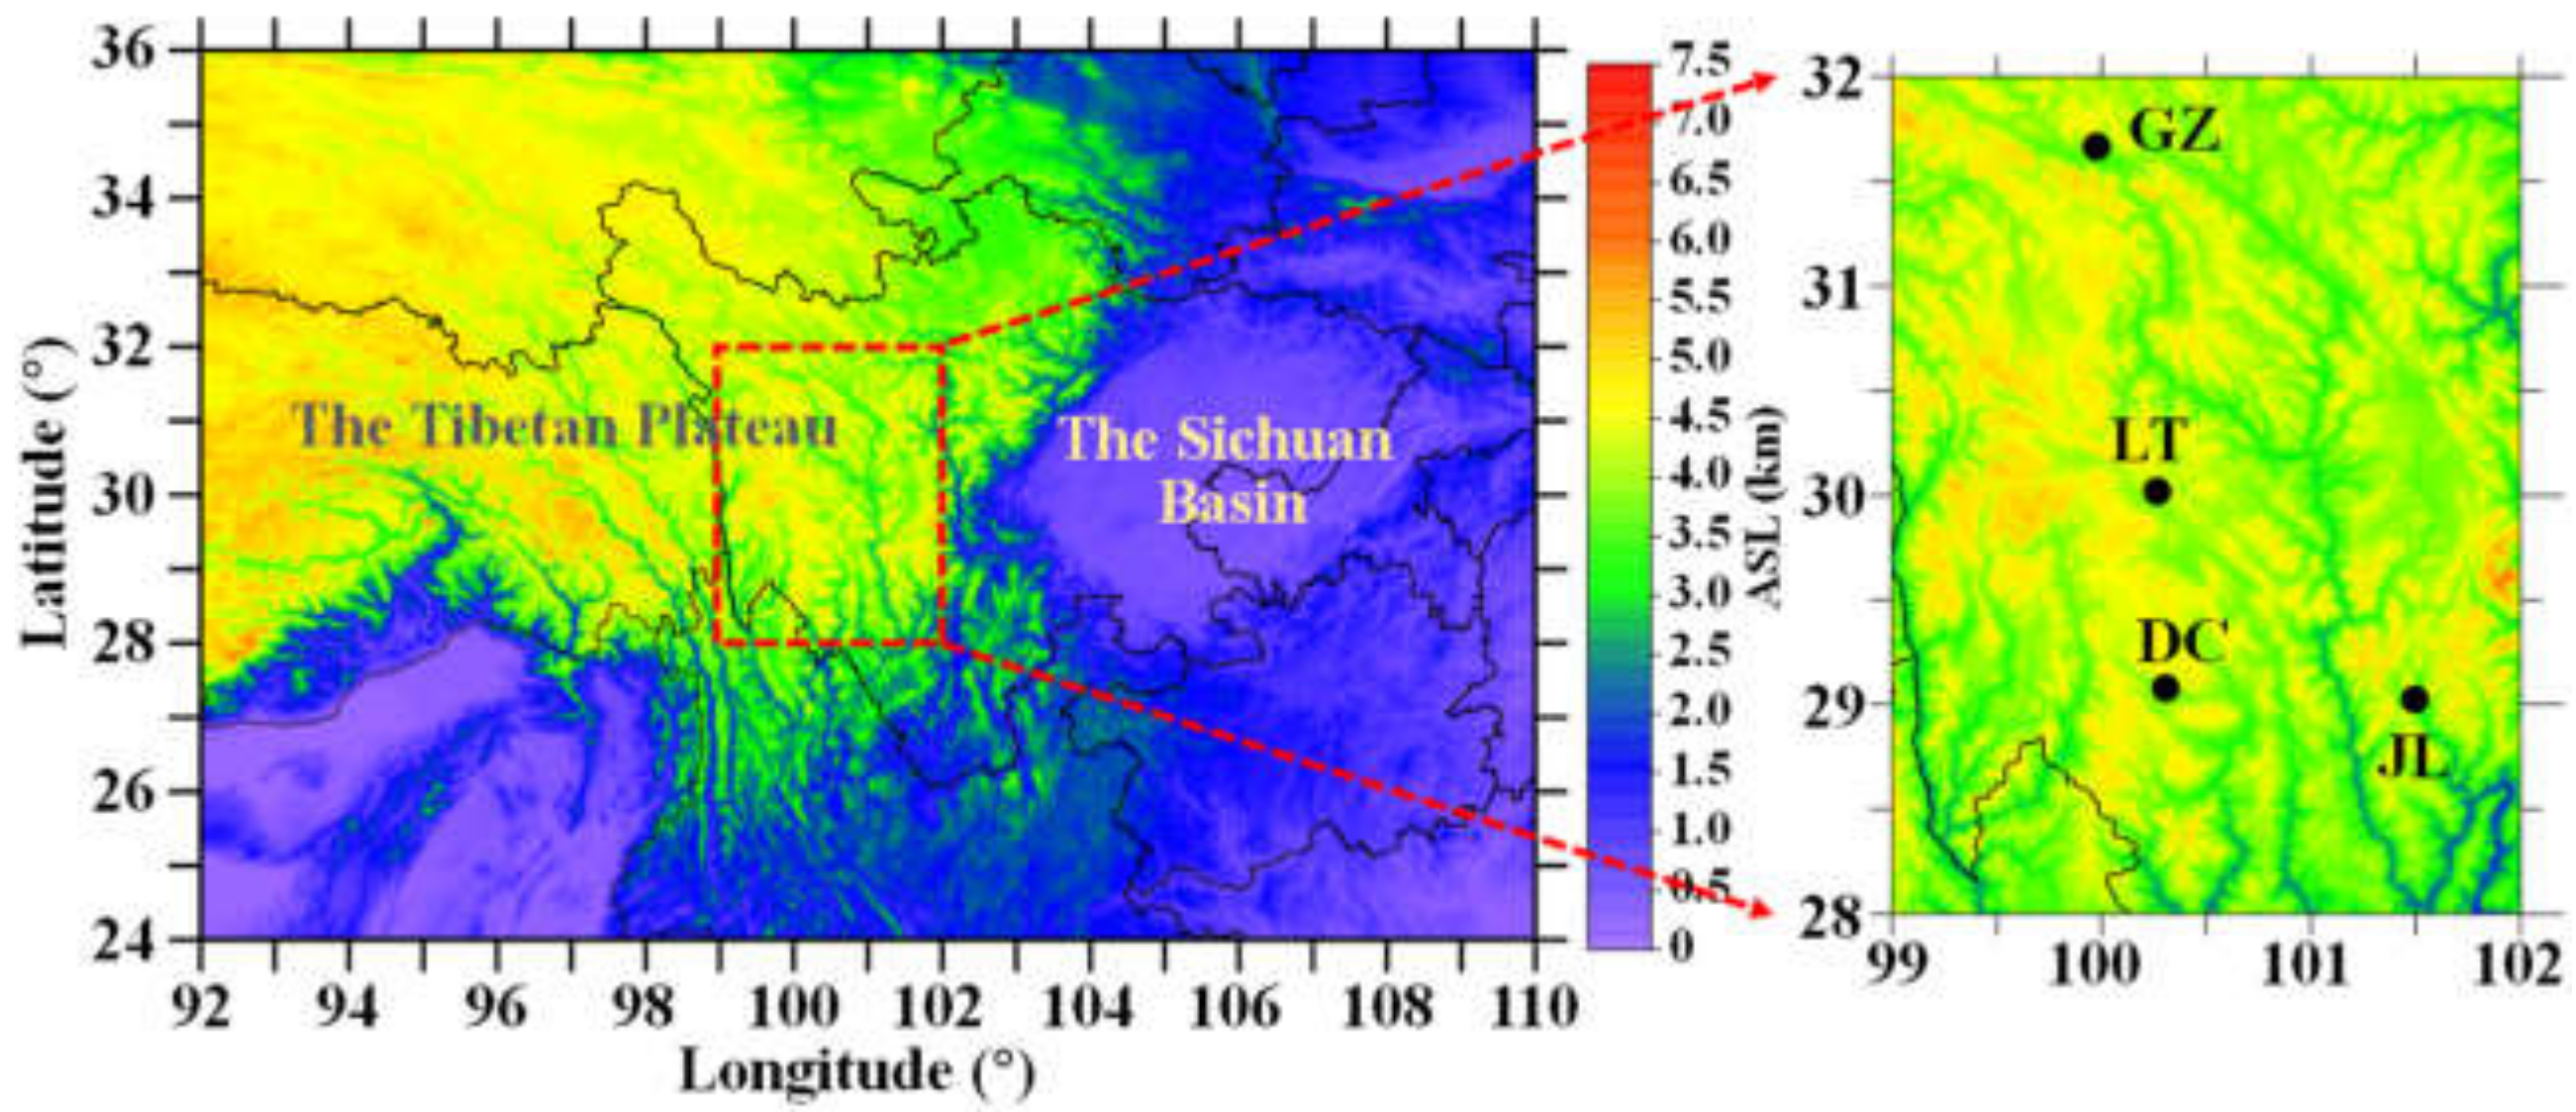
| GZ | 31.62°N | 100.00°E | 3395 m | 276,480 | 104,881 | 87,978 |
| LT | 30.00°N | 100.27°E | 3951 m | 276,480 | 114,047 | 104,316 |
| DC | 29.05°N | 100.30°E | 3727 m | 276,480 | 138,596 | 113,490 |
| JL | 29.00°N | 101.50°E | 2925 m | 276,480 | 144,892 | 121,938 |
Publisher’s Note: MDPI stays neutral with regard to jurisdictional claims in published maps and institutional affiliations. |
© 2022 by the authors. Licensee MDPI, Basel, Switzerland. This article is an open access article distributed under the terms and conditions of the Creative Commons Attribution (CC BY) license (https://creativecommons.org/licenses/by/4.0/).
Share and Cite
Wan, X.; Zheng, J.; Wan, R.; Xu, G.; Qin, J.; Yi, L. Intercomparison of Cloud Vertical Structures over Four Different Sites of the Eastern Slope of the Tibetan Plateau in Summer Using Ka-Band Millimeter-Wave Radar Measurements. Remote Sens. 2022, 14, 3702. https://doi.org/10.3390/rs14153702
Wan X, Zheng J, Wan R, Xu G, Qin J, Yi L. Intercomparison of Cloud Vertical Structures over Four Different Sites of the Eastern Slope of the Tibetan Plateau in Summer Using Ka-Band Millimeter-Wave Radar Measurements. Remote Sensing. 2022; 14(15):3702. https://doi.org/10.3390/rs14153702
Chicago/Turabian StyleWan, Xia, Jiafeng Zheng, Rong Wan, Guirong Xu, Jianfeng Qin, and Lan Yi. 2022. "Intercomparison of Cloud Vertical Structures over Four Different Sites of the Eastern Slope of the Tibetan Plateau in Summer Using Ka-Band Millimeter-Wave Radar Measurements" Remote Sensing 14, no. 15: 3702. https://doi.org/10.3390/rs14153702