Article

Satellite Imagery-Based Identification of High-Risk Areas of Schistosome Intermediate Snail Hosts Spread after Flood

1
Key Laboratory of Monitoring and Estimate for Environment and Disaster of Hubei Province, Innovation Academy for Precision Measurement Science and Technology, Chinese Academy of Sciences, Wuhan 430077, China
2
University of Chinese Academy of Sciences, Beijing 100049, China
3
Hubei Center for Disease Control and Prevention, Hubei Provincial Academy of Preventive Medicine, Wuhan 430079, China
4
Key Laboratory of Resources Conversion and Pollution Control of the State Ethnic Affairs Commission, College of Resources and Environmental Science, South-Central Minzu University, Wuhan 430074, China
*
Author to whom correspondence should be addressed.
Remote Sens. 2022, 14(15), 3707; https://doi.org/10.3390/rs14153707
Submission received: 27 May 2022 / Revised: 18 July 2022 / Accepted: 1 August 2022 / Published: 2 August 2022
(This article belongs to the Special Issue Remote Sensing and Infectious Diseases)

Abstract

:
Snail intermediate host monitoring and control are essential for interrupting the parasitic disease schistosomiasis. Identifying large-scale high-risk areas of snail spread after floods has been greatly facilitated by remote sensing imagery. However, previous studies have usually assumed that all inundation areas carry snails and may have overestimated snail spread areas. Furthermore, these studies only used a single environmental factor to estimate the snail survival risk probability, failing to analyze multiple variables, to accurately distinguish the snail survival risk in the snail spread areas. This paper proposes a systematic framework for early monitoring of snail diffusion to accurately map snail spread areas from remote sensing imagery and enhance snail survival risk probability estimation based on the snail spread map. In particular, the flooded areas are extracted using the Sentinel-1 Dual-Polarized Water Index based on synthetic aperture radar images to map all-weather flooding areas. These flood maps are used to extract snail spread areas, based on the assumption that only inundation areas that spatially interacted with (i.e., are close to) the previous snail distribution regions before flooding are identified as snail spread areas, in order to reduce the misclassification in snail spread area identification. A multiple logistic regression model is built to analyze how various types of snail-related environmental factors, including the normalized difference vegetation index (NDVI), wetness, river and channel density, and landscape fractal dimension impact snail survival, and estimate its risk probabilities in snail spread area. An experiment was conducted in Jianghan Plain, China, where snails are predominantly linearly distributed along the tributaries and water channels of the middle and lower reaches of the Yangtze River. The proposed method could accurately map floods under clouds, and a total area of 231.5 km2 was identified as the snail spread area. The snail survival risk probabilities were thus estimated. The proposed method showed a more refined snail spread area and a more reliable degree of snail survival risk compared with those of previous studies. Thus, it is an efficient way to accurately map all-weather snail spread and survival risk probabilities, which is helpful for schistosomiasis interruption.

1. Introduction

Schistosomiasis is a parasitic disease that remains prevalent in Africa, Asia, and South America, with an estimated burden of 1.4 million disability-adjusted life years in 2017 [1,2]. It is caused by trematode worms of the genus Schistosoma, which depend on snail intermediate hosts for their life cycle [2]. Targeting snails has proven to be a key to successful schistosomiasis control [3,4] and is included in the World Health Organization (WHO)’s new guidelines for schistosomiasis control programs [5]. As either aquatic or amphibious, snails are closely related to water environments and can spread to surrounding areas along with floods or floating objects, thus increasing schistosomiasis transmission risk [6,7,8,9]. Carrying out snail monitoring and early warning, transmission risk assessment, and timely risk detection is essential for snail control.
Floods can cause river intrusion, river embankment bursts, and floodplain expansion. Subsequently, snail populations expand with water flow and are redistributed in new suitable environments, which is the direct cause of the formation of new endemic areas or the re-emergence of schistosomiasis in areas where it had been previously under control [6,10,11,12]. In the process of snail diffusion with floods, two conditions are implied. First, only when there are snails at the source of the flooded area is it possible for rainwater overflow to carry snails. Second, only when the environment in the snail spread area is suitable for snail survival, can the snails grow and reproduce. Otherwise, even if there are snails in the flooded area, they cannot survive in the new environment under natural conditions. Therefore, locating the original snail distribution, monitoring the flood-inundated areas, and identifying the suitable environment for snail survival and reproduction are three important factors for accurately predicting the risk of snail spread caused by floods.
First, previous studies [11,13] have lacked available data on original snail distribution; they have assumed that all flooded areas carry snails, and have then treated all flood-inundated areas as snail spread areas, so they may have overestimated the area of snail spread. The accurate extraction of snail spread areas is thus greatly urgent for present studies.
Second, accurately mapping different survival probabilities of snails in the snail spread area is also critical for locating the key snail spread areas requiring intervention. Many studies have only used a single factor, such as the normalized difference vegetation index (NDVI), to estimate the snail survival probability but have failed to analyze multiple variables to accurately locate snail habitats in the snail spread areas. It has been noted that the distribution of snails is related to many environmental factors, so merely using a single indicator may not be sufficient for accurately locating the suitable environment for snails when assessing the potential impact of flooding on snail diffusion [11,14]. Remote sensing images such as Landsat, Ikonos, GaoFen (GF), and fusion images [15] have enriched the environmental factors related to vector habitats [16,17,18]. Using multiple indicators such as the NDVI, digital elevation model (DEM), land-use type, wetness, and landscape patterns has great potential for improving the identification of suitable environment factors for snail survival and reproduction [19,20,21,22,23].
In this paper, a more systematic framework for predicting high-risk areas of snail spread after floods is proposed. By comprehensively considering the aforementioned three key aspects (i.e., snail distribution survey data, flood area, and snail habitat environment) based on multisource satellite imagery and spatial information technologies, especially remote sensing and geospatial modeling, we conducted an experiment in Jianghan Plain, China. Here, snails are predominantly linearly distributed along the tributaries and water channels of the middle and lower reaches of the Yangtze River. The fully comprehensive perspective and method effectively improved the prediction accuracy and met the requirements of accurate and timely schistosomiasis prevention and control [24]. The study, with its sufficient assumptions and a combination of multiple environmental factors for snail spread risk assessment, was the first of its kind, to the best of our knowledge. The contributions of this paper can be summarized as follows:
(1) It maps snail spread areas from flooding maps based on the assumption that only inundation areas that spatially interact with (i.e., are close to) the previous snail distribution regions before flooding are identified as snail spread areas, in order to reduce the misclassification in snail spread area identification.
(2) It analyzes multiple environmental factors related to snail habitats and uses multiple logistic regression to quantify the degree of snail survival risk in snail spread areas.

2. Materials and Methods
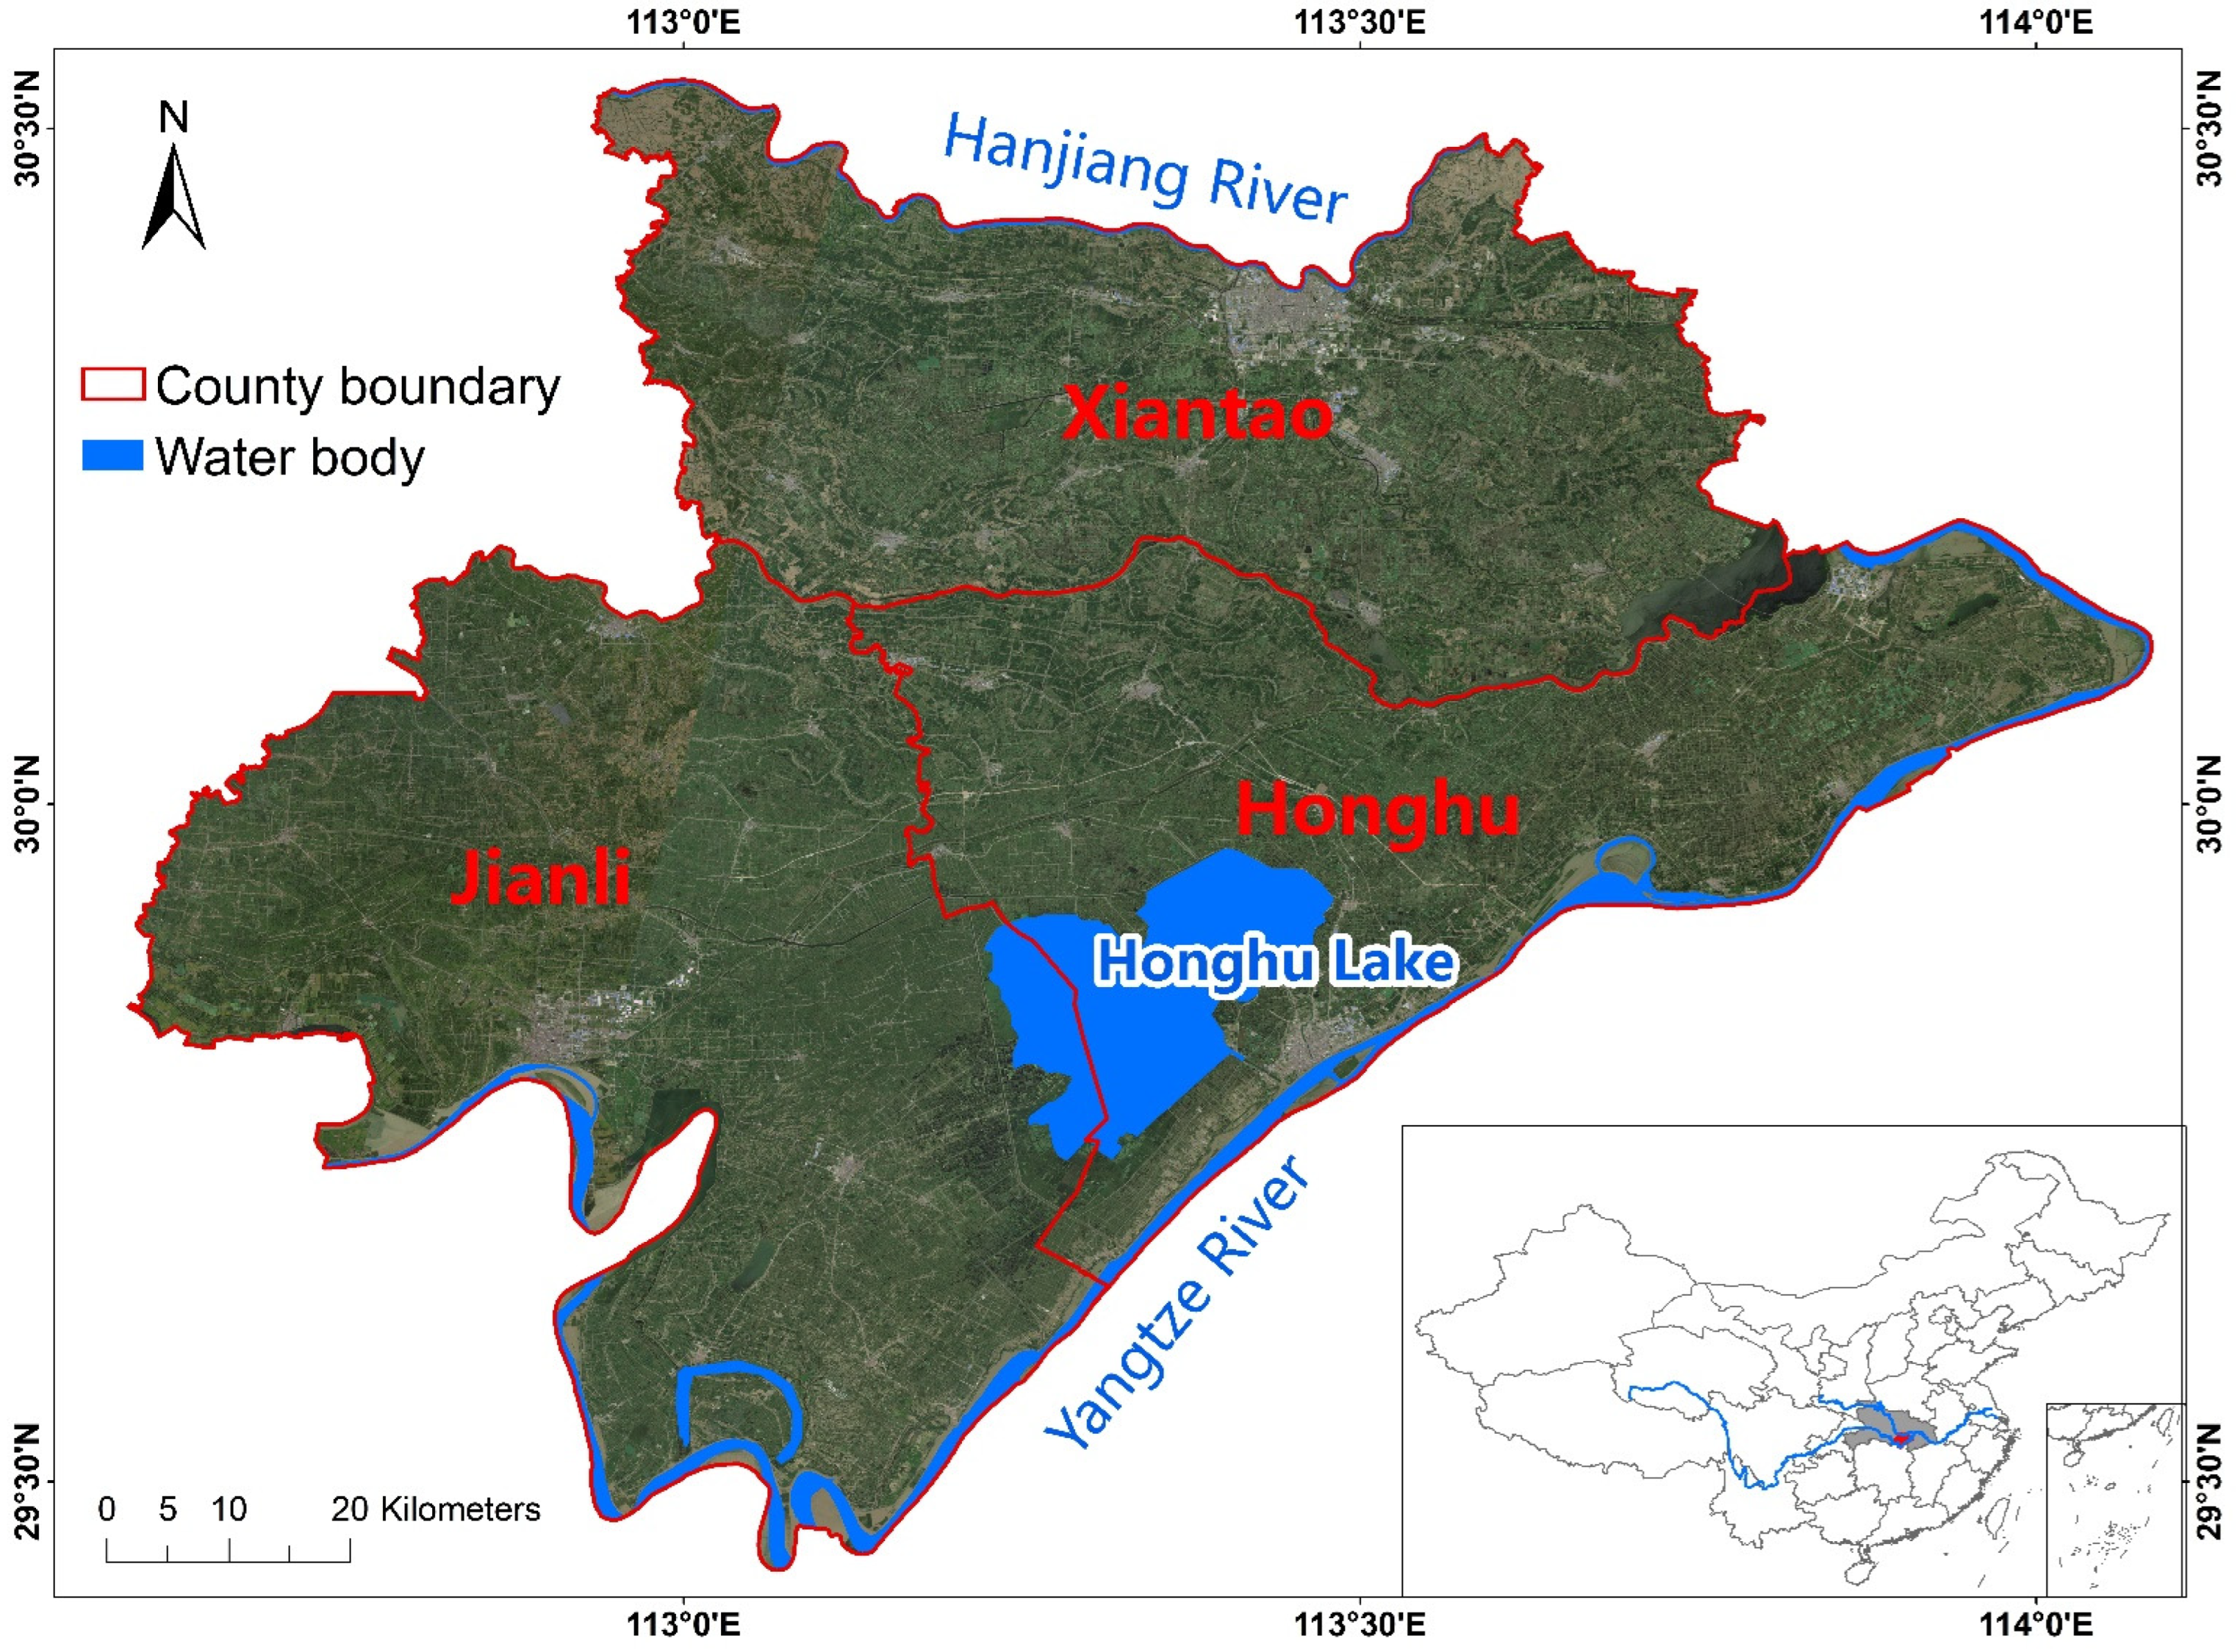
2.1. Study Area

China is an endemic area of schistosomiasis, and snails are widely distributed in the middle and lower reaches of the Yangtze River, occupying 364,950.24 hm2 in 2020 [25]. We conducted our study in Xiantao, Honghu, and Jianli, in a total of 66 townships located in the Jianghan Plain of the middle reaches of the Yangtze River and Hanjiang River in Hubei province, China (Figure 1). The climate (seasonal precipitation) and hydrological environment (dense waterway networks) are suitable for snail breeding, and snails were linearly distributed along the rivers and water channels (main canals, branch canals, lateral canals, agriculture ditches, and sublateral canals) [21].

2.2. Snail Distribution Dataset through Snail Field Surveys

Snail data were mainly used to model the snail habitat and identify the snail spread area. The data were collected by health professionals through snail field surveys in 2016, including the georeferenced locations (latitude–longitude) of several snail habitats obtained from Google Earth [26] and the global positioning system (GPS), and sketch maps of the snail distribution without a geographic coordinate system at the township or village level, covering the whole study area.

2.3. Remote Sensing Datasets
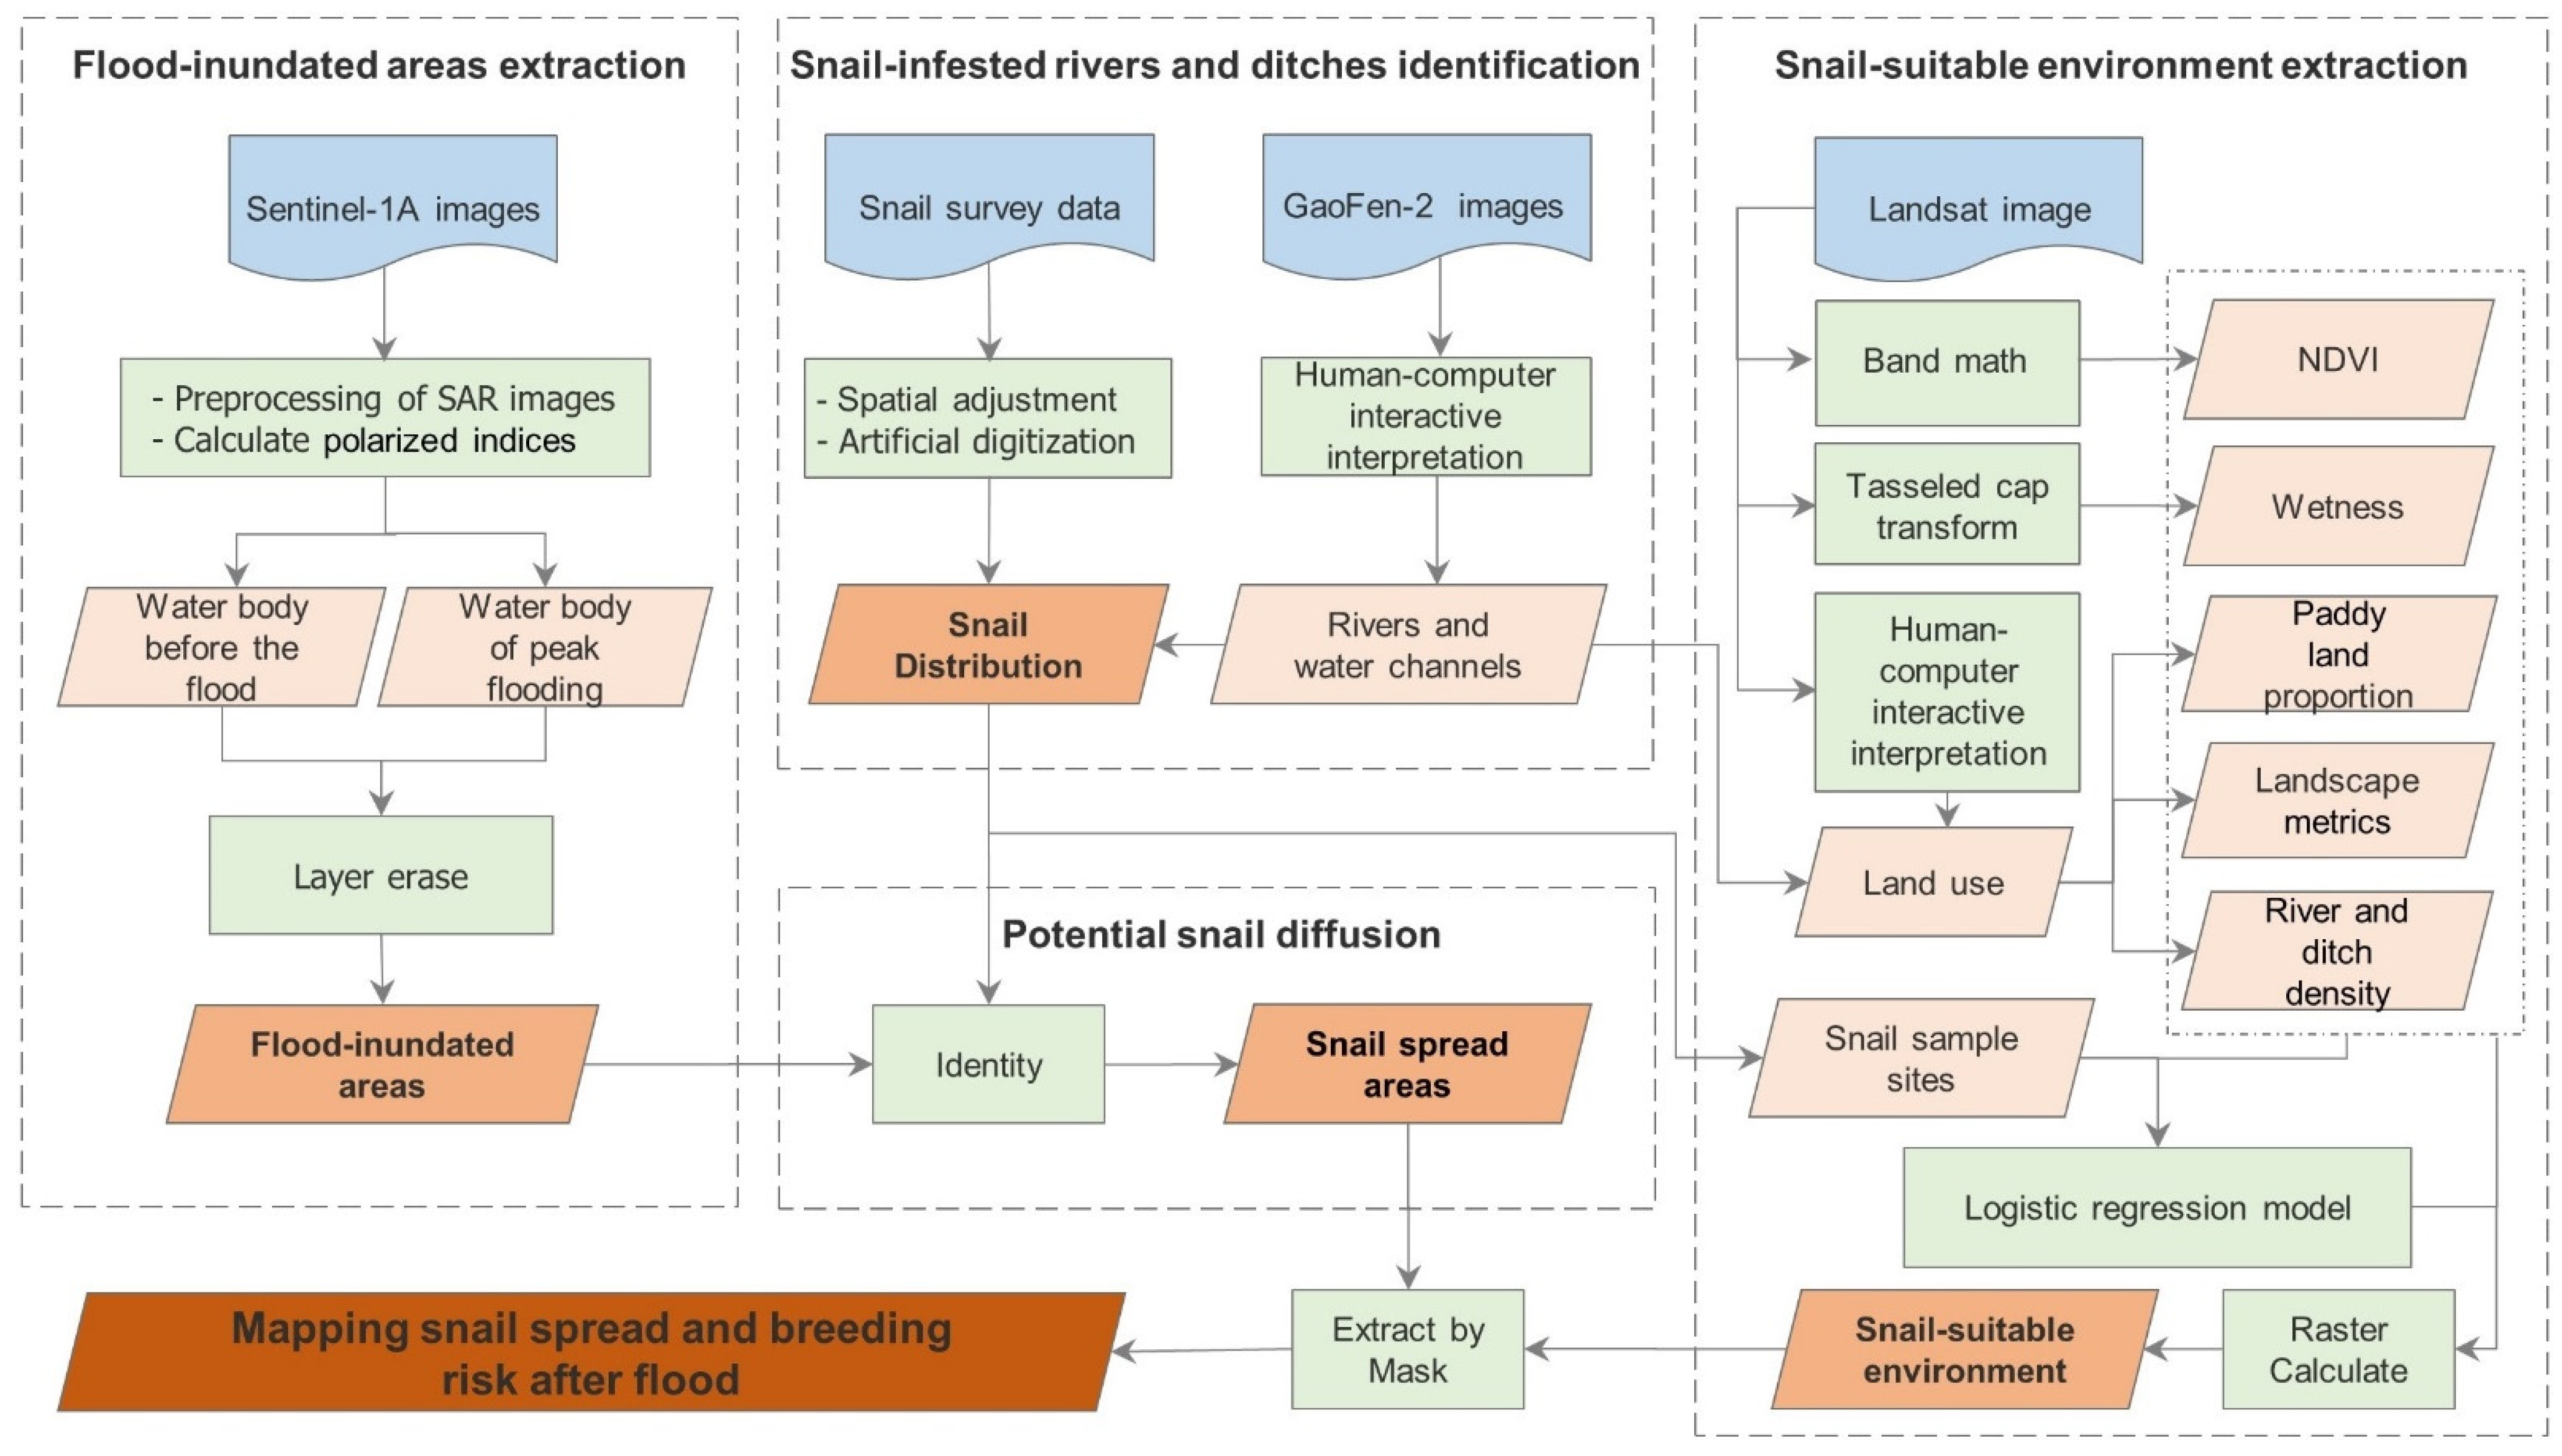
GaoFen-2 (GF-2) images, Sentinel-1A radar images, and Landsat 8 OLI images were used to identify the distribution of environmental factors in the snail diffusion process (Table 1 and Figure 2). The GF-2 images (multispectral band spatial resolution: 4 m, panchromatic band spatial resolution: 0.8 m) in 2020 were downloaded from Hubei data and an application network of the high-resolution earth observation system (http://hbeos.org.cn/ (accessed on 5 July 2021)). The Sentinel-1A data collected on 19 June 2020, and 12 July 2020, corresponding to the time before flooding and the peak of the flooding, respectively, were obtained from the European Space Agency (ESA) Earth Online database (https://earth.esa.int/ (accessed on 4 May 2021)). A multispectral image of Landsat 8 OLI over the study areas on 3 and 26 August 2020, respectively, was obtained from the United States Geological Survey (https://earthexplorer.usgs.gov/ (accessed on 25 July 2021)). All remote sensing images were geometrically corrected based on Landsat 8 OLI images.
By combining the results of previous studies on environmental factors associated with snail habitats [19,20,22,23], the NDVI, wetness, paddy land proportion (PL_pro), river and channel density (RC_density), and landscape index extracted from remote sensing images were included (Table 1). In particular, based on Landsat 8 OLI images, we calculated the NDVI and wetness via band math (the ratio of the difference between the near-infrared band and the visible band and the sum of the two bands) and tasseled cap transformation [27] separately, which have been proven to be associated with snail distribution [20,21,23]. The land use in 2020 was extracted by expert knowledge-assisted human–computer interaction interpretation methods, based on Landsat 8 OLI and GF-2 remote sensing images [28]. Paddy fields were selected from land-use data, and their proportions in each administrative village were calculated. Rivers and channels were extracted by expert knowledge-assisted human–computer interaction interpretation methods based on GF-2 images, and then the river and channel densities were calculated by dividing the length of the ditches by the village area. The landscape metrics were calculated using the Patch Analyst version 5 (http://www.cnfer.on.ca/SEP/patchanalyst/ (accessed on 20 May 2021)) based on land-use and water net distribution. Based on their ecological significance and to avoid information redundancy, the edge density (ED), mean patch size (MPS), median patch size (MedPS), patch size coefficient of variation (PSCoV), patch fractal dimension (FD), mean shape index (MSI), mean patch fractal dimension (MPFD), and area-weighted mean shape index (AWMSI) were selected to model the snail habitats [20]. We resampled the environmental data layers mentioned above to a 5 m resolution.

2.4. Methods

The proposed method includes three main parts: flood inundation area mapping, snail-infested river and channel identification, and snail-suitable environment extraction. The flowchart of the method is shown in Figure 2.

2.4.1. Mapping Flood-Inundated Areas Using Sentinel-1 SAR Imagery

Flood-inundated areas were mapped using Sentinel-1 SAR imagery and thresholding. Histogram thresholding methods [29,30], an improved local thresholding approach [31,32,33], or multitemporal thresholding with SAR observation data are usually employed to discriminate water from non-water features. Based on the relatively consistent flat terrain, precipitation, land-use patterns in the study area, and the successful application of the simple empirical threshold method for water area information extraction in similar areas (e.g., the Poyang Lake area [14,34], also located in the middle and lower reaches of the Yangtze River), we extracted flood-inundated areas in this study. Sentinel-1 images processed by the Sentinel Application Platform (SNAP) were used to map flood-inundated areas. The Level-1 Ground Range Detected (GRD) Sentinel-1 images were preprocessed (Figure 2) in the Sentinel Application Platform (SNAP), including radiometric calibration, speckle-filter, terrain correction, multi-look, terrain geocoding, and terrain-flattening and then converted to decibels [35]. The polarized index R used for the water body data extraction was calculated based on the backscattering coefficients for vertical transmit and vertical receive (VV) and vertical transmit and horizontal receive (VH) polarizations using the following formula:
R = ln ( 10 × V V × V H )
where R is the logarithmic operation of VV and VH, applied to better display the difference between land and water. Based on the characteristics of the R histogram, the segmentation threshold of the preprocessed image was determined.
Cloud-free Sentinel-2 and Landsat images of the same period as the Sentinel-1A images were used to visually compare extracted water bodies, and randomly generate 200 sampling sites (100 water bodies and 100 non-water bodies). The classification accuracy of water and non-water was quantitatively evaluated by the confusion matrix method.

2.4.2. Mapping Snail Spread Areas Based on Inundation Map and Snail-Infested Rivers and Channels

Based on the assumption that the snail distribution is the precondition for determining snail diffusion, snail spread areas were mapped using the snail-infested river and channel data and flood-inundated areas data. Snail-infested rivers and channels were extracted through human–computer interactive interpretation based on the snail survey data and GF-2 remote sensing images (Figure 2). Specifically, the sketch maps of snail distribution with an unregistered geographic coordinate system were coregistered with the town or village administrative division vector layer and GF-2. Then, snail-infested rivers and channels were vectorized through artificial digitization based on adjusted sketch maps and GF-2 remote sensing images. About 12,000 water channels, including main canals, branch canals, lateral canals, agriculture ditches, and sublateral canals in Xiantao, Honghu, and Jianli, were interpreted from GF-2 remote sensing images. They are widely distributed throughout the region, and of these, a total of 1906 river or channel segments were geographically identified as snail-infested areas (Figure 3).
Whether the flood carries snails depends on whether there are snails in the source of the flooding area. Based on this assumption, if there were snails at the source of the flooding area, the corresponding flooding zone was defined as the snail spread area in the proposed method. With the snail-infested rivers and channels identification map and the flood-inundated map, the suspected snail spread areas could thus be identified (Figure 2). In particular, the geometric intersection features of the flood-inundated layer that overlapped the snail-infested layer obtained the properties of the snail-infested layer, through the Identity (ArcGIS Analysis tool) operation based on their proximity. Then, snail spread areas were extracted by selecting features with snail-infested properties in the flood-inundated layer and erasing snail-infested areas.

2.4.3. Mapping Breeding Risk in the Snail Spread Areas Based on Multiple Variances and Univariate Logistic Regression

Sample points were used to model potential snail habitats. Sample points for snail habitat modeling, including 115 samples with snails (positive sites) and 345 samples without snails (negative sites), were obtained from the identified snail distribution (Figure 3). Positive sites (snail-infested) were evenly selected in snail distribution areas, negative sites (no snail-infested) were randomly selected in other areas, and the distance between the nearest two points was at least 400 m.
Univariate logistic regression analyses were initially conducted to examine the effect of each environmental variable (Table 1) on snail distribution (Figure 2), and variables with p < 0.1 were included for further analyses. The univariate logistic regression analyses were performed based on 460 sample points from the identified snail distribution. The values of environmental factors of 460 sample points were extracted; 75% of the data were randomly selected for logistic regression analysis, and the remaining 25% of the data were used for accuracy verification. Variables with relatively high collinearity were excluded, as assessed by examining the correlation coefficient and the variance inflation factors (VIFs). VIFs < 10 indicate low collinearity. The remaining significant independent variables were subjected to multiple backward-LR logistic regression to construct a final model with a significance level of p < 0.05. The goodness-of-fit of the model was evaluated by the Hosmer–Lemeshow test. The area under the curve (AUC) of the receiver operating characteristic (ROC) plots was used to indicate model performance.
In this paper, the snail breeding risk of the whole study area was mapped according to the predictive model derived from the multivariate logistic regression analysis and revealed environmental risk factors (Figure 2). The snail survival probability in snail spread areas depended on the degree of an environment suitable for their growth and reproduction. Accordingly, the final distribution map of snail spread and survival risk was obtained by the superposition of snail spreading areas and snail breeding risk (ArcGIS Spatial Analyst tool—Extract by Mask, Figure 2).

3. Results

3.1. The Flood-Inundated Area Map

The images of polarized index R from Sentinel-1B satellite images captured before and during the period of peak flooding are shown in Figure 4a,b, respectively. A clear water–land boundary was seen on R images in which the water and land were well differentiated; specifically, water body areas appeared white or grayish white, and land areas appeared dark or black.
By analyzing the R histograms (Figure 4c,d) of the images before and during the period of peak flooding, we found that the water body index in the study area had an obvious bimodal structure. Therefore, the thresholds of water segmentation were set at 8.25 (before the flood) and 8.20 (peak flood), respectively. The distribution of water bodies before the flood (Figure 4e) covered 1346.7 km2. The expansion of water bodies during peak flooding (Figure 4h), with 700.9 km2, was produced by comparing the two water maps before and after the flood (Figure 4e,f). The water area expanded by approximately 52.0% during the period of peak flooding relative to the water areas before flooding, with the increase occurring primarily around the Yangtze River, Honghu Lake, and Dongjing River, as well as around the ponds and paddy fields in Xiantao. A visual comparison of Landsat 8 OLI image acquired on 16 June, 2020, within 3 d of the Sentinel-1A data, and a Sentinel-1A-derived classification map (Figure 4e) shows that the extracted water area was maximized, while the noise (such as paddy fields, etc.) was minimized. Moreover, the user accuracy of water and non-water classification was 0.91 and 0.90, respectively, and the Kappa coefficient was 0.82.

3.2. Snail Spread Area Map

Unlike traditional studies that used all inundation areas as the snail spread areas, such as the map in Figure 4h, the proposed method refines the map and eliminates inundation areas that are not related to snail-infested rivers and channels. The result of suspected snail spread areas after flooding are shown in Figure 5. Only the flood-inundated features adjacent to the snail-infested features were identified as suspected snail spread objects. The suspected snail spread areas covered a total of 231.4 km2, accounting for 33.0% of the flood-inundated area, mainly distributed along the Yangtze River, Dongjing River, and the ponds and paddy fields in Xiantao. In contrast, for the methods assuming the entire flood-inundated area are snail spread areas, the snail spread areas occupied 700.9 km2 (Figure 4h), which is two times larger than that predicted by the proposed method.

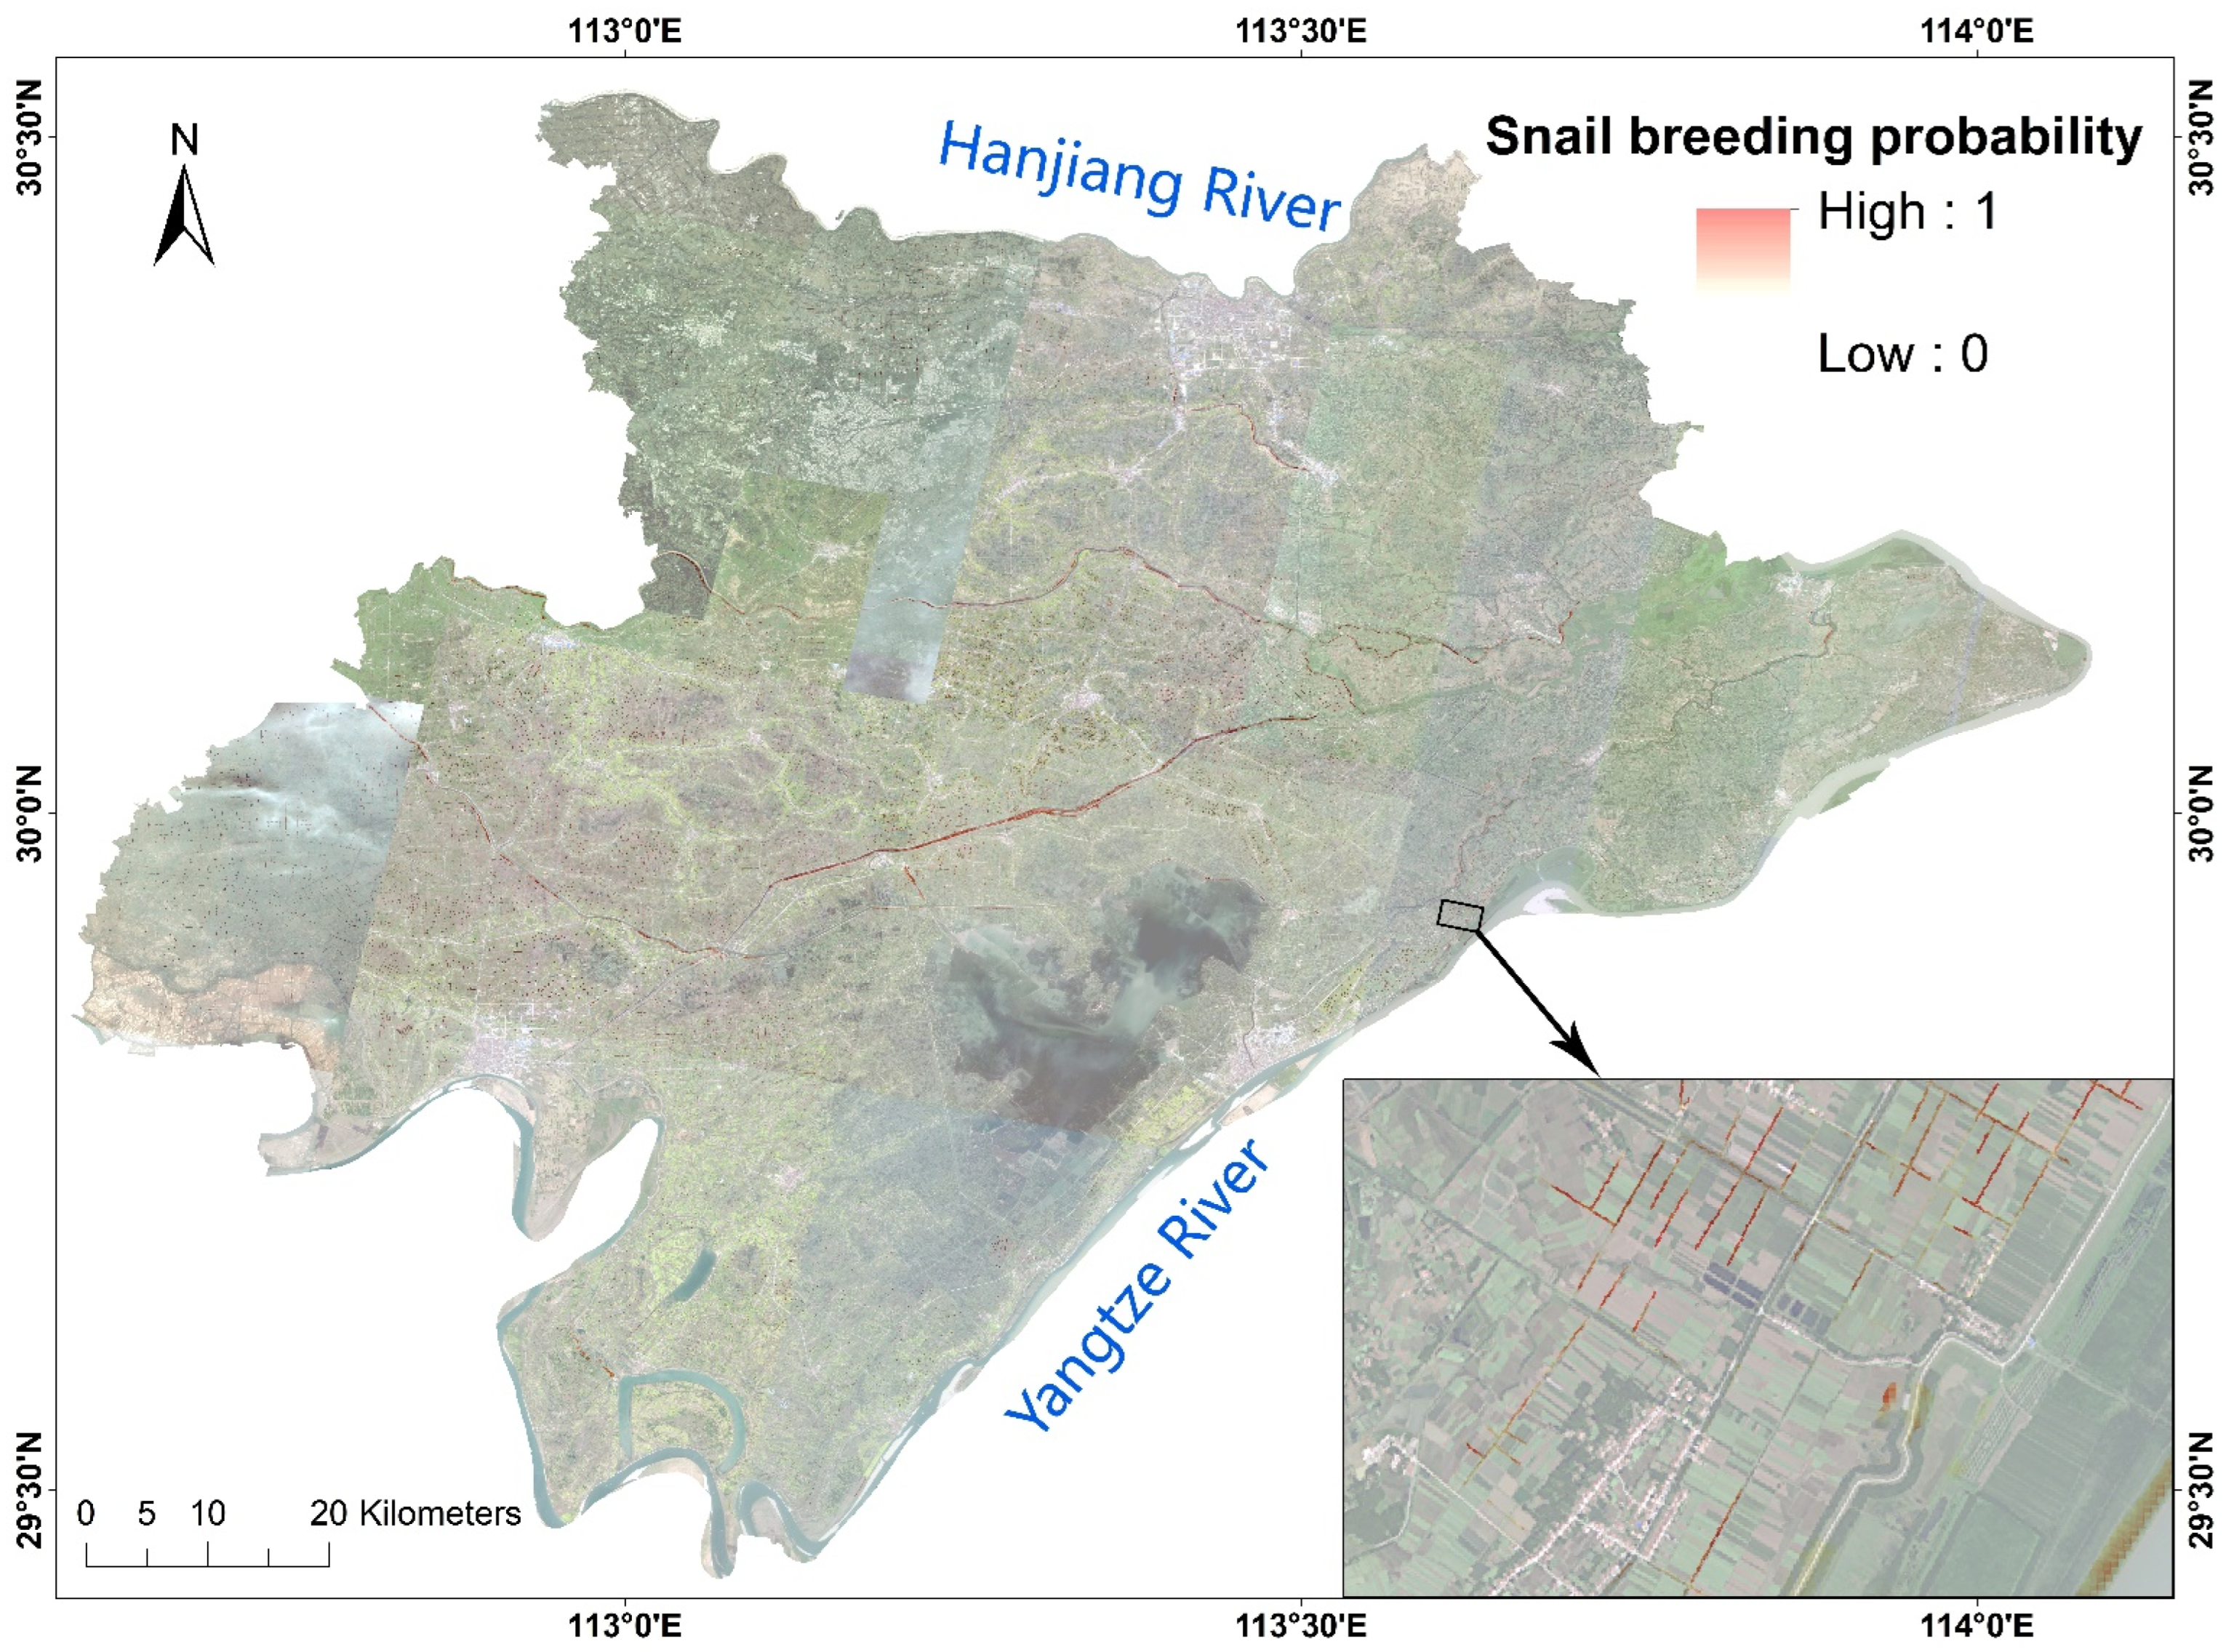
3.3. Snail Breeding Risk Probability Estimation Result

The univariate logistic regression models identified NDVI, Wetness, PL_pro, RC_density, FD, AWMSI, MSI, MPS, and PSCoV as significant risk factors (p < 0.1) (Table 2). After collinearity analysis, all nine factors were kept in multivariate analysis (p < 0.05). NDVI (OR 1.517 (95% CI: 1.187–1.940)), Wetness (OR 1.253 (95% CI: 1.077–1.457)), RC-density (OR 1.080 (95% CI: 1.020–1.143)), and FD (OR 1.174 (95% CI: 1.139–1.210)) showed positive effects in multivariate analysis, which revealed that higher NDVI, Wetness, river and channel density, and FD all increased the probability of snail breeding risk. The Hosmer–Lemeshow chi-square type goodness-of-fit test of the model was 5.50 (p = 0.70), revealing that the model fitted well. The ROC curve assessed the predictive power of the model, and the AUC was 0.953 (95% confidence interval: 0.932–0.974). According to the four factors and their coefficients (B) of multivariate analysis results (Table 2), the final prediction model for the risk of snail habitats was as follows:
  P r e d i c t i v e   r i s k   o f   s n a i l   h a b i t a t s   = 1 / ( 1 + e x p ( ( 28.763 + 0.417 × N D V I × 10 + 0.225 × W e t n e s s × 100 + 0.077 ×   R C _ d e n s i t y   + 0.160 × F D × 100 ) ) )
The predicted risk of snail habitats was the exponential function of NDVI, Wetness, RC_density, and FD.
Figure 6 shows the risks of snail habitats covering the entire study area. High-risk areas were mainly located on the river beaches and crisscrossed ditches. Owing to vegetation and temperature, the snail breeding probability was also different in different locations of the same beach or ditch.

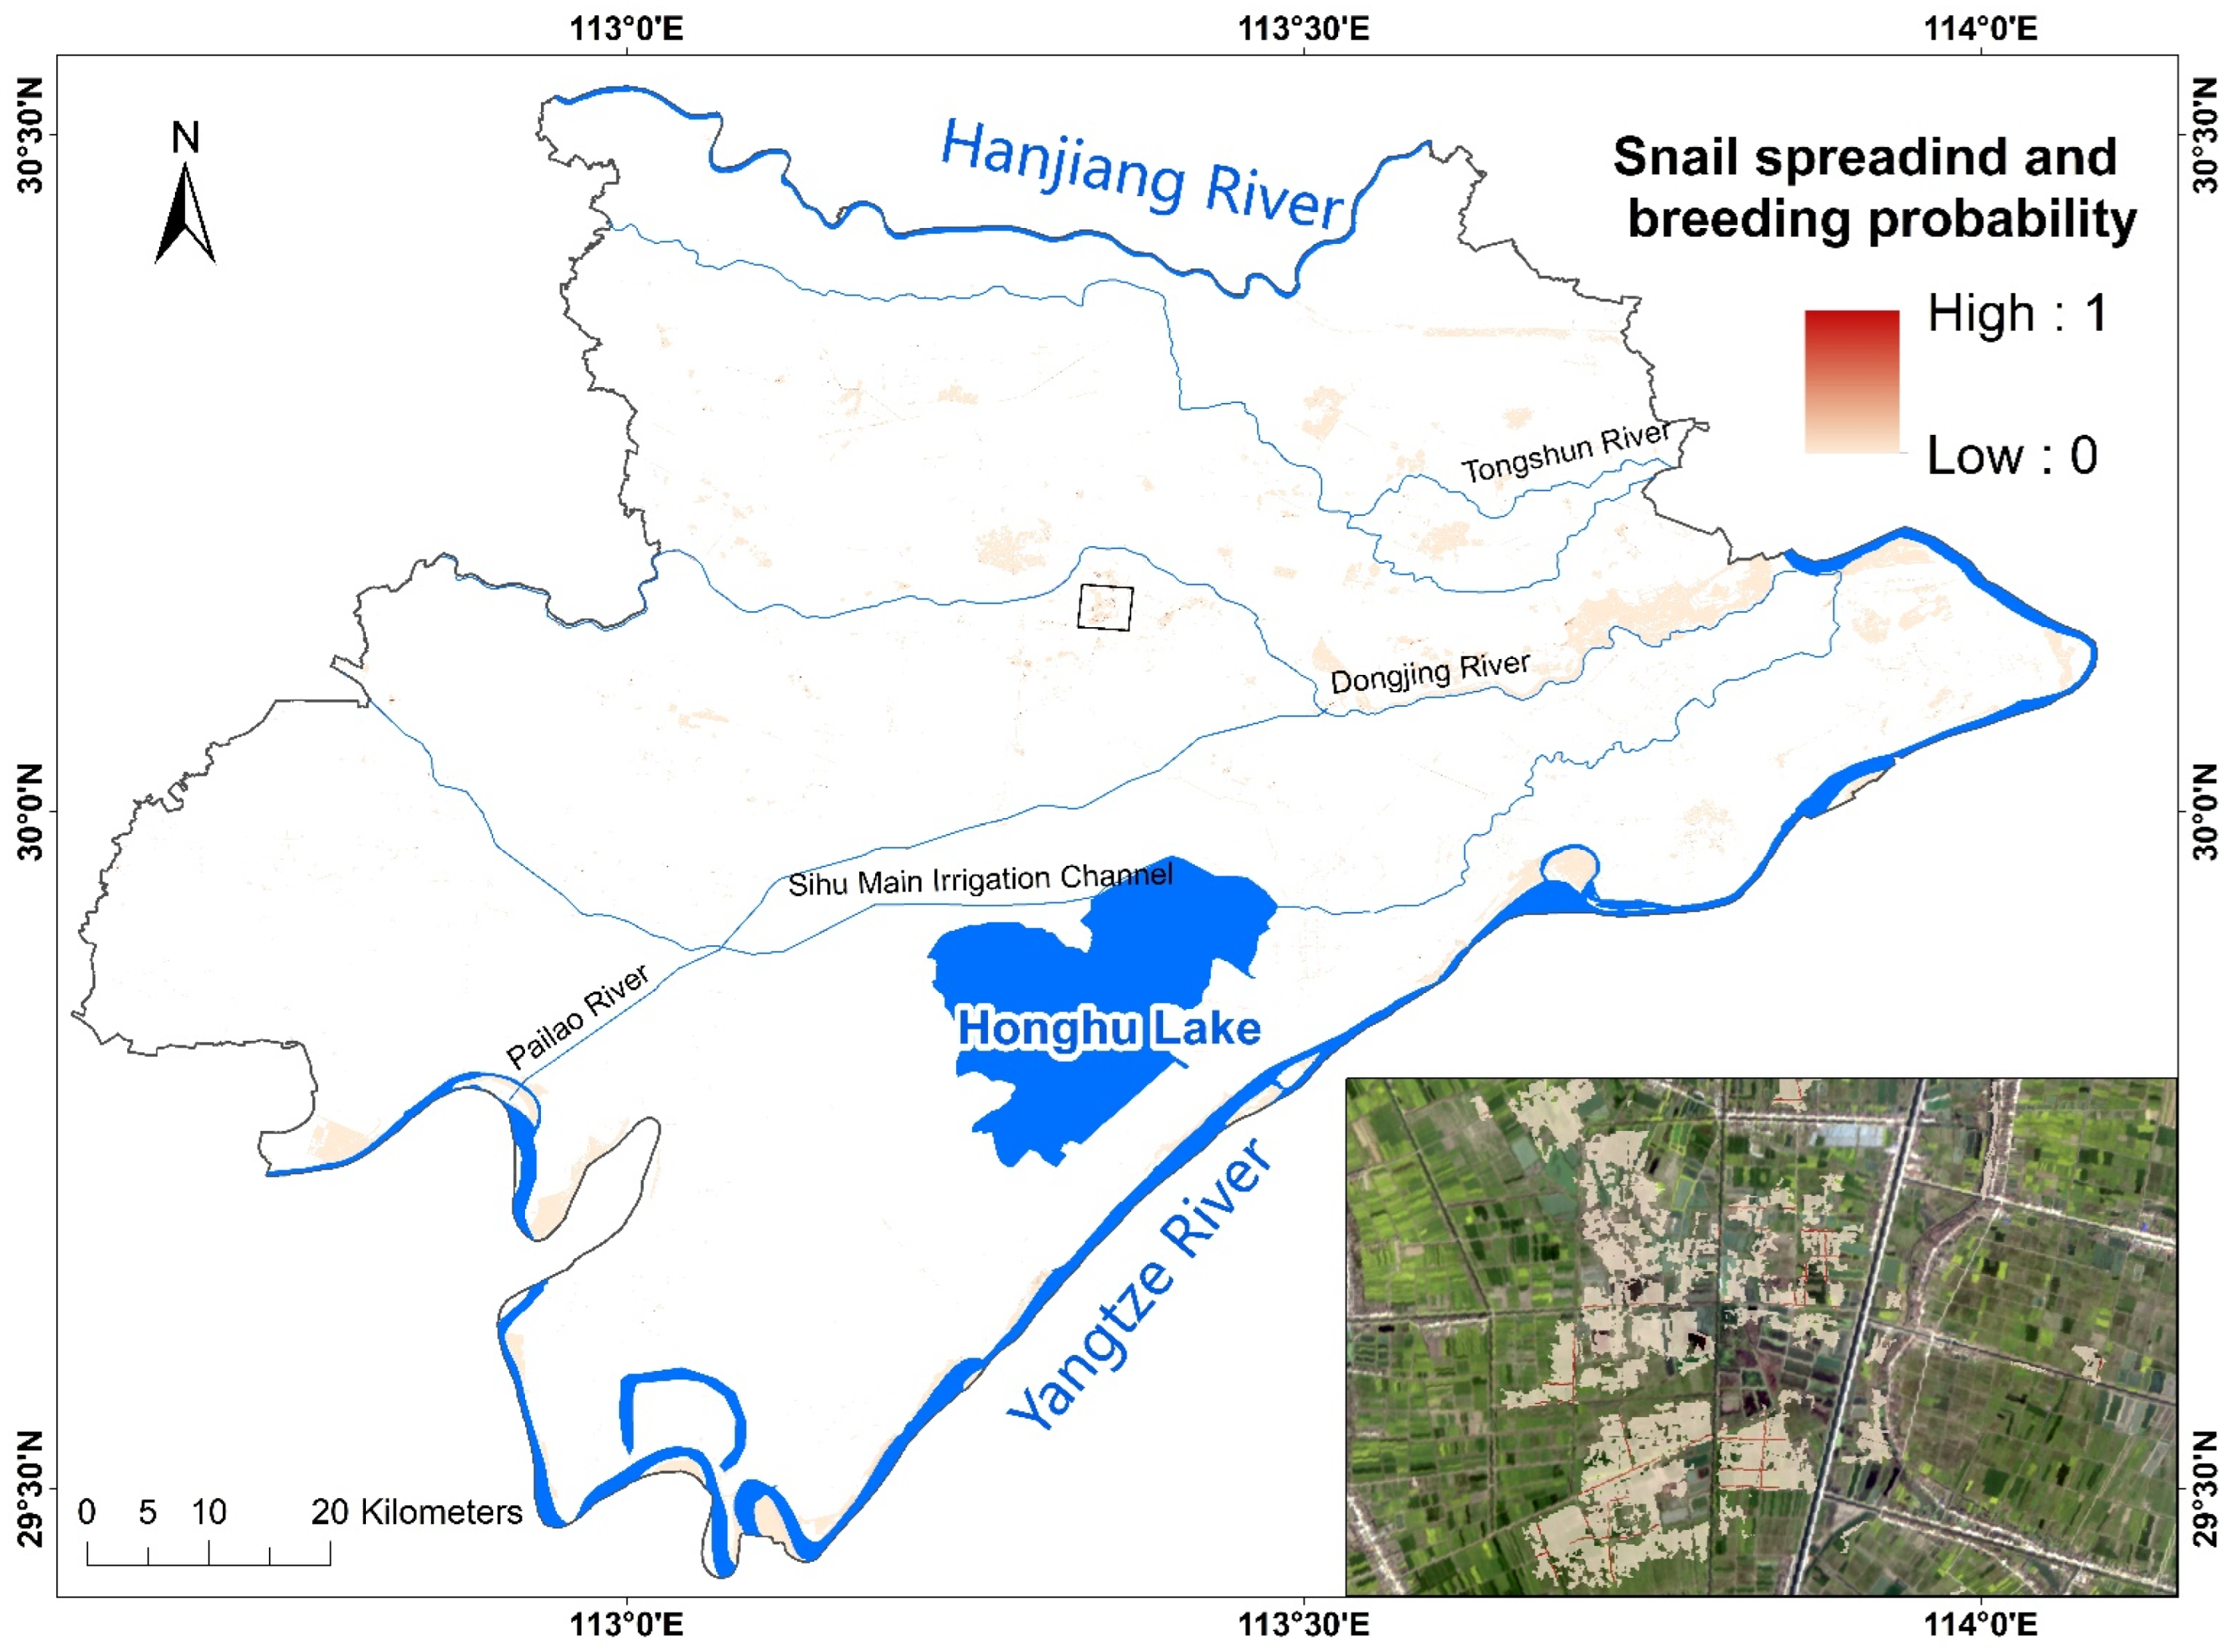
3.4. Final Potential Snail Spreading and Breeding Risk Map

Figure 7 shows the potential snail spreading and breeding areas after the flood were extracted by clipping the snail spread lay (Figure 5) using the snail breeding probability lay (Figure 6). The risk probability was divided into three levels: low risk, from 0 to 0.2; medium risk, from 0.2 to 0.5; and high risk, if greater than 0.5. The low-risk area was 230.7 km2, accounting for 99.7% of the entire suspicious snail spread areas. The medium-risk area was 0.7 km2. The high-risk areas were mainly distributed in the flood areas of the Yangtze River, Tongshun River, Dongjing River, Sihu Main irrigation channel, and Pailao River. Although the area was 0.06 km2, only making up 0.02% of the suspicious snail spread areas, the length was about 12 km according to the 5 m average width of rivers and water channels.

4. Discussion

There are hysteresis and long-term effects on the spread of snails after floods. Some studies have indicated that a flood may affect the distribution of snails in the next 3 to 5 years [36], so it is necessary to strengthen snail monitoring after the disaster, as well as discover and deal with new snail areas in a timely manner. Heavy rainfall, the existing distribution of snails, and a snail-suitable environment are three important links affecting the spread and survival of snails after a flood. To accurately locate the area where snails potentially spread and survive, we comprehensively analyzed these three factors and established a potential snail spread risk assessment method based on remote sensing. The results show that the area of suspected spread risk area of snails accounted for 33.0% of the flood-inundated area. Although the area where the snails spread and the survival risk value was greater than 0.5 was only 0.06 km2, the length was about 12 km, as snails tended to be linearly distributed along the rivers and water channels. These results reveal that snails had a risk of spreading and breeding in the flooded area, and our method could more effectively shorten the monitoring range of snail spread.
In predicting the risk of snail diffusion with the flood, we proposed an assumption that only when there are snails at the source of the flooded area is it possible for rainwater overflows to carry snails [11,13,14]. Although this assumption is obvious, it has often been ignored in practical studies. In this case, if it was also not considered, the size of the suspected snail spread area would be overestimated by two times. Thus, the existing snail distribution (latitude and longitude rather than administrative statistical units) is an extremely important basic data point for snail spread monitoring. However, the current snail distribution data are incomplete, unsystematic, and unavailable, which cannot meet the scientific needs of the precision control of schistosomiasis. In this study, we integrated the georeferenced locations (latitude–longitude) of snail habitats based on Google Earth, sketch maps of the snail distribution in towns and villages, and high-resolution satellite images to identify the snail distribution, which is a method that makes up for the lack of basic data of the snail distribution. Moreover, we call for the improvement of accurate investigation and continuous observation of snail distribution.
The development of radar remote sensing and the water index method has turned out to be powerful in ushering in a diverse set of applications across disciplines, including disease mapping and prediction [13,37]. These methods have clear advantages over traditional epidemiological survey techniques and optical remote sensing techniques. The traditional snail survey is often laborious and costly, and optical remote sensing is often limited by the weather. We used the histogram threshold method to distinguish water bodies and non-water bodies, and compared with the cloud-free Landsat 8 OLI image area in the same period of Sentinel-1 images, water body information was effectively extracted. The submerged areas were mainly distributed around the Yangtze River and Dongjing River, corresponding to the climatic and hydrological characteristics of rainy summers and abundant runoff in this area [38].
There have been various studies related to risk prediction in snail habitats [16,20,21,23,39,40,41,42]. Different types of snail habitats (lake/marshland, inner embankment, and hilly areas) have shown different key environmental factors and impact intensities. Specifically, distance to the nearest river was found to be the most important variable when measuring the risk for lake/marshlands, while the climatic variables were more important for hilly endemic areas [23]; vegetation such as NDVI and FD reflecting the landscape pattern were more important for plain regions with waterway networks (inner embankment) [20]. Fortunately, almost all the environmental factors related to snail habitats can be obtained directly or indirectly through remote sensing, which is an important tool for the rapid monitoring of snail habitat distribution and evolution. In this study, four remote sensing environmental factors (NDVI, wetness, RC_density, and FD) were found to be related to snail habitats. In plain regions with waterway networks, because of the diversity of vegetation types (e.g., vegetables, rice, cotton, grass), a single remote sensing environmental factor could not accurately identify snail habitats, although it may be suitable for a lake/marshland area with the single vegetation (mainly grass) and planar distribution of snails [14].
Our study has two key limitations. First, water conservancy and schistosomiasis control projects such as snail settling pools have some effect on snail spread control [43,44]. Our study did not consider the blocking effect of snail settling ponds on snail spread but assumed that flood areas with snail distribution at the source are snail spread areas. Second, after the flood, schistosomiasis prevention and control departments often take emergency response measures based on experience, such as spraying snail insecticides in suspected snail spreading areas. Coupled with the hysteresis and long-term effects on the spread of snails after floods, this posed a challenge to the validation of risk mapping for snail spread and survival. The blocking effect of snail settling ponds on snail spread, and coordination of snail control and risk verification, are worth further investigation.

5. Conclusions

This paper proposed a new high-risk area of schistosome intermediate snail hosts spread mapping method from multisource remote sensing imagery. High-resolution SAR data were used for all-weather flood mapping, and the results enable all-weather snail spread risk mapping, which is helpful in timely monitoring the snail diffusion. In addition, in the mapping of snail spread areas, the proposed method incorporates snail-infested rivers and channels based on the assumption that the snail distribution is the precondition to determine snail diffusion and refined the suspected snail spread area by about 67% in the study area of Hanjiang River basin. This method also uses multiple environmental factors to better quantify the risk of snail habitats. With its refined snail spread area and more precise region identified as a snail-suitable environment, the proposed method can be used as a preparatory exercise before the implementation of traditional manual snail monitoring. This is because the rapidly generated risk map of snail diffusion can locate the key monitoring areas promptly after the flood and significantly narrow the scope of schistosomiasis epidemiological investigation. Given its simple, quick, and mature methods and procedures, the method is recommended for integration into national schistosomiasis control programs to meet the requirements of targeted interventions. In the future, we will focus on the blocking effect of snail settling ponds on snail spread and coordination of snail control and risk verification.

Author Contributions

Conceptualization, X.L. and J.Q.; methodology, J.Q.; software, J.Q. and D.H.; validation, Y.X., H.Z. and J.X.; formal analysis, J.Q., D.H. and J.J.; investigation, Y.X., H.Z., J.X. and Q.S.; resources, X.L., J.J. and J.Q.; data curation, Y.X., H.Z., J.X., Q.S. and Y.Y.; writing—original draft preparation, J.Q. and D.H.; writing—review and editing, X.L., R.L., J.Q. and Y.H.; visualization, D.H. and J.Q.; supervision, X.L., J.J. and R.L.; project administration, J.Q.; funding acquisition, X.L., J.J., J.Q. and Y.Y. All authors have read and agreed to the published version of the manuscript.

Funding

This research was funded by the National Natural Science Foundation of China (Grant No.: 62071457, 81803297, and 41901235) and the Multidisciplinary Cross-cultivation project of Innovation Academy for Precision Measurement Science and Technology, CAS (Grant No.: S21S3202).

Data Availability Statement

The data used in this study are all available on request to the corresponding author.

Acknowledgments

We are grateful to all the staff from provincial schistosomiasis control institutes and schistosomiasis control stations at the county level who participated in the basic data survey of the snail.

Conflicts of Interest

The authors declare no conflict of interest.

References

  1. Soriano, J.B.; Banoub, J.A.M.; Kanchan, T.; Yasin, Y.J. Gbd 2017 dalys and hale collaborators. Global, regional, and national disability-adjusted life-years (dalys) for 359 diseases and injuries and healthy life expectancy (hale) for 195 countries and territories, 1990–2017: A systematic analysis for the global burden of disease study (vol 392, pg 1859, 2018). Lancet 2019, 393, E44. [Google Scholar]
  2. McManus, D.P.; Dunne, D.W.; Sacko, M.; Utzinger, J.; Vennervald, B.J.; Zhou, X.N. Schistosomiasis. Nat. Rev. Dis. Primers 2018, 4, 13. [Google Scholar] [CrossRef] [PubMed]
  3. Lo, N.C.; Gurarie, D.; Yoon, N.; Coulibaly, J.T.; Bendavid, E.; Andrews, J.R.; King, C.H. Impact and cost-effectiveness of snail control to achieve disease control targets for schistosomiasis. Proc. Natl. Acad. Sci. USA 2018, 115, E584–E591. [Google Scholar] [CrossRef] [PubMed] [Green Version]
  4. Sokolow, S.H.; Wood, C.L.; Jones, I.J.; Swartz, S.J.; Lopez, M.; Hsieh, M.H.; Lafferty, K.D.; Kuris, A.M.; Rickards, C.; De Leo, G.A. Global assessment of schistosomiasis control over the past century shows targeting the snail intermediate host works best. PLoS Negl. Trop. Dis. 2016, 10, e0004794. [Google Scholar] [CrossRef]
  5. WHO. Field Use of Molluscicides in Schistosomiasis Control Programmes: An Operational Manual for Programme Managers; World Health Organization: Geneva, Switzerland, 2017.
  6. Habib, M.R.; Lv, S.; Rollinson, D.; Zhou, X.N. Invasion and dispersal of biomphalaria species: Increased vigilance needed to prevent the introduction and spread of schistosomiasis. Front. Med. 2021, 8, 614797. [Google Scholar] [CrossRef] [PubMed]
  7. Lv, S.; Lv, C.; Li, Y.L.; Xu, J.; Hong, Q.B.; Zhou, J.; Zhang, J.F.; Wen, L.Y.; Zhang, S.Q.; Lin, D.D.; et al. Expert consensus on the strategy and measures to interrupt the transmission of schistosomiasis in China. Chin. J. Schisto. Control 2021, 33, 10–14. [Google Scholar]
  8. Dai, S.M.; Edwards, J.; Guan, Z.; Lv, S.; Li, S.Z.; Zhang, L.J.; Feng, J.; Feng, N.; Zhou, X.N.; Xu, J. Change patterns of oncomelanid snail burden in areas within the yangtze river drainage after the three gorges dam operated. Infect. Dis. Poverty 2019, 8, 48. [Google Scholar] [CrossRef] [PubMed]
  9. Wang, W.; Bergquist, R.; King, C.H.; Yang, K. Elimination of schistosomiasis in china: Current status and future prospects. PLoS Negl. Trop. Dis. 2021, 15, e0009578. [Google Scholar] [CrossRef]
  10. Chunli, C.; Shizhu, L.; Xiaonong, Z. Impact of schistosomiasis transmission by catastrophic flood damage and emergency response in China. Chin. J. Schisto. Control 2016, 28, 618–623. [Google Scholar]
  11. Xia, S.; Xue, J.B.; Gao, F.H.; Lv, S.; Xv, J.; Zhang, S.Q.; Li, S.Z. Sentinel-1a radar remote sensing-based modeling for quick identification of potential risk areas of schistosomiasis transmission after flood. Chin. J. Parasitol. Parasit. Dis. 2020, 38, 417–422. [Google Scholar]
  12. Guo, S.Y.; Li, L.; Zhang, L.J.; Li, Y.L.; Li, S.Z.; Xu, J. From the one health perspective: Schistosomiasis japonica and flooding. Pathogens 2021, 10, 1538. [Google Scholar] [CrossRef] [PubMed]
  13. Shi, Y.Y.; Qiu, J.; Li, R.D.; Shen, Q.; Huang, D. Identification of potential high-risk habitats within the transmission reach of oncomelania hupensis after floods based on sar techniques in a plane region in China. Int. J. Environ. Res. Public Health 2017, 14, 986. [Google Scholar] [CrossRef] [PubMed] [Green Version]
  14. Xue, J.B.; Wang, X.Y.; Zhang, L.J.; Hao, Y.W.; Chen, Z.; Lin, D.D.; Xu, J.; Xia, S.; Li, S.Z. Potential impact of flooding on schistosomiasis in poyang lake regions based on multi-source remote sensing images. Parasites Vectors 2021, 14, 116. [Google Scholar] [CrossRef]
  15. Wang, P.; Yao, H.Y.; Li, C.; Zhang, G.; Leung, H. Multiresolution analysis based on dual-scale regression for pansharpening. IEEE Trans. Geosci. Remote Sens. 2022, 60, 1–19. [Google Scholar] [CrossRef]
  16. Liu, Z.Y.-C.; Chamberlin, A.J.; Tallam, K.; Jones, I.J.; Lamore, L.L.; Bauer, J.; Bresciani, M.; Wolfe, C.M.; Casagrandi, R.; Mari, L.; et al. Deep learning segmentation of satellite imagery identifies aquatic vegetation associated with snail intermediate hosts of schistosomiasis in Senegal, Africa. Remote Sens. 2022, 14, 1345. [Google Scholar] [CrossRef]
  17. Hardy, A.; Ettritch, G.; Cross, D.E.; Bunting, P.; Liywalii, F.; Sakala, J.; Silumesii, A.; Singini, D.; Smith, M.; Willis, T.; et al. Automatic detection of open and vegetated water bodies using sentinel 1 to map African malaria vector mosquito breeding habitats. Remote Sens. 2019, 11, 593. [Google Scholar] [CrossRef] [Green Version]
  18. Hardy, A.; Oakes, G.; Hassan, J.; Yussuf, Y. Improved use of drone imagery for malaria vector control through technology-assisted digitizing (tad). Remote Sens. 2022, 14, 317. [Google Scholar] [CrossRef]
  19. Leonardo, L.; Varona, G.; Fornillos, R.J.; Manalo, D.; Tabios, I.K.; Moendeg, K.; de Cadiz, A.; Kikuchi, M.; Chigusa, Y.; Mistica, M.; et al. Oncomelania hupensis quadrasi: Snail intermediate host of schistosoma japonicum in the philippines. Acta Trop 2020, 210, 105547. [Google Scholar] [CrossRef]
  20. Qiu, J.; Li, R.; Zhu, H.; Xia, J.; Xiao, Y.; Huang, D.; Wang, Y. The effect of ecological environmental changes and mollusciciding on snail intermediate host of Schistosoma in Qianjiang city of China from 1985 to 2015. Parasit Vectors 2020, 13, 397. [Google Scholar] [CrossRef]
  21. Qiu, J.; Li, R.D.; Xu, X.J.; Yu, C.H.; Xia, X.; Hong, X.C.; Chang, B.R.; Yi, F.J.; Shi, Y.Y. Identifying determinants of oncomelania hupensis habitats and assessing the effects of environmental control strategies in the plain regions with the waterway network of China at the microscale. Int. J. Environ. Res. Public Health 2014, 11, 6571–6585. [Google Scholar] [CrossRef] [Green Version]
  22. Jinxin, Z.; Shang, X.; Shan, L.; Yi, Z.; Xiaonong, Z. Construction of a forecast system for prediction of schistosomiasis risk in China based on the flood information. Chin. J. Schisto. Control 2021, 33, 133–137. [Google Scholar]
  23. Zhang, J.; Yue, M.; Hu, Y.; Bergquist, R.; Su, C.; Gao, F.H.; Cao, Z.G.; Zhang, Z.J. Risk prediction of two types of potential snail habitats in anhui province of China: Model-based approaches. PLoS Negl. Trop. Dis. 2020, 14, e0008178. [Google Scholar] [CrossRef] [PubMed]
  24. Zhou, X.N. Implementation of precision control to achieve the goal of schistosomiasis elimination in China. Chin. J. Schistosomiasis Control 2016, 28, 1–4. [Google Scholar]
  25. Lijuan, Z.; Zhimin, X.; Fan, Y.; Hui, D.; YinLong, L.; Shan, L.; Chunli, C.; Jing, X.; Shizhu, L.; Xiaonong, Z. Endemic status of schistosomiasis in people’s republic of China in 2020. Chin. J. Schistosomiasis Control 2021, 33, 225–233. [Google Scholar]
  26. Zengwang, Z.; Xiaodong, T.; Wenlong, P.; Yuzhong, L.; Mingxing, X.; Jing, Z.; Zheng, P. Application of gps combined with google earth software in survey of oncomelania snail. China Trop. Med. 2014, 14, 64–65. [Google Scholar]
  27. Crist, E.P.; Kauth, R.J. The tasseled cap de-mystified. Photogramm. Eng. Remote Sens. 1986, 52, 81–86. [Google Scholar]
  28. Wenhui, K.; Shuwen, Z.; Guoming, D.; Changzhen, Y.; Shixin, W.; Rendong, L.; Dengsheng, L.; Tao, P.; Jing, N.; Changqing, G.; et al. Remotely sensed mapping and analysis of spatio-temporal patterns of land use change across China in 2015–2020. Acta Geogr. Sin. 2022, 77, 1056–1071. [Google Scholar]
  29. Santoro, M.; Wegmuller, U. Multi-temporal synthetic aperture radar metrics applied to map open water bodies. IEEE J. Sel. Top. Appl. Earth Obs. Remote Sens. 2014, 7, 3225–3238. [Google Scholar] [CrossRef]
  30. Souza, W.D.; Reis, L.G.D.; Ruiz-Armenteros, A.M.; Veleda, D.; Neto, A.R.; Fragoso, C.R.; Cabral, J.; Montenegro, S. Analysis of environmental and atmospheric influences in the use of sar and optical imagery from sentinel-1, landsat-8, and sentinel-2 in the operational monitoring of reservoir water level. Remote Sens. 2022, 14, 2218. [Google Scholar] [CrossRef]
  31. Martinis, S.; Twele, A.; Voigt, S. Towards operational near real-time flood detection using a split-based automatic thresholding procedure on high resolution terrasar-x data. Nat. Hazards Earth Syst. Sci. 2009, 9, 303–314. [Google Scholar] [CrossRef]
  32. Liang, J.Y.; Liu, D.S. A local thresholding approach to flood water delineation using sentinel-1 sar imagery. ISPRS J. Photogramm. Remote Sens. 2020, 159, 53–62. [Google Scholar] [CrossRef]
  33. Martinis, S.; Groth, S.; Wieland, M.; Knopp, L.; Rattich, M. Towards a global seasonal and permanent reference water product from sentinel-1/2 data for improved flood mapping. Remote Sens. Environ. 2022, 278, 113077. [Google Scholar] [CrossRef]
  34. Jia, S.C.; Xue, D.J.; Li, C.R.; Zheng, J.; Li, W.Q. Study on new method for water area information extraction based on sentinel-1 data. Yangtze River 2019, 50, 213–217. [Google Scholar]
  35. Huang, W.; DeVries, B.; Huang, C.; Lang, M.W.; Jones, J.W.; Creed, I.F.; Carroll, M.L. Automated extraction of surface water extent from sentinel-1 data. Remote Sens. 2018, 10, 797. [Google Scholar] [CrossRef] [Green Version]
  36. Shiqing, Z.; Tianping, W.; Jihua, G.; Chengguo, T.; Gonghua, Z.; Dabing, L.; Weiduo, W.; Qizhi, W. Influence on the diffusion of snail by flooding in Anhui province. J. Trop. Dis. Parasitol. 2004, 2, 90–94. [Google Scholar]
  37. Clement, M.A.; Kilsby, C.G.; Moore, P. Multi-temporal synthetic aperture radar flood mapping using change detection. J. Flood Risk Manag. 2018, 11, 152–168. [Google Scholar] [CrossRef]
  38. Zhang, Y.X.; Hu, Z.H. Variation characteristics of rainstorms in middle-lower reaches of the yangtze river in recent 60 years. Clim. Environ. Res. 2019, 24, 755–768. [Google Scholar]
  39. Yang, K.; Wang, X.-H.; Yang, G.-J.; Wu, X.-H.; Qi, Y.-L.; Li, H.-J.; Zhou, X.-N. An integrated approach to identify distribution of oncomelania hupensis, the intermediate host of schistosoma japonicum, in a mountainous region in China. Int. J. Parasitol. 2008, 38, 1007–1016. [Google Scholar] [CrossRef]
  40. Yang, K.; Zhou, X.-N.; Wu, X.-H.; Steinmann, P.; Wang, X.-H.; Yang, G.-J.; Utzinger, J.; Li, H.-J. Landscape pattern analysis and bayesian modeling for predicting oncomelania hupensis distribution in eryuan county, people’s republic of China. Am. J. Trop. Med. Hyg. 2009, 81, 416–423. [Google Scholar] [CrossRef]
  41. Zhang, Z.; Ong, S.; Peng, W.; Zhou, Y.; Zhuang, J.; Zhao, G.; Jiang, Q. A model for the prediction of oncomelania hupensis in the lake and marshland regions, China. Parasitol. Int. 2008, 57, 121–131. [Google Scholar] [CrossRef] [PubMed]
  42. Jones, I.J.; Sokolow, S.H.; Chamberlin, A.J.; Lund, A.J.; Jouanard, N.; Bandagny, L.; Ndione, R.; Senghor, S.; Schacht, A.M.; Riveau, G.; et al. Schistosome infection in senegal is associated with different spatial extents of risk and ecological drivers for Schistosoma haematobium and S. Mansoni. PLoS Negl. Trop. Dis. 2021, 15, e0009712. [Google Scholar] [CrossRef] [PubMed]
  43. Xingjian, X.; Jinyou, L.; Xun, P. Function and signification of water conservancy and anti-schistosomiasis project to control schistosomiasis transmission in China. Chin. J. Schistosomiasis Control 2010, 22, 403–406. [Google Scholar]
  44. Chaofeng, Z.; Qingfang, Z.; Yiyi, L.; Yixin, H.; Wenjun, H. Quantitative evaluation on snail control effect of snail settling pool. Yangtze River 2014, 45, 97–100. [Google Scholar]
Figure 1. The location of the study area. The base maps are Landsat 8 OLI images on 3 and 26 August 2020, respectively.
Remotesensing 14 03707 g001
Figure 2. Workflow of the proposed model. Blue represents the data source, green represents the data processing method, and orange represents intermediate or final result data.
Remotesensing 14 03707 g002
Figure 3. Distribution of snail-infested rivers and channels and sample sites for snail habitat modeling. Rivers and channels (canals or ditches) were extracted by expert knowledge-assisted human–computer interaction interpretation methods based on GF-2 remote sensing images (basemap) in 2020.
Remotesensing 14 03707 g003
Figure 4. Waterbody extraction from Sentinel-1A data. The image of the polarized index R converted from (a) Sentinel-1A SAR data on 19 June 2020, before the flood, and (b) on 12 July 2020, during the peak period of the flood. (c) The histogram of R before the flood; (d) The histogram of R during the peak period of the flood; (e) Water bodies before the flood; (f) Water bodies during the peak period of the flood; (g) Accuracy display of water extraction (blue), compared with Landsat 8 OLI image on 16 June 2020; (h) Flood-inundated area. Changes in the area of water bodies before and during the peak flood period.
Remotesensing 14 03707 g004
Figure 5. Suspected snail spread zone (orange) obtained by the intersection and identification between snail-infested areas (yellow) and flooded-inundated areas (blue) based on their proximity.
Remotesensing 14 03707 g005
Figure 6. Snail breeding probability in the study area. The probability was greater than 0 and less than 1, with no probabilities of 0 or 1. The higher the value, the more conducive to the snail survival and reproduction. The map of snail breeding probability was set to be 50% transparent so the high-resolution remote sensing base map (GF-2) was visible.
Remotesensing 14 03707 g006
Figure 7. Snail spreading and breeding probability. The higher the value is, the more conducive to the snail spread and survival after flooding.
Remotesensing 14 03707 g007
Table 1. Environmental factors, data resources, and geospatial processing methods.
FactorsData ResourceGeospatial Method
NDVILandsat 8Band math
WetnessLandsat 8Tasseled cap transformation
Paddy land proportion (PL_pro)Landsat 8; GaoFen-2Field calculator based on land-use data
River and channel density (RC_density)GaoFen-2Human–computer interaction interpretation; field calculator
Landscape metricsLand-use and ditch distributionPatch analyst
Table 2. Results of the logistic regression models applied to snail habitats.
FactorsUnivariate AnalysisMultivariate Analysis
BOR (95% CI)p-ValueBOR (95% CI)p-Value
NDVI (×10)0.8522.345 (2.082–2.641)<0.0010.4171.517 (1.187–1.940)0.001
Wetness (×100)0.0961.101 (1.070–1.133)<0.0010.2251.253 (1.077–1.457)0.003
RC_density0.1031.109 (1.092–1.125)<0.0010.0771.080 (1.020–1.143)0.008
PL_pro (×10)0.3141.368 (1.298–1.443)<0.001
FD (×100)0.1811.198 (1.165–1.233)<0.0010.1601.174 (1.139–1.210)<0.001
AWMSI0.2301.258 (1.023–1.548)0.030
MSI0.5761.780 (1.504–2.106)<0.001
MPFD−0.3600.697 (0.123–3.941)0.683
ED1.4824.404 (0.242–80.029)0.316
MPS−0.0310.969 (0.960–0.979)<0.001
MedPS−0.0020.998 (0.995–1.001)0.275
PSCoV (×0.01)−0.2470.781 (0.702–0.869)<0.001
Publisher’s Note: MDPI stays neutral with regard to jurisdictional claims in published maps and institutional affiliations.

