Article

Weighted Mean Temperature Hybrid Models in China Based on Artificial Neural Network Methods

College of Geomatics and Geoinformation, Guilin University of Technology, Guilin 541004, China
*
Author to whom correspondence should be addressed.
Remote Sens. 2022, 14(15), 3762; https://doi.org/10.3390/rs14153762
Submission received: 19 May 2022 / Revised: 30 July 2022 / Accepted: 3 August 2022 / Published: 5 August 2022

Abstract

:
The weighted mean temperature (Tm) is crucial for converting zenith wet delay to precipitable water vapor in global navigation satellite system meteorology. Mainstream Tm models have the shortcomings of poor universality and severe local accuracy loss, and they cannot reflect the nonlinear relationship between Tm and meteorological/spatiotemporal factors. Artificial neural network methods can effectively solve these problems. This study combines the advantages of the models that need in situ meteorological parameters and the empirical models to propose Tm hybrid models based on artificial neural network methods. The verification results showed that, compared with the Bevis, GPT3, and HGPT models, the root mean square errors (RMSEs) of the new three hybrid models were reduced by 35.3%/32.0%/31.6%, 40.8%/37.8%/37.4%, and 39.5%/36.4%/36.0%, respectively. The consistency of the new three hybrid models was more stable than the Bevis, GPT3, and HGPT models in terms of space and time. In addition, the three models occupy 99.6% less computer storage space than the GPT3 model, and the number of parameters was reduced by 99.2%. To better evaluate the improvement of hybrid models Tm in the precipitable water vapor (PWV) retrieval, the PWVs calculated using the radiosonde Tm and zenith wet delay (ZWD) were used as the reference. The RMSE of PWV derived from the best hybrid model’s Tm and the radiosonde ZWD meets the demand for meteorological research and is improved by 33.9%, 36.4%, and 37.0% compared with that of Bevis, GPT3, and HGPT models, respectively. The hypothesis testing results further verified that these improvements are significant. Therefore, these new models can be used for high-precision Tm estimation in China, especially in Global Navigation Satellite System (GNSS) receivers without ample storage space.

Graphical Abstract

1. Introduction

Water vapor is an essential component of the Earth’s atmosphere and is crucial for global atmospheric radiation, water cycle, and energy balance [1,2]. Study on water vapor’s spatial and temporal distribution is quite important in weather and climate forecasting. The GNSS signals propagating through the troposphere are delayed and bent due to the nonvacuum conditions, known as tropospheric delays [3,4,5]. The tropospheric delay is the zenith total delay (ZTD) multiplied by the tropospheric mapping function, and ZTD consists of zenith hydrostatic delay and zenith wet delay. The GNSS zenith wet delay can be converted into precipitable water vapor using Weighted Mean Temperature (Tm) [6]. Therefore, obtaining a high-precision Tm is crucial for improving the accuracy of GNSS retrieving precipitable water vapor [6,7,8,9,10,11,12]. Previous studies have shown that GNSS-derived PWV is accurate and reliable, with RMSE of 1–3 mm [6,13].
An accurate way to obtain high-precision Tm is to integrate the vertical profiles of temperature and humidity. However, these profiles are often challenging to obtain in practical work, and thus currently the Tm models are usually used to calculate the Tm. These models can be divided into two categories. The first category is the model that needs in situ meteorological parameters. Bevis et al. [6] analyzed the correlation between the surface temperature (Ts) and Tm of radiosonde data in North America. They found an excellent linear correlation between Tm and Ts, thereby proposing a linear regression formula of Tm ( T m = a + b T s ). Since the model coefficients have significant seasonal and local characteristics, to obtain high-precision Tm values in other regions, the coefficients of the Bevis formula need to be re-estimated from local radiosonde data [14,15]. Therefore, many scholars have established regional models for different areas [16,17,18]. These models have high accuracy; however, they are only applicable to certain areas and cannot reflect the delicate nonlinear relationship between Tm and meteorological factors. Another model [19,20] is an empirical model driven by spatiotemporal information, which does without in situ meteorological parameters and can generate empirical Tm for large area or even global locations. Leandro et al. [21] used relative humidity to replace the water vapor pressure in the parameter table of the UNB3 model and established the UNB3m model. The UNB3m model considers the annual cyclic variation of meteorological parameters, has a resolution of 15 latitudes, and can be used to calculate Tm. Yao et al. [22] used the GGOS grid Tm with a 6 h resolution to analyze the daily variation characteristics of Tm, and they constructed a new global Tm model (GTm-III) that considers the diurnal variation of Tm. Subsequently, Böhm et al. [19] established the GPT2w model, which can provide vital tropospheric parameters such as Tm and water vapor pressure with a horizontal resolution of up to 1 ° × 1 ° . Landskron et al. [23] proposed the GPT3 model, which incorporated meteorological parameter data directly from the GPT2w model; hence, Tm in the GPT3 model is consistent with GPT2w. Sun et al. [24] used ERA5 data to establish a new model integrating tropospheric delay correction for GNSS positioning and Tm calculation for GNSS meteorology. The model has a spatial resolution of 0.5 ° × 0.5 ° and a temporal resolution of 1 h. Mateus et al. [25] developed an hourly global pressure and temperature (HGPT) model based on the full spatial and temporal resolution of the new ERA5 reanalysis. The HGPT model can provide hourly surface pressure, surface air temperature, zenith hydrostatic delay, and weighted average temperature information with a spatial resolution of 0.25° × 0.25°. As the spatiotemporal factors considered by the empirical model increase, the models’ overall accuracy gradually improves, but it also increases the number of model parameters. In addition, scholars have also developed many similar empirical models [20,26,27]. Although these empirical models are driven by spatiotemporal information and convenient for use and have strong universality, their accuracy is inferior to the model that needs in situ meteorological parameters mentioned above, especially in areas with relatively sparse weather stations and large terrain fluctuations. Still, it is difficult to reflect the delicate nonlinear relationship between Tm and spatiotemporal factors; therefore, the accuracy of the Tm model needs to be further improved. Artificial neural network methods have been widely used in various industries due to their nonlinear fitting ability [28,29,30,31].
In this study, we hope to establish several Tm models with higher accuracy than the approved Tm models, such as Bevis, GPT3, and HGPT, through artificial neural networks, and these models require fewer parameters. Consequently, the PWV converted by the Tm from the new models can meet the requirements of meteorological research. To achieve this goal, we used artificial neural network methods to fit the relationship between high-precision radiosonde Tm, empirical Tm (provided by the UNB3m model with few parameters), meteorological parameters, and spatiotemporal factors, and then built high-precision Tm models.

2. Study Area and Methods for Calculating Tm

2.1. Study Area

The research area spans 70°E–135°E and 15°N–55°N, which covers the land of China and some surrounding countries and regions (see Figure 1). In this study, we accessed radiosonde data from the Integrated Global Radiosonde Archive (IGRA). Data from 150 radiosonde stations in the study area were obtained for the experiments. The distribution of the stations is indicated by the red triangles in Figure 1.

2.2. Method of Calculating Tm

2.2.1. Calculation of Tm Based on Radiosonde Data

Radiosonde data are important meteorological observation data. The IGRA has provided high-quality sounding observations from more than 1500 radiosondes and sounding balloons worldwide since the 1960s and launches radiosonde twice daily at 00:00 and 12:00 UTC. This study used data from 150 radiosonde stations (2007–2016) to calculate Tm according to the following formula [6]. It is worth mentioning that during long-term continuous observations, the radiosonde data may have discontinuities and outliers. Since these values will affect the results of the new model establishment, this study used the interquartile range (IQR) method to remove outliers in the long-term series of radiosonde data [32].
T m = ( e / T ) d H ( e / T 2 ) d H
where T is the absolute temperature (K). e is the water vapor pressure (hPa), which is calculated from the relative humidity (RH) using Equations (2) and (3) [6,10]:
e s = 6.11 × 10 ( 7.5 × T d 237.3 + T d )
e = R H · e s / 100
where es is the saturated vapor pressure (hPa) and Td is the dew point temperature (°C).

2.2.2. Calculating Tm Based on the UNB3m Model

The UNB3m model is based on a look-up table with annual mean and amplitude for temperature, pressure, temperature lapse rate, and water vapor pressure height factor. These parameters are calculated for a particular latitude and day of year using a cosine function for the annual variation and a linear interpolation for latitude. The annual average value of the meteorological parameters is calculated using the following formula:
A V G φ = { A V G 15 , φ 15 ° A V G 75 , φ 75 ° A V G i + ( A V G i + 1 A V G i ) 15 ( φ L A T i ) , 15 ° < φ < 75 °
where φ is the latitude of the target point ( ° ), A V G φ is the annual mean value, i is the latitude band closest to the target location that has a smaller value, and L A T i is the value of the corresponding latitude band. The formula for calculating the annual cycle amplitude is as follows:
A M P φ = { A M P 15 , φ 15 ° A M P 75 , φ 75 ° A M P i + ( A M P i + 1 A M P i ) 15 ( φ L A T i ) , 15 ° < φ < 75 °
where A M P φ denotes the annual cycle amplitude. The meteorological parameter values at a specified time at the target point can be calculated by entering the mean yearly value and annual periodic amplitude value of the target parameter into the trigonometric function:
X φ , d o y = A V G φ A M P φ c o s ( ( d o y d o y 0 ) 2 π 365.25 )
where X φ , d o y is the annual periodic amplitude value, d o y is the day of the year, and d o y 0 specifies the initial phase of the regular change, which is 28 in the Northern Hemisphere and 211 in the Southern Hemisphere.
The UNB3m model can calculate Tm according to the following formula:
T m = ( T 0 β H ) ( 1 β R g m ( λ + 1 ) )
where T 0 , β , and λ are the meteorological parameters calculated according to procedures (4)–(6), which are temperature (K), temperature lapse rate (K/m), and water vapor pressure height factor, respectively; H is the orthometric height (m); R is the gas constant for dry air (287.054 J/kg/K); and g m is the acceleration of gravity at the atmospheric column centroid (m/s2), which can be expressed as
g m = 9.784 ( 1 2.66 × 10 3 c o s ( 2 φ ) 2.8 × 10 7 H )
The above model has few parameters and is convenient and straightforward to use; however, the UNB3m model only considers the variation of Tm with latitude, and his grid is too sparse, so the accuracy is limited [33].

2.2.3. Calculating Tm Based on the GPT3 Model

The global pressure and temperature 3 (GPT3) model proposed by Landskron and Bohm is the latest version of the GPT series [23]. The meteorological parameters of the GPT3 model are the same as that of GPT2w with admirable performance. It is one of the most widely used models [10,31]. GPT3 characterizes Tm seasonal variations based on the following Equation (9) and takes into account their geographical variations by 1° × 1° or 5° × 5° grids.
r ( t ) = A 0 + A 1 c o s ( 2 π t 365.25 ) + B 1 s i n 2 π t 365.25 + A 2 c o s 4 π t 365.25 + B 2 s i n 4 π t 365.25
where r(t) is the meteorological parameters to be estimated; t denotes the day of year; A 0 represents its mean value; and ( A 1 , B 1 ) and ( A 2 , B 2 ) are their annual and semiannual amplitudes, respectively.

3. Construction of Hybrid Model

In this study, we use Backpropagation neural network (BPNN), Random Forest (RF), and Generalized Regression Neural Network (GRNN) in the neural network toolbox of MATLAB software to optimize UNB3m Tm by using high-precision radiosonde Tm data, then construct three hybrid models.

3.1. Three Artificial Neural Network Methods

3.1.1. BPNN

The BPNN, first proposed by Rumelhart et al. [34], is one of the most widely used ANNs. The network adopts the gradient descent method to minimize the differences between the network output and target output [35].
The BPNN consists of an input layer, a hidden layer, and an output layer. The number of neurons in the input layer of the BPNN is equal to the number of input variables, and the number of neurons in the output layer is equal to the number of output variables. Almost every bounded continuous function can be approximated with an arbitrarily minor error using a neural network with a single hidden layer [36]. Therefore, in this study, we chose the number of hidden layers as a single layer and determined the number of neurons in the hidden layer in Section 3.3.
Because the empirical model optimized in this study is the UNB3m model, UNB3m Tm must be used as an essential input for the artificial neural network model. UNB3m Tm is established considering the variations in the latitude, height, and day of year, so there must be a strong correlation between UNB3m Tm and latitude, height, and day of year. Simultaneously, some studies [4,19,24] found that there exist long-term interannual variations and diurnal variations in Tm, so we take year, hour of day (hod), latitude (lat), height, and day of year (doy) as input variables.
It is well known that the surface temperature (Ts) and water vapor pressure (es) have strong relationships with the observation Tm [6,11], and the Tm models based on in situ Ts/es observations can reach higher precision than empirical models. Thus, the Ts/es were employed as inputs for the new model. Li et al. [5] suggested that UNB3m often causes great prediction tropospheric delay biases in some areas because it is only based on latitude–label meteorological parameters that are also needed for calculating Tm. Moreover, many Tm models [11,19,25], considering the longitude variations, have excellent performance. Therefore, we also took longitude as an input variable. It should be noted that the widespread distribution of surface meteorological observation facilities, Ts and es, can be obtained in real-time in most regions [37]. Therefore, it is not difficult to obtain the temperature and water vapor pressure to support the operation of the new model, and establishing the Tm model based on meteorological parameters has a good potential for real-time application. Table 1 shows all the input parameters and the output parameter. In addition, when training the model, the radiosonde-derived Tm was loaded into the output layer, and the output layer outputs the corrected Tm value when used. The structure of the BPNN Tm model is shown in Figure 2.
The process of training the BPNN includes forward and backpropagation. Each neuron in each layer of the BPNN model is directly connected to the neurons in the next layer and had an activation function. This study used the hyperbolic tangent function to activate the input and hidden layer neurons. A linear function was used to activate the neurons of the hidden and output layers. The equations are represented as:
g ( x ) = 2 1 + exp ( 2 x ) 1
f ( x ) = x
Then the final output of BPNN can be expressed as:
Y ( X ) = f ( W 3 , 2 · g ( W 2 , 1 · X + b 1 ) + b 2 )
where W 2 , 1 and W 3 , 2 represent the weight matrix, b 1 and b 2 represent the bias matrix. These four matrices store the coefficients of the BPNN model. X and Y are the input and output variables, respectively.

3.1.2. RF

Breiman and Cutler first proposed a random forest in 2001 [38]. RF is an ensemble learning method used for classification and regression. RF works by constructing many decision trees during training and then outputting the mode of the classes or the average prediction of the individual trees [38]. RF has the advantages of fast training speed and handling complex nonlinear relationships between the input and output variables. The structure of the RF Tm model is shown in Figure 3. The input data included time (year, day of year, and hour of day), location (latitude, longitude, and height), es, Ts, and UNB3m-Tm. In addition, the output data were radiosonde-derived Tm or the corrected Tm. Because overfitting can occur with a single decision tree, RF overcomes this problem by introducing randomness into each decision tree and averaging the results. The result of the model was the mean of the consequences of all constructed decisions, as shown in the following formula:
Y ( X ) = 1 B b = 1 B T b ( X )
where X represents the input variable, Y is the final RF output value, T b denotes the output value of each decision tree, and B represents the number of decision trees. The number of decision trees directly affected the accuracy of the RF model. Because the number of decision trees must be optimally selected, the enumeration method is generally used. The specific number value is determined in Section 3.3.

3.1.3. GRNN

Specht first proposed GRNN in 1991 [39]. The GRNN neural network is a radial basis function network based on mathematical statistics. The GRNN has a strong nonlinear mapping ability and learning speed, and the network can also handle unstable data. The GRNN consists of four layers: the input, pattern, summation, and output layers. The number of neurons in the input layer corresponds to the number of input variables; nine neurons correspond to the time information (year, day of year, and hour of day), location information (latitude, longitude, and height), es, Ts and UNB3m-Tm. The number of neurons in the output layer corresponds to the number of output variables. In this experiment, the output layer had only one neuron corresponding to the radiosonde Tm or the model-corrected Tm. The summation layer includes two types of summation neurons, which perform arithmetic summation and weighted summation of the output values of the pattern layer. The number of neurons in the pattern layer corresponds to the number of training samples, and the transmission of neurons can be expressed as:
p i = e x p { ( X X i ) T ( X X i ) 2 σ 2 } , i = 1 , 2 , , n
where p i is the output of the i neuron in the pattern layer, represented by the exponential function of the square of the Euclidean distance between the input variable X i (the i -th learning sample) and its corresponding test sample. σ represents the spread parameter, the only unknown parameter in the network, and needs to be set first. It is necessary to determine the optimal spread parameter as a σ , which, when too large, may make the estimation very smooth or, when too small, may result in a value too close to the sample value [39]. The specific value is defined in Section 3.3. The structure of the GRNN Tm model is shown in Figure 4.

3.2. Evaluation Indicators Adopted by the Model

This experiment adopted a 10-fold cross-validation method to evaluate the different artificial neural network models [40]. The basic principle of the 10-fold cross-validation technique is to randomly split the dataset into 10 groups and then select 9 groups as the training set and 1 group as the test set. This process was repeated 10 times, so each part of the dataset was tested once, trained 9 times, and all residuals were computed and saved. Note that it can ensure that more data is involved in the training so that the results are closer to the accuracy of the final model and can also prevent overfitting. We calculated five statistical indicators based on these residuals to evaluate model performance. These indicators are the bias, mean absolute error (MAE), standard deviation (STD), root mean square error (RMSE), and Pearson correlation coefficient (R). The formulas of these indicators are as follows:
B i a s = 1 N i = 1 N ( T k , i h m T k , i r s )
M A E = 1 N i = 1 N | T k , i h m T k , i r s |
S T D = 1 N i = 1 N ( T k , i h m T k , i r s B i a s ) 2
R M S E = 1 N i = 1 N ( T k , i h m T k , i r s ) 2
R = i = 1 N ( T k , i h m T k , i h m ¯ ) ( T k , i r s T k , i r s ¯ ) i = 1 N ( T k , i h m T k , i h m ¯ ) 2 i = 1 N ( T k , i r s T k , i r s ¯ ) 2
where N is the number of samples, T k , i h m is the Tm value output by the hybrid models, T k , i r s is the Tm values derived from the radiosonde data, and T k , i h m ¯ , T k , i r s ¯ are the mean values of T k , i h m and T k , i r s , respectively.
After verifying the accuracy and reliability of the hybrid models using 10-fold cross-validation, we fitted all samples to generate the final model for subsequent Tm prediction. When users want to use the hybrid models to calculate Tm, they only need to collect Ts and es and then input them with the time and location information into the models’ code.

3.3. Parameter Determination

In this experiment, the number of neurons in the BPNN hidden layer, the number of RF decision trees, and the GRNN spread value are the parameters that need to be set first. We followed Sun et al. [41] to set up the crucial parameters. For the BPNN, the optimal number of neurons in the hidden layer can be selected in the range of 2 n + μ to 2 n + 1 ( n is the number of neurons in the input layer, μ is the number of neurons in the output layer) [42,43]; therefore, the experiment used a 10-fold cross-validation technique to test the BPNN models with 7 to 19 hidden layer neurons. For RF, we set the number of decision trees between 5 and 95 with a step size of 10 and then used 10-fold cross-validation to test the performance of RF models with different numbers of decision trees. For GRNN, the spread value used is usually in the range of 0.01 to 1 [28]. After many tests, we found that the optimal spread value was between 0 and 0.1; therefore, this experiment narrowed the selection range from 0.01 to 0.1, with a step size of 0.01. Similarly, we used a 10-fold cross-validation technique to test the performance of GRNN models with different spread values. Finally, the root mean square errors (RMSE) calculated from the cross-validation residuals were used to evaluate the performance of the other models with different parameter settings. The results are shown in Figure 5.
In the BPNN model, the RMSE gradually decreased as the number of neurons in the hidden layer increased. This decline stopped when the number of neurons reaches 18. Therefore, we can set 18 or 19 as the number of hidden layer neurons. When the neuron number changed from 18 to 19, we found that the RMSE was equal, but a very long training time was required. Therefore, we set the number of neurons in the hidden layer to 18. In the RF model, when the number of decision trees increased from 5 to 55, the RMSE decreased significantly. But this decrease closed out after the number of decision trees exceeded 55. Thus, we set the number of decision trees to 55 to reduce the complexity of the model. In the GRNN model, when the spread value increased from 0 to 0.06, the RMSE gradually decreased; however, after the spread value exceeded 0.06, the RMSE gradually increased. Therefore, we finally chose 0.06 as the spread value.

4. Performance Analyses of Hybrid Models

In this study, the three hybrid models constructed using the three artificial neural network methods of BPNN, RF, and GRNN are named hybrid model 1, hybrid model 2, and hybrid model 3 (referred to as hm1, hm2, and hm3, respectively). The Bevis model ( T m = 70.2 + 0.72 T s ) needs in situ meteorological parameters as input and is commonly used internationally. The GPT3 model is an empirical model that is widely used, and it is a grid model that also can reflect the characteristics of Tm in a certain area. Its accuracy performance in China can be used to represent mainstream empirical models. The HGPT model [25] is a recently released Tm model with open source code. Therefore, the Bevis, GPT3 (1° × 1°), and HGPT models were chosen to compare with the new models.

4.1. Overall Performance

After determining the parameters of the three artificial neural network methods, the experiment selected 936,034 samples from 2007 to 2016 for training and obtained the corresponding models and results. The cross-validation and model fitting accuracy results are listed in Table 2. Note that since the 10-fold validation uses all the data to verify the model’s accuracy, the validation results here span from 2007 to 2016. Scatter plots between the Tm values obtained from different models and the Tm values derived from the radiosonde data are shown in Figure 6 and Figure 7. In Figure 6 and Figure 7, the color indicates data density.
Table 2 shows that the biases of the UNB3m model, the Bevis model, and the GPT3 model are −1.97 K, 0.80 K, and −0.48 K, respectively. The results indicate that there are systematic biases in the three models. However, the biases of the three hybrid models are all close to zero, which suggests that the artificial neural network method successfully corrects systematic biases. Because the artificial neural network methods successfully removed systematic biases, the STDs and RMSEs were nearly equal. After being corrected by the three hybrid models, the RMSEs are reduced to 2.954 K, 2.703 K, and 2.763 K, which are 73.1%, 75.3%, and 74.8% lower than the UNB3m model, respectively. By using the analysis of variance (ANOVA), it is further demonstrated that the Tm of the three hybrid models is not significantly different from the radiosonde Tm (p > 0.05). Meanwhile, relative to the Bevis model, the RMSEs were reduced by 35.3%, 40.8%, and 39.5%; for the GPT3 model, the RMSEs were reduced by 32.0%, 37.8%, and 36.4%; for the HGPT model, the RMSEs were reduced by 31.6%, 37.4%, and 36.0% respectively. After improving the three artificial neural network methods, the correlation coefficient R increased from 0.540 to 0.969, 0.974, and 0.973. The above analysis shows that all three artificial neural network methods significantly improved the accuracy of the UNB3m model in calculating Tm. These improvements may be accounted for by the strong ability of artificial neural network methods to fit complex nonlinear relationships. (The discussion will be described in the following paragraph.) In addition, when comparing the three hybrid models, we can see that the accuracy validation result of hm2 is smaller than those of hm1 and hm3. Therefore, hm2 exhibited a more stable performance.
To illustrate whether the improvement in accuracy of the three hybrid models comes from the data source or the method, we developed a linear model named LS model, which has the same input parameters as the three hybrid models using the least-squares method. The LS model is based on the same modeling data set as the hybrid model, and the specific formula is as follows:
T m = a 1 + a 2 · T s + a 3 · e s a 4 + a 5 · h + a 6 · l o n + a 7 · l a t + a 8 · c o s ( D O Y a 9 365.25 2 π ) + a 10 · c o s ( D O Y a 11 365.25 4 π ) + a 12 · c o s ( H O D a 13 24 2 π ) + a 14 · c o s ( H O D a 15 24 4 π )
Then, the accuracy of the hybrid models, LS model, Bevis model, GPT3 model, and HGPT model are compared. The results are shown in Table 3.
Table 3 shows that the RMSE of the LS model has been improved to different degrees when compared with that of the Bevis, GPT3, and HGPT models, which should be due to the use of the Ts, es, and Tm data in the study area to fit the relationship between them. Using the same data source, the RMSE of the three hybrid models increased by 13.2%, 23.7%, and 21.0% compared with the LS model. This improvement should be due to the method that can fit the nonlinear relationship between different parameters.

4.2. Spatiotemporal Performance of the Hybrid Models

In this section, we calculate the RMSEs of 150 radiosonde stations to analyze the spatial performance of the hybrid models. Figure 8 shows the specific values and distributions. Figure 9 shows the frequencies of the RMSEs for each interval. The numbers over the bars represent the number of stations within the corresponding RMSE range. Figure 8 and Figure 9 also include the RMSEs of the UNB3m, Bevis, GPT3, and HGPT models at each radiosonde station.
As shown in Figure 8, regardless of the model used, low latitudes show a smaller RMSE and high latitudes show a larger RMSE, which is consistent with the results of Sun et al. [24]. This phenomenon occurs because the seasonal variation at high latitudes is more substantial than that at low latitudes, which increases the difficulty of Tm modeling and eventually leads to larger RMSEs at high latitudes. At the same time, it can be seen in the figure that the RMSEs of the UNB3m model exhibit apparent differences in different latitude ranges. In contrast, the three hybrid models are uniformly distributed and stable. The RMSEs of the Bevis, GPT3, and HGPT models are much larger than those of the three hybrid models. Therefore, the method proposed in this study improves the accuracy of the model. Further, it makes the model accuracy more evenly distributed in space, owing to the introduction of geographic information into the model input layer.
Figure 9 shows that the RMSEs of the three hybrid models are much smaller than the UNB3m model. Simultaneously, compared with the RMSEs of the Bevis model, the GPT3 model, and the HGPT model, the hybrid models also have a significant improvement. The number of sites with an RMSE value smaller than 3.0 K is 0 for the UNB3m model, 74 for the hybrid model 1, 101 for the hybrid model 2, 89 for the hybrid model 3, 22 for the Bevis model, 20 for the GPT3 model, and 21 for the HGPT model. The above results show that the method proposed in this study significantly improves the model’s accuracy, and hm2 performs best in all models.
Because latitude is an essential factor affecting Tm [6], we divided the study area into eight latitude bands with intervals of 5° to compare and analyze the performance of each model in different latitude bands. The results are shown in Figure 10.
The biases of the three hybrid models at different latitudes are all close to zero, which indicates that the artificial neural network method has a noticeable effect on correcting the systematic error of the UNB3m model (Figure 10). The stability of the hybrid models at different latitudes is better than that of the Bevis, GPT3, and HGPT models (Figure 10). The RMSEs of all models are generally smaller at low latitudes and larger at high latitudes and show an increasing trend with increasing latitude, which is consistent with the results presented in Figure 8. Regardless of the latitude band, the RMSEs of the hybrid models were much lower than those of the Bevis, GPT3, and HGPT models, indicating that the three hybrid models significantly improved the accuracy of Tm. Furthermore, compared with the Bevis, GPT3, and HGPT models, the RMSEs of the three hybrid models are all within 2 to 3.6 K in different latitude bands, and the variation between various bands is slight and uniform, showing more notable advantages. Comparing the three hybrid models, the RMSEs of hm2 at different latitudes are slightly lower than those of the other two models. This result means that hm2 outperforms other models.
Tm is greatly affected by station altitude, and altitude differences may lead to uncertainties of Tm model accuracy [6]. Therefore, we divided the height into eight layers with an interval of 0.5 km and calculated RMSEs for each height layer. The results of the analysis are presented in Figure 11.
Figure 11 shows that the biases of the three hybrid models tend to be stable and remain near 0, indicating that the accuracies of the hybrid models at different heights are much better than the UNB3m model, Bevis model, GPT3 model, and HGPT model. The RMSEs of the hybrid models obtained after optimization by the artificial neural network methods are 30% lower, relative to the UNB3m model. The RMSEs of the three hybrid models decrease with the increase in altitude and are lower than that of the Bevis, GPT3, and HGPT models. Furthermore, most of the RMSEs of the three hybrid models were below 3 K and were much smaller than those of the UNB3m, Bevis, GPT3, and HGPT models. This result shows that the accuracies of the hybrid models are higher than those of the Bevis, GPT3, and HGPT models and have a more stable accuracy in the vertical direction.
Because Tm has prominent seasonal characteristics [6], we calculated the biases and RMSEs for the four seasons to analyze the temporal variation of the performance of each model, as shown in Figure 12.
Figure 12 shows that the UNB3m model shows poor accuracy in all seasons, especially in summer. However, after the correction by the artificial neural network methods, the accuracy in each season has been greatly improved. The RMSE in spring, autumn, and winter dropped to more than 50% of the UNB3m model, and the RMSE in summer directly decreased to more than 80%. In addition, the RMSEs of the hybrid models in each period are smaller than that of the Bevis, GPT3, and HGPT models, indicating the superiority of the hybrid model. The hybrid models have higher and more uniform accuracy in time. When comparing the three hybrid models, we can see that the RMSEs of hm2 are smaller than those of hm1 and hm3. Therefore, hm2 performs best in each season.

4.3. Occupancy of Hybrid Models

We also compared the computer storage space and the number of parameters for each model, and the results are presented in Table 4.
Table 4 indicates that the computer storage space occupied by the three hybrid models is small and is reduced by 99.6% compared to that occupied by the GPT3 model. Compared with GPT3 model, the number of parameters was reduced by 99.2%. Therefore, the new model has a tremendous advantage in storage.

5. Applications of Hybrid Models in Retrieving PWV

From the performance discussions of the three hybrid models, we recommend hybrid model 2 (Hm2). The formula for calculating PWV by combining ZWD and Tm is as follows:
P W V = Π × Z W D
Π = 10 6 ρ w R v [ k 3 / T m + k 2 ]
where ρ w is the density of water and R v is the specific gas constant.
To evaluate the effect of error in Tm on its synthesized PWV, a commonly used quantity is the relative error in PWVs calculated using the following formula:
σ p w v P W V = Π ( T m + σ T m ) Π ( T m ) Π ( T m ) = 1 + k 2 k 3 T m 1 + k 2 k 3 ( T m + σ T m ) · T m + σ T m T m 1
where σ p w v is the error in PWV caused by the error in Tm and σ T m .
Since k 2 / k 3 5.9 × 10 5 K−1 and Tm is in the range from 220 K to 310 K in our experiment, Equation (23) can be simplified to [22,44]
σ p w v P W V T m + σ T m T m 1 = σ T m T m
Assuming that there is no error in the value of ZWD, if the error of Tm is small, this will improve the converting accuracy of ZWD to PWV. Therefore, our established hybrid model will indirectly enhance the accuracy of PWV.
To further illustrate the improved accuracy of the hybrid model for PWV inversion, we selected four stations for analysis, and the station information is shown in Table 5. The PWVs calculated from the ZWD and the Tm provided by the four radiosonde stations in 2016 were employed as a reference to validate the PWV mapped from radiosonde ZWD using the hybrid model 2/Bevis/GPT3/HGPT model. The results are shown in Figure 13, Table 6 and Table 7.
As shown in Figure 13, the PWV calculated by the hybrid model agrees better with the reference value, which shows that the hybrid model outperforms the Bevis, GPT3, and HGPT models in retrieving the PWV. The RMSEs of PWV derived from the Hm2 model are all less than 1 mm; the accuracy is very appreciable in weather research because the required RMS is 3 mm [45]. Table 6 and Table 7 show that compared with the Bevis model, the retrieving PWV accuracy of the hybrid model is greatly improved, and its MAE is 96.5% lower on average than the Bevis model. The RMSE is 89.8% lower on average. The accuracy of the hybrid model in retrieving PWV has been dramatically improved in comparison with the GPT3 model and the HGPT model. Simultaneously, the MAE of the hybrid model decreased by 103.7% and 107.3% on average, and RMSE decreased by 96.9% and 102.7%, respectively. These proved that the hybrid model is superior to the Bevis, GPT3, and HGPT models in retrieving PWV.
To demonstrate the outperformance of the Hm2 for retrieving PWV more intuitively, Figure 14 gives RMSEs reduction at all radiosonde stations. Figure 14 illustrates that the Hm2 model shows smaller RMSE than other models at most stations. The mean RMSE reduction of the Hm2 model reaches up to 33.9% in comparison with Bevis, 36.4% in comparison with GPT3, and 37.0% in comparison with HGPT. It is interesting to note that the RMSE of the Hm2 PWV is reduced at all stations in China Mainland. Overall, the Hm2 model performs the best in mapping ZWD onto PWV.
To further verify the Hm2 has a significant improvement in accuracy compared to the comparison model, the RMSE of each model at each site was used as a sample for hypothesis testing. Set the null hypothesis H0: there is no significant difference between the RMSE of the comparison model at each site (sample X1) and the RMSE of the Hm2 model at each site (sample X2). Alternative hypothesis H1: there is a significant difference between X1 and X2. Due to the large sample size, the z-test [46] was used. Set the left-side confidence level to a = 0.05. Calculating the statistic z and looking up the table to get the corresponding p value, the result is shown in Table 8. By comparing the statistic z and the p value (p (|Z| > 1.64) = 0.05), we can see that the absolute value of the z of the three pairs of samples is larger than 1.64 in all cases, with the corresponding p less than 0.05. Therefore, the null hypothesis is finally rejected, indicating significant differences among the Hm2 RMSEs and other model’s RMSEs. This result suggests that the Hm2 RMSE is improved significantly compared to that of other models at the 95% confidence level.

6. Conclusions

To overcome the drawbacks of existing Tm models with poor universality, profound local accuracy loss, and difficulty in reflecting the nonlinear relationship between Tm and meteorological parameters, this study used artificial neural network methods for constructing Tm hybrid models in China. Validated with radiosonde Tm, the accuracies of the three hybrid models were 2.954 K, 2.703 K, and 2.763 K in terms of RMSE. In view of RMSE, compared with the UNB3m model, the accuracies were improved by 73.1%, 75.3%, and 74.8%; for the Bevis model, accuracies were optimized by 35.3%, 40.8%, and 39.5%; and for the GPT3 model, accuracies were improved by 32.0%, 37.8%, and 36.4%, respectively. Moreover, the hybrid models effectively weakened the spatiotemporal variation in the accuracy of the UNB3m model and achieved higher and more uniform accuracy in space and time. Among the three hybrid models, hm2 exhibited the best performance, followed by hm3. The models constructed in this study had better accuracy than the three international models. Moreover, the computer storage space occupied by the new models is significantly lower than that of the GPT3 model, and the number of parameters is substantially reduced. The accuracy improvement in the best hybrid model’s Tm on its resultant PWV at four exemplary radiosonde stations and the whole study area were investigated using the PWVs through the radiosonde ZWD and Tm. The RMSEs of PWV derived from the Hm2 model are all less than 1 mm at exemplary radiosonde stations; the accuracy meets the needs of weather research. The overall error of the best hybrid model’s Tm in the resultant PWV is smaller than that of Bevis, GPT3, and HGPT models by 33.9%, 36.4%, and 37.0% in terms of RMSE. The results of hypothesis testing further proved that this accuracy improvement of the best hybrid Tm relative to the compared models is significant. The new models can be widely used to calculate high-precision Tm and are more suitable for GNSS receivers without large storage space.
However, the study area was mainly conducted in China, and the global regions need to be further examined to validate the new models. In addition, meteorological parameters (surface temperature and water vapor pressure) were considered when constructing the model in this study. In future research, we hope to develop a globally hybrid model that can calculate the Tm only based on geographical information (latitude, longitude, height) and temporal information (year, day of year (doy), hour of day (hod)).

Author Contributions

Data curation, L.L., L.H. (Liangke Huang), L.Z. and H.H.; formal analysis, M.C. and J.L.; investigation, J.L.; methodology, M.C. and J.L.; software, M.C. and J.L.; validation, M.C., J.L. and L.L.; writing—original draft preparation, J.L.; writing—review and editing, J.L., M.C., L.H. (Liangke Huang), L.Z. and L.H. (Ling Huang). All authors have read and agreed to the published version of the manuscript.

Funding

This work was supported by the Guangxi Natural Science Foundation of China (2020GXNSFBA297145), Foundation of Guilin University of Technology (GUTQDJJ6616032), National Natural Science Foundation of China (42074035, 41874033, 42064002), China Postdoctoral Science Foundation (2019T120687, 2018M630880), the Fundamental Research Funds for the Central Universities (2042020kf0009), Guangxi Science and Technology Base and Talent Project (No.AD1924 5060), and Innovation Project of Guangxi Graduate Education (YCSW2022 322).

Data Availability Statement

The radiosonde data can be accessed at http://www1.ncdc.noaa.gov/pub/data/igra/ (accessed on 16 January 2022). The UNB3m codes can be accessed at https://www2.unb.ca/gge/Resources/unb3m/unb3m.html (accessed on 16 January 2022). The GPT3 codes can be accessed at https://vmf.geo.tuwien.ac.at/codes/ (accessed on 16 January 2022). The HGPT codes can be accessed at https://github.com/pjmateus/hgpt_model (accessed on 18 July 2022). The training data and artificial neural network codes are available in https://github.com/jyli999/HmTm_models (accessed on 18 July 2022).

Acknowledgments

The authors would like to thank the University of New Brunswick (UNB) for providing the UNB3m codes, Vienna University of Technology for providing the GPT3 codes, and IGRA (Integrated Global Radiosonde Archive) for providing the radiosonde data. We would like to thank Mateus et al. for providing the HGPT codes.

Conflicts of Interest

The authors declare no conflict of interest.

References

  1. Wang, J.H.; Zhang, L.Y. Climate applications of a global, 2-hourly atmospheric precipitable water dataset derived from IGS tropospheric products. J. Geod. 2009, 83, 209–217. [Google Scholar] [CrossRef] [Green Version]
  2. Jin, S.; Luo, O.F. Variability and Climatology of PWV From Global 13-Year GPS Observations. IEEE Trans. Geosci. Remote Sens. 2009, 47, 1918–1924. [Google Scholar] [CrossRef]
  3. Wang, J.; Balidakis, K.; Zus, F.; Chang, X.; Ge, M.; Heinkelmann, R.; Schuh, H. Improving the Vertical Modeling of Tropospheric Delay. Geophys. Res. Lett. 2022, 49, e2021GL096732. [Google Scholar] [CrossRef]
  4. Wang, X.M.; Zhang, K.F.; Wu, S.Q.; He, C.Y.; Cheng, Y.Y.; Li, X.X. Determination of zenith hydrostatic delay and its impact on GNSS-derived integrated water vapor. Atmos. Meas. Tech. 2017, 10, 2807–2820. [Google Scholar] [CrossRef] [Green Version]
  5. Li, W.; Yuan, Y.B.; Ou, J.K.; Chai, Y.J.; Li, Z.S.; Liou, Y.A.; Wang, N.B. New versions of the BDS/GNSS zenith tropospheric delay model IGGtrop. J. Geod. 2015, 89, 73–80. [Google Scholar] [CrossRef]
  6. Bevis, M.; Businger, S.; Herring, T.A.; Rocken, C.; Anthes, R.A.; Ware, R.H. Gps Meteorology—Remote-Sensing of Atmospheric Water-Vapor Using the Global Positioning System. J. Geophys. Res.-Atmos. 1992, 97, 15787–15801. [Google Scholar] [CrossRef]
  7. Yu, S.W.; Liu, Z.Z. Temporal and Spatial Impact of Precipitable Water Vapor on GPS Relative Positioning During the Tropical Cyclone Hato (2017) in Hong Kong and Taiwan. Earth Space Sci. 2021, 8, e2020EA001371. [Google Scholar] [CrossRef]
  8. Zhao, Q.Z.; Liu, Y.; Ma, X.W.; Yao, W.Q.; Yao, Y.B.; Li, X. An Improved Rainfall Forecasting Model Based on GNSS Observations. IEEE Trans. Geosci. Remote Sens. 2020, 58, 4891–4900. [Google Scholar] [CrossRef]
  9. Zhang, H.X.; Yuan, Y.B.; Li, W.; Ou, J.K.; Li, Y.; Zhang, B.C. GPS PPP-derived precipitable water vapor retrieval based on T-m/P-s from multiple sources of meteorological data sets in China. J. Geophys. Res.-Atmos. 2017, 122, 4165–4183. [Google Scholar] [CrossRef]
  10. Wang, X.M.; Zhang, K.F.; Wu, S.Q.; Fan, S.J.; Cheng, Y.Y. Water vapor-weighted mean temperature and its impact on the determination of precipitable water vapor and its linear trend. J. Geophys. Res.-Atmos. 2016, 121, 833–852. [Google Scholar] [CrossRef]
  11. Yao, Y.; Zhang, B.; Xu, C.; Yan, F. Improved one/multi-parameter models that consider seasonal and geographic variations for estimating weighted mean temperature in ground-based GPS meteorology. J. Geod. 2013, 88, 273–282. [Google Scholar] [CrossRef]
  12. Jin, S.G.; Li, Z.; Cho, J. Integrated Water Vapor Field and Multiscale Variations over China from GPS Measurements. J. Appl. Meteorol. Climatol. 2008, 47, 3008–3015. [Google Scholar] [CrossRef]
  13. Lee, S.W.; Kouba, J.; Schutz, B.; Kim, D.H.; Lee, Y.J. Monitoring precipitable water vapor in real-time using global navigation satellite systems. J. Geod. 2013, 87, 923–934. [Google Scholar] [CrossRef]
  14. Emardson, T.R.; Elgered, G.; Johansson, J.M. Three months of continuous monitoring of atmospheric water vapor with a network of Global Positioning System receivers. J. Geophys. Res.-Atmos. 1998, 103, 1807–1820. [Google Scholar] [CrossRef]
  15. Ross, R.J.; Rosenfeld, S. Estimating mean weighted temperature of the atmosphere for Global Positioning System applications. J. Geophys. Res.-Atmos. 1997, 102, 21719–21730. [Google Scholar] [CrossRef] [Green Version]
  16. Wang, S.M.; Xu, T.H.; Nie, W.F.; Wang, J.; Xu, G.C. Establishment of atmospheric weighted mean temperature model in the polar regions. Adv. Space Res. 2020, 65, 518–528. [Google Scholar] [CrossRef]
  17. Liu, C.; Zheng, N.S.; Zhang, K.F.; Liu, J.Y. A New Method for Refining the GNSS-Derived Precipitable Water Vapor Map. Sensors 2019, 19, 698. [Google Scholar] [CrossRef] [PubMed] [Green Version]
  18. Liu, J.H.; Yao, Y.B.; Sang, J.Z. A new weighted mean temperature model in China. Adv. Space Res. 2018, 61, 402–412. [Google Scholar] [CrossRef]
  19. Bohm, J.; Moller, G.; Schindelegger, M.; Pain, G.; Weber, R. Development of an improved empirical model for slant delays in the troposphere (GPT2w). GPS Solut. 2015, 19, 433–441. [Google Scholar] [CrossRef] [Green Version]
  20. Schuler, T. The TropGrid2 standard tropospheric correction model. GPS Solut. 2014, 18, 123–131. [Google Scholar] [CrossRef]
  21. Leandro, R.F.; Langley, R.B.; Santos, M.C. UNB3m_pack: A neutral atmosphere delay package for radiometric space techniques. GPS Solut. 2008, 12, 65–70. [Google Scholar] [CrossRef]
  22. Yao, Y.B.; Xu, C.Q.; Zhang, B.; Cao, N. GTm-III: A new global empirical model for mapping zenith wet delays onto precipitable water vapour. Geophys. J. Int. 2014, 197, 202–212. [Google Scholar] [CrossRef] [Green Version]
  23. Landskron, D.; Bohm, J. VMF3/GPT3: Refined discrete and empirical troposphere mapping functions. J. Geod. 2018, 92, 349–360. [Google Scholar] [CrossRef] [PubMed]
  24. Sun, Z.Y.; Zhang, B.; Yao, Y.B. An ERA5-Based Model for Estimating Tropospheric Delay and Weighted Mean Temperature Over China With Improved Spatiotemporal Resolutions. Earth Space Sci. 2019, 6, 1926–1941. [Google Scholar] [CrossRef]
  25. Mateus, P.; Catalão, J.; Mendes, V.B.; Nico, G. An ERA5-Based Hourly Global Pressure and Temperature (HGPT) Model. Remote Sens. 2020, 12, 1098. [Google Scholar] [CrossRef] [Green Version]
  26. Mateus, P.; Mendes, V.B.; Plecha, S.M. HGPT2: An ERA5-Based Global Model to Estimate Relative Humidity. Remote Sens. 2021, 13, 2179. [Google Scholar] [CrossRef]
  27. Huang, L.K.; Liu, L.L.; Chen, H.; Jiang, W.P. An improved atmospheric weighted mean temperature model and its impact on GNSS precipitable water vapor estimates for China. GPS Solut. 2019, 23, 51. [Google Scholar] [CrossRef]
  28. Yuan, Q.Q.; Xu, H.Z.; Li, T.W.; Shen, H.F.; Zhang, L.P. Estimating surface soil moisture from satellite observations using a generalized regression neural network trained on sparse ground-based measurements in the continental U.S. J. Hydrol. 2020, 580, 124351. [Google Scholar] [CrossRef]
  29. Shamshiri, R.; Motagh, M.; Nahavandchi, H.; Haghighi, M.H.; Hoseini, M. Improving tropospheric corrections on large-scale Sentinel-1 interferograms using a machine learning approach for integration with GNSS-derived zenith total delay (ZTD). Remote Sens. Environ. 2020, 239, 111608. [Google Scholar] [CrossRef]
  30. Li, L.; Xu, Y.; Yan, L.Z.; Wang, S.L.; Liu, G.L.; Liu, F. A Regional NWP Tropospheric Delay Inversion Method Based on a General Regression Neural Network Model. Sensors 2020, 20, 3167. [Google Scholar] [CrossRef]
  31. Ding, M.H. A neural network model for predicting weighted mean temperature. J. Geod. 2018, 92, 1187–1198. [Google Scholar] [CrossRef]
  32. Klos, A.; Hunegnaw, A.; Teferle, F.N.; Abraha, K.E.; Ahmed, F.; Bogusz, J. Statistical significance of trends in Zenith Wet Delay from re-processed GPS solutions. GPS Solut. 2018, 22, 51. [Google Scholar] [CrossRef] [Green Version]
  33. Mao, J.; Wang, Q.; Liang, Y.; Cui, T. A new simplified zenith tropospheric delay model for real-time GNSS applications. GPS Solut. 2021, 25, 43. [Google Scholar] [CrossRef]
  34. Rumelhart, D.E.; Hinton, G.E.; Williams, R.J. Learning representations by back-propagating errors. Nature 1986, 323, 533–536. [Google Scholar] [CrossRef]
  35. Hecht-Nielsen, R. Theory of the backpropagation neural network. In Neural Networks for Perception; Academic Press: Cambridge, UK, 1992; pp. 65–93. [Google Scholar]
  36. Hornik, K.; Stinchcombe, M.; White, H. Multilayer feedforward networks are universal approximators. Neural Netw. 1989, 2, 359–366. [Google Scholar] [CrossRef]
  37. Yao, Y.B.; Sun, Z.Y.; Xu, C.Q. Establishment and Evaluation of a New Meteorological Observation-Based Grid Model for Estimating Zenith Wet Delay in Ground-Based Global Navigation Satellite System (GNSS). Remote Sens. 2018, 10, 1718. [Google Scholar] [CrossRef] [Green Version]
  38. Breiman, L. Random Forests. Mach. Learn. 2001, 45, 5–32. [Google Scholar] [CrossRef] [Green Version]
  39. Specht, D.F. A general regression neural network. IEEE Trans Neural Netw 1991, 2, 568–576. [Google Scholar] [CrossRef] [Green Version]
  40. Rodriguez, J.D.; Perez, A.; Lozano, J.A. Sensitivity Analysis of k-Fold Cross Validation in Prediction Error Estimation. IEEE Trans. Pattern Anal. Mach. Intell. 2010, 32, 569–575. [Google Scholar] [CrossRef]
  41. Sun, Z.; Zhang, B.; Yao, Y. Improving the Estimation of Weighted Mean Temperature in China Using Machine Learning Methods. Remote Sens. 2021, 13, 1016. [Google Scholar] [CrossRef]
  42. Reich, S.L.; Gomez, D.R.; Dawidowski, L.E. Artificial neural network for the identification of unknown air pollution sources. Atmos. Environ. 1999, 33, 3045–3052. [Google Scholar] [CrossRef]
  43. Gardner, M.W.; Dorling, S.R. Artificial neural networks (the multilayer perceptron)—A review of applications in the atmospheric sciences. Atmos. Environ. 1998, 32, 2627–2636. [Google Scholar] [CrossRef]
  44. Wang, J.H.; Zhang, L.Y.; Dai, A. Global estimates of water-vapor-weighted mean temperature of the atmosphere for GPS applications. J. Geophys. Res.-Atmos. 2005, 110, D21101. [Google Scholar] [CrossRef] [Green Version]
  45. Yuan, Y.; Zhang, K.; Rohm, W.; Choy, S.; Norman, R.; Wang, C.-S. Real-time retrieval of precipitable water vapor from GPS precise point positioning. J. Geophys. Res.-Atmos. 2014, 119, 10044–10057. [Google Scholar] [CrossRef]
  46. Chen, M. F-test and z-test for high-dimensional regression models with a factor structure. J. Stat. Comput. Simul. 2022, 1–20. [Google Scholar] [CrossRef]
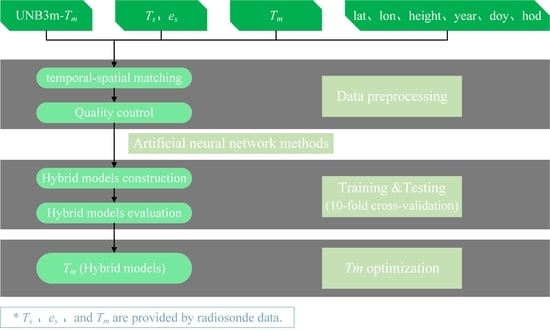
Figure 1. Study terrain and distribution of radiosonde stations (marked with red triangles).
Remotesensing 14 03762 g001
Figure 2. Structural diagram of backpropagation neural network.
Remotesensing 14 03762 g002
Figure 3. Structural diagram of random forest.
Remotesensing 14 03762 g003
Figure 4. Structural diagram of generalized regression neural network.
Remotesensing 14 03762 g004
Figure 5. Statistical diagram of RMSE of different models with different parameter settings based on a 10-fold cross-validation technique.
Remotesensing 14 03762 g005
Figure 6. Scatter plots of estimated Tm against Tm derived from radiosonde data for different models: (a) hybrid model 1 cross-validation; (b) hybrid model 1 fitting; (c) hybrid model 2 cross-validation; (d) hybrid model 2 cross-validation; (e) hybrid model 3 cross-validation; (f) hybrid model 3 fitting.
Remotesensing 14 03762 g006
Figure 7. Scatter plots of estimated Tm against Tm derived from radiosonde data for different models: (a) UNB3m model; (b) Bevis model; (c) GPT3 model; (d) HGPT model. (The cut in the GPT3 (c) is due to there being no data in that range.).
Remotesensing 14 03762 g007
Figure 8. Spatial distribution of the RMSE that are calculated cross-validation residuals at each radiosonde station for (a) UNB3m model, (b) Hybrid model 1, (c) Hybrid model 2, (d) Hybrid model 3, (e) Bevis model, (f) GPT3 model, and (g) HGPT model.
Remotesensing 14 03762 g008
Figure 9. Statistics of RMSEs at each radiosonde station of each model.
Remotesensing 14 03762 g009
Figure 10. Biases and RMSEs of each model at different latitudes.
Remotesensing 14 03762 g010
Figure 11. Biases and RMSEs of each model at different heights.
Remotesensing 14 03762 g011
Figure 12. Biases and RMSEs of each model in different seasons.
Remotesensing 14 03762 g012
Figure 13. The PWV converted by the Bevis, GPT3, HGPT, and Hm2 models at four radiosonde stations.
Remotesensing 14 03762 g013
Figure 14. The RMSE reductions of the Hm2 model compared with different models for retrieving PWV: (a) Bevis model; (b) GPT3 model; (c) HGPT model.
Remotesensing 14 03762 g014
Table 1. Main features of the hybrid models.
Input parameterssurface temperature (Ts), water vapor pressure (es), year, day of year (doy), and hour of day (hod), latitude, longitude, height, and UNB3m-Tm
Output parameterTm
Table 2. Relative radiosonde data, the accuracy evaluation results of different models.
Model HyperparameterBias (K)MAE (K)STD (K)RMSE (K)R
UNB3m --−1.978.4110.7810.9550.540
Hm1Cross-V180.002.282.952.9540.969
Fitting180.002.282.952.9530.969
Hm2Cross-V550.002.072.702.7030.974
Fitting550.001.622.102.0960.984
Hm3Cross-V0.060.022.092.762.7630.973
Fitting0.060.011.592.102.1010.984
Bevis--0.803.534.494.5630.931
GPT3--−0.483.354.314.3400.932
HGPT--0.003.334.324.3170.932
Table 3. The overall accuracy of different models.
ModelRMSE (K)
Hm12.954
Hm22.703
Hm32.763
LS model3.340
Bevis4.563
GPT34.340
HGPT4.317
Table 4. The computer storage space and the number of parameters for each model.
ModelComputer Storage SpaceNumber of Parameters
UNB3m104 KB103
Hm1104 KB104
Hm2104 KB104
Hm3104 KB104
GPT329,081.6 KB324,003
Table 5. The information of the four stations.
Station NumberLatitude/°Longitude/°Altitude/m
58,45730.23120.1643.1
50,55749.16125.23242.6
51,46343.7889.61921.4
45,00422.33114.1766.17
Table 6. The MAE of the differences between the computed and the reference PWV.
Station NumberHm1BevisChange inGPT3Change inHGPTChange in
MAE/mmMAE/mm%MAE/mm%MAE/mm%
58,4570.1500.22449.30.332121.20.332121.2
50,5570.0670.13499.80.137104.20.157133.5
51,4630.0800.169112.00.166108.20.15492.5
45,0040.1690.381124.70.30781.30.30882.0
Table 7. The RMSE of the differences between the computed and the reference PWV.
Station NumberHm2BevisChange in GPT3Change inHGPTChange in
RMSE/mmRMSE/mm%RMSE/mm%RMSE/mm%
58,4570.1990.29346.90.430115.40.428114.4
50,5570.1010.18280.60.204102.50.240137.8
51,4630.1110.248124.50.21796.50.20686.1
45,0040.2190.454107.10.38073.30.37972.6
Table 8. The statistic z and corresponding p value.
z (P)BevisGPT3HGPT
Hm2−2.2463 (0.0122)−2.7058 (0.003)−2.6693 (0.004)
Publisher’s Note: MDPI stays neutral with regard to jurisdictional claims in published maps and institutional affiliations.

