Abstract
Harbin is a northmost megacity in the cold regions of China and experiences severe PM2.5 pollution. However, comprehensive investigations for severe haze formation are few. In this study, we simultaneously measured aerosol composition in real time to assess the sources apportionment, regional transport and its interaction with meteorology from 1 October 2018 to 1 May 2019 by using the single particle aerosol mass spectrometer (SPAMS). The daily average PM2.5 concentration was 51.21 µg/m3 with the hourly maximum of 900.45 µg/m3. Winter coal combustion was the largest source of PM2.5 aerosols during this period. Open straw burning from surrounding and adjacent areas by short-distance transport could aggravate air quality deterioration in Harbin. Three extreme haze events (i.e., Ep1, Ep2 and Ep3) were observed in this study, showing the typical characteristics of local winter pollution. The pollutants of PM2.5 and SO2 emitted from coal combustion played an important role in haze episode during Ep1, whereas Ep2 was caused by the joint effect of coal combustion and straw burning. Ep3 was characterized by long-distance transport of windblown dust from southeast Inner Mongolia and northwest Harbin. Real-time source apportionment of fine particulate matter highlights the importance of joint control of coal and straw burning from the surrounding cities of Harbin.
1. Introduction
China has experienced PM2.5 pollution during the last two decades due to rapid urbanization and economic expansion [1]. PM2.5 pollution has a notable impact on air quality, human health and regional climate [2,3]. The emissions of PM2.5 are derived from natural and anthropogenic source and mainly consist of water-soluble inorganic ions (WSIIs), carbonaceous species (i.e., OC and EC) and other elements (e.g., Al, Si, Mg, Fe, Pb and Zn) [4]. Quantifying concentration levels, spatiotemporal characteristics and emission sources are necessary in understanding and controlling PM2.5 pollution [5]. However, distinct PM2.5 pollution increases the difficulty of recognition due to the disparity of regional conditions and significant inter-provincial transmission [6]. Therefore, a systematic study of characteristics and emission sources for PM2.5 pollution can provide a theoretical basis for policy implementation and environmental management.
To date, comprehensive studies on PM2.5 pollution have been conducted in China, from pollution characteristics to spatiotemporal distribution, from chemical composition in typical events to regional atmospheric particle transport over long time scales [7,8,9]. A series of studies has explored the spectral signature of particulate matter and source apportionment by locale using the online aerosol chemical speciation monitor (ACSM) and single particle aerosol mass spectrometer (SPAMS) [10,11,12,13]. Several studies also focused on the nucleation of nanosized particles and its influence on the formation of haze events [14]. The chemical composition and mechanism of gas-to-particle conversions were demonstrated for atmospheric particles emitted from typical anthropogenic sources (e.g., biomass burning, fuel consumption and vehicle exhausts) [15,16,17]. Furthermore, Lin et al. [18] built a PM2.5 dataset over China from 2001 to 2015 using satellite remote sensing. Meng et al. [19] estimated long-term historical PM2.5 concentrations over North America by combining chemical transport modeling, satellite remote sensing and ground-based measurements and quantified satellite-derived PM2.5 data quality by downscaling methods. Moreover, the mechanism of regional haze formation has been analyzed based on the observation of atmospheric supersites in megacities (e.g., Beijing, Shanghai and Guangzhou) [20,21]. However, the aerosol evolution and source apportionment remain incomplete for areas outside of megacities limited by technological immaturity and funding constraints, especially in cold regions of northeastern China.
As the major region in northeastern China, Harbin is known for the deteriorating air quality and seasonal haze events. To date, only limited research has been conducted on the haze episodes by using offline filter-based measurement techniques and low-temporal resolution online monitoring data in some cities of northeastern China [22]. These studies tended to focus on describing the long-term spatiotemporal variations of PM2.5 pollution through remote sensing satellites [23], revealing the relationship between PM2.5 concentration and meteorological conditions [24], or exploring the source of PM2.5 emission and evaluating the influence of regional transport [25]. For instance, Li et al. [26] explored the long-term spatiotemporal variations, source analysis and meteorological effects of air pollutants in megacities of the Harbin-Changchun megalopolis from 2013 to 2018. These studies only empirically explored source apportionment and left unexplained the rapid evolution and driving factors of the haze episode. Therefore, it is crucial to conduct a comprehensive study of source apportionment and long-distance transmission of PM2.5 pollution in Northeast China.
The objective of this study was to achieve a comprehensive understanding of variation characteristics, source apportionment and regional transport for PM2.5 episodes during winter in Harbin using SPAMS and other online technical equipment. This study also explored the interaction with meteorology among different severe pollution episodes. These results are important in providing effective pollution control policies of urban atmospheric pollution in cold region.
2. Materials and Methods
2.1. Sampling Site
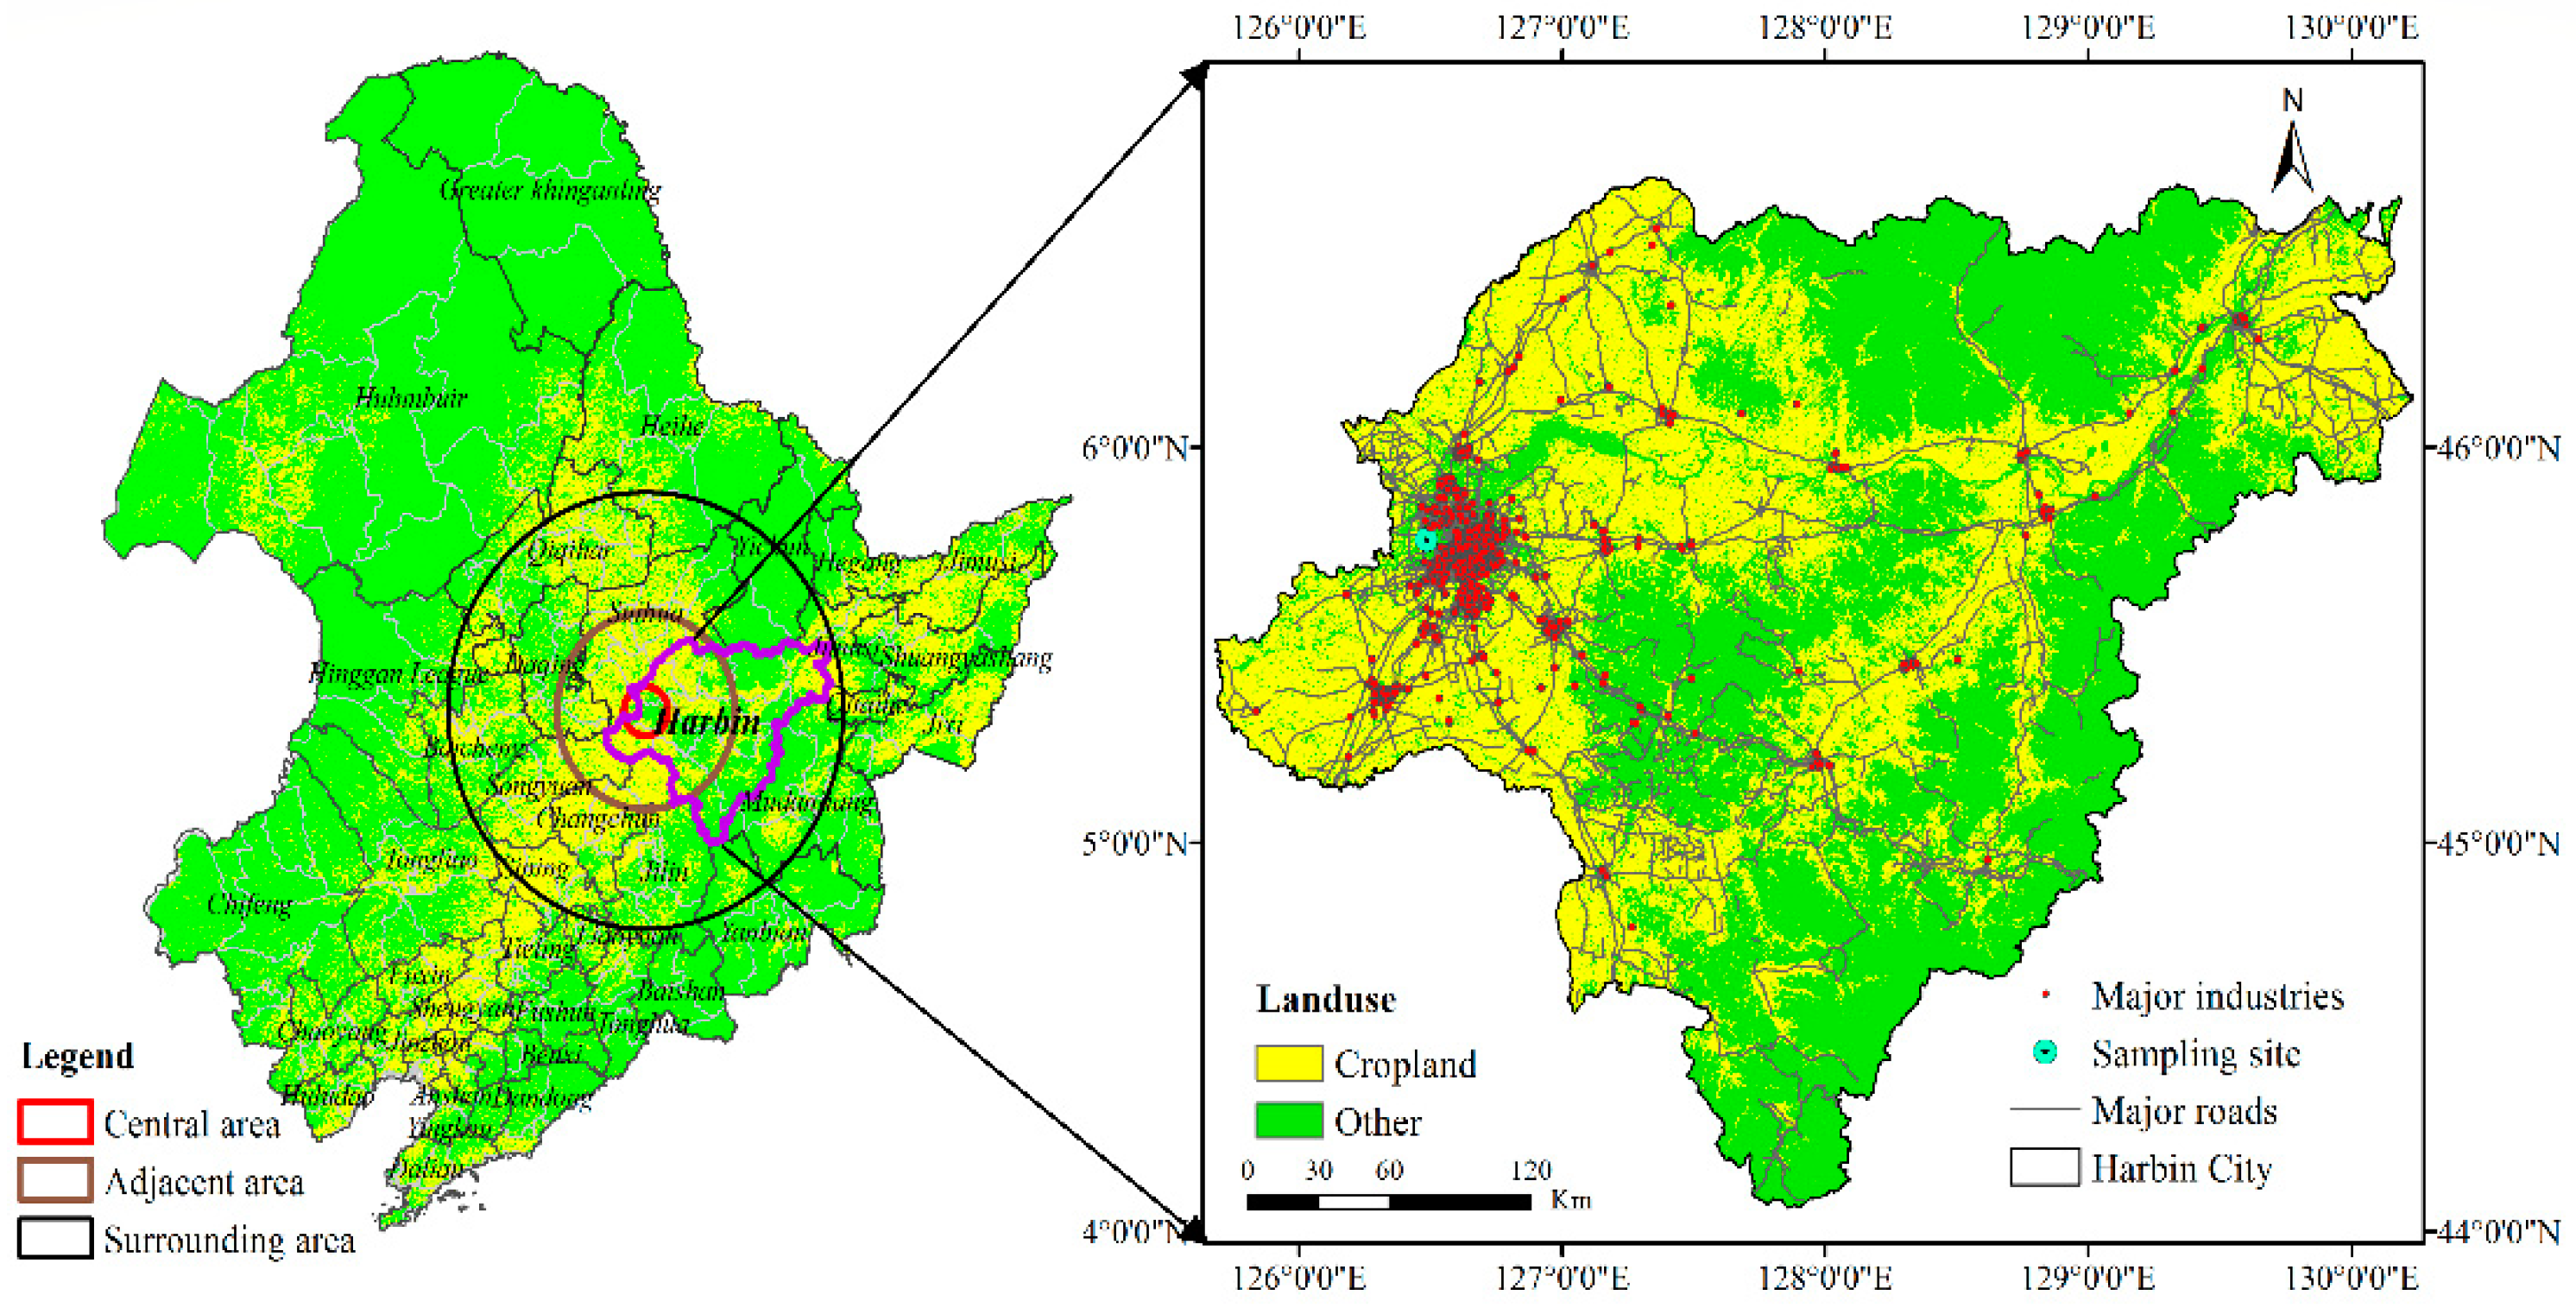
In situ measurements were conducted on the third floor of the Centre for Atmospheric Monitoring (CAM) building (~9 m above the ground) (45°46′N, 126°29′E) in Harbin from 1 October 2018 to 1 May 2019 The supersite is in the central urban area of Harbin, which is surrounded by the Songhua River and residential area (Figure 1). There are no large power plants or factories within 10 km of this supersite. The temperature during the study period varied from −25.9 °C to 30.5 °C, with an average of −1.34 °C. Harbin is a northmost megacity in one of the coldest areas of China and has a longer cold period that begins in October and ends in April of the following year. It also is a major area for corn production with 19,770 km2, accounting for 13% of Heilongjiang province [27]. Due to the single crop system, corn and rice are mainly harvested at the end of August, and part of the straw residue is burned from September to October [28]. Compared with NCP and YRD, the anthropogenic sources in this region in winter are relatively single, which mainly are coal-fired heating and open straw burning, but the unfavorable meteorological conditions (e.g., lower atmospheric boundary layer and temperature) are more likely to promote the haze formation. For the purposes of this study, the entire period (ENP) is divided into the pre-heating period (PHP), mid-heating period (MHP) and late-heating period (LHP). PHP spans from 1 October to 7 December; MHP is from 8 December to 4 April of the following year, and LHP is from 5 April to 1 May. Meanwhile, the areas that are 50 km, 200 km and 450 km away from the supersite are defined as central, adjacent and surrounding areas to explore the impact of regional transport on local air quality. The spatial distribution of major industries and urban arterial roads in Harbin were obtained from Zhang et al. [29].
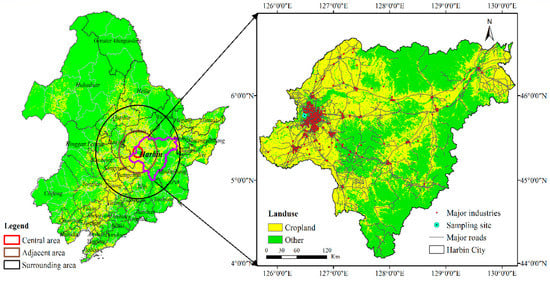
Figure 1.
Study region in northeastern China and its farmland distribution. Light-yellow area represents the farmland distribution of northeastern China. Black and fuchsia boundaries on the left indicate Northeastern China and Harbin city; the red points on the right are major industries of Harbin.
2.2. Instrumentation
The single particle aerosol mass spectrometer (SPAMS) equipped with a PM2.5 aerodynamic lens (Model 0515, Hexin Inc., Guangzhou, China) was installed inside a temperature-controlled laboratory (26 °C) on the third floor of the CAM building. The instrument was widely applied to perform field measurement of particle size, chemical compositions and the mixing state of single fine particles (from 200 nm to 2000 nm) in real-time (normally 1 h) [30]. The technical description of SPAMS was provided by Li et al. [31]. The particulate monitor (Model 1405DF, Thermo Scientific, Waltham, MA, USA) was deployed to measure the concentrations of aerosol (PM10/PM2.5) and submicron aerosol (PM1.0) with a time resolution of 1 min. Online elemental carbon (EC) and organic carbon (OC) mass concentrations were measured with a semi-continuous OC-EC field analyzer (Model 4, Sunset Laboratory Inc., Portland, OR, USA). Additionally, the hourly meteorological factors (i.e., temperature, relative humidity, wind speed, wind direction and precipitation) and pollutant concentrations (i.e., CO, SO2, NO2, CO and O3) were obtained from the China Meteorological Administration (http://www.cma.gov.cn/, accessed on 12 March 2020) and the China National Environmental Monitoring Centre (http://113.108.142.147:20035/emcpublish/, accessed on 13 March 2020), respectively. The daily farmland fire point information, including longitude, latitude and transit time, was derived from MODIS and VIIRS products of the Terra, Aqua and NPP satellites (https://firms.modaps.eosdis.nasa.gov/active_fire/, accessed on 20 March 2020).
2.3. HYSPLIT and PSCF Modeling
Hybrid single-particle Lagrangian integrated trajectory (HYSPLIT) model was used to generate backward trajectories in this study. The final operational global analysis (FNL) dataset with a horizontal resolution of 1.0° × 1.0° was used to simulate the 72 h backward air mass in every haze episode period. The starting height of 300 m above the ground level was set to minimize the effects of ground surface friction and characterize wind features in the lower boundary layer [32]. The backward trajectories were run at 6 h intervals by using R3.6.2.
Potential source contribution function (PSCF) was used to calculate the probability of air mass trajectories appearing in the position-determined grid and assess potential source regions of PM2.5 according to the results of HYSPLIT model [33]. The PSCF algorithm is displayed as follows:
where is the number of times that the trajectories passed through the , and is the number of times that the polluted trajectories passed through the . The polluted trajectories are defined as trajectories of the air mass carrying a higher concentration of particle species than the set threshold value. The threshold value of PM2.5 adopted in the study is 75 µg/m3, which is the limits of the secondary standard of the novel national ambient air quality standard (NAAQS, GB3095-2012). However, a limitation of the PSCF method is that the grid cells can have the same PSCF value when the concentrations are either only slightly or significantly higher than the standard, leading to difficulty in distinguishing moderate sources from strong ones. Therefore, the concentration-weighted trajectory (CWT) also was used to quantify the average weighted concentration of each grid cell by calculating the weighted concentration of the trajectories. The value of the CWT in the cell is defined as follows:
where is the pollutant concentration measured upon arrival of trajectory k; is the number of trajectory segment endpoints in the grid for the back trajectory k divided by the total number of trajectory segment endpoints for the back trajectory k; N is the total number of trajectories used in analysis.
2.4. Data Analysis
The chemical composition of the single particles was analyzed by using the YAADA toolkit (Version2.0, http://www.yaada.org, accessed on 10 April 2020) in MATLAB R2019a (Math Work, Natick, MA, USA). All particles were grouped into separate clusters and identified according to their particle size and spectral similarity using the adaptive resonance theory neural network algorithm (ART-2a), with a vigilance factor of 0.6, learning rate of 0.05 and 20 iterations [34]. Then, manual classification was used to combine similar clusters into a certain source type according to the dominant chemical compositions present in the mass spectrum [7,35]. Finally, the average mass spectrum of individual particles from different sources can be obtained. In this study, eight sectors (i.e., coal combustion (COC), industrial source (IND), transportation (TRP), biomass burning (BOB), cooking (COO), dust (DUS), secondary particles (SES) and other) were identified based on the ART-2a neural network algorithm combined with local industrial structure and energy consumption in study area.
The statistical and plotting procedures for pollutant data were performed using SigmaPlot 14.0 (SPSS Inc., Chicago, IL, USA) and ArcGIS 10.3 (Esri, RedLands, CA, USA). The analysis of pollutant–meteorological interactions and potential source contributions were all completed using the Openair package in the software R3.6.2 (R Development Core Team, 2009).
3. Results and Discussion
3.1. Overview of Pollutant Characteristics
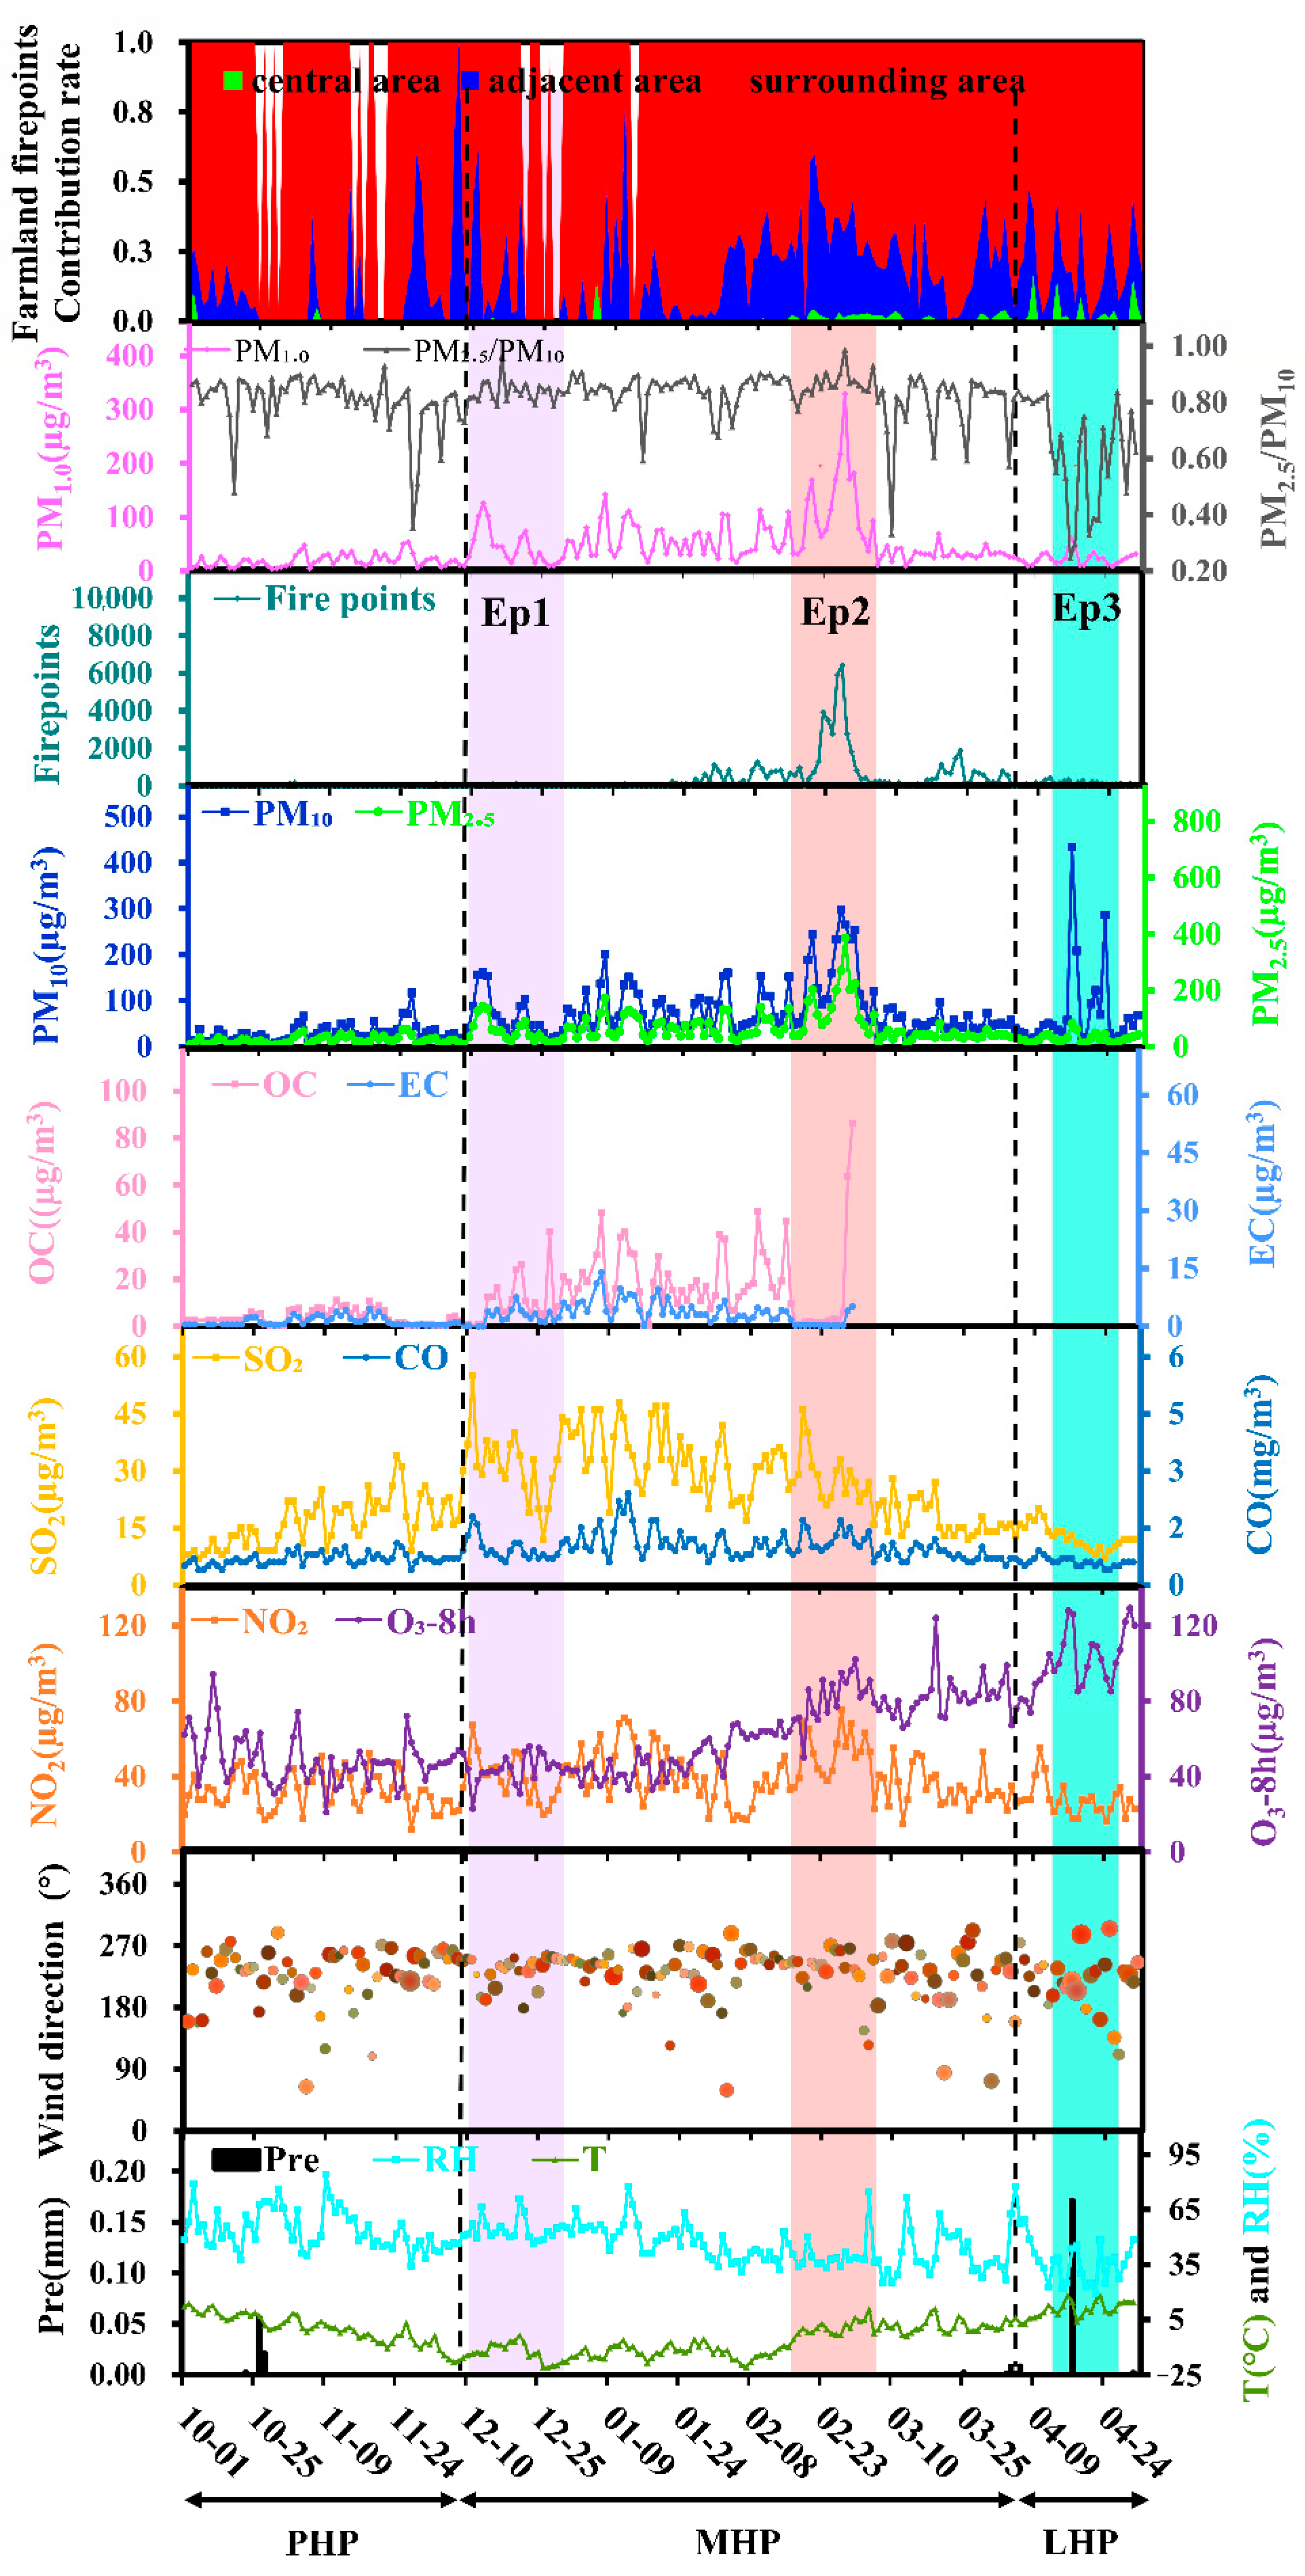
For ENP, the daily average concentrations of PM10, PM2.5, PM1.0, OC, EC, SO2, CO, NO2 and O3 were 65.36 ± 60.72 µg/m3, 51.21 ± 49.24 µg/m3, 41.88 ± 41.12 µg/m3, 11.26 ± 13.58 µg/m3, 2.49 ± 2.49 µg/m3, 22.70 ± 10.61 µg/m3, 0.87 ± 0.34 mg/m3, 36.35 ± 13.12 µg/m3, and 63.77 ± 23.36 µg/m3, respectively (Table 1). All pollutant concentrations were at a low-level during PHP. High PM2.5 concentration was varied from 12.19 to 384.97 µg/m3 during MHP, and the highest concentration was five times higher than the new national ambient air quality standard (NAAQS) Grade II (NAAQS: 75 µg/m3 for PM2.5) (Figure 2). The average SO2 concentration during MHP was ~2.0 and ~2.5 times higher than that of PHP and LHP, respectively. This might be related to the high-intensity coal-fired emissions from large power/heating plants, which were considered as crucial sources during winter in Northeast China [36]. The average ratio of PM2.5/PM10 was 0.8 during PHP and MHP, but the significantly lower value of 0.55 was observed during LHP, especially 21–24 April 2019. Notably, a significant increase in the PM2.5 concentration was recorded from 21 February 2019 to 1 March 2019, consistent with the increasing number of agricultural fire points, indicating that straw residue burning would have a significant impact on regional air quality deterioration. In contrast, higher O3 concentration was observed during LHP than that during PHP and MHP, which could be attributed to a combined effect of enhanced photochemical reaction due to increasing atmospheric temperature during LHP and the accumulation of precursors (i.e., NO2) during MHP.

Table 1.
Daily average concentrations of pollutants (i.e., PM10, PM2.5, PM1.0, OC, EC, SO2, CO, NO2 and O3) and meteorological elements (i.e., temperature, relative humidity, wind speed and direction) during PHP, MHP and LHP in Harbin. Except for CO, the unit of remaining pollutants is µg/m3, while CO is mg/m3; the units of wind speed, relative humidity and ambient temperature are m/s, % and °C, respectively.
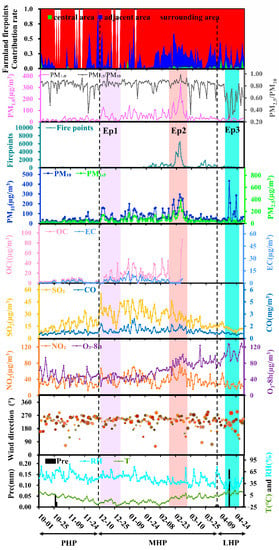
Figure 2.
Temporal variation of farmland fire points, PM1.0 concentration and ratios of PM1.0 and PM2.5, PM2.5 and PM10, SO2 and CO, NO2 and O3-8 h concentration; and wind direction (WD) and wind speed (WS), temperature (T), relative humidity (RH), and precipitation (Pre) from 1 October 2018 to 30 April 2019. Three periods (PHP, MHP and LHP) were divided by the black dotted line and three haze events (Ep1, Ep2 and Ep3) were marked with purple, red, and green, respectively.
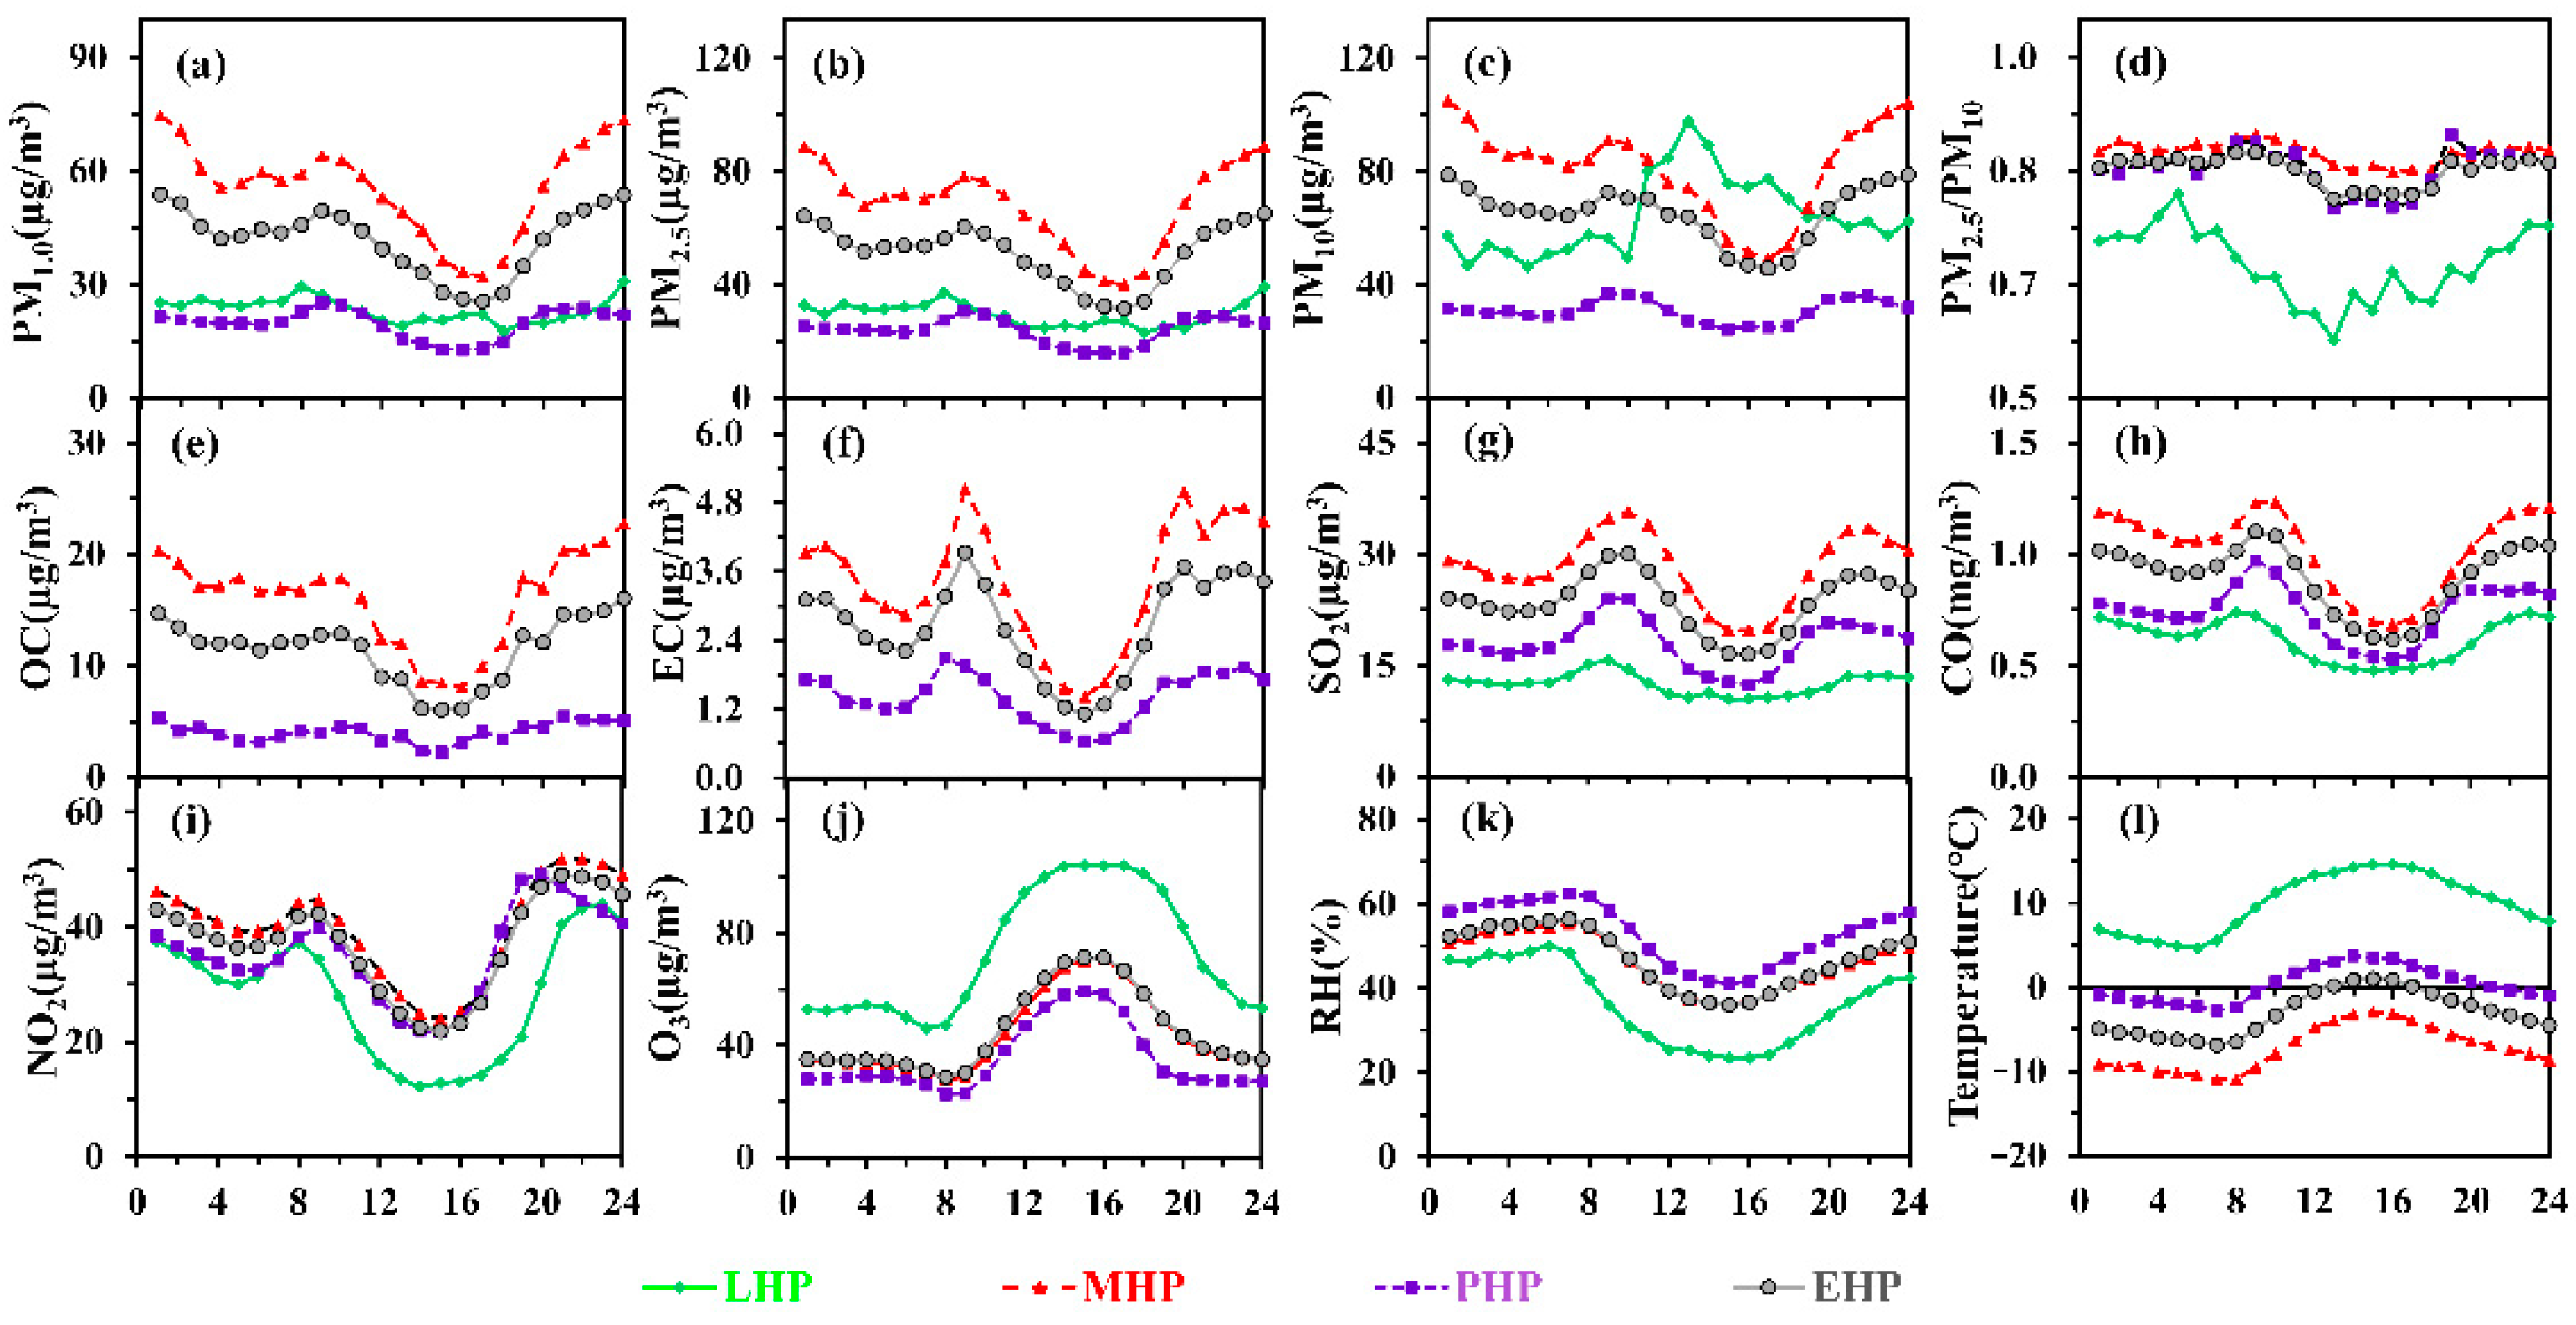
The diurnal profile of PM, CO, SO2, NO2 and EC exhibited a bimodal variation with peaks at 8:00~9:00 (Stage I) and 20:00~24:00 (Stage II) (Figure 3) and was comparable to those in Beijing. The concentration of O3 was higher between 14:00 and 16:00, which was contrary to NO2, demonstrating that NO2 led to the production of O3 via the photochemical pathway [37,38]. Stage I showed higher NO2 and EC concentrations, consistent with the morning peak period. Vehicle exhaust had been identified as the major source of NO2 and EC emissions in some cities of Northeast China [39]. Despite efforts in the region to reduce pollutant emissions from fossil-fueled vehicles, the increase in vehicle ownership and incompatibility of new energy vehicles has limited the emissions reductions. Furthermore, it was observed that higher relative humidity at this stage would significantly accelerate the nucleation and agglomeration of fine particles emitted by vehicle exhaust [40]. Daily peak concentrations of PM2.5, CO, SO2 and OC were observed between 20:00 and 22:00, consistent with the intensification of heating intensity at that time. However, it is noteworthy that after 22:00, especially during MHP, the concentrations of PM, CO, OC and EC remained at a high level with the decreasing SO2 concentrations, indicating that a source quite different from coal-fired heating that dominated the pollutant emissions. Previous studies have shown that open straw burning after the post-harvest stage is also an important anthropogenic source of pollutant emissions [6]. In recent years, Heilongjiang Province has issued a series of regulations to control the straw burning, such as “two-zone management” and “multi-use, multi-measures” policy system, but these measures still cannot solve so many straw residues. A part of the straw will be burned during a short time at nighttime due to the strict regulation during the daytime, thus leading to the concentrations of PM, CO, OC and EC remaining at a high level although the SO2 concentrations is decreasing after 22:00.
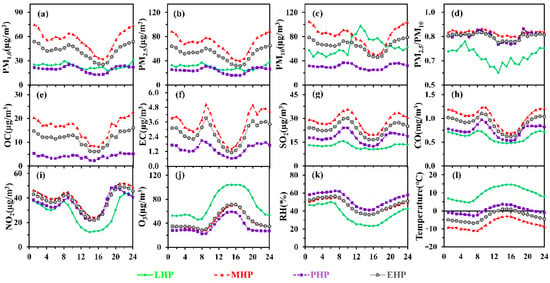
Figure 3.
Diurnal variation of pollutants concentration of ((a): PM1.0, (b): PM2.5, (c): PM10, (d): PM2.5/PM10, (e): OC, (f): EC, (g): SO2, (h): CO, (i): NO2 and (j): O3) and meteorological elements ((k): relative humidity, and (l) ambient temperature) observed during EHP, PHP, MHP and LHP, respectively.
3.2. Influence of Meteorological Factors on Pollutant Concentration
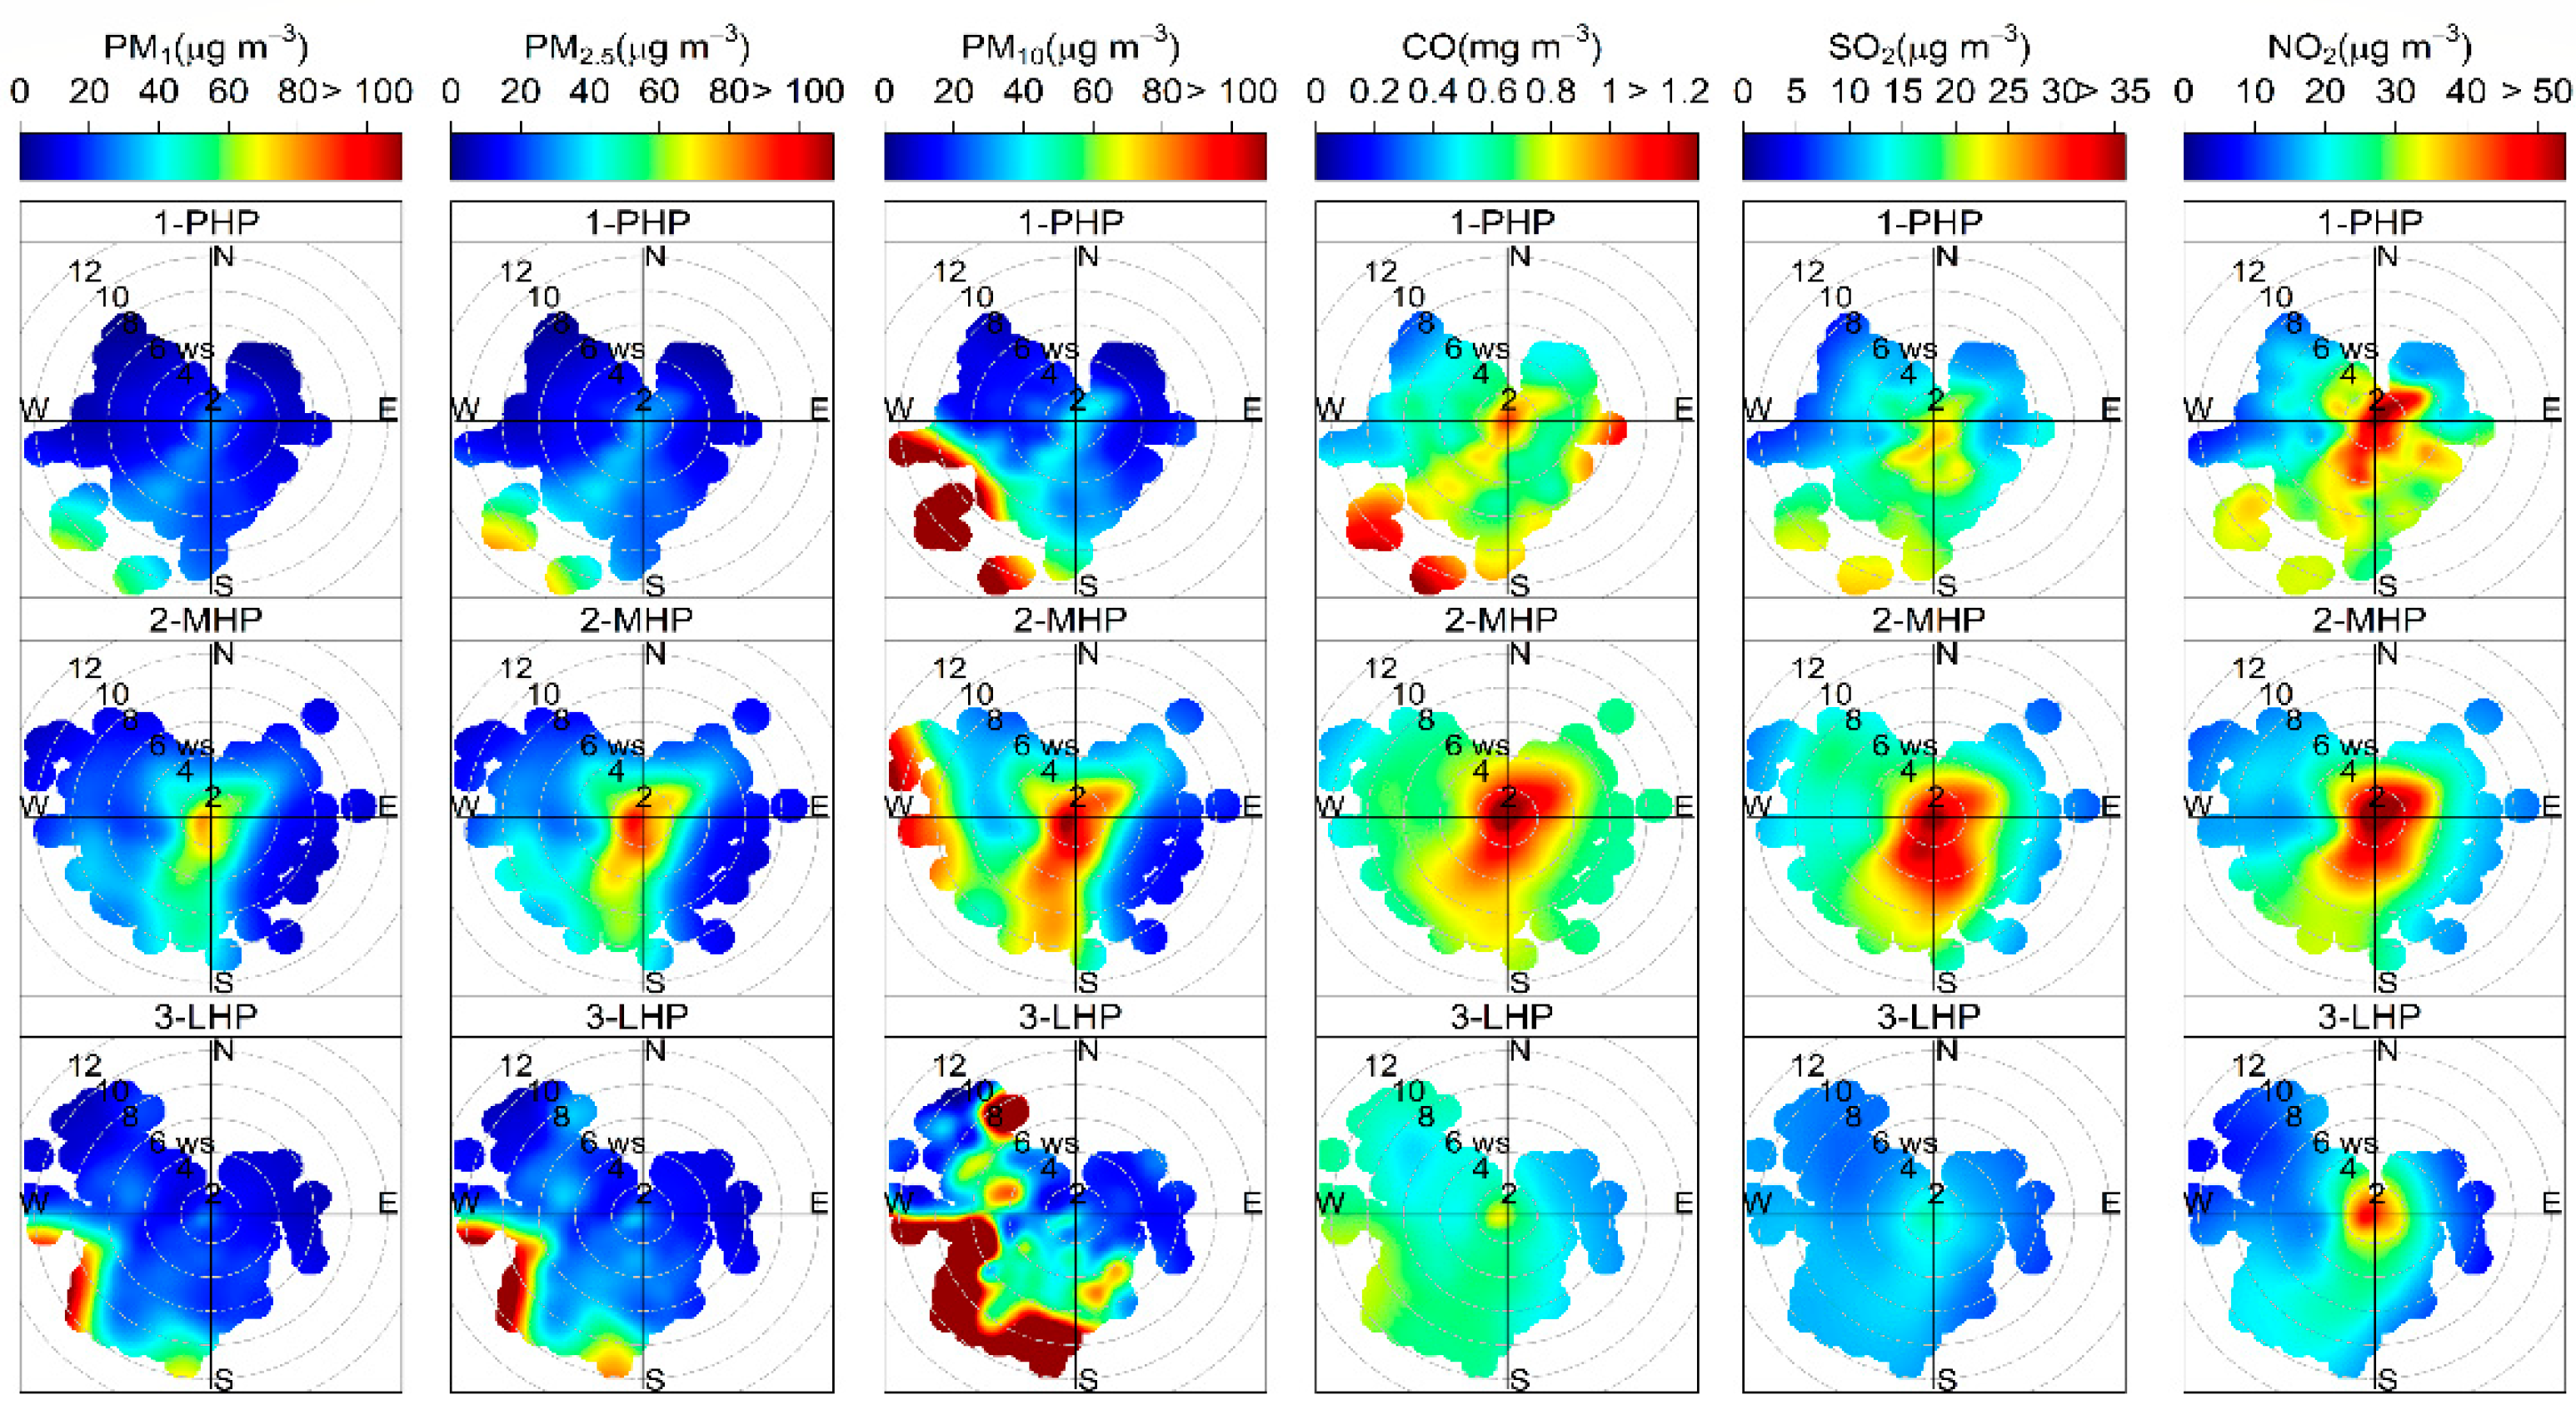
In this study, the surface wind direction and speed had a significant effect on regional pollutant concentration (Figure 4). During MHP, high concentrations of all pollutants were generally observed in the surrounding area of site with speeds of 0–2 m/s, suggesting that local anthropogenic emissions had a significantly higher impact on atmospheric aerosols than other areas. At all times, NOx concentrations around the site were higher than in other areas. Notably, high concentrations of coarse particulate matters were consistently associated with southwest winds of 8~12 m/s, indicating that there was a source emitted lots of coarse particulate matter into Harbin through long-range transport. Compared to that during PHP and MHP, the concentrations of CO and SO2 during the LHP were lower owing to reduced anthropogenic activities (i.e., heating supply) with the increasing ambient temperature.
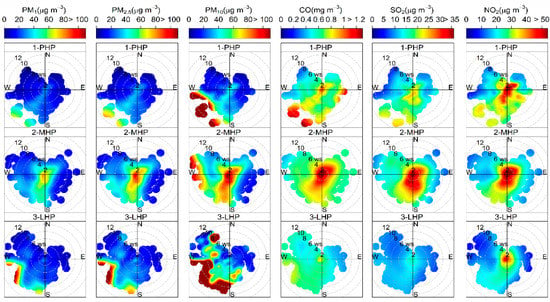
Figure 4.
Bivariate polar plots of atmospheric pollutants with wind direction and speed during PHP, MHP and LHP.
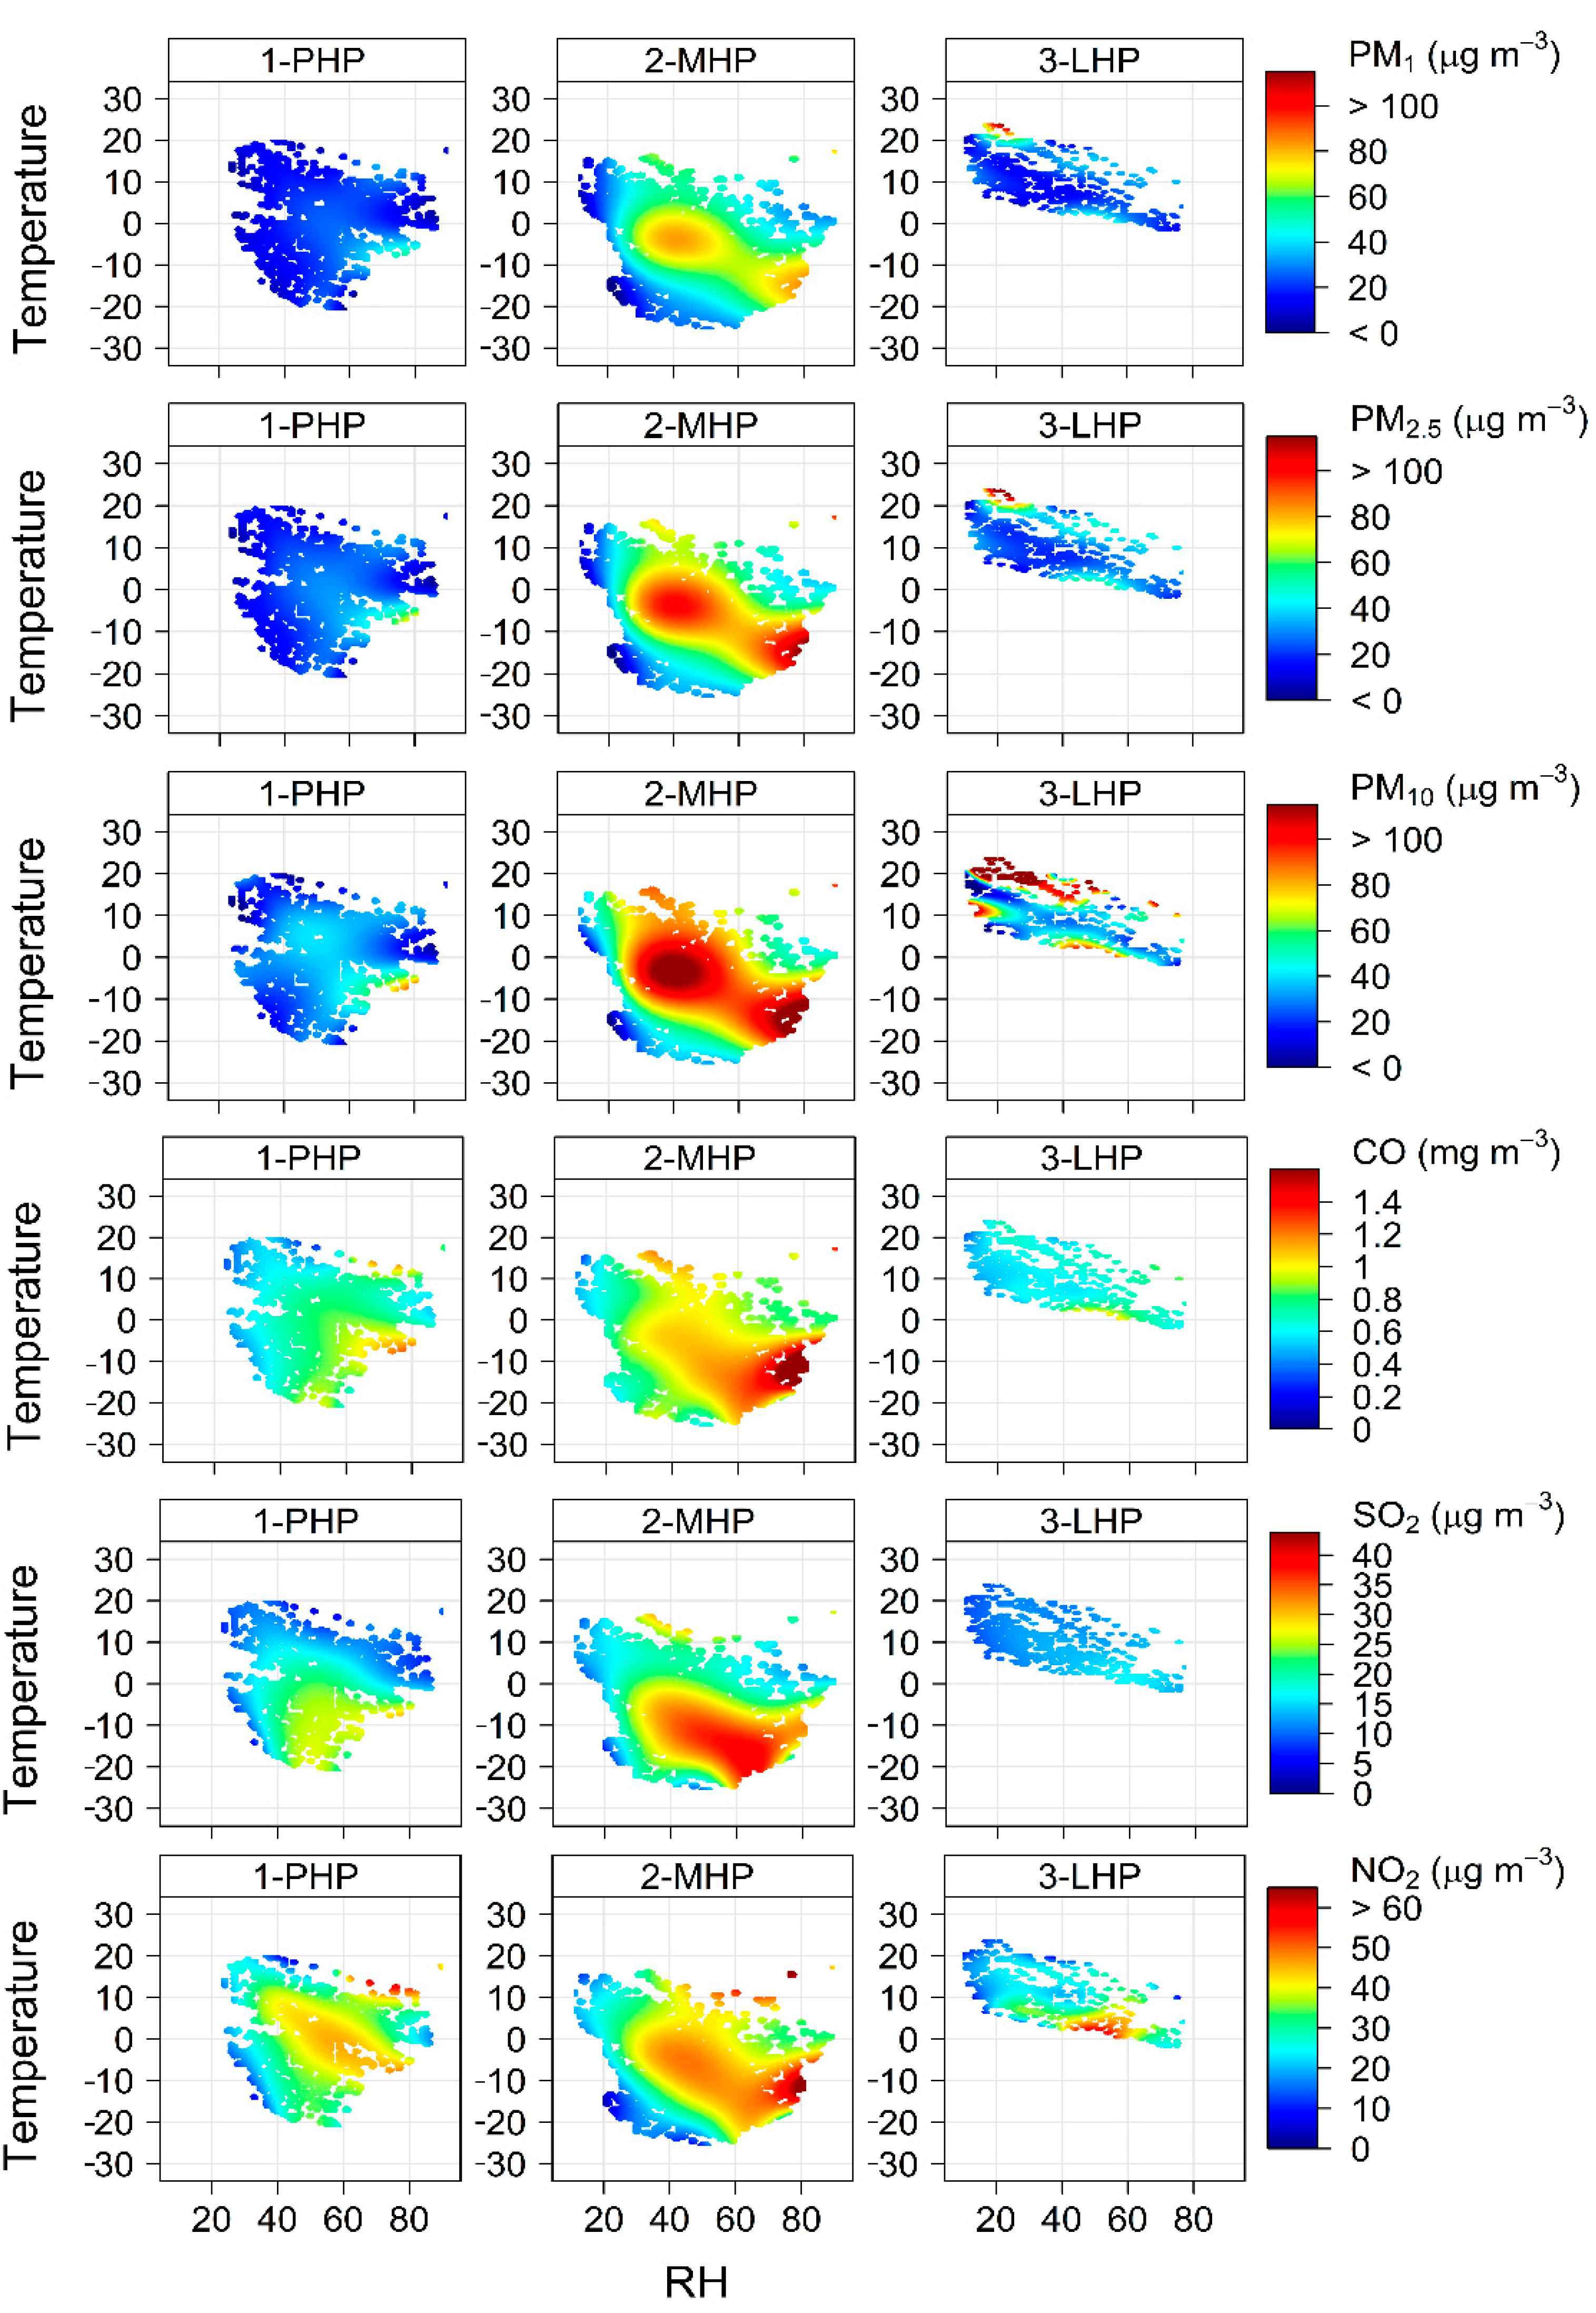
The high mass concentrations of PM1.0, PM2.5, CO and SO2 during PHP and MHP in this region always occurred with a lower temperature (i.e., 0 °C) and higher relative humidity (i.e., 60~80%) (Figure 5). Two potential conditions for high concentrations of PM2.5 during MHP were observed, namely Condition I (i.e., T: 10~–10 °C; RH: ~20~40%) and Condition II (i.e., T: –20~–10 °C; RH: ~60~80%). Condition I was a typical meteorological characteristic in mid-winter, and moderate pollution of PM2.5 occurred frequently, while the highest PM2.5 concentrations were observed in Condition II, especially under meteorological conditions with temperature below −10 °C and relative humidity above 70%. In this condition, the nucleation and aggregation of particulate matters mainly from high-intensity coal-fired heating emissions were accelerated, leading to the formation of extreme haze. The low concentration of SO2 was constant during the LHP period because of the decreasing heating intensity, while the concentrations of CO and NO2 were still at a high level under the temperature of 0~5 °C and humidity of 40~60%. In contrast to other pollutants, high concentrations of PM10 tended to be observed at higher temperatures and lower humidity.
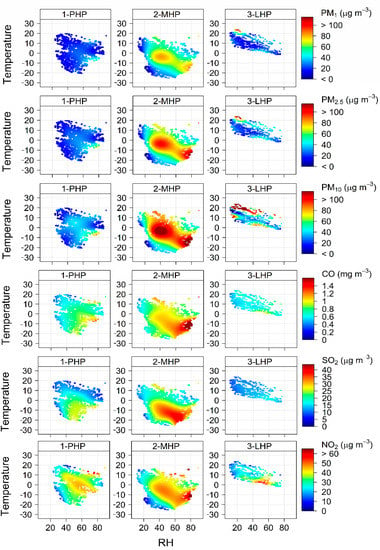
Figure 5.
Probability distributions of atmospheric pollutants with relative humidity (RH) and ambient temperature (T) during PHP, MHP and LHP.
3.3. Source Apportionment of Fine Particulate Matter
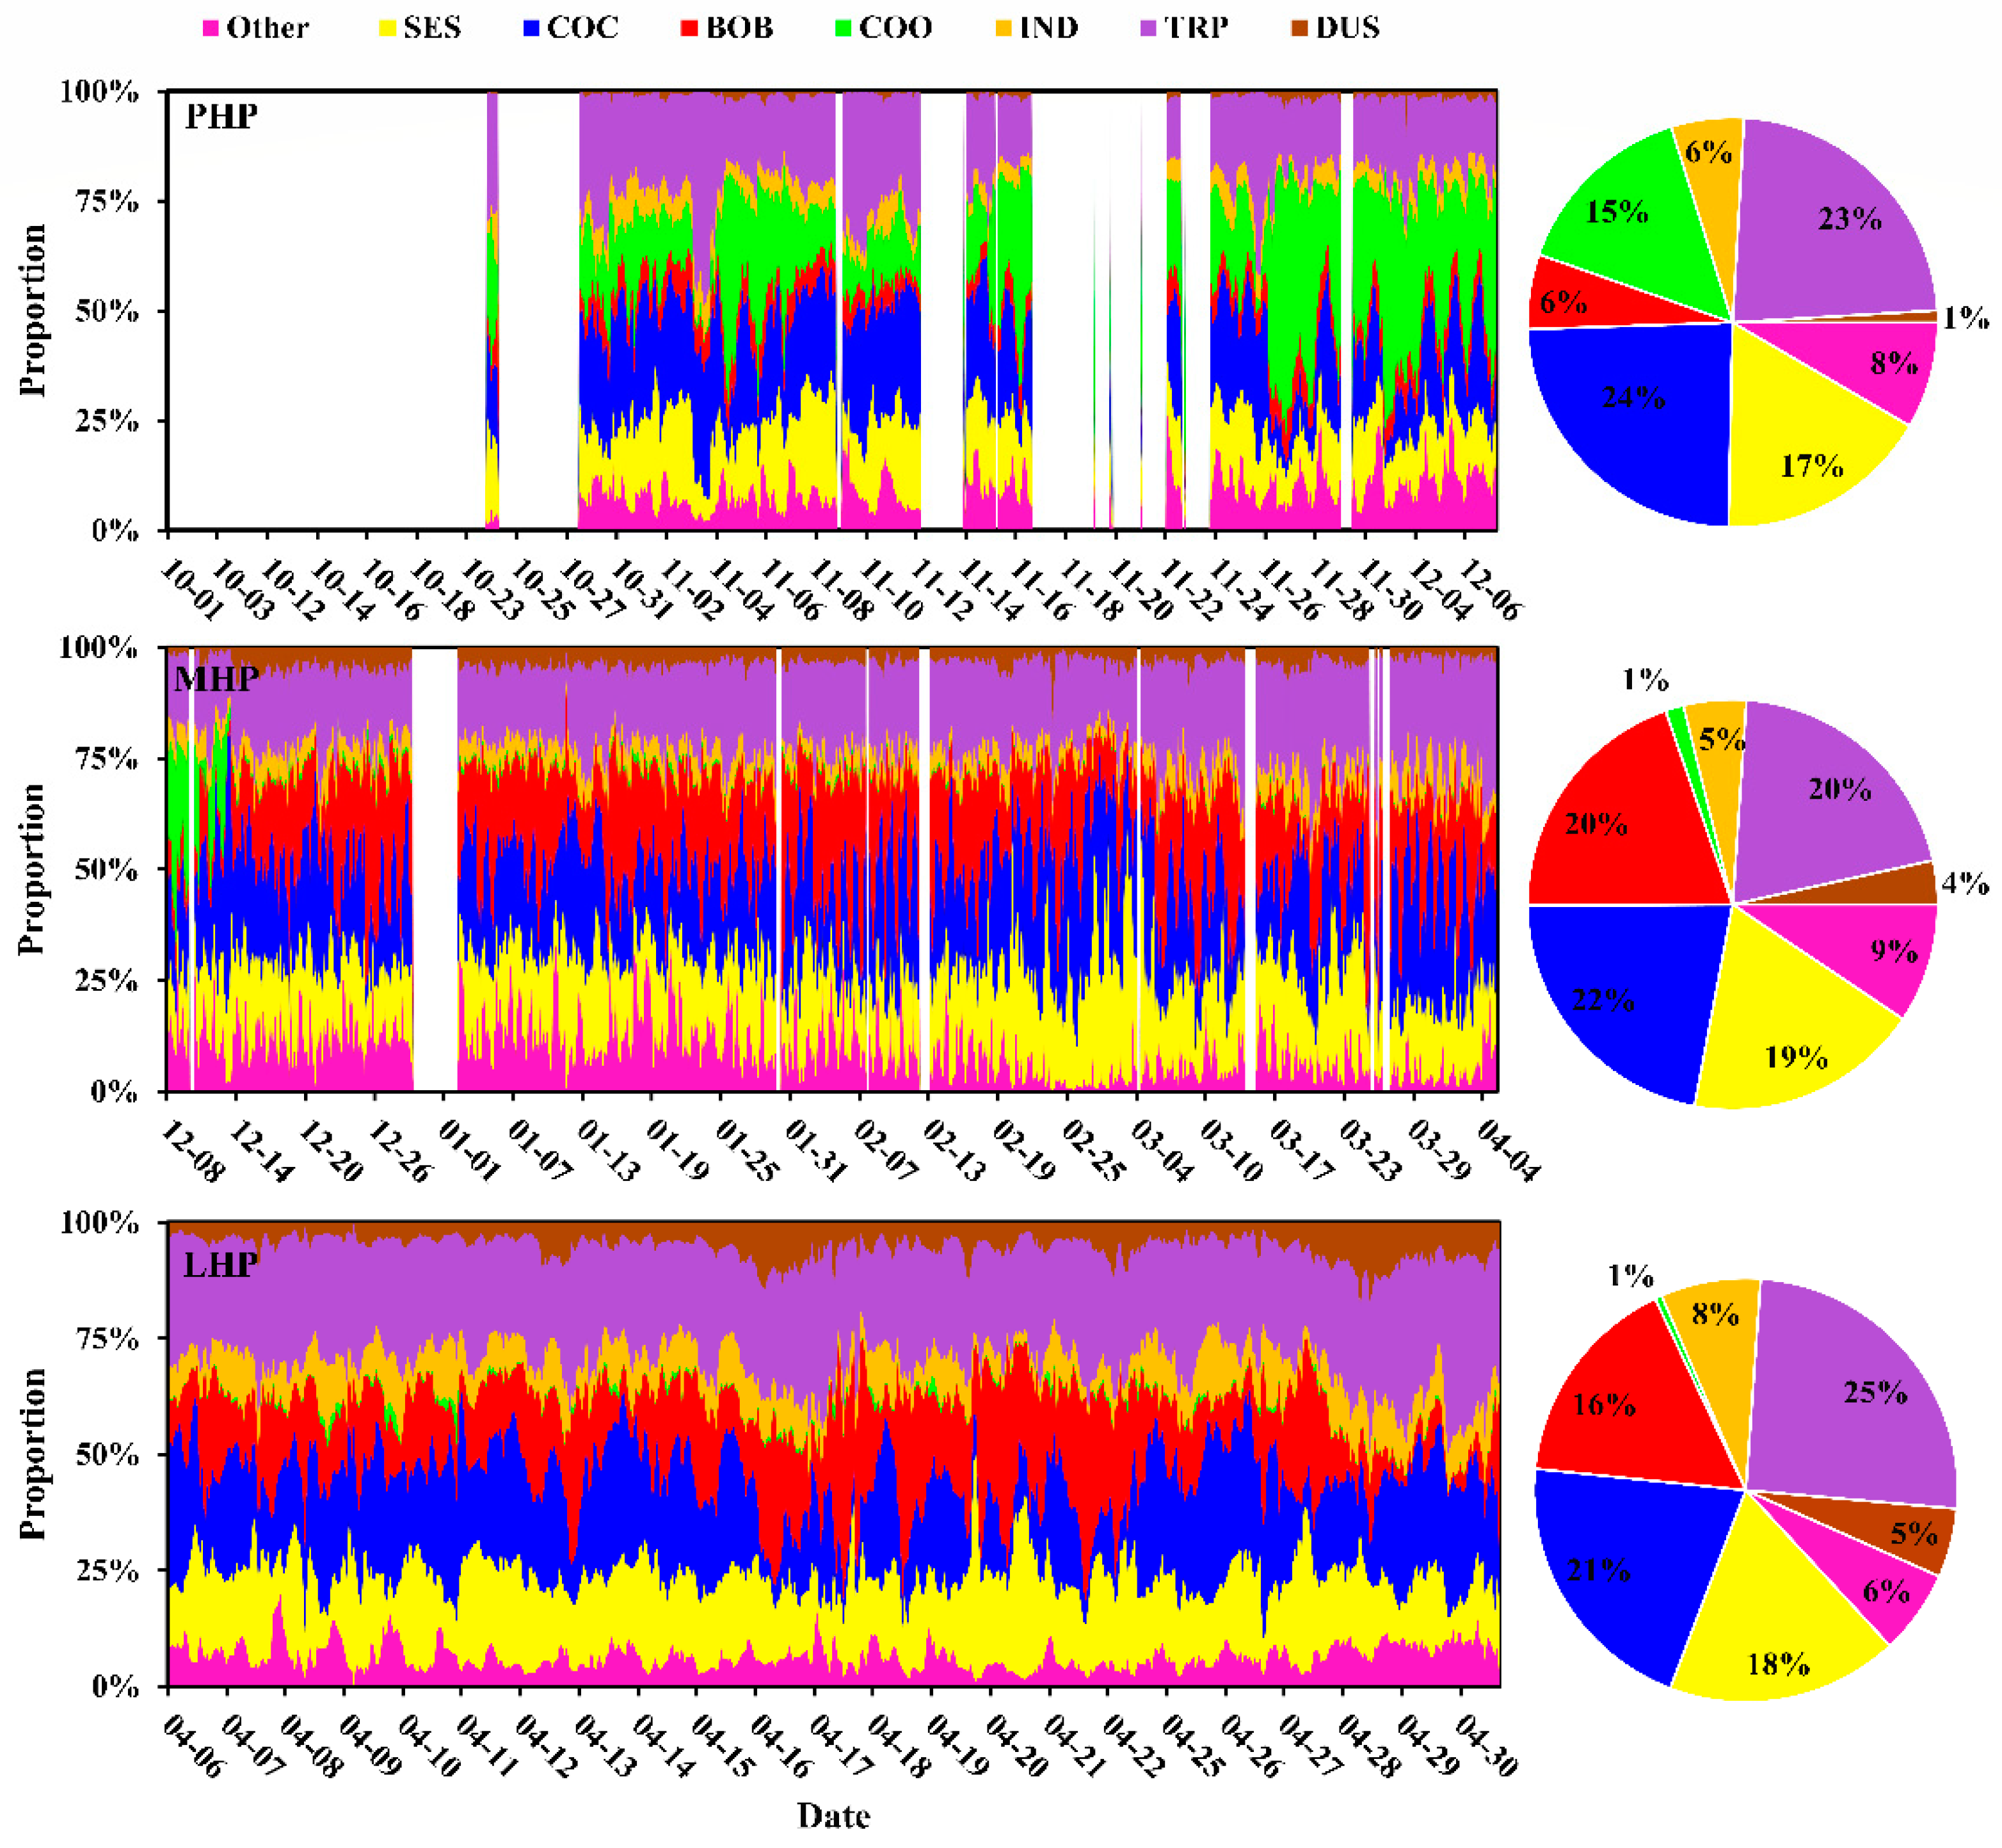
All sample datasets were used to analyze the sources of pollution and contribution profiles of PM2.5 by SPAMS during different period. Some data were invalid in mid-October and late-November due to the instrument instability. Eight sectors were identified in this study, including coal combustion (COC), industrial source (IND), transportation (TRP), biomass burning (BOB), cooking (COO), dust (DUS), secondary particles (SES) and other. Overall, TRP, COC, SES and BOB were the dominant sources for PM2.5 emission, contributing 25%, 22%, 18% and 17%, respectively (Figure 6). Significant differences in the source of PM2.5 emission were observed during the three periods. During PHP, COC, SES and TRP were the major sources of PM2.5 emission, accounting for 79% of the total. A rapid decline in COO for PM2.5 emissions was observed with a significant increase in BOB during MHP. Notably, a higher emission from BOB was observed after 14 February 2019, which corresponded to an increase in farmland fires, indicating that the open straw burning had been a major source of pollution emissions in a short time, thereby affecting the composition and morphology of particulate matter in the atmosphere. Harbin is a major crop planting area in China, and open burning is one of the main methods of straw disposal; more than 60% is burned in the post-harvest period [41]. During this period, short and extensive activities of straw open burning release lots of particulate matters, and the intensity of which is even much greater than industrial sources. The contribution of TRP decreased slightly during MHP, but an increase occurred 15–19 January and 21–24 January, respectively, which might be related to the use of vehicles during the Spring Festival. Significant contribution of IND to PM2.5 emission during MHP was not observed. Since 2016, a series of moratoriums on heavily polluting enterprises (i.e., cement plants) have been issued by the government to improve air quality in unfavorable meteorological conditions (Harbin Municipal People’s Government, 2016). Except for it, most industries would suspend production due to extremely low temperatures, thereby resulting in a direct reduction for PM2.5 emission from IND. Compared with PHP and MHP, PM2.5 emission from DUS increased significantly with a decrease in BOB.
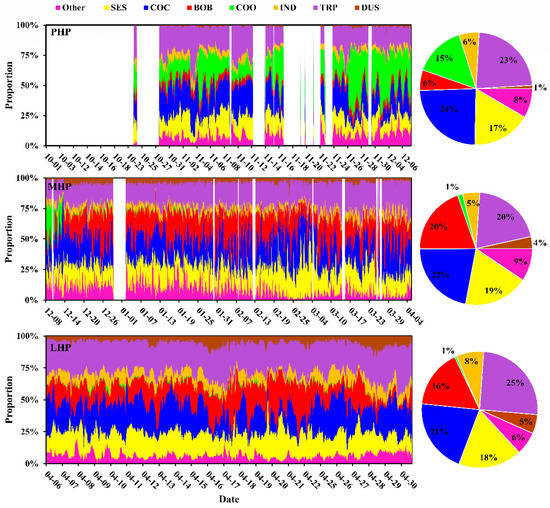
Figure 6.
Temporal trend of source contributions to PM2.5 during PHP, MHP and LHP.
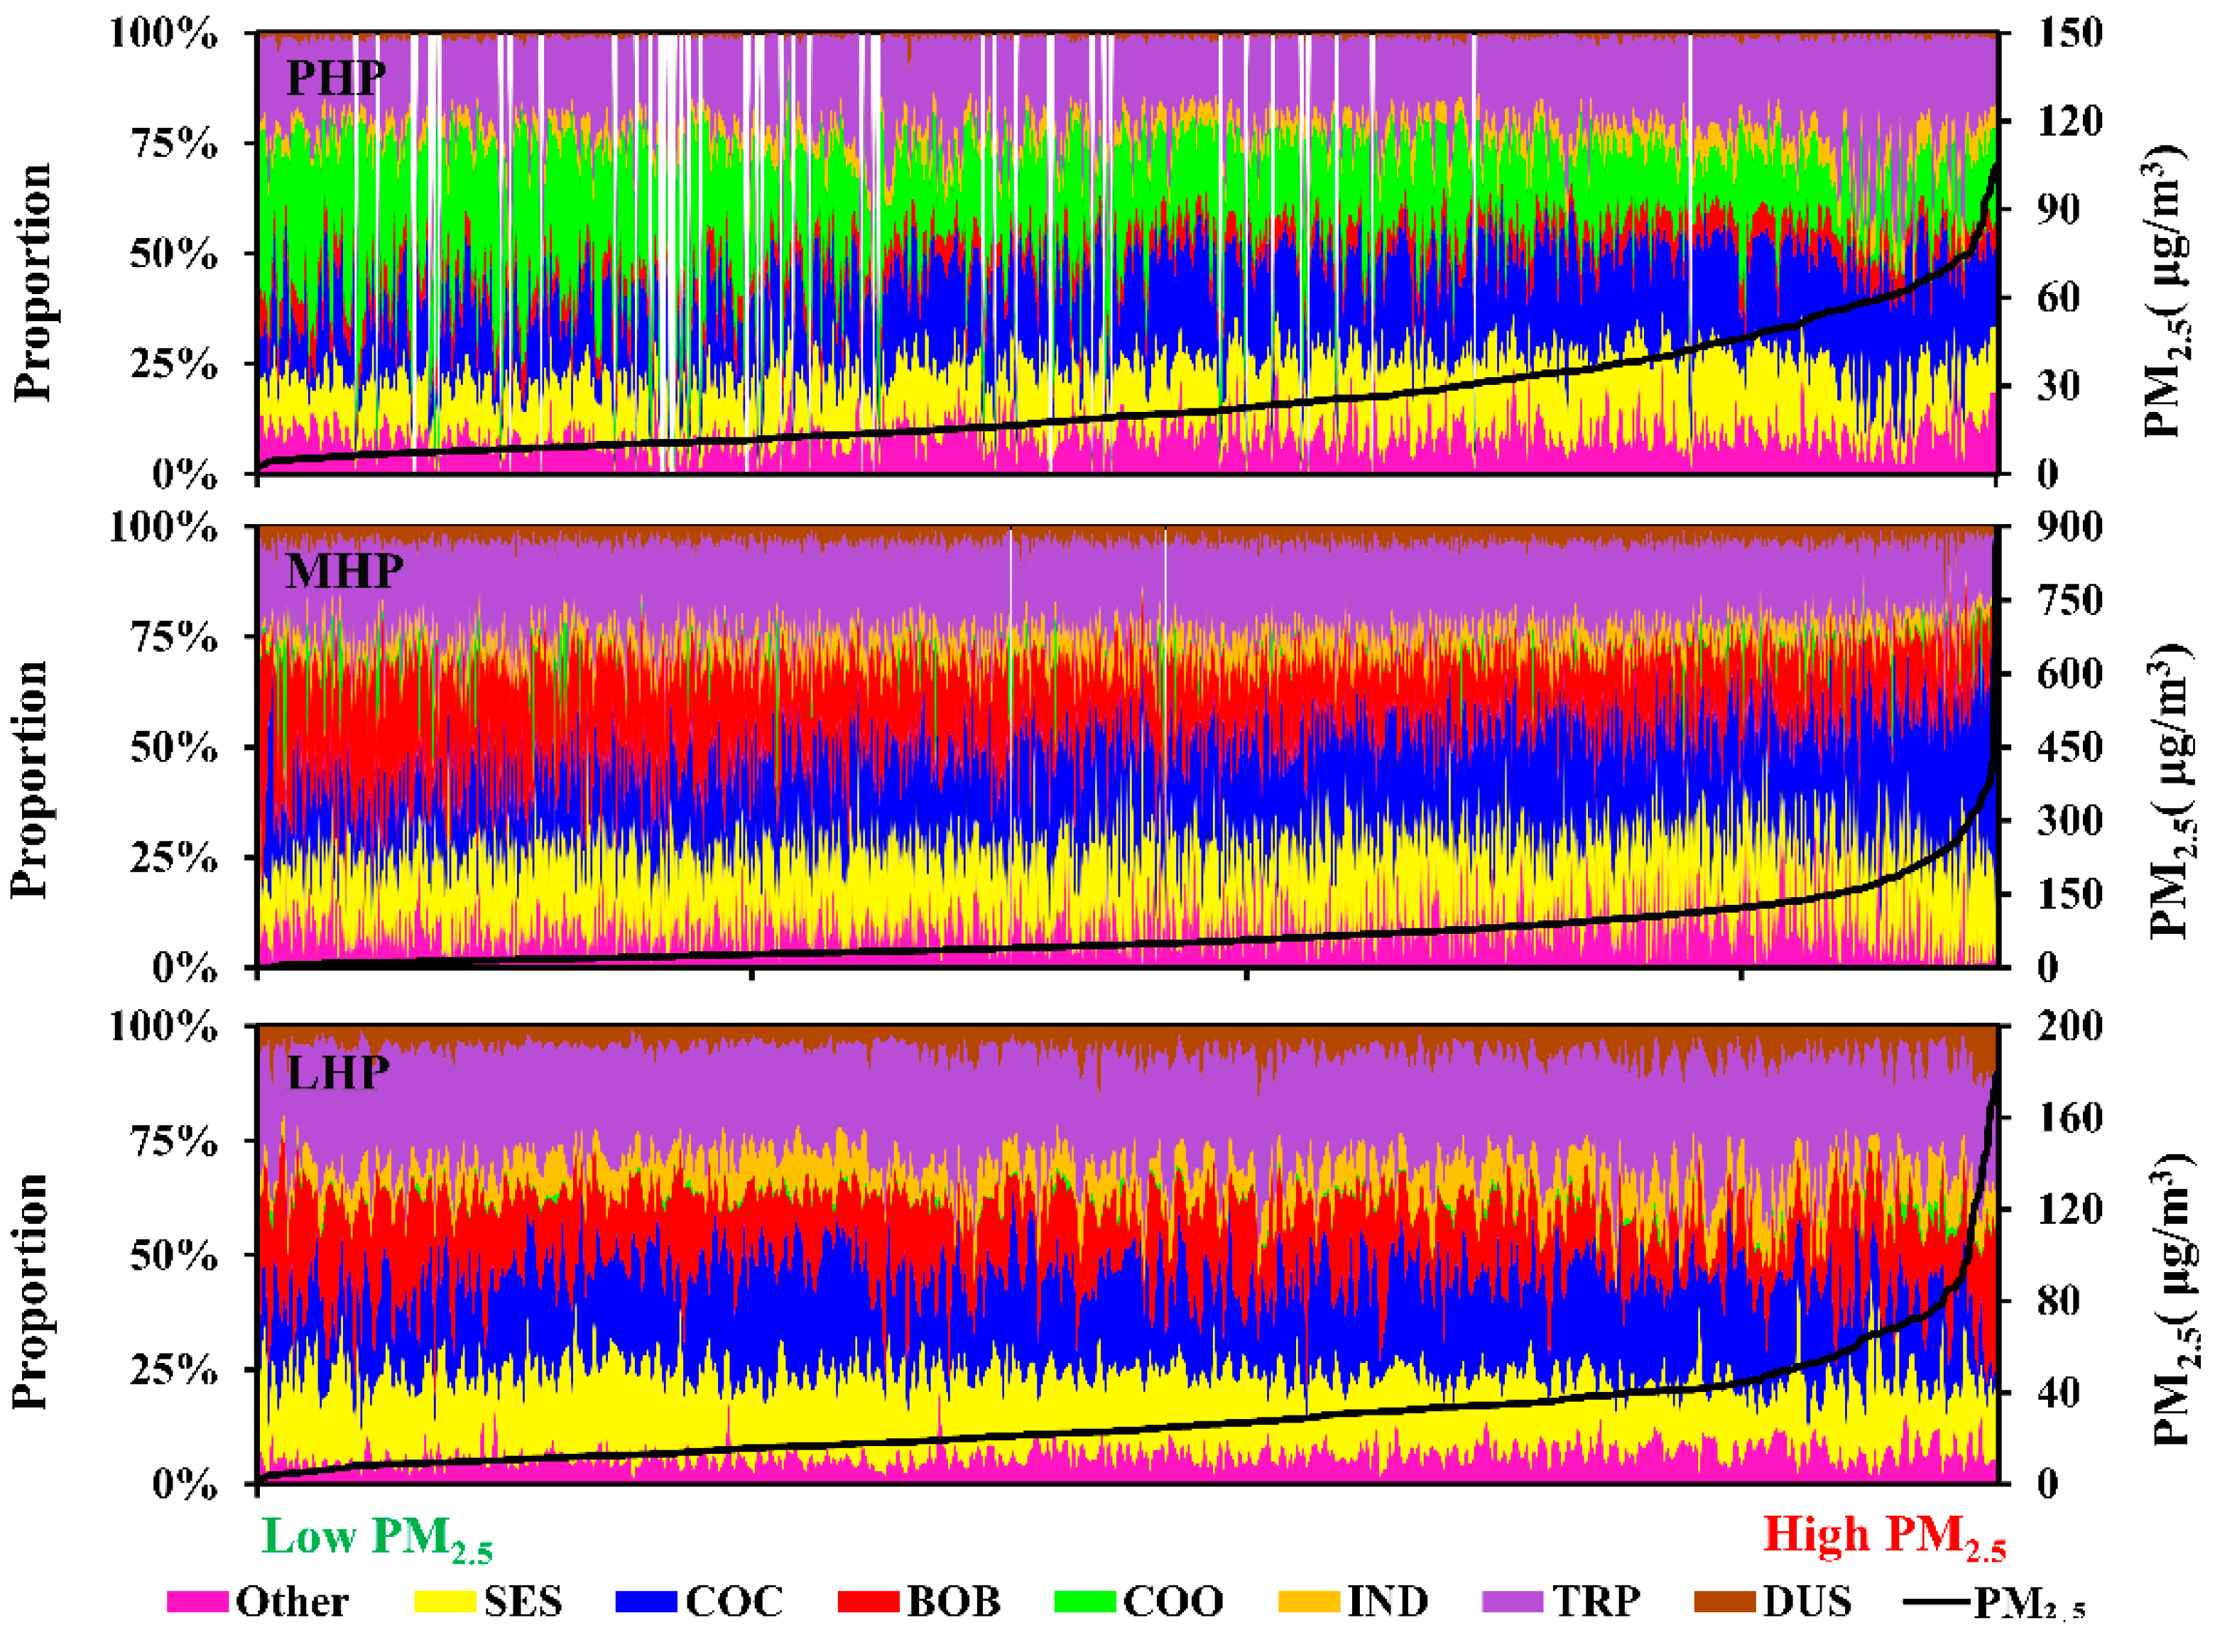
The effects of various emission sources on the increase in PM2.5 concentration were distinct (Figure 7). Although more than 25% of PM2.5 was also observed from COO during PHP, it is mainly in the non-polluted atmospheric environment, indicating that COO had a limited effect on severe haze in the region. By contrast, the contribution of COC for PM2.5 continued to increase during MHP and reached over 30% when PM2.5 concentrations was higher than 120 µg/m3, proving that COC had a key role in the formation of atmospheric pollution. During the LHP period, the contribution of COC for PM2.5 concentration remained at a high level, but it dropped sharply under heavily polluted conditions with a concomitant rise in BOB, which suggests that rapid and extensive open straw burning had replaced coal combustions and became the major source for the formation of severe haze events in this period.
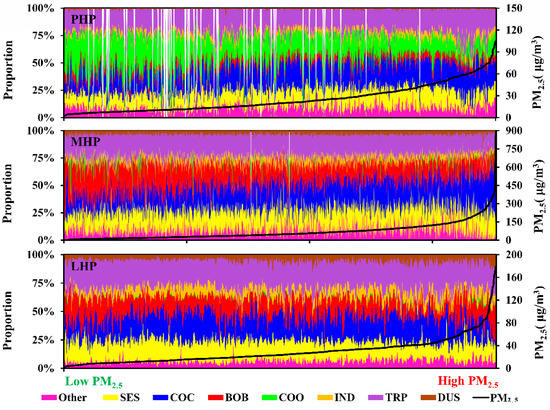
Figure 7.
Evolution of main contribution as PM2.5 concentrations increased in PHP, MHP and LHP.
3.4. Analysis of Typical Haze Periods
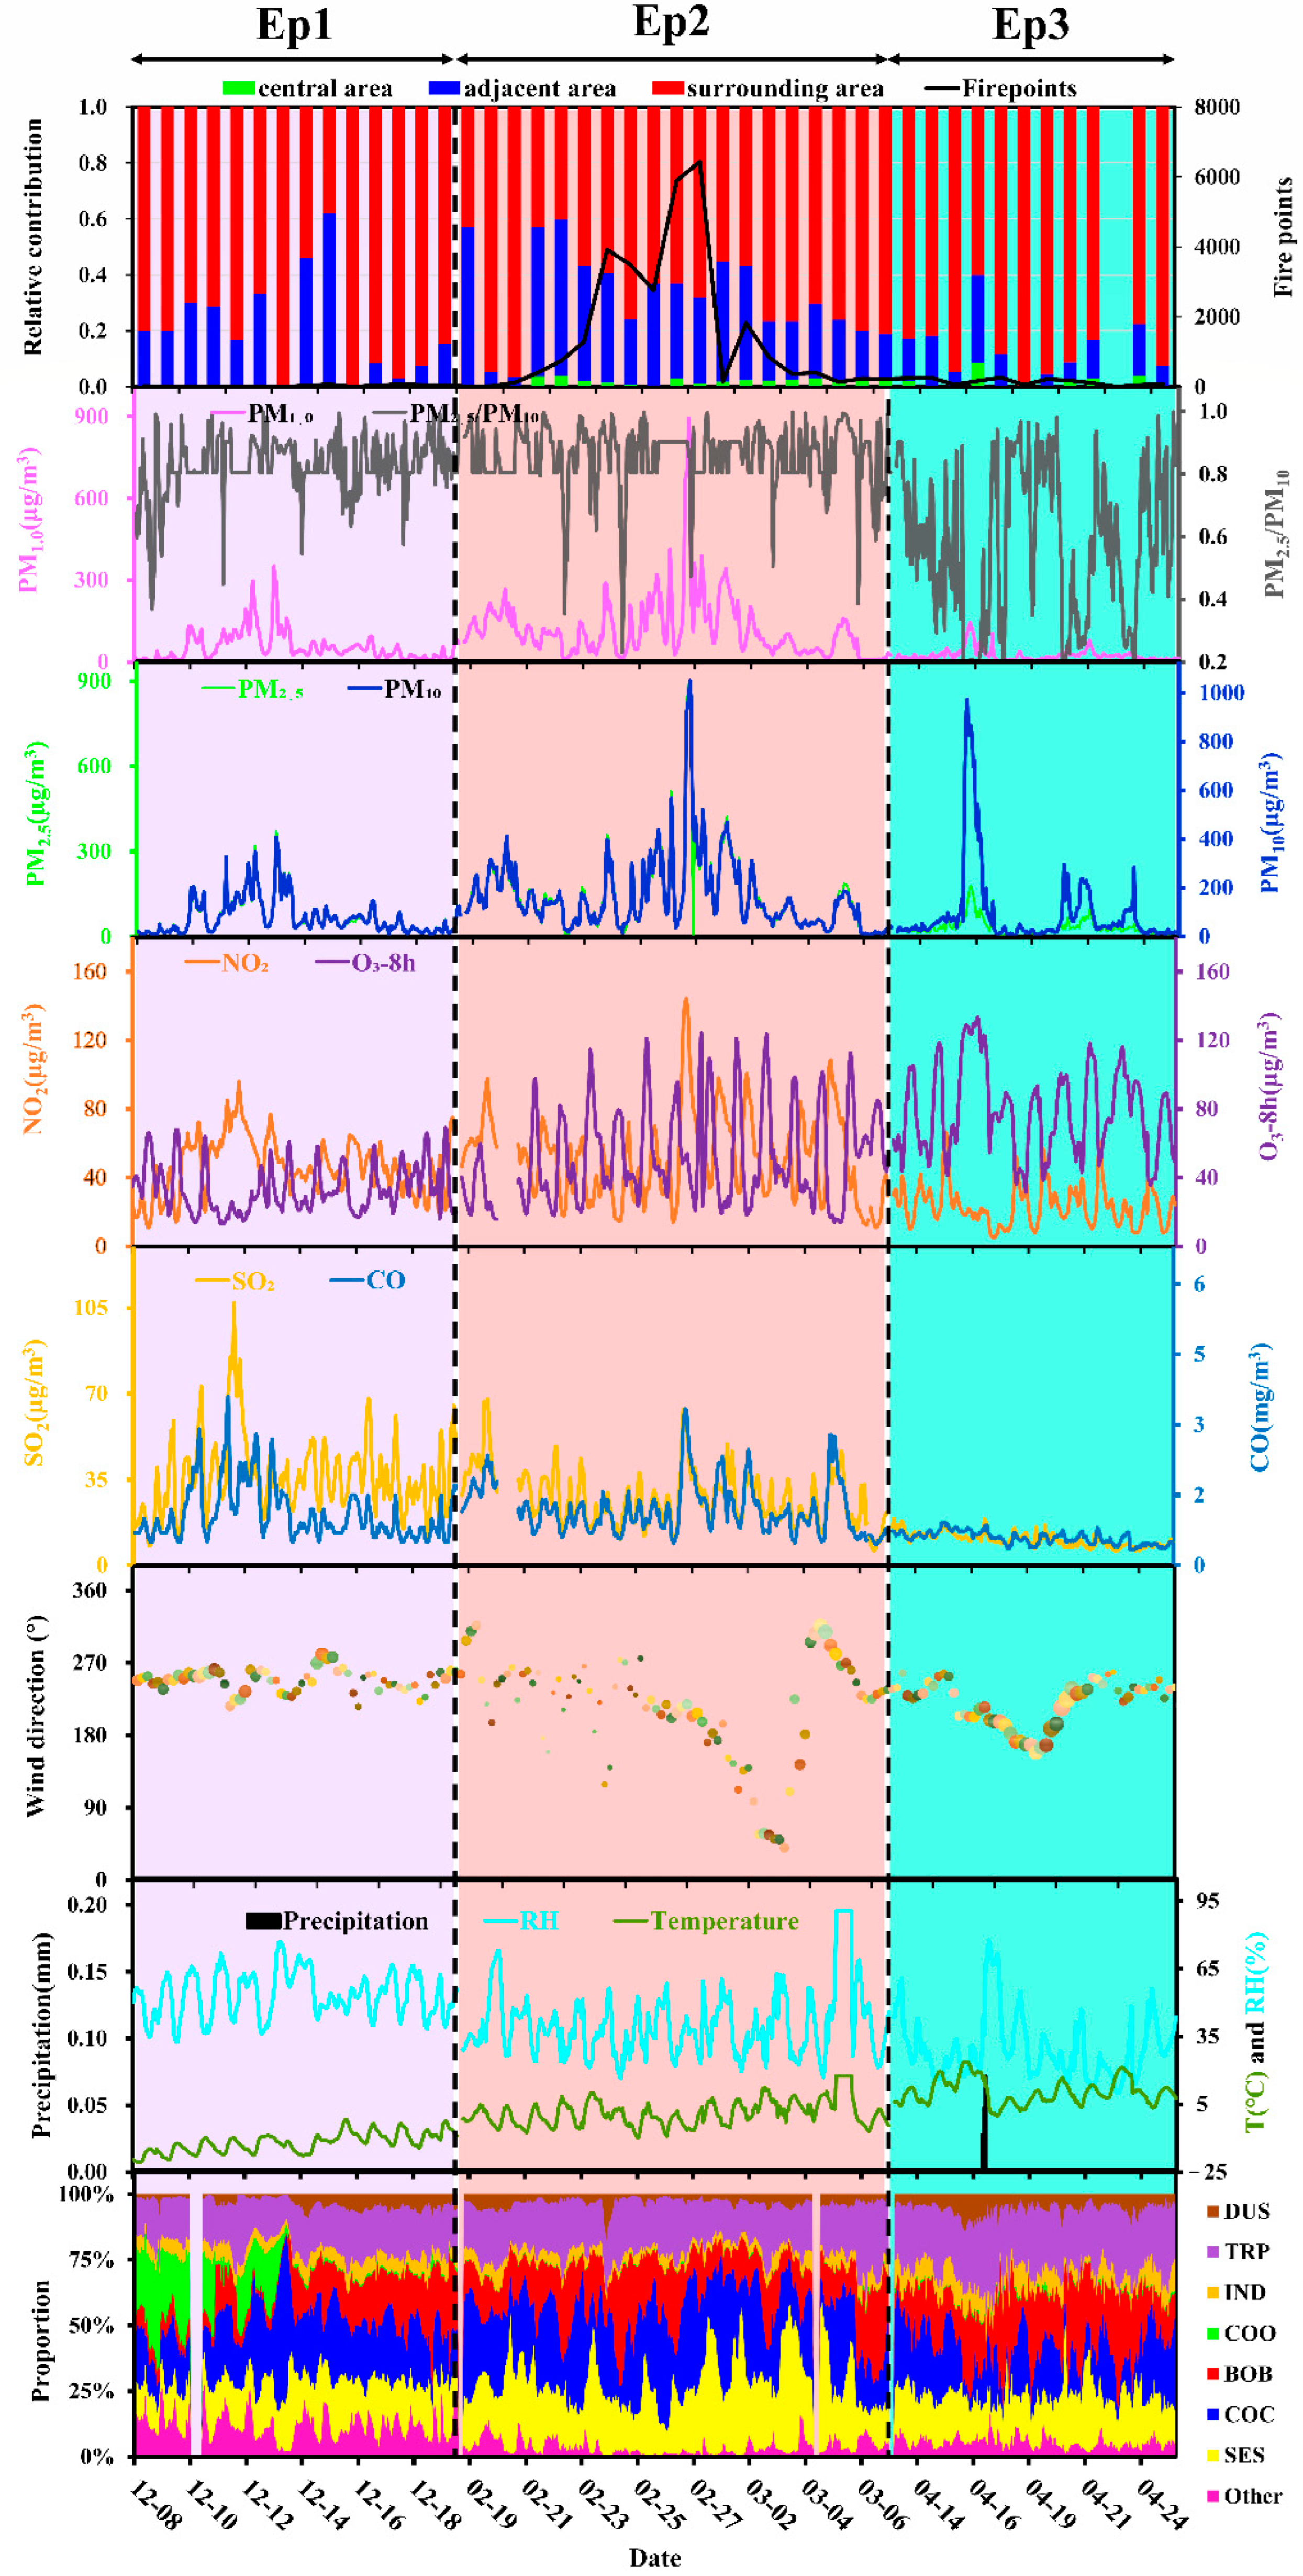
In this campaign, the mass of particulate matter varied dramatically, and three haze events (Ep1, Ep2 and Ep3) were observed with distinct pollution characteristics. The duration of each event was about 10 days, and two of which occurred during MHP and one during LHP (Figure 8).
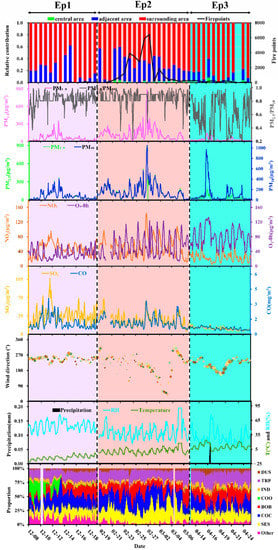
Figure 8.
Diurnal variation of pollutants concentration and meteorological elements during Ep1, Ep2 and Ep3.
3.4.1. Fuel Consumption-Induced Haze
Ep1 occurred 8–19 December 2018 (Figure 8). The average hourly concentration of PM2.5 in this period was 66.06 µg/m3 with the highest value of 373.25 µg/m3 at 23:00 on 12 December (Table 2). The daily concentrations of SO2, NO2, CO and O3 were significantly affected by meteorological factors and were higher at nighttime than at daylight. Peak values of ozone concentrations were observed at 14:00 to 16:00, consistent with higher NOx concentrations. The prevailing winds from the northwest had an average speed of 1.75 m/s. The ratio of PM2.5/PM10 was 0.82, which was comparable with previous studies for the haze evolution of Beijing and Wuhan [42,43].

Table 2.
Hourly average concentrations of pollutants and meteorological factors in Ep1, Ep2 and Ep3. The unit for CO is mg/m3, while that of remaining pollutants is µg/m3; the units of wind speed, relative humidity and temperature are m/s, % and °C, respectively.
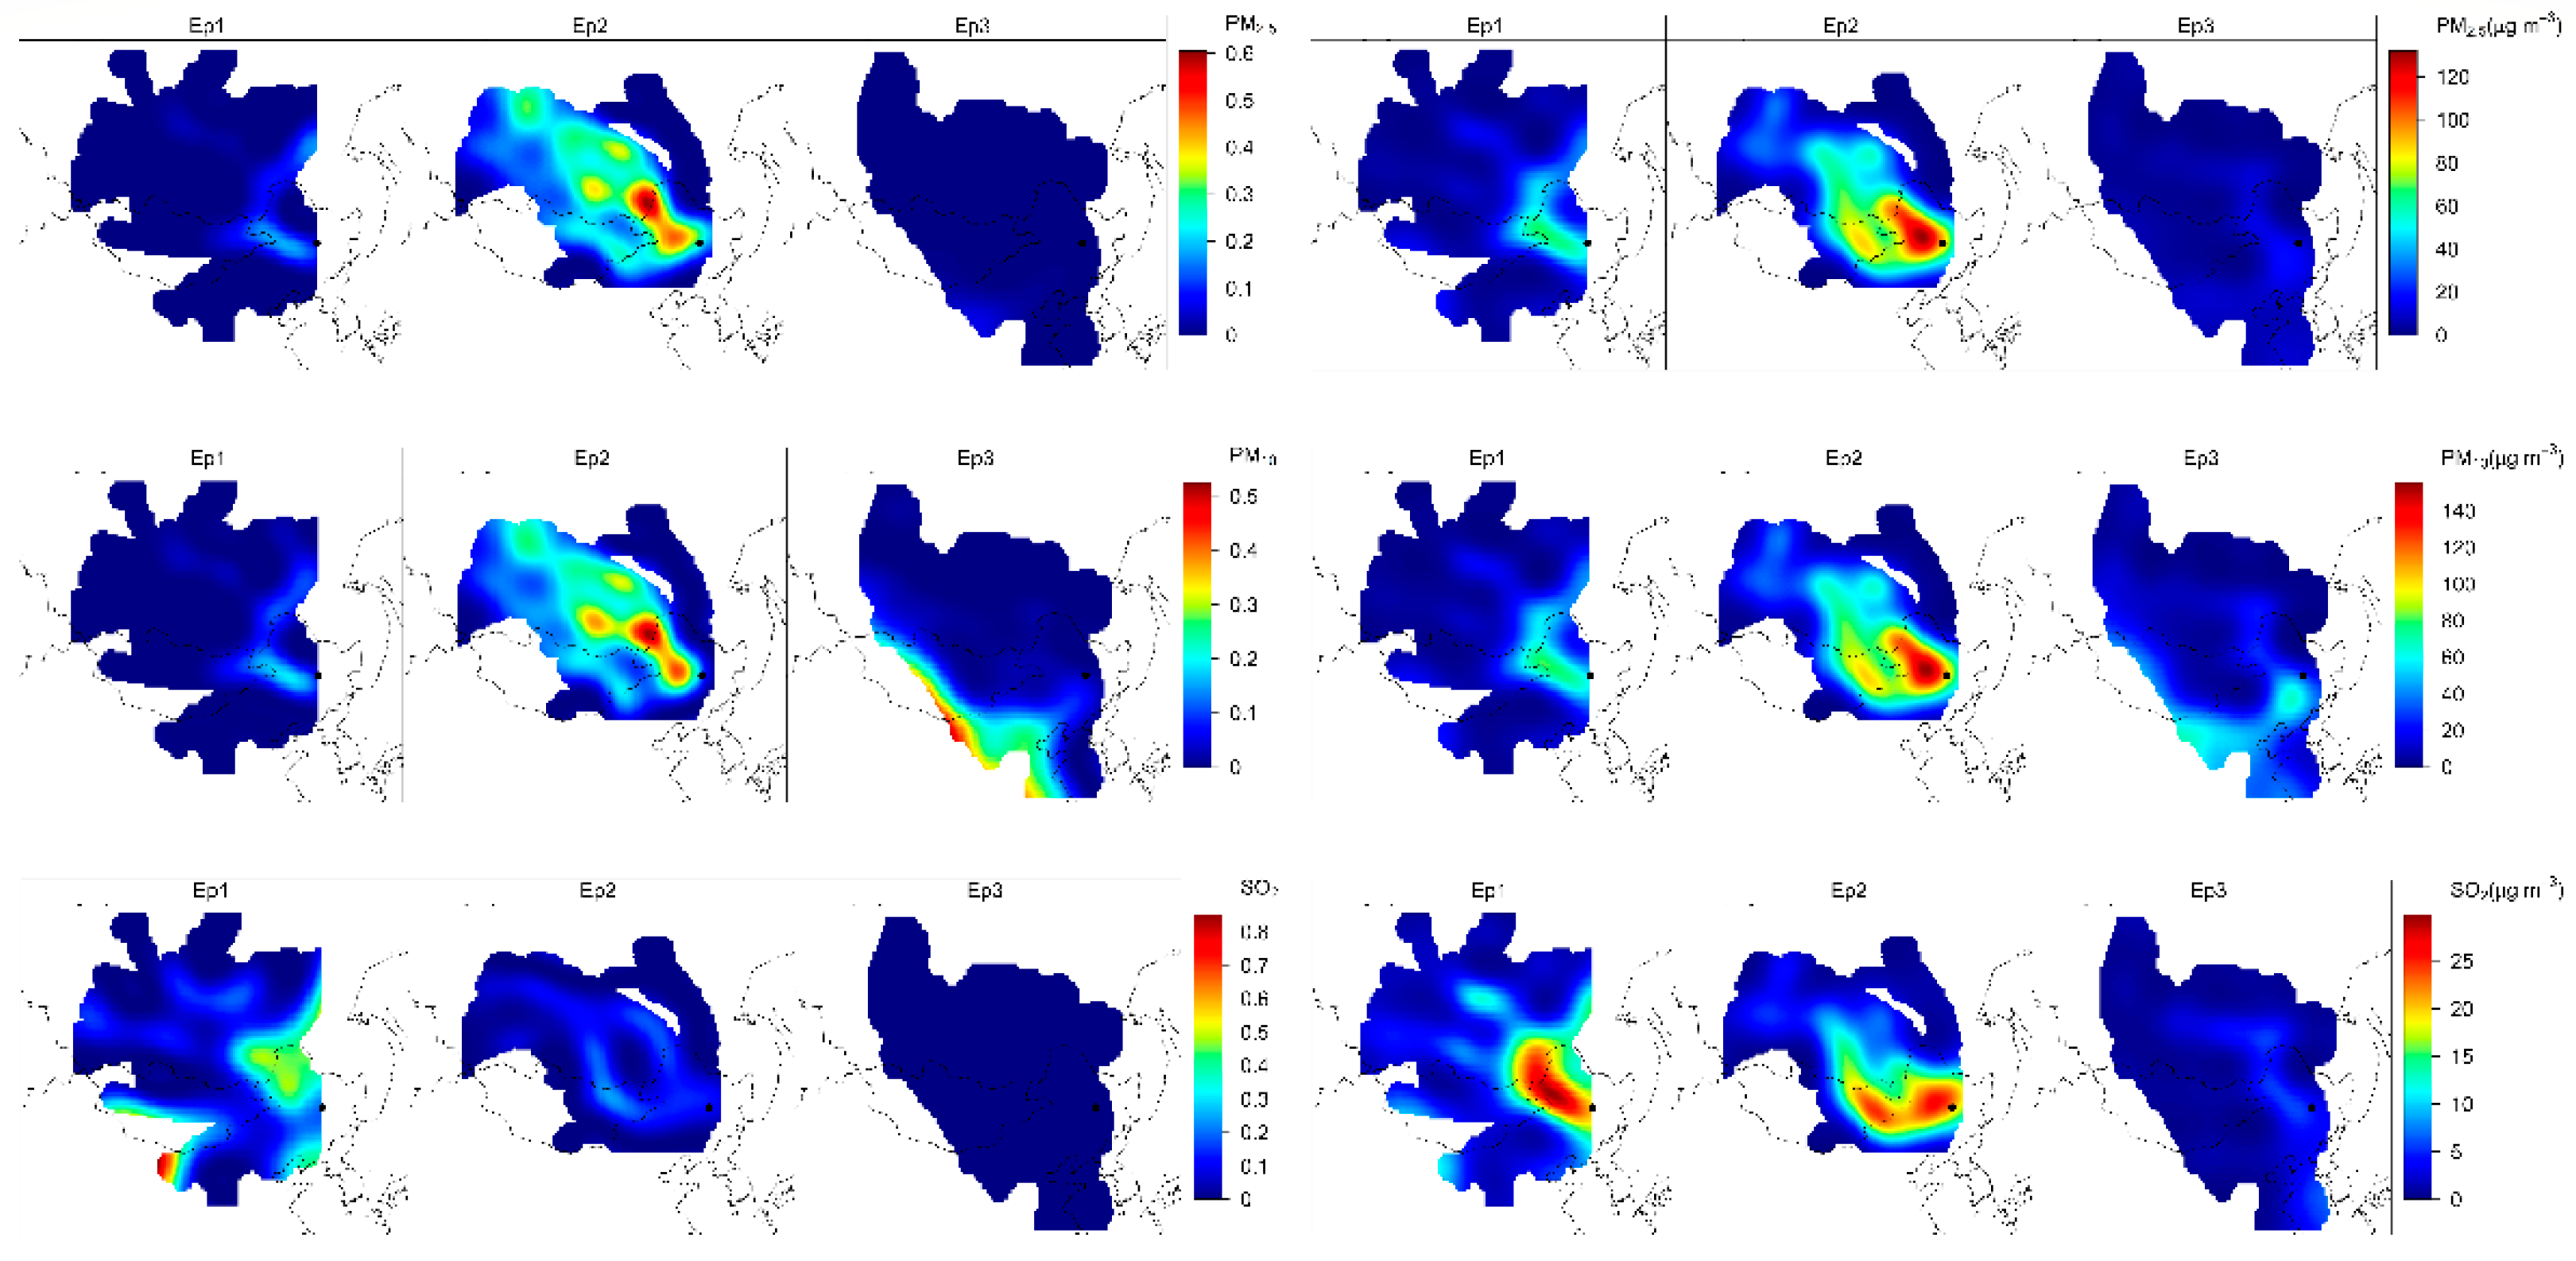
For Ep1, the haze episode 11–13 December was determined by coal-fired heating. In this stage, the consistent increase was observed for PM2.5, SO2 and CO concentrations, which have been reported as major pollutants from coal-fired heating in previous studies [44]. Meanwhile, the source apportionment illustrated that there was a significant increase in PM2.5 from COC after 12 December, especially during the polluted periods. Moreover, the stagnant meteorological factors were occurred with the wind speeds of 1.5 m/s and relative humidity of 55%, indicating that there was a lack of conditions for the long-distance transport of pollutants to the site, which further proved that the haze events were mainly caused by local coal burning during this period. Except for it, both CWT and PSCF results showed that high levels of PM2.5 and SO2 were all observed at this site and surrounding areas, supporting evidence that the emission from local fuel burning played the key role in the haze episode during Ep1 (Figure 9). However, there seems to be an abrupt increase in biomass burning contribution since 14 December. During EP1, the proportion of COC in PM2.5 emissions are not absolutely dominate because the weaker heating intensity and emissions from others will have a large perturbation in the contribution ratio, even if these emissions from these sources are not strong.

Figure 9.
Potential source contribution factor weights (PSCF) and concentration weighted trajectory (CWT) results of PM2.5, PM10 and SO2 in Ep1, Ep2 and Ep3.
3.4.2. Biomass Burning-Induced Haze
The Ep2 was characterized by a long period, which started on 19 February 2019 and ended on 6 March 2019, including three consecutive phases of pre-stage (19–24 February), mid-stage (25–28 February) and late-stage (1–6 March), respectively. The average concentration of PM2.5 and NO2 in the whole period was 142.41 and 51.38 µg/m3, respectively, which was higher than those of Ep1, while the average SO2 concentration was 27.49 µg/m3, decreasing 31% compared to Ep1. The highest hourly concentration of PM2.5 was 900.45 µg/m3 at 1:00 on 27 February 2019, which was 12 and 37 times higher than that of the NAAQS II standard and the World Health Organization standard, respectively. The wind speed during Ep2 was comparable to Ep1 (~2.5 m/s), but the average temperature reached 1.21 °C, which was significantly higher than that during Ep1.
Three factors jointly contributed to the formation of haze events in Ep2. First, coal-fired heating was the major anthropogenic source and emitted lots of PM, SO2 and CO during this period. The average atmospheric temperature was 1.2 °C, which was lower than the annual scale, indicating that coal-fired heating would remain at a high level. The source apportionment illustrated that the contribution of COC for PM2.5 was above 30%; even a higher proportion was recorded when the PM2.5 concentration was above 200 μg/m3. Second, extensive straw burning occurred in the site and surrounding area. Compared with Ep1, the number of farmland fires in Ep2 increased rapidly, and the maximum value was observed with the highest value of PM and CO on 26 and 27 February, indicating that the emission from open straw burning was the major source of haze formation. Meanwhile, the source apportionment also demonstrated that more than 35% of PM2.5 were from BOB and SES and became the major emission sources in this phase. Notably, the highest concentrations of PM and CO always appeared several hours or even a day after the peak of farmland fire points and represented that these pollutants were related to open straw burning. Satellite data showed that more than 98% of farmland fires were distributed in the surrounding cities of Harbin, suggesting that the regional transport of pollutants from surrounding cities had a significant impact on air quality in Harbin during this stage. Moreover, the results of CWT and PSCF also indicated that high concentrations of PM during Ep2 were concentrated in rural areas, such as the areas of southern Daqing, southwestern Suihua, Qiqihar and southeastern Inner Mongolia, with intensive agricultural activities (Figure 9). These were all consistent with the results of backward trajectory analysis, that is, above 82% of the air mass originated from these areas, confirming that the deterioration of air quality in Harbin at this stage was due to the air mass transport from the straw burning area. Third, gaseous pollutants (i.e., NOx and CO) and particulate matter (i.e., PM2.5 and BC) emitted by vehicles contribute to haze events. Higher NO2 were observed at this stage with the maximum hourly value of 152 μg/m3. This period was post-Chinese New Year and began on 19 February 2019 (i.e., Lantern Festival). The increase in vehicle activity after the Spring Festival holiday resulted in the rise of NO2, BC and PM concentrations. Moreover, BC emissions from vehicle exhaust could increase significantly due to low temperatures throughout the region [45].
3.4.3. Windblown-Induced Haze
Ep3 occurred 14–25 April 2019, and the concentrations of SO2 and CO were lower than those of Ep1 and Ep2, while significant ozone enhancements were observed with increasing temperature. The number of farmland fires were 200 per day and concentrated in the surrounding areas, which was comparable to Ep1 but lower than Ep2. Substantial differences are found in the PM2.5/PM10 ratio of Ep3 and Ep2. The average wind speed and temperature in this phase were 4.41 m/s and 10.55 °C, which were all higher than those in Ep1 and Ep2.
This haze episode occurred in the late stage of straw burning, which corresponds to the decreasing number of farmland fire points, proving that straw burning has limited impact on the air deterioration. In this stage, the average hourly concentration of SO2 and CO remained at a low level, while PM10 was higher than that in Ep2 with the maximum value of 973.79 μg/m3 on 15 April, which was six times higher than the Chinese NAAQS (CNAAQS) Grade II. The mean ratio of PM2.5/PM10 during Ep2 remained below 0.2, especially when the hourly PM10 concentration was above 300 µg/m3. In Northeast China, PM10 emissions mainly originated from anthropogenic sources (e.g., road dust or construction sites) and natural sources (e.g., degraded grasslands and bare farmlands) [6]. During this stage, two potential areas of PM10 concentrations above 100 μg/m3 were identified by CWT, which were located in southeast Inner Mongolia and northwest Harbin, respectively. Moreover, the 72 h backward trajectories showed more than 75% of air mass trajectory was transmitted to the site from these two regions, which were identified as the major area of high PM10 pollution (Figure 10). This evidence indicated that the transport of high PM10 concentrations from the southeast Inner Mongolia and northwest Harbin was the major driver of this haze event.
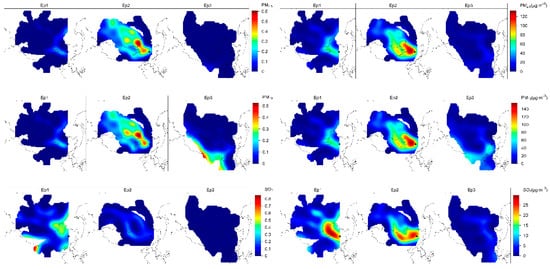
Figure 10.
The 72 h backward trajectories analyzed during the three episodes and the daily contribution variation of each cluster.
3.5. Comprehensive Control Options to Reduce Haze Episodes for Cold Regions of Northeast China
In this study, coal-fired heating was identified as closely associated with haze formation. Centralized urban heating, suburban boiler heating and rural coal-fired heating are the major forms of winter heating in this area [6] and contribute more than 50% of the PM and SO2 emission [29]. With the implementation of ultra-low emission standards for power plants and coal-fired boilers, the residential solid fuel burning from rural areas for heating or cooking is becoming one of the major sources of haze events due to the low burning efficiency and uncontrolled use [46,47]. Therefore, strengthening the promotion of clean fuels in these areas can reduce the intensity and frequency of haze episodes during the winter. In addition to coal burning in rural areas, open straw burning from surrounding and adjacent areas have a significant impact on the haze episodes in Harbin. To reduce the impact of residue burning on air quality, Harbin had implemented a three-year action plan for the comprehensive utilization of crop straw (2018–2020) since 2018 [48]. However, crop straw is still burned by farmers at less regulated times (i.e., at night), which increases uncertainty of regional air quality. This study shows that pollutants from straw burning in surrounding and adjacent areas have a crucial impact on air degradation in Harbin. Hence, implementing the coordinated management and establishing a scientific supervision system in the agriculture-dominated areas are necessary to reduce pollutant emission from open straw burning. Second, the “two-zone managements” (i.e., forbidden-burn areas and limited-burn areas) is another approach to restrict straw burning. A 14% reduction in PM2.5 concentration by this method in Jilin Province has been reported by Wen et al. [41]. Moreover, the energy utilization system should be established to reduce the straw residue from surrounding areas. Except for the straw utilization, conservation tillage techniques should also be applied on a large scale. Returning straw to field not only reduces soil moisture evaporation but also reduces the sandstorms. The results of this study illustrate that vehicle exhaust contributes a significant proportion to NOx emission, especially in LHP, accounting for 25% of the total. A series of reasonably implemented rules in urban areas are indispensable for controlling vehicle emission. For example, promoting the use of cleaner vehicles (i.e., National VI and Electric Vehicle) and reducing the operation of diesel vehicles would be essential during haze episodes.
4. Conclusions
To reveal the pollution characteristics in cold regions of China, an online single particle aerosol mass analysis combined with meteorological data was used to evaluate the potential sources and regional transport of PM2.5 in Harbin. Higher PM2.5 from COC was observed in MHP than that in PHP, and LHP indicated that coal burning had a significant impact on air pollution in Harbin. Open straw burning from surrounding and adjacent areas was the major cause of air quality deterioration, especially at night when PM concentrations remained at a high level despite a rapid decline in SO2. During LHP, dust was wind-blown from southeast Inner Mongolia and northwest Harbin by long-distance transport. This study also analyzed three events that characterize the typical winter pollution in cold regions of China. Ep1 was described as the fuel combustion–induced haze manifested by high atmospheric SO2 concentrations, whereas Ep2 was caused by the joint effect of coal combustion and straw burning. The windblown dust by long-distance transmission from the north and southwest of Harbin aggravated local pollution. Real-time source apportionment of fine particulate matter in the northmost megacity in China highlights the importance of joint control of urban atmospheric pollution in the cold region.
Author Contributions
Data curation, W.L.; Formal analysis, M.Z.; Funding acquisition, W.C.; Project administration, W.C.; Software, W.C. and M.Z.; Supervision, W.C.; Visualization, M.Z.; Writing—original draft, M.Z. and J.F.; Writing—review & editing, W.C. and L.G. All authors have read and agreed to the published version of the manuscript.
Funding
This research was funded under the auspices of the National Key R & D Program of China (No. 2017YFC0212303), the Key Research Program of Frontier Sciences, Chinese Academy of Sciences (No. QYZDB-SSW-DQC045) and the National Natural Science Foundation of China (No. 41775116).
Data Availability Statement
No applicable.
Conflicts of Interest
The authors declare that they have no known competing financial interests or personal relationships that could have appeared to influence the work reported in this paper.
References
- An, Z.S.; Huang, R.J.; Zhang, R.Y.; Tie, X.X.; Li, G.H.; Cao, J.J.; Zhou, Q.J.; Shi, Z.G.; Han, Y.M.; Gu, Z.L.; et al. Severe haze in northern China: A synergy of anthropogenic emissions and atmospheric processes. Proc. Natl. Acad. Sci. USA 2019, 116, 8657–8666. [Google Scholar] [CrossRef] [Green Version]
- Peng, J.F.; Hu, M.; Shang, D.J.; Wu, Z.J.; Du, Z.F.; Tan, T.Y.; Wang, Y.N.; Zhang, F.; Zhang, R.Y. Explosive Secondary Aerosol Formation during Severe Haze in the North China Plain. Environ. Sci. Technol. 2021, 55, 2189–2207. [Google Scholar] [CrossRef]
- Lu, C.; Fu, J.; Liu, X.; Chen, W.; Hao, J.; Li, X.; Pant, O. Air pollution and meteorological conditions significantly contribute to the worsening of allergic conjunctivitis: A regional 20-city, 5-year study in Northeast China. Light Sci. Appl. 2021, 10, 2128–2142. [Google Scholar] [CrossRef] [PubMed]
- Shen, L.J.; Wang, H.L.; Cheng, M.T.; Ji, D.S.; Liu, Z.R.; Wang, L.L.; Gao, W.K.; Yang, Y.; Huang, W.; Zhang, R.J.; et al. Chemical composition, water content and size distribution of aerosols during different development stages of regional haze episodes over the north China plain. Atmos. Environ. 2021, 245, 118020. [Google Scholar] [CrossRef]
- Kong, L.W.; Tan, Q.W.; Feng, M.; Qu, Y.; An, J.L.; Liu, X.G.; Cheng, N.L.; Deng, Y.J.; Zhai, R.X.; Wang, Z. Investigating the characteristics and source analyses of PM2.5 seasonal variations in Chengdu, Southwest China. Chemosphere 2020, 243, 125267. [Google Scholar] [CrossRef]
- Chen, W.W.; Zhang, S.C.; Tong, Q.S.; Zhang, X.L.; Zhao, H.M.; Ma, S.Q.; Xiu, A.J.; He, Y.X. Regional characteristics and causes of haze events in Northeast China. Chin. Geogr. Sci. 2018, 28, 836–850. [Google Scholar] [CrossRef] [Green Version]
- Xu, M.; Liu, Z.R.; Hu, B.; Yan, G.X.; Zou, J.N.; Zhao, S.M.; Zhou, J.X.; Liu, X.H.; Zheng, X.P.; Zhang, X.Y.; et al. Chemical characterization and source identification of PM2.5 in Luoyang after the clean air actions. J. Environ. Sci. 2021, 115, 265–276. [Google Scholar] [CrossRef]
- Li, X.Y.; Cheng, T.H.; Shi, S.Y.; Guo, H.; Wu, Y.; Lei, M.; Zuo, Y.; Wang, W.N.; Han, Z.Y. Evaluating the impacts of burning biomass on PM2.5 regional transport under various emission conditions. Sci. Total Environ. 2021, 793, 148481. [Google Scholar] [CrossRef]
- Hu, W.Y.; Zhao, T.L.; Bai, Y.Q.; Kong, S.F.; Xiong, J.; Sun, X.Y.; Yang, Q.J.; Gu, Y.; Lu, H.C. Importance of regional PM2.5 transport and precipitation washout in heavy air pollution in the Twain-Hu Basin over Central China: Observational analysis and WRF-Chem simulation. Sci. Total Environ. 2021, 758, 143710. [Google Scholar] [CrossRef]
- Luo, L.; Zhu, R.G.; Song, C.B.; Peng, J.F.; Guo, W.; Liu, Y.H.; Zheng, N.J.; Xiao, H.W.; Xiao, H.Y. Changes in nitrate accumulation mechanisms as PM2.5 levels increase on the North China Plain: A perspective from the dual isotopic compositions of nitrate. Chemosphere 2021, 263, 127915. [Google Scholar] [CrossRef]
- Ou, J.P.; Hu, Q.H.; Liu, H.R.; Xu, S.Q.; Wang, Z.; Ji, X.G.; Wang, X.Q.; Xie, Z.Q.; Kang, H. Exploring the impact of new particle formation events on PM2.5 pollution during winter in the Yangtze River Delta, China. J. Environ. Sci. 2021, 111, 75–83. [Google Scholar] [CrossRef]
- Xu, J.; Wang, H.T.; Li, X.J.; Li, Y.; Wen, J.; Zhang, J.S.; Shi, X.R.; Li, M.; Wang, W.; Shi, G.L.; et al. Refined source apportionment of coal combustion sources by using single particle mass spectrometry. Sci. Total Environ. 2018, 627, 633–646. [Google Scholar] [CrossRef]
- Yang, J.; Ma, S.X.; Gao, B.; Li, X.Y.; Zhang, Y.J.; Cai, J.; Li, M.; Yao, L.G.; Huang, B.; Zheng, M. Single particle mass spectral signatures from vehicle exhaust particles and the source apportionment of on-line PM2.5 by single particle aerosol mass spectrometry. Sci. Total Environ. 2017, 593, 310–318. [Google Scholar] [CrossRef] [PubMed]
- Guo, S.; Hu, M.; Zamora, M.L.; Peng, J.F.; Shang, D.J.; Zheng, J.; Du, Z.F.; Wu, Z.J.; Shao, M.; Zeng, L.M.; et al. Elucidating severe urban haze formation in China. Proc. Natl. Acad. Sci. USA 2014, 111, 17373–17378. [Google Scholar] [CrossRef] [PubMed] [Green Version]
- Zhao, Z.Y.; Cao, F.; Fan, M.Y.; Zhang, W.Q.; Zhai, X.Y.; Wang, Q.; Zhang, Y.L. Coal and biomass burning as major emissions of NOx in Northeast China: Implication from dual isotopes analysis of fine nitrate aerosols. Atmos. Environ. 2020, 242, 117762. [Google Scholar] [CrossRef]
- Zong, Z.; Sun, Z.Y.; Xiao, L.L.; Tian, C.G.; Liu, J.W.; Sha, Q.G.; Li, J.; Fang, Y.T.; Zheng, J.Y.; Zhang, G. Insight into the variability of the nitrogen isotope composition of vehicular NOx in China. Environ. Sci. Technol. 2020, 54, 14246–14253. [Google Scholar] [CrossRef] [PubMed]
- Liao, J.; Jin, A.Z.; Chafe, Z.A.; Pillarisetti, A.; Yu, T.; Shan, M.; Yang, X.D.; Li, H.X.; Liu, G.Q.; Smitha, K.R. The impact of household cooking and heating with solid fuels on ambient PM2.5 in peri-urban Beijing. Atmos. Environ. 2017, 165, 62–72. [Google Scholar] [CrossRef]
- Lin, C.Q.; Liu, G.; Lau, A.K.H.; Li, Y.; Li, C.C.; Fung, J.C.H.; Lao, X.G. High-resolution satellite remote sensing of provincial PM2.5 trends in China from 2001 to 2015. Atmos. Environ. 2018, 180, 110–116. [Google Scholar] [CrossRef]
- Meng, J.; Li, C.; Martin, R.V.; van Donkelaar, A.; Hystad, P.; Brauer, M. Estimated long-term (1981–2016) concentrations of ambient fine particulate matter across North America from chemical transport modeling, satellite remote sensing, and ground-based measurements. Environ. Sci. Technol. 2019, 53, 5071–5079. [Google Scholar] [CrossRef] [Green Version]
- Chen, D.H.; Li, M.; Huang, B.; Jiang, B.; Zhang, T.; Jiang, M.; Xie, M.; Zhong, L.; Bi, X.; Lv, X.; et al. The pollution characteristics and source apportionment of regional atmospheric fine particles. China Environ. Sci. 2016, 36, 651–659. [Google Scholar]
- Wang, Z.S.; Li, Y.T.; Li, Q.; Wang, L.H.; Liu, B.X. Analysis on a Dust Pollution Event in Beijing in May, 2017. Based on the Observation of an Atmospheric Supersite. Environ. Monit. China 2017, 33, 28–34. [Google Scholar] [CrossRef]
- Sun, X.Z.; Wang, K.; Li, B.; Zong, Z.; Shi, X.F.; Ma, L.X.; Fu, D.L.; Thapa, S.; Qi, H.; Tian, C.G. Exploring the cause of PM2.5 pollution episodes in a cold metropolis in China. J. Clean Prod. 2020, 256, 120275. [Google Scholar] [CrossRef]
- Luo, Y.; Liu, S.; Che, L.; Yu, Y. Analysis of temporal spatial distribution characteristics of PM2.5 pollution and the influential meteorological factors using Big Data in Harbin, China. J. Air Waste Manag. Assoc. 2021, 71, 964–973. [Google Scholar] [CrossRef]
- Bai, H.M.; Zheng, Z.; Zhang, Y.P.; Huang, H.; Wang, L. Comparison of satellite-based PM2.5 estimation from aerosol optical depth and top-of-atmosphere reflectance. Aerosol Air Qual. Res. 2021, 21, 200257. [Google Scholar] [CrossRef]
- Wang, Y.; Wang, M.M.; Li, S.P.; Sun, H.Y.; Mu, Z.; Zhang, L.X.; Li, Y.G.; Chen, Q.C. Study on the oxidation potential of the water-soluble components of ambient PM2.5 over Xi’an, China: Pollution levels, source apportionment and transport pathways. Environ. Int. 2020, 136, 105515. [Google Scholar] [CrossRef]
- Li, B.; Shi, X.F.; Liu, Y.P.; Lu, L.; Wang, G.L.; Thapa, S.; Sun, X.Z.; Fu., D.L.; Wang, K.; Hong, Q. Long-term characteristics of criteria air pollutants in megacities of Harbin-Changchun megalopolis, Northeast China: Spatiotemporal variations, source analysis, and meteorological effects. Environ. Pollut. 2020, 267, 115441. [Google Scholar] [CrossRef]
- Statistics Bureau of Harbin. Harbin Statistical Yearbook 2019; China Statistics Press: Beijing, China, 2019. (In Chinese) [Google Scholar]
- Chen, W.W.; Tong, D.Q.; Zhang, S.C.; Zhang, X.L.; Zhao, H.M. Local PM10 and PM2.5 emission inventories from agricultural tillage and harvest in northeastern China. China Environ. Sci. 2017, 57, 15–23. [Google Scholar] [CrossRef]
- Zhang, M.D.; Chen, W.W.; Shen, X.J.; Zhao, H.M.; Gao, C.K.; Zhang, X.L.; Liu, W.; Yang, C.J.; Qin, Y.; Zhang, S.C.; et al. Comprehensive and high-resolution emission inventory of atmospheric pollutants for the northernmost cities agglomeration of Harbin-Changchun, China: Implications for local atmospheric environment management. J. Environ. Sci. 2021, 104, 150–168. [Google Scholar] [CrossRef]
- Bi, X.H.; Zhang, G.H.; Li, L.; Wang, X.M.; Li, M.; Sheng, G.Y.; Fu, J.M.; Zhou, Z. Mixing state of biomass burning particles by single particle aerosol mass spectrometer in the urban area of PRD, China. Atmos. Environ. 2011, 45, 3447–3453. [Google Scholar] [CrossRef]
- Li, L.; Huang, Z.X.; Dong, J.G.; Li, M.; Gao, W.; Nian, H.Q.; Zhou, F.; Zhang, G.H.; Bi, X.H.; Cheng, P.; et al. Real time bipolar time-of-flight mass spectrometer for analyzing single aerosol particles. Int. J. Mass Spectrom. 2011, 303, 118–124. [Google Scholar] [CrossRef]
- Molnár, P.; Tang, L.; Sjöberg, K.; Wichmann, J. Long-range transport clusters and positive matrix factorization source apportionment for investigating transboundary PM2.5 in Gothenburg, Sweden. Environ. Sci. Processes Impacts 2017, 19, 1270–1277. [Google Scholar] [CrossRef] [PubMed] [Green Version]
- Polissar, A.V.; Hopke, P.K.; Paatero, P.; Kaufmann, Y.J.; Hall, D.K.; Bodhaine, B.A.; Harris, J.M. The aerosol at Barrow, Alaska: Long-term trends and source locations. Atmos. Environ. 1999, 33, 2441–2458. [Google Scholar] [CrossRef]
- Song, X.H.; Hopke, P.K.; Fergenson, D.P.; Prather, K.A. Classification of single particles analyzed by ATOFMS using an artificial neural network, ART-2A. Anal. Chem. 1999, 71, 860–865. [Google Scholar] [CrossRef]
- Zou, J.N.; An, J.L.; Cao, Q.M.; Wang, H.L.; Wang, J.X.; Chen, C. The effects of physical and chemical characteristics of aerosol number concentration on scattering coefficients in Nanjing, China: Insights from a single particle aerosol mass spectrometer. Atmos Res. 2021, 250, 105382. [Google Scholar] [CrossRef]
- Zhang, M.D.; Zhang, S.C.; Bao, Q.Y.; Yang, C.J.; Qin, Y.; Fu, J.; Chen, W.W. Temporal Variation and Source Analysis of Carbonaceous Aerosol in Industrial Cities of Northeast China during the Spring Festival: The Case of Changchun. Atmosphere 2020, 11, 991. [Google Scholar] [CrossRef]
- Wang, Y.; Guo, H.; Zou, S.C.; Lyu, X.P.; Ling, Z.H.; Cheng, H.R.; Zeren, Y.Z. Surface O3 photochemistry over the South China Sea: Application of a near-explicit chemical mechanism box model. Environ. Pollut. 2018, 234, 155–166. [Google Scholar] [CrossRef]
- Sadanaga, Y.; Yoshino, A.; Kato, S.; Kajii, Y. Measurements of OH reactivity and photochemical ozone production in the urban atmosphere. Environ. Sci. Technol. 2005, 39, 8847–8852. [Google Scholar] [CrossRef]
- Gao, C.K.; Gao, C.B.; Song, K.H.; Xing, Y.H.; Chen, W.W. Vehicle emissions inventory in high spatial–temporal resolution and emission reduction strategy in Harbin-Changchun Megalopolis. Process Saf. Environ. Prot. 2020, 138, 236–245. [Google Scholar] [CrossRef]
- He, Y.P.; Gu, Z.L.; Lu, W.Z.; Zhang, L.Y.; Okuda, T.; Fujioka, K.; Luo, H.; Yu, C.W. Atmospheric humidity and particle charging state on agglomeration of aerosol particles. Atmos. Environ. 2019, 197, 141–149. [Google Scholar] [CrossRef]
- Wen, X.; Chen, W.W.; Chen, B.; Yang, C.J.; Tu, G.; Cheng, T.H. Does the prohibition on open burning of straw mitigate air pollution? An empirical study in Jilin Province of China in the post-harvest season. J. Environ. Manag. 2020, 264, 110451. [Google Scholar] [CrossRef]
- Li, X.R.; Wang, Y.S.; Guo, X.Q.; Wang, Y.F. Seasonal variation and source apportionment of organic and inorganic compounds in PM2.5 and PM10 particulates in Beijing, China. J. Environ. Sci. 2013, 25, 741–750. [Google Scholar] [CrossRef]
- Xu, G.; Jiao, L.M.; Zhang, B.E.; Zhao, S.L.; Yuan, M.; Gu, Y.Y.; Liu, J.F.; Tang, X. Spatial and temporal variability of the PM2.5/PM10 ratio in Wuhan, Central China. Aerosol Air Qual. Res. 2017, 17, 741–751. [Google Scholar] [CrossRef] [Green Version]
- Chen, Q.X.; Huang, C.L.; Xiao, T.; Yuan, Y.; Mao, Q.J.; Tan, H.P. Characterization of atmospheric aerosols and source apportionment analyses in urban Harbin, Northeast China. Infrared Phys. Technol. 2019, 103, 103109. [Google Scholar] [CrossRef]
- Gao, C.K.; Xu, Q.J.; Xing, Y.H. Emission Inventory of Atmospheric Pollutants from on-Road Vehicles in Low-Temperature Areas in Winter. J. Northeast. Univ. (Nat. Sci.) 2019, 40, 1343–1349. [Google Scholar]
- Sun, J.; Wang, J.H.; Shen, Z.X.; Huang, Y.; Zhang, Y.; Niu, X.Y.; Cao, J.J.; Zhang, Q.; Xu, H.M.; Zhang, N.N.; et al. Volatile organic compounds from residential solid fuel burning in Guanzhong Plain, China: Source-related profiles and risks. Chemosphere 2019, 221, 184–192. [Google Scholar] [CrossRef]
- Yu, K.; Qiu, G.K.; Chan, K.H.; Lam, K.B.H.; Kurmi, O.P.; Bennett, D.A.; Yu, C.Q.; Pan, A.; Lv, J.; Guo, Y.; et al. Association of solid fuel use with risk of cardiovascular and all-cause mortality in rural China. JAMA 2018, 319, 1351–1361. [Google Scholar] [CrossRef]
- Harbin Municipal People’s Government. Special Action Plan on Prevention and Control of Air Pollution in Harbin (2016–2018). [internet]. 2018. Available online: http://www.harbin.gov.cn/art/2016/5/23/art_13790_684.html (accessed on 10 August 2021). (In Chinese)
Publisher’s Note: MDPI stays neutral with regard to jurisdictional claims in published maps and institutional affiliations. |
© 2022 by the authors. Licensee MDPI, Basel, Switzerland. This article is an open access article distributed under the terms and conditions of the Creative Commons Attribution (CC BY) license (https://creativecommons.org/licenses/by/4.0/).

