Technical Note

Aerosol Monitoring at High Mountains Remote Station: A Case Study on the Yunnan Plateau (China)

1
Dipartimento di Fisica “E. Pancini”, Università degli Studi di Napoli Federico II, 80126 Napoli, Italy
2
Consiglio Nazionale delle Ricerche, Istituto di Metodologie per l’Analisi Ambientale, CNR-IMAA, 85050 Tito Scalo, Italy
3
Istituto Superconduttori, Materiali Innovativi e Dispositivi (SPIN), Consiglio Nazionale delle Ricerche, 80126 Napoli, Italy
4
Beijing Research Institute of Telemetry, Beijing 100076, China
*
Author to whom correspondence should be addressed.
Remote Sens. 2022, 14(15), 3773; https://doi.org/10.3390/rs14153773
Submission received: 29 June 2022 / Revised: 28 July 2022 / Accepted: 2 August 2022 / Published: 5 August 2022
(This article belongs to the Special Issue Selected Papers of the European Lidar Conference)

Abstract

:
In January 2016, a measurement campaign was carried out by the China Meteorological Administration, the Beijing Research Institute of Telemetry, and the Physics Department of the University of Naples “Federico II” in the Yulong Naxi Autonomous County (China) at 3200 m above sea level to evaluate the air quality in the high mountains with the lidar technique. Here we report on an interesting event that occurred on 16 January between 12.00 and 00.00 UTC, when a striking aerosol stratification was observed on the site. Aerosol transport events are studied starting from lidar characterization of different aerosol masses. From lidar signals at 355 and 532 nm, integrated on 30 min, the aerosol characterization is done in terms of aerosol depolarization ratio with a spatial resolution of 60 m and color ratio; these parameters allow for highlighting a phenomenon of aerosol transport from the Tibetan plateau planetary boundary layer and from northern India. The initial layer is composed of a mixture of aerosols characterized by average values of the aerosol depolarization ratio and the color ratio of (30 ± 2)% and (0.9 ± 0.2), respectively, indicating a large non-spherical aerosol composition. Then, the deposition of this aerosol load ensues, and aerosols with such features are progressively observed at lower altitudes.

1. Introduction

Atmospheric aerosol particles play an important role in many atmospheric processes impacting air quality, human activity, and life [1,2]. The presence of atmospheric aerosols can produce a direct alteration of Earth’s radiation balance, scattering and absorbing particles for the incident sunlight rays; moreover, aerosols also produce an indirect effect, modifying the radiative and microphysical properties of clouds, depending on their amount and properties. For these reasons, the characterization of spatial and temporal variation of aerosol properties is critical for quantifying their impact on climate and air quality and for reducing uncertainties in the knowledge of atmospheric processes and the radiation balance of Earth.
Most atmospheric aerosols are confined within the planetary boundary layer (PBL) [3]. Nevertheless, aerosol masses can also reach higher altitudes, in the troposphere and even the stratosphere [4,5,6], as a consequence of convective motions or extraordinary aerosol input events, such as volcanic eruptions, dust outbreaks, wildfires, and so forth. The limited aerosol deposition occurring in these atmospheric layers, especially in the stratosphere, leads to a long residence time of the aerosol particles. Therefore, both tropospheric and stratospheric aerosols can be characterized by more defined features and provide a significant contribution to long and medium-range transport phenomena [7].
High-altitude mountain observation provides an excellent way to study aerosol transport. The atmospheric environment in mountain areas is substantially different from that in flatter regions due to their typical lower average temperature, more intense solar radiation, and higher relative humidity [8]. Moreover, measurements carried out at high-altitude observational sites offer the possibility of continuous and cheaper investigations compared to those involving balloons or airborne systems [9]. Thanks to characteristic atmospheric stability, aerosol observation in the high mountains can be used for various purposes, e.g., the characterization of important trace gases, such as carbon monoxide [10] and primary and secondary carbonaceous aerosols [11,12], calibration of instruments, as well as aerosol long-range transport analysis [13]. In addition, high-altitude stations not only allow characterizing the aerosol background features of specific regions but also offer the possibility to gain information on exceptional transport events, as illustrated in [14], which reports 22 months of statistics of photometric data collection at the Central Tibetan Plateau. Here, we report an interesting observation that occurred in January 2016, during a monthly campaign aiming at studying atmospheric aerosol at high altitudes. This campaign was carried out in the Chinese province of Yunnan in the frame of a scientific collaboration between the China Meteorological Administration (CMA), the Beijing Research Institute of Telemetry (BRIT), and the Physics Department of the University of Naples Federico II. A ground-based station was set up on the Yulong Naxi Autonomous County plateau, located at an altitude of ≈3200 m above sea level (ASL). Among others, the purpose of the measurement campaign was the real-time monitoring of atmospheric aerosol vertical variability and optical properties by means of remote sensing lidar (light detection and ranging) techniques. During the first week of the measurement campaign, a long aerosol transport event was observed on the evening of 16 January. Various aerosol layers persisting throughout a night of acquisition, between 20.00 and 08.00 local time (LT), corresponding to UTC + 8, were observed and will be illustrated hereafter. The lidar measurements were carried out by using a multi-wavelength lidar system, and aerosol lidar echoes at two wavelengths were registered to characterize the optical features of the aerosol transported above the measurement area. In particular, the color ratio (CR) and aerosol depolarization ratio (δa) were exploited; furthermore, atmospheric aerosol air masses back-trajectories were calculated using the Air Resources Laboratory’s HYbrid Single-Particle Lagrangian Integrated Trajectory (HYSPLIT) [15] model provided by NOAA, gaining information on the possible sources contributing to the aerosols transported at the observational site. HYSPLIT is one of the most complete models for aerosol atmospheric transport and dispersion. In the model, the pollutant air transport and concentrations are based on a hybrid approach between the Lagrangian and the Eulerian methodology [16,17].

2. Materials and Methods

2.1. Data Campaign and Site Description

The measurement campaign took place from 15 to 30 January 2016 at the CMA radio-sounding station (26°43′40.3″N 100°02′34.7″E) located at ≈3200 m ASL in the mountains of Yulong Naxi Autonomous County in the state of Yunnan, in western China (see Figure 1). The county is located at an average height of 4000 m and presents mountains and plateaus. It extends in the southwest of the Yunnan province at an aerial distance of about 140 km from the borders with Myanmar and acts as a preamble to the Tibetan Plateau. The observational site is located at the end of the main natural geographical corridor created by the presence of the Himalayan chain to the north, and the highlands of the northern regions of India, to the south. This corridor represents one of the main entrances for the introduction of atmospheric aerosols in the internal regions of China. Aerosols originating beyond the Pacific Ocean and transported for more than one complete tour around the world can reach this region through long-range transport phenomena, as indicated by aerosol satellite observations [18]. Given its strategic position, the site provides an excellent location for monitoring long-travel aerosol masses in the free troposphere. Most of the days of the measurement campaign were dominated by dense clouds and snow, which degraded the lidar signal. Interestingly in the early days of measurement, from the evening of 16 January, aerosol stratification was observed in the atmosphere at lower altitudes which persisted throughout the night and over the following days. Hereafter, we will illustrate and characterize the aerosol evolution occurring between 12.00 and 00.00 UTC on 16 January.

2.2. Experimental Setup

The characterization of the atmospheric aerosol particles was obtained through vertical lidar measurements carried out using the AMPLE (Aerosol Multiwavelength Polarization Lidar Experiment) system. This lidar was designed and developed by the China-Italy Laser Remote Sensing Joint Research Center within a cooperation agreement between CNISM (National Inter-university Consortium for the Physical Sciences of Matter (Rome, Italy)) and BRIT (Beijing Research Institute for Telemetry (Beijing, China)).
AMPLE is a mobile and multi-wavelength lidar system with scanning capabilities. At the observational site, the temperature varied from −15 °C to +25 °C (night/day); hence the AMPLE system was located in a thermal stabilizer allowing only vertical measurements. The AMPLE transmitter is based on a high repetition rate (1 kHz) laser source that allows the measurements of thick aerosol layers [19,20]. The lidar is based on a diode-pumped Nd:YAG laser doubled and tripled in frequency with an average optical power of 1 W, 1.5 W, and 0.6 W at 1064 nm, 532 nm, and 355 nm, respectively. The receiver system is based on a Cassegrain telescope in Dall–Kirkham configuration, with an elliptical primary mirror (Ø 250 mm) and a spherical secondary one, with a total focal length of 1125 mm. A detailed description of the lidar system was reported earlier [19,21,22]. Briefly, the optical parameters of the atmospheric aerosols were characterized by registering elastic lidar returns at 532 nm and 355 nm; in particular, we retrieved the backscattering profiles at 532 nm and 355 nm and the depolarization ratio at 532 nm. Data were collected with raw spatial and temporal resolutions of 15 m and 60 s, respectively. To improve the signal-to-noise ratio, the data were integrated over 30 min. Hence, the final optical products have typical spatial and temporal resolutions of 60 m and 30 min, respectively.
The backscattering coefficients, β, were retrieved using the Klett–Fernald [23,24] algorithm considering typical lidar ratios of 50 sr [25,26] and 100 sr for coarse and fine particles [27,28], respectively, related to the main Tibetan Plateau aerosols and to the black carbon-based aerosols as determined from the air masses back trajectories studies. A Monte Carlo method was used to evaluate the errors on backscattering coefficients as treated in [29]. Typical uncertainties in the backscattering coefficient final values are of the order of 20–40% at 2.7 km altitude. The β profiles were used for the estimation of the CR, expressed by:
CR = log β 355 / β 532 log 532 / 355
Mean values of the CR were calculated in the various intervals identified by two subsequent local minima in the Range Corrected Signal (RCS) profiles (not shown) that contained the structure. Then, it was used to study the dependence of β with the wavelength and to gain information on the dimension of the prevalent aerosol type [30,31].
Vertical profiles of the aerosol depolarization ratio δa obtained by the inversion of the polarized backscattered light component at 532 nm [32] were also used to distinguish spherical/non-spherical particles in the sounded atmosphere. Uncertainty of the measured parameter, based on the error propagation procedure already described in [33], resulted in the order of 13–49% at 2.7 km of altitude.

3. Results

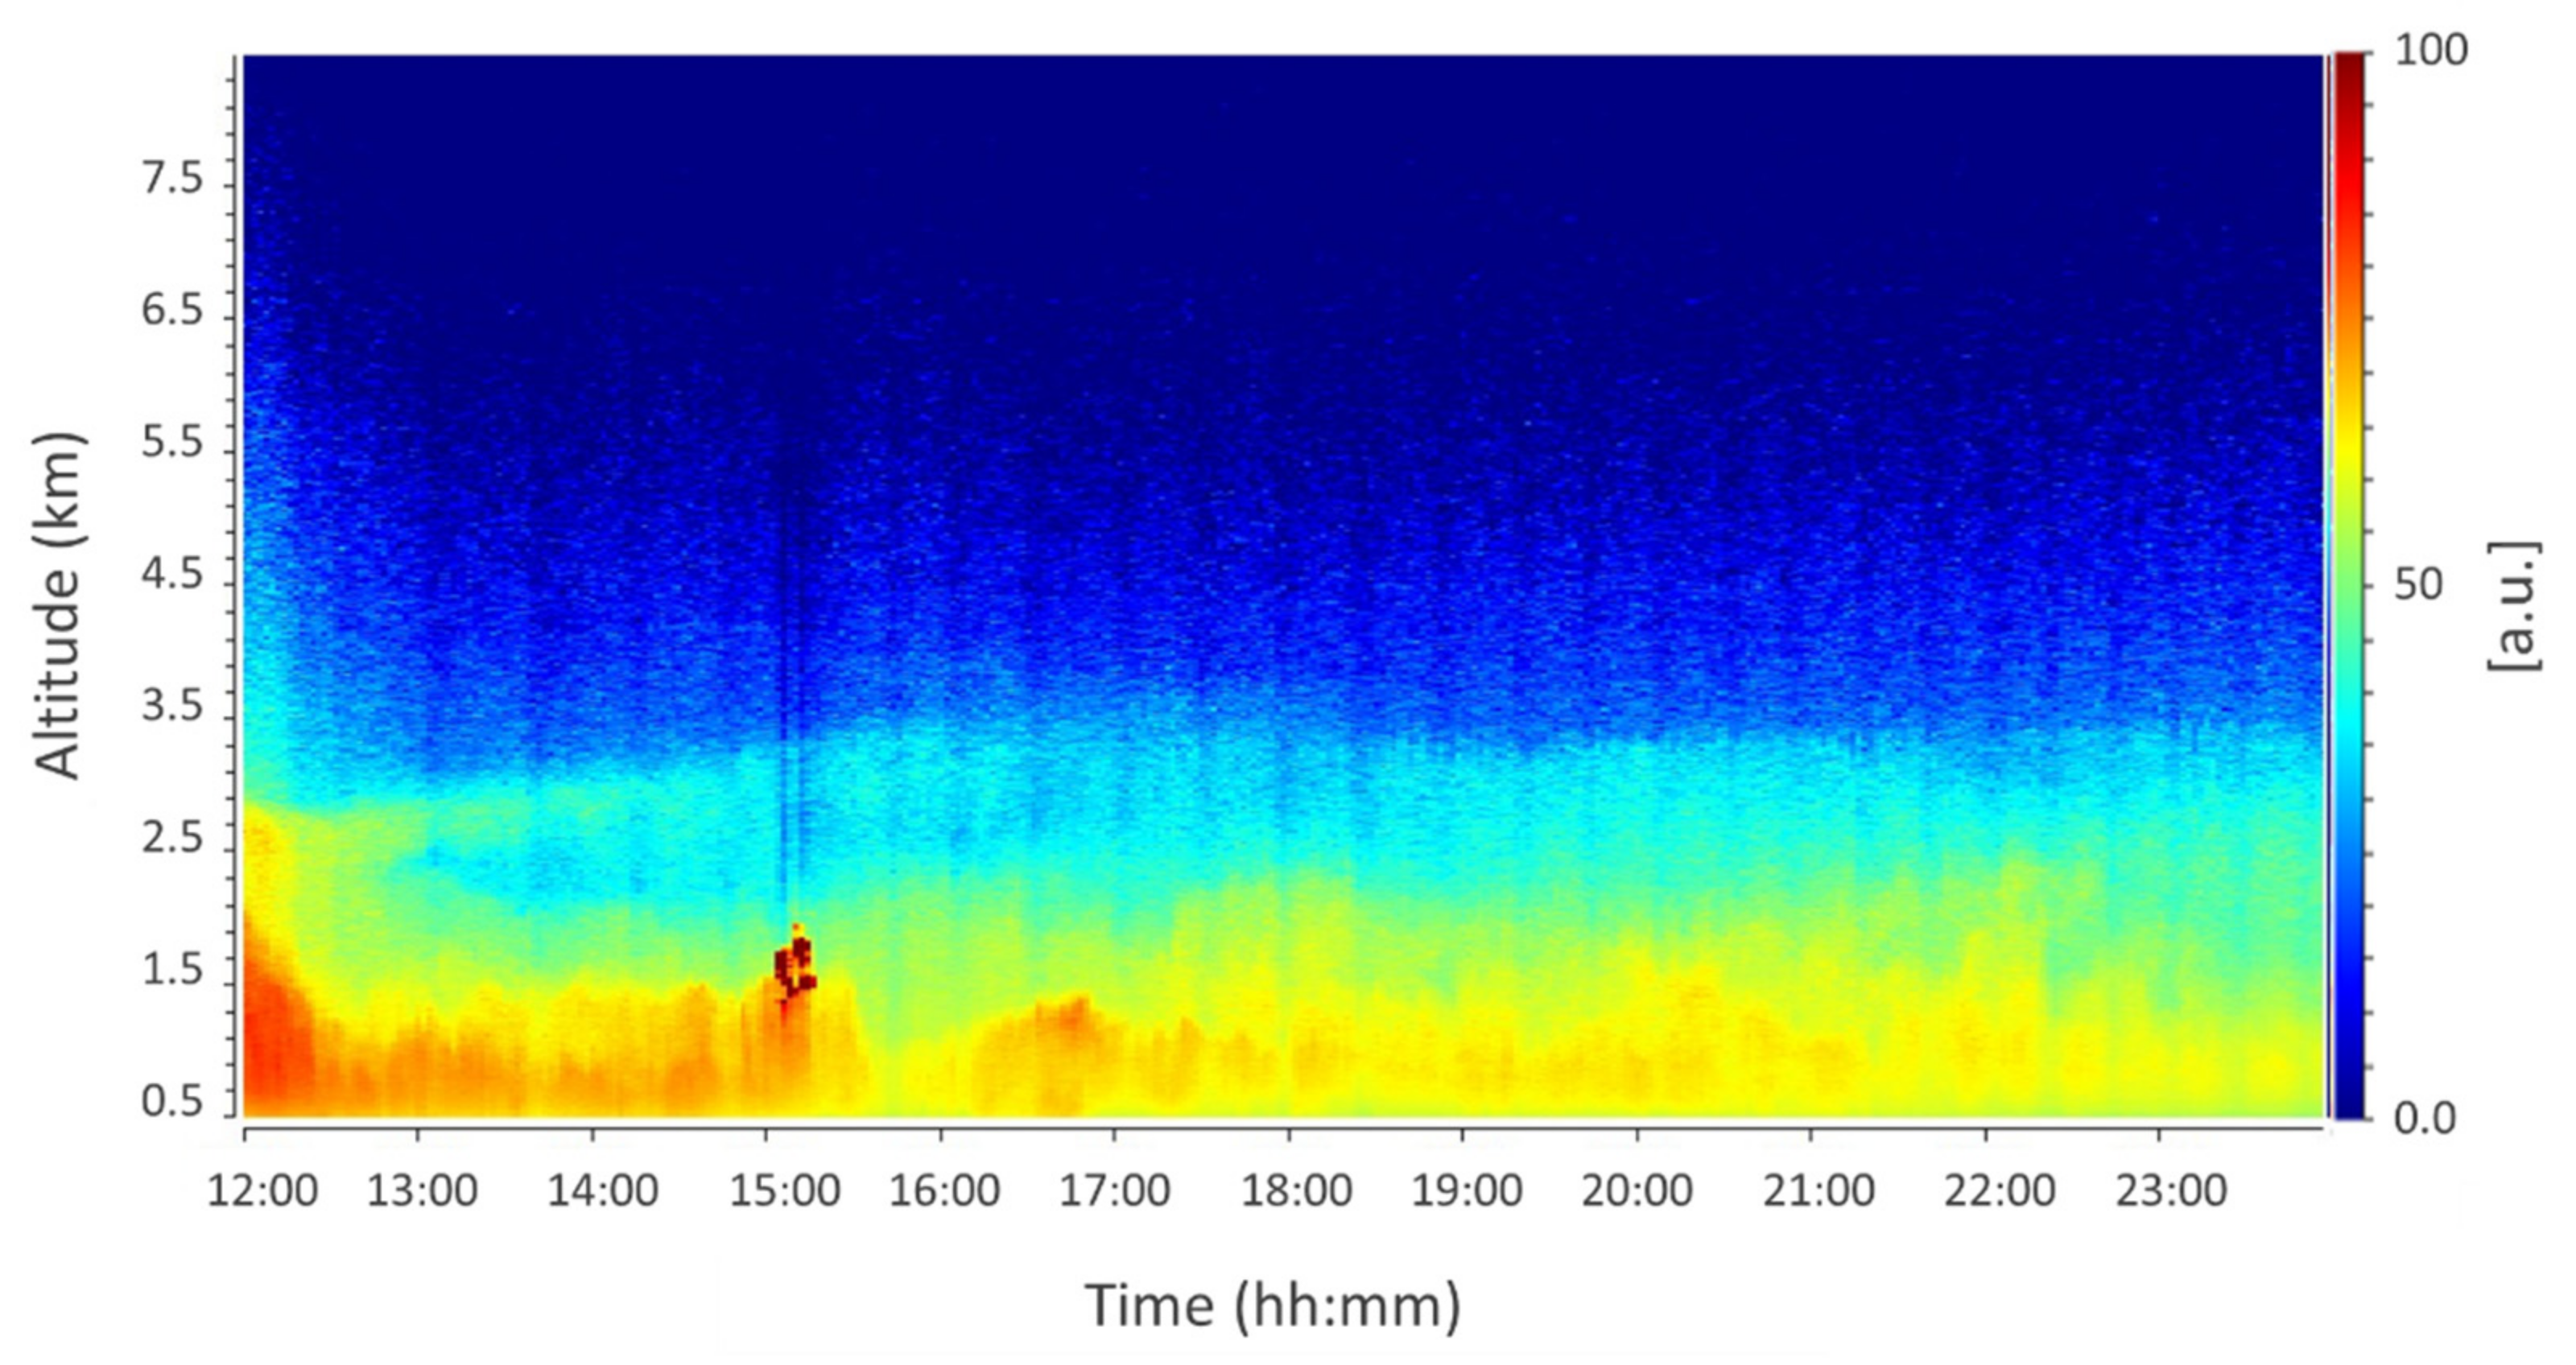
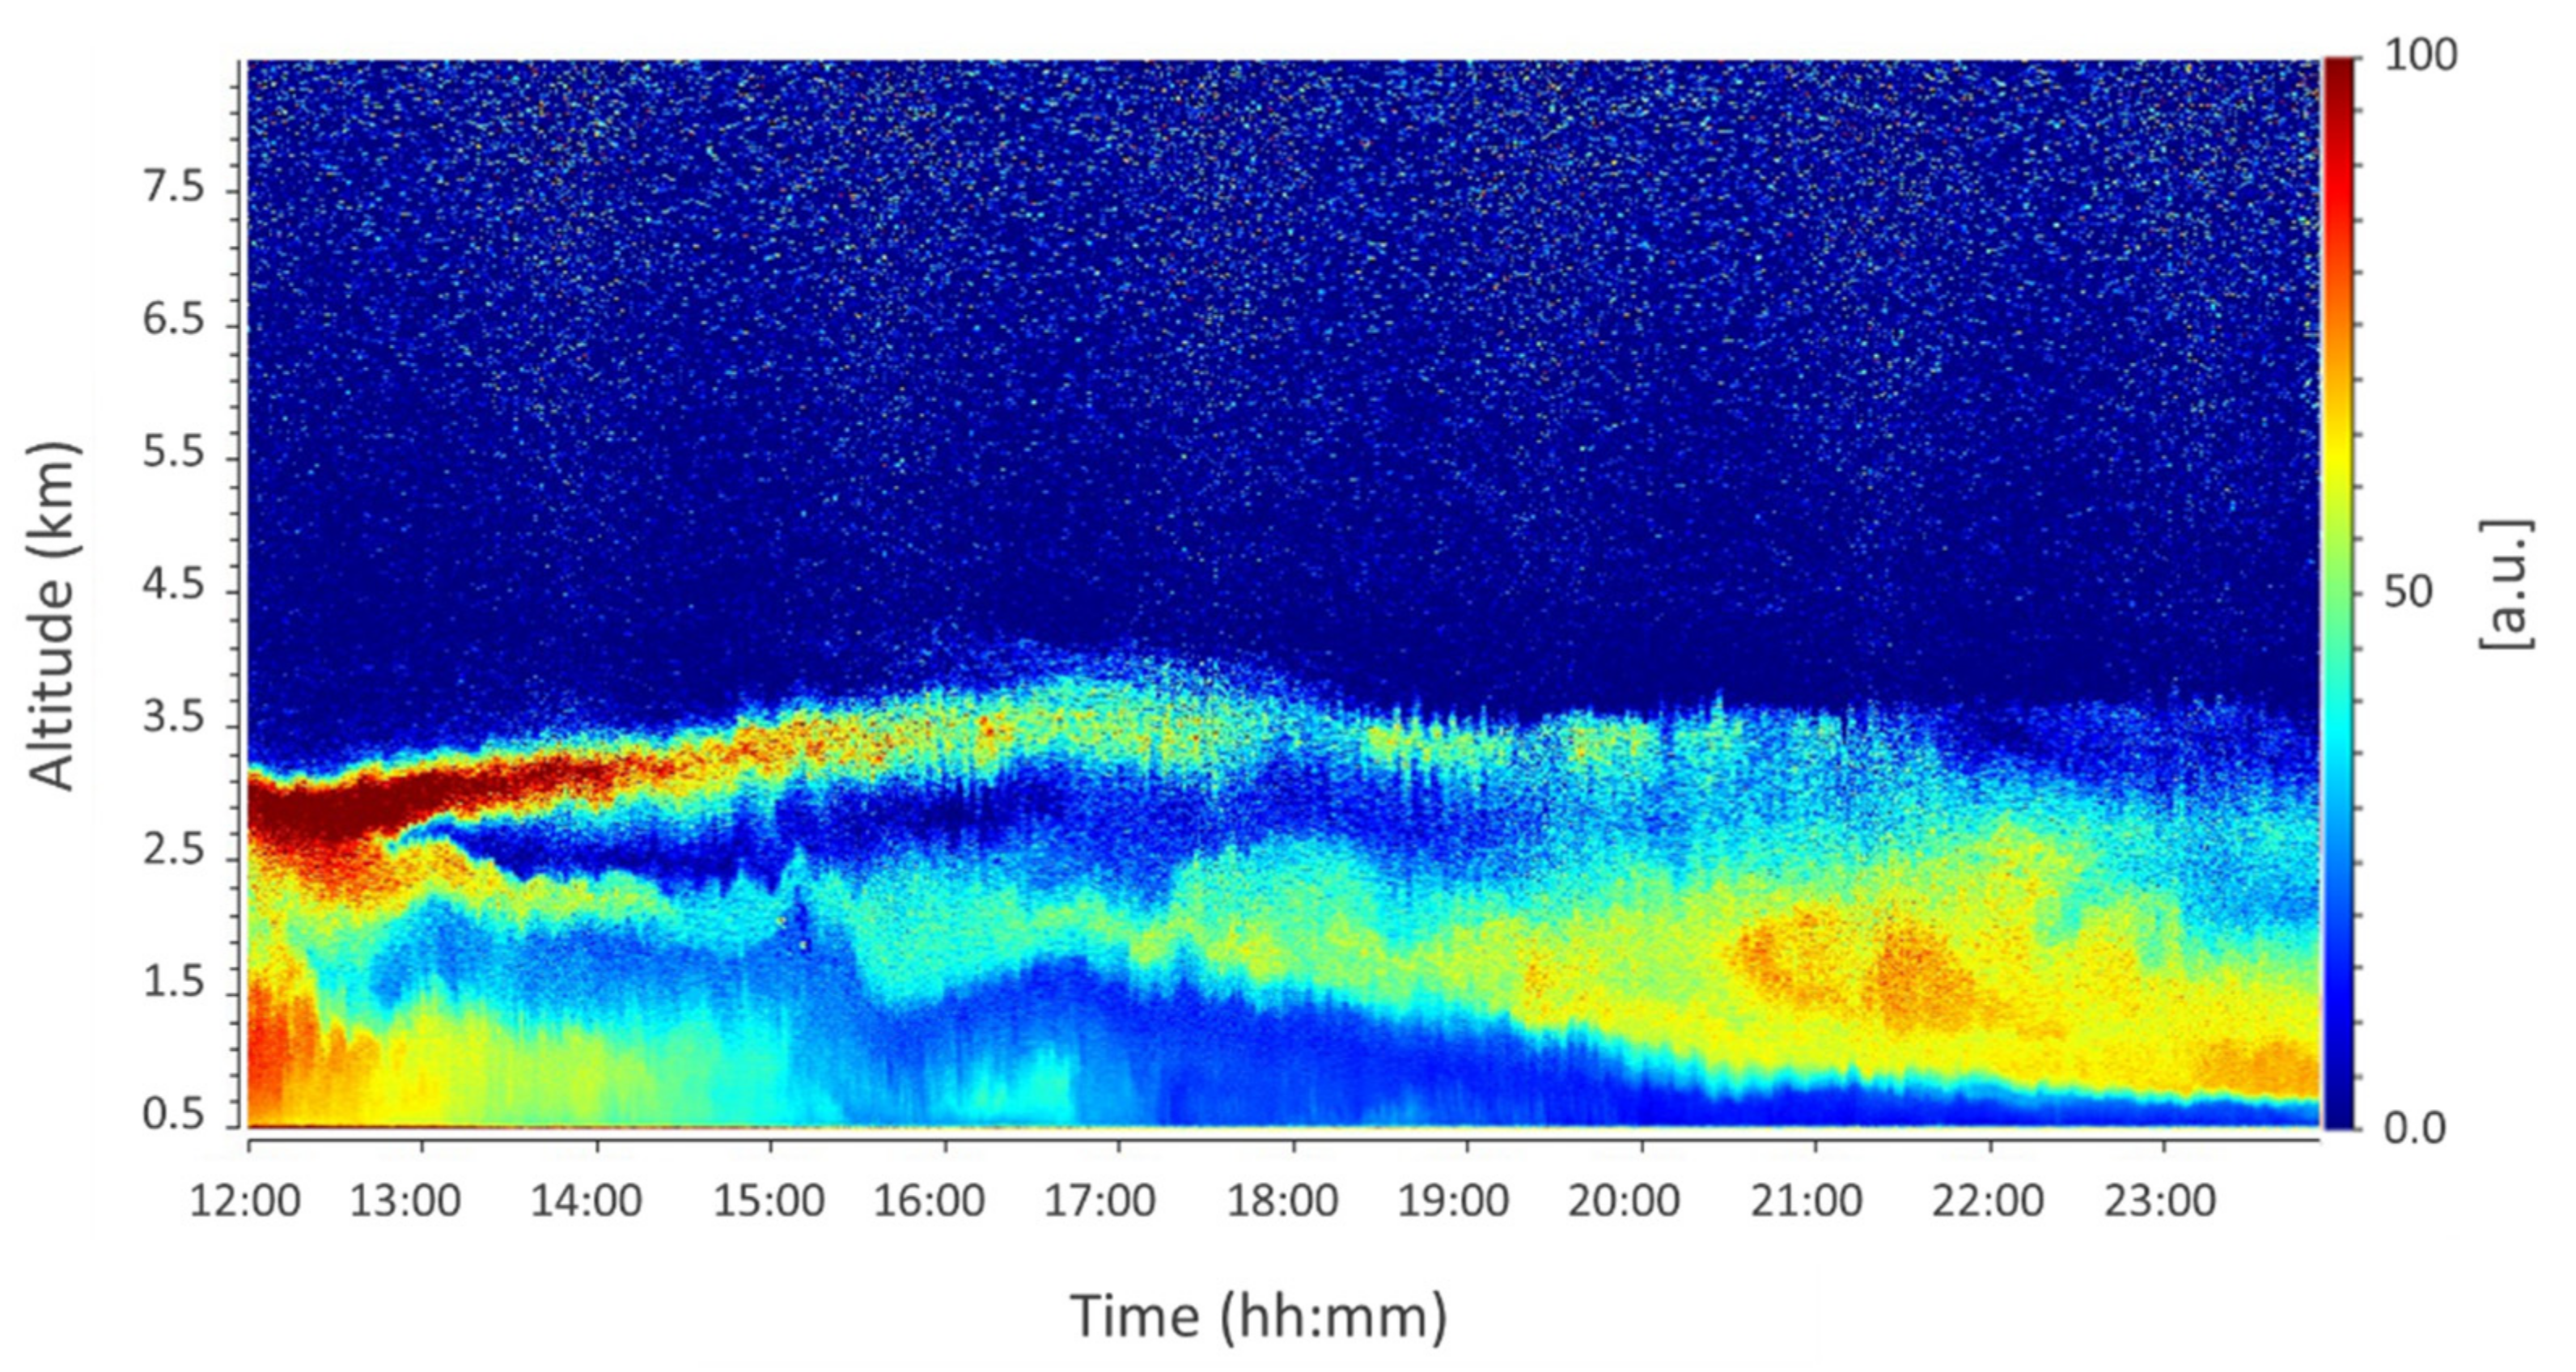
Figure 2 reports a color map of the temporal series of the lidar RCS at 532 nm registered on the evening of 16 January between 12.00 and 00.00 UTC. The signal shows a clear aerosol stratification up to 4000 m AGL. The different aerosol layers are more clearly distinguished in Figure 3, which is a map illustrating the time variability of the aerosol depolarization ratio. From 12.00 to 13.00 UTC, a dense layer extends up to ≈2000 m AGL. In the following hours, from 13.00 to 17.00 UTC, the maps of Figure 2 and Figure 3 highlight various layers at different altitudes that evolve as a function of time.
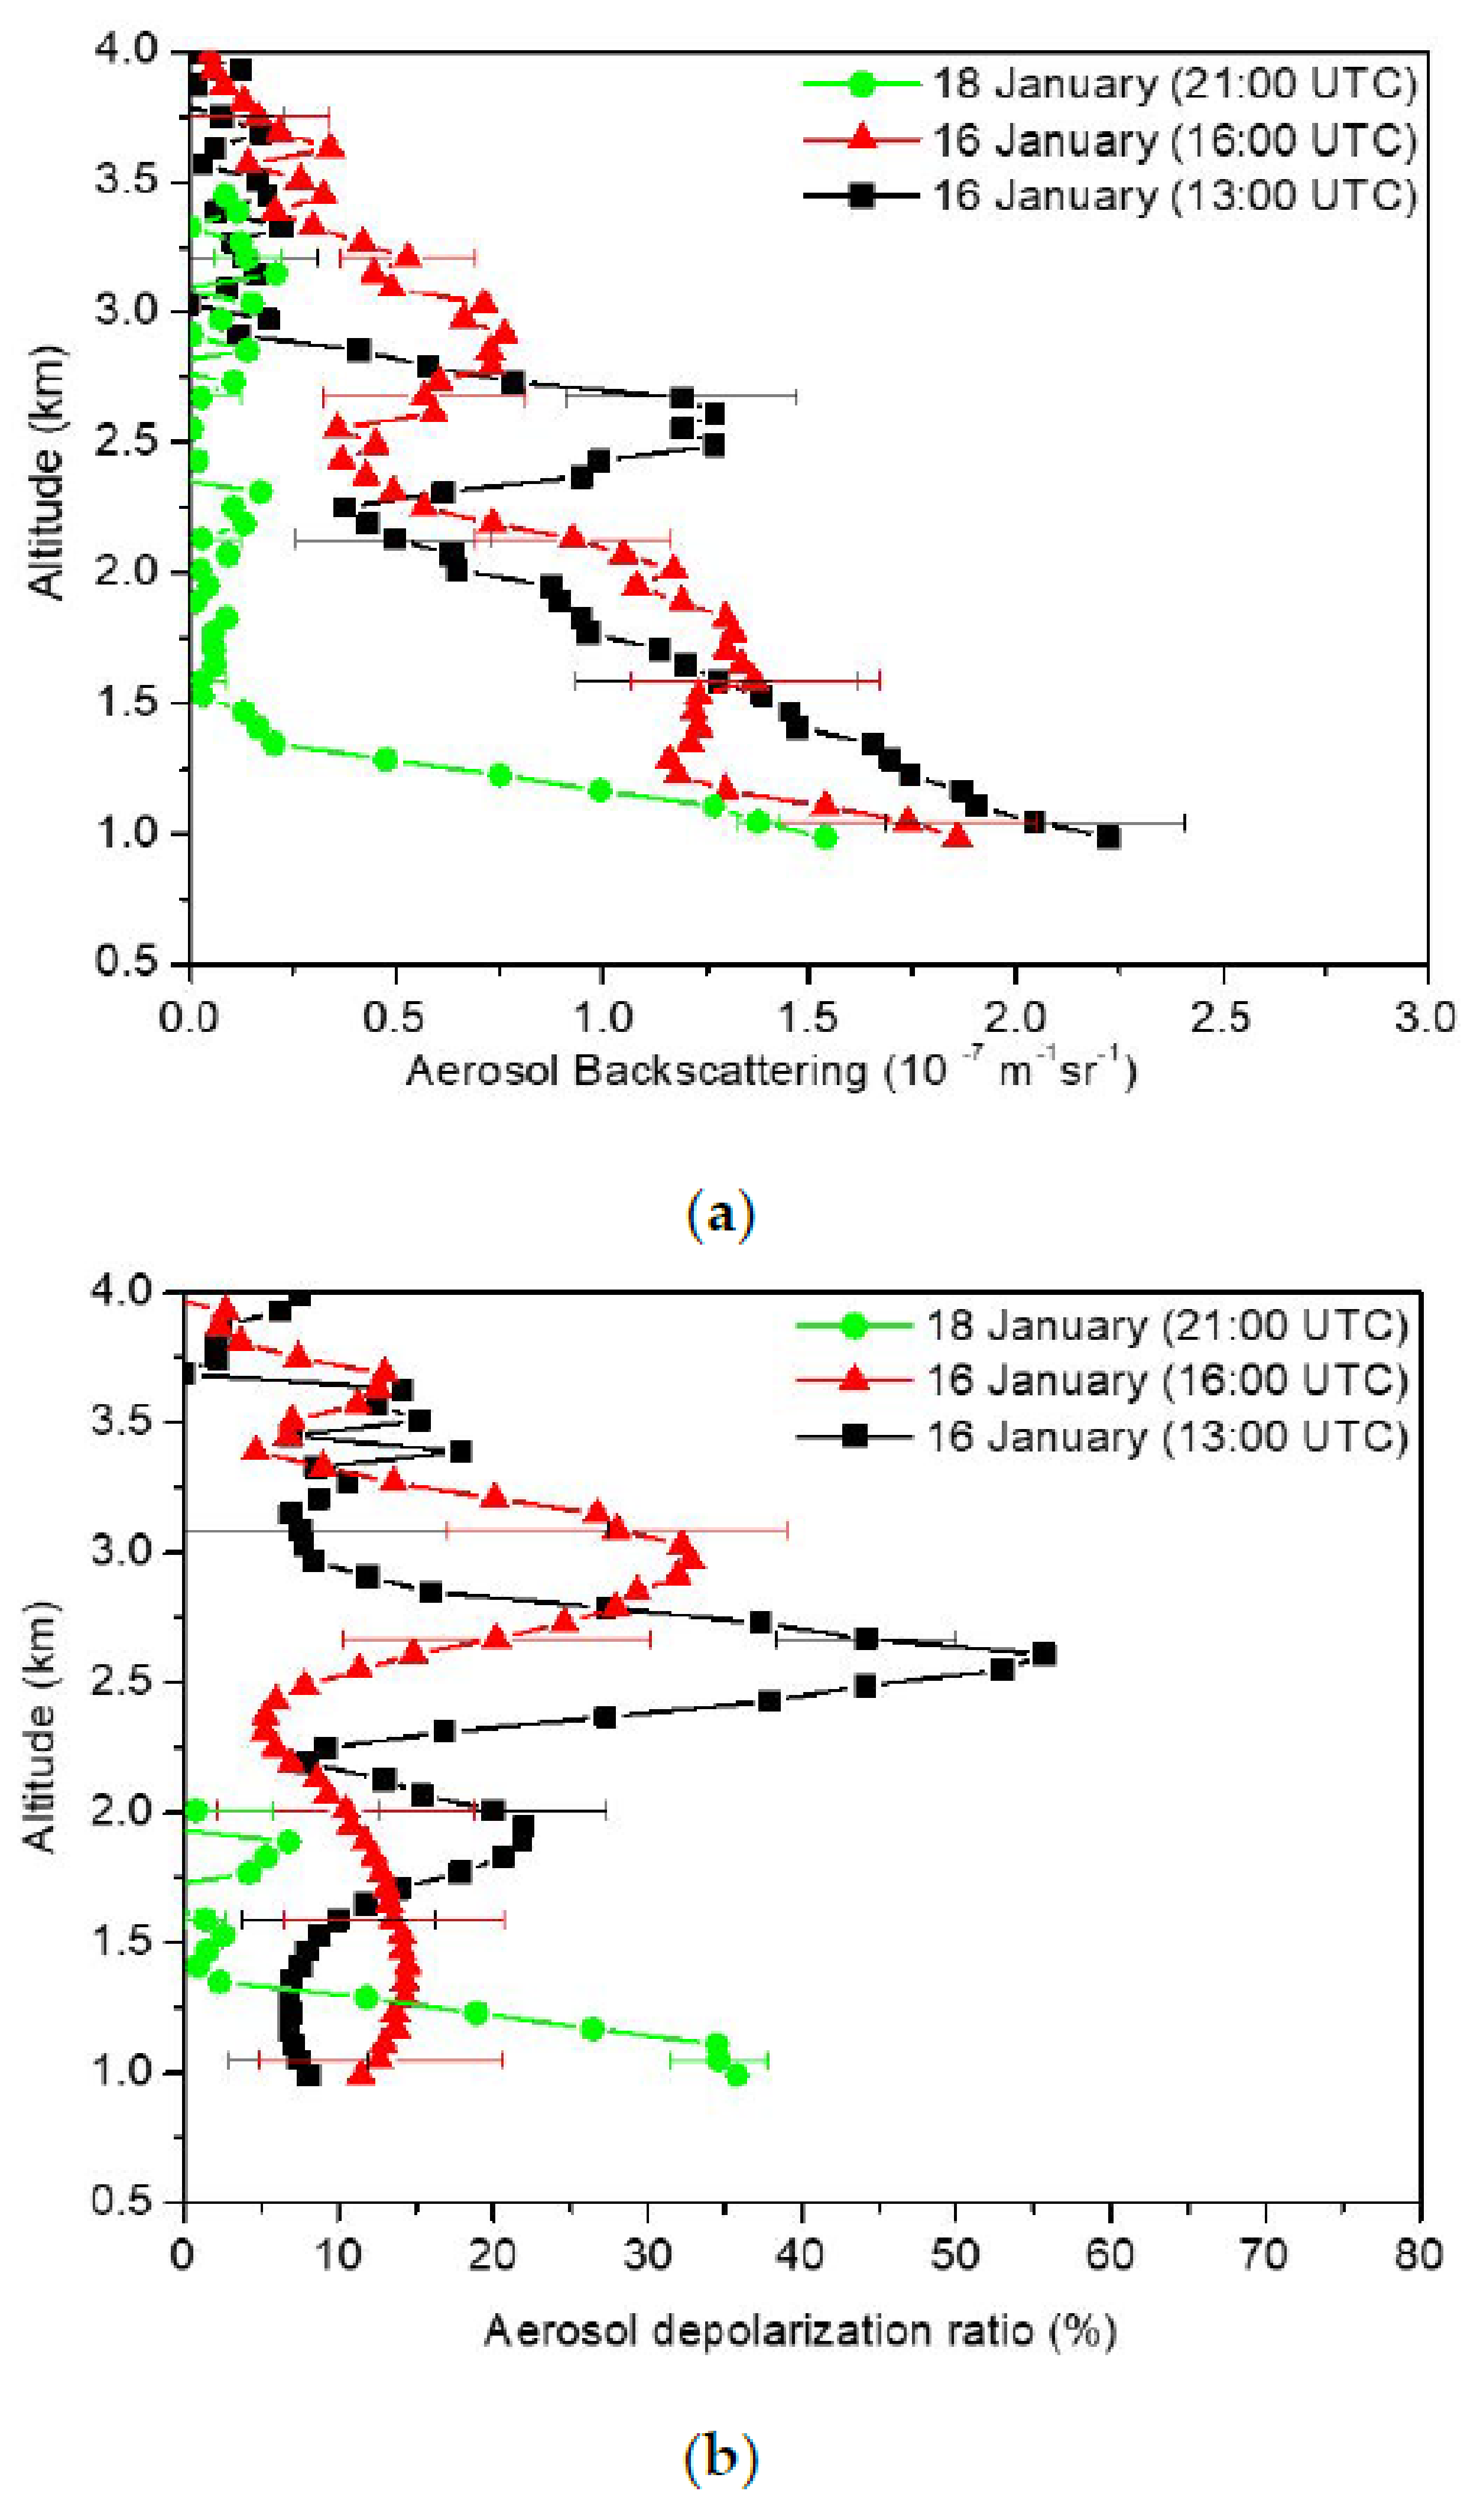
In an attempt to gain more information on the aerosol forming the various layers, we resort to the spatial profiles of β and δa at two exemplificative times, namely 13.00 and 16.00. These profiles are displayed in Figure 4. For the sake of comparison, profiles of β and δa registered at the end of the aerosol transport event, when a gradual return to background conditions of the observational site takes place, namely on the evening of 18 January at 21.00, are reported.
We illustrate first the profiles registered at 13.00 UTC. The lidar RCS shows three stratifications, not completely spatially resolved. From the backscattering and aerosol depolarization ratio profiles in Figure 4 (black squares), it is possible to identify three clear stratifications with backscattering maximum values located at ≈1000 m, ≈1900 m, and ≈2500 m AGL, respectively. As for the situation observed at 16.00 UTC, 2 main layers peaking at ≈2900 m and ≈1500 m are observed in the backscattering (a) and aerosol depolarization ratio (b) profiles in Figure 4 (red triangles). Moreover, a third tiny aerosol layer can be recognized at a higher altitude of ≈3800 m.
The characteristic mean values of δa and CR for the aerosol layers discussed above are summarized in Table 1. The smaller CR values registered at 13.00 UTC suggest the presence of relatively large particles in all the layers. The corresponding average values of δa are (8 ± 5)%, (14 ± 2)%, and (30 ± 2)%, respectively. These values point to a prevalence of non-spherical aerosol particles, especially in the upper layer. At 16.00 UTC, the average depolarization ratio values of (19 ± 3)% and (12 ± 2)% reported in Table 1 for the higher and lower layers, respectively, are suggestive of a less spherical particulate matter for the layer located at higher altitude.

4. Discussion

In order to identify the possible sources of the aerosols observed, air masses back trajectories were calculated for each of the time intervals, at the average heights of the aerosol layers, over a time period of 240 h prior to their arrival at the measurement site.
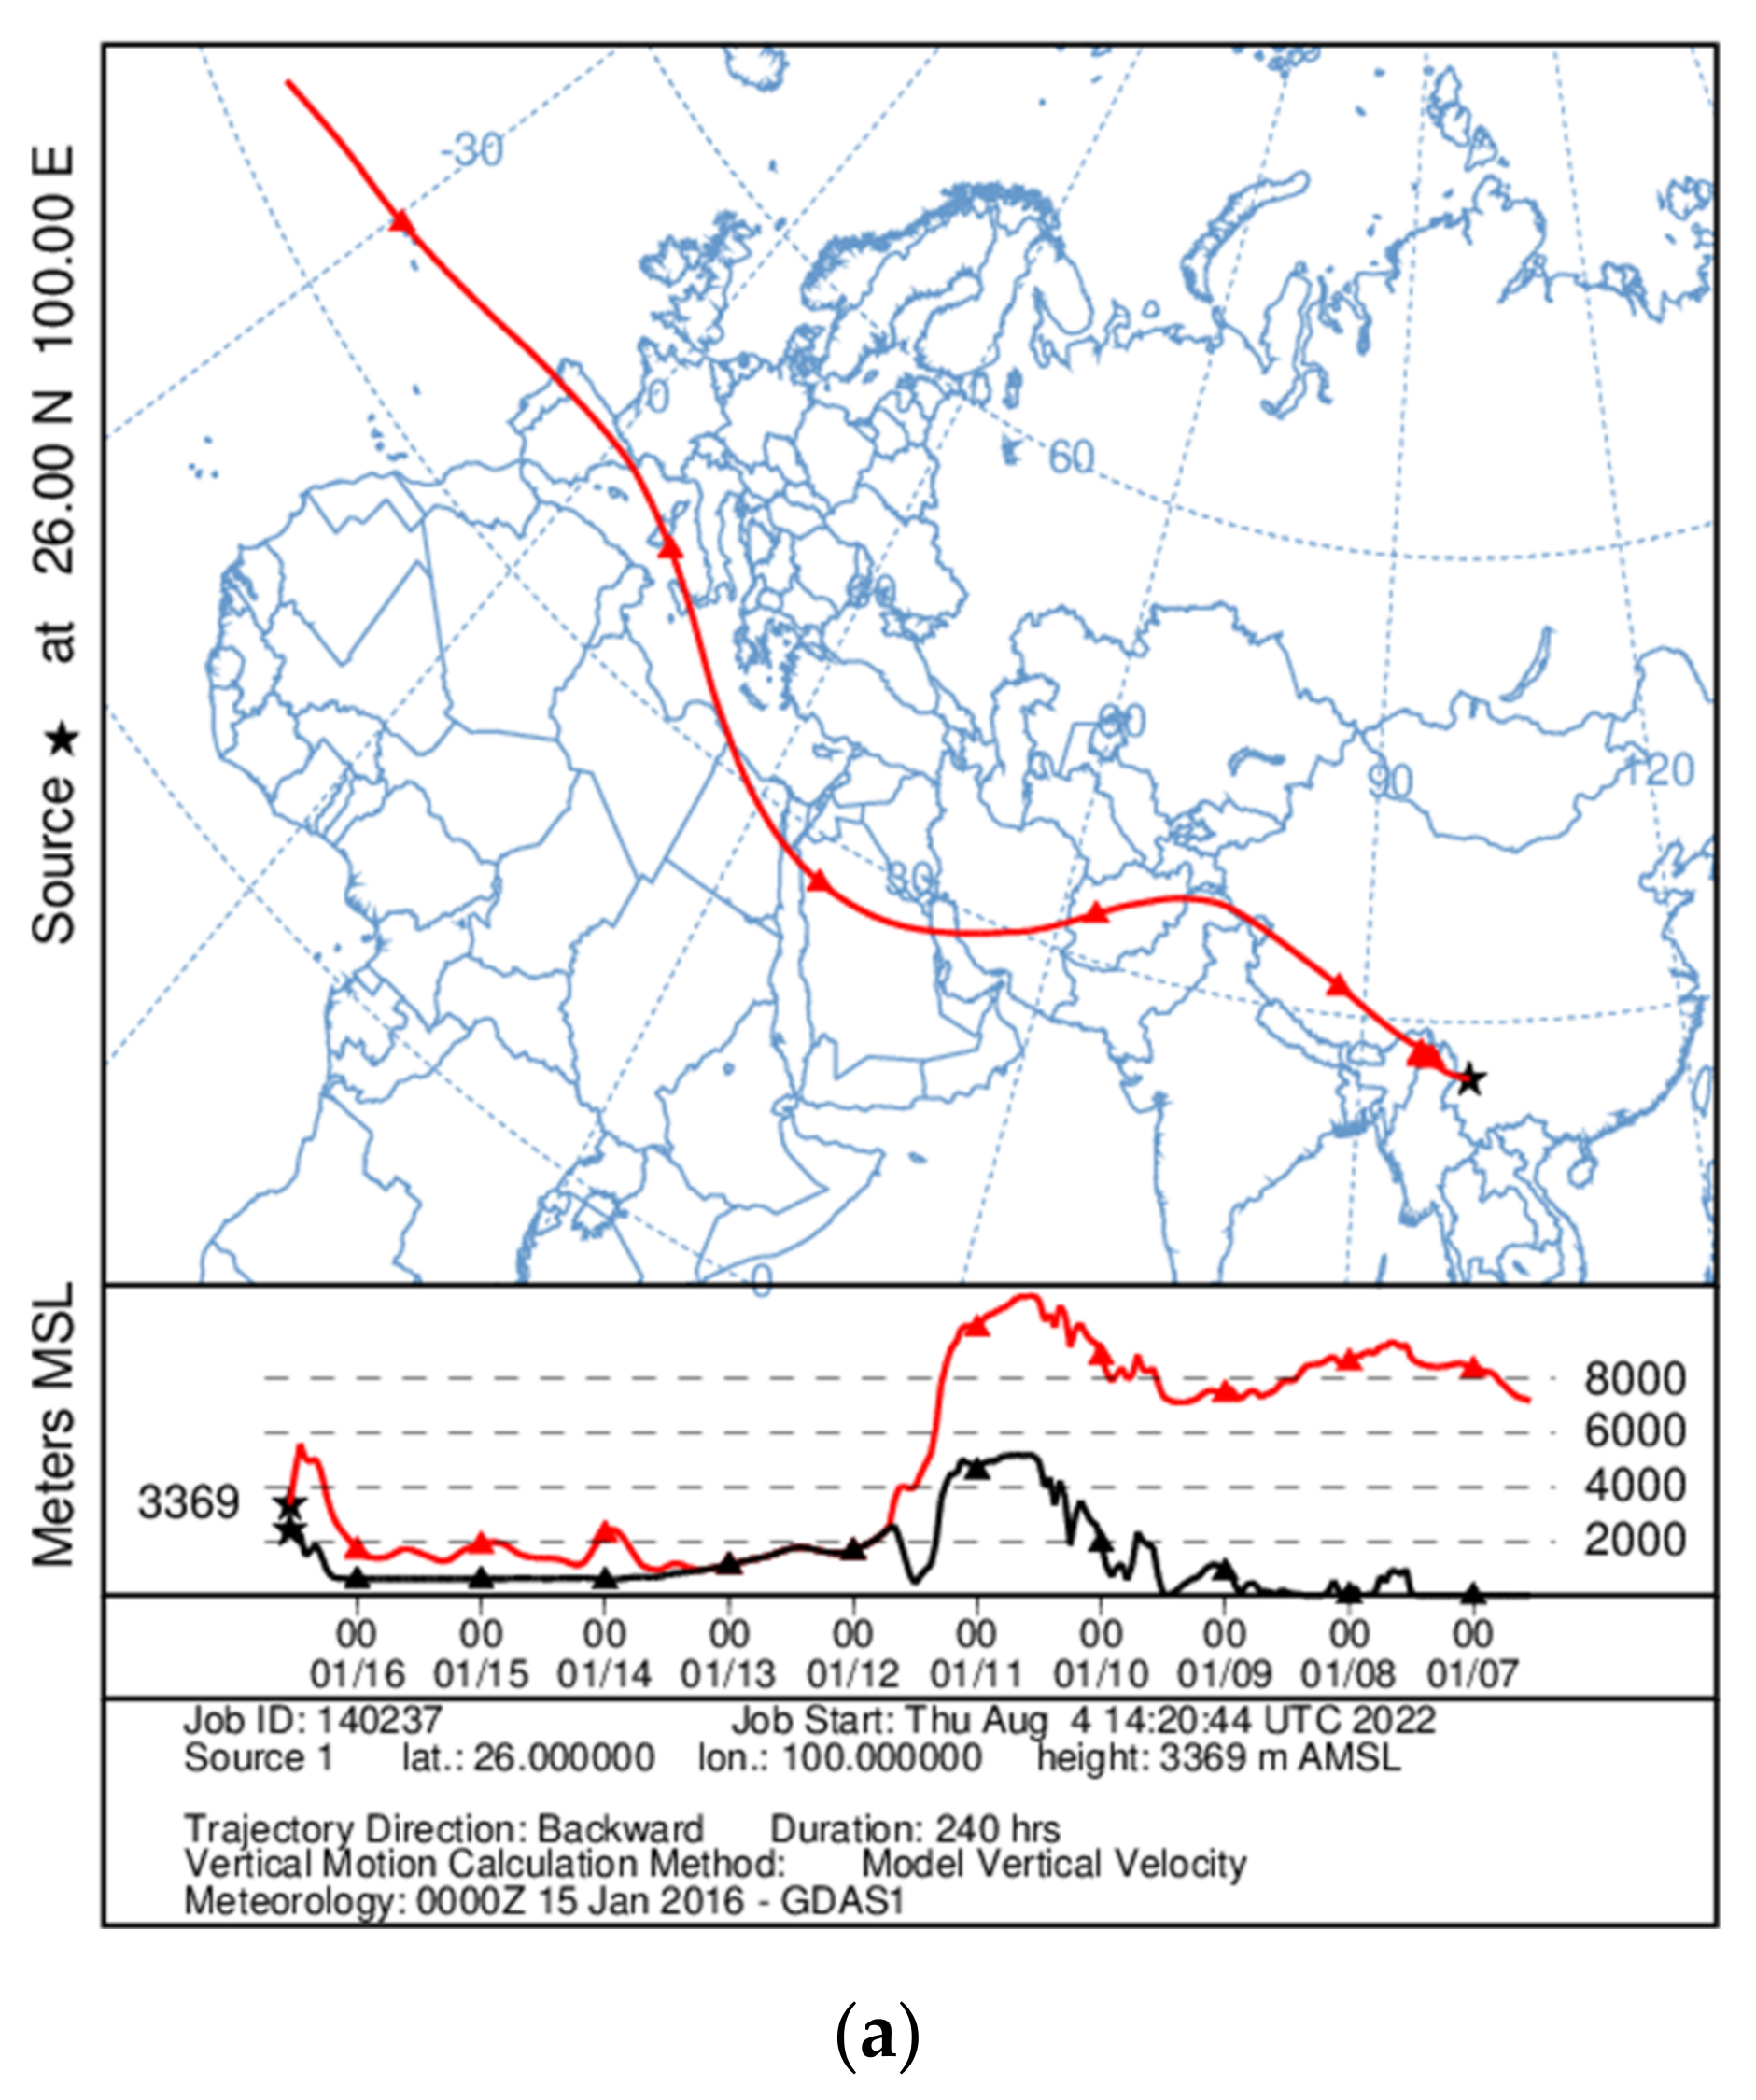
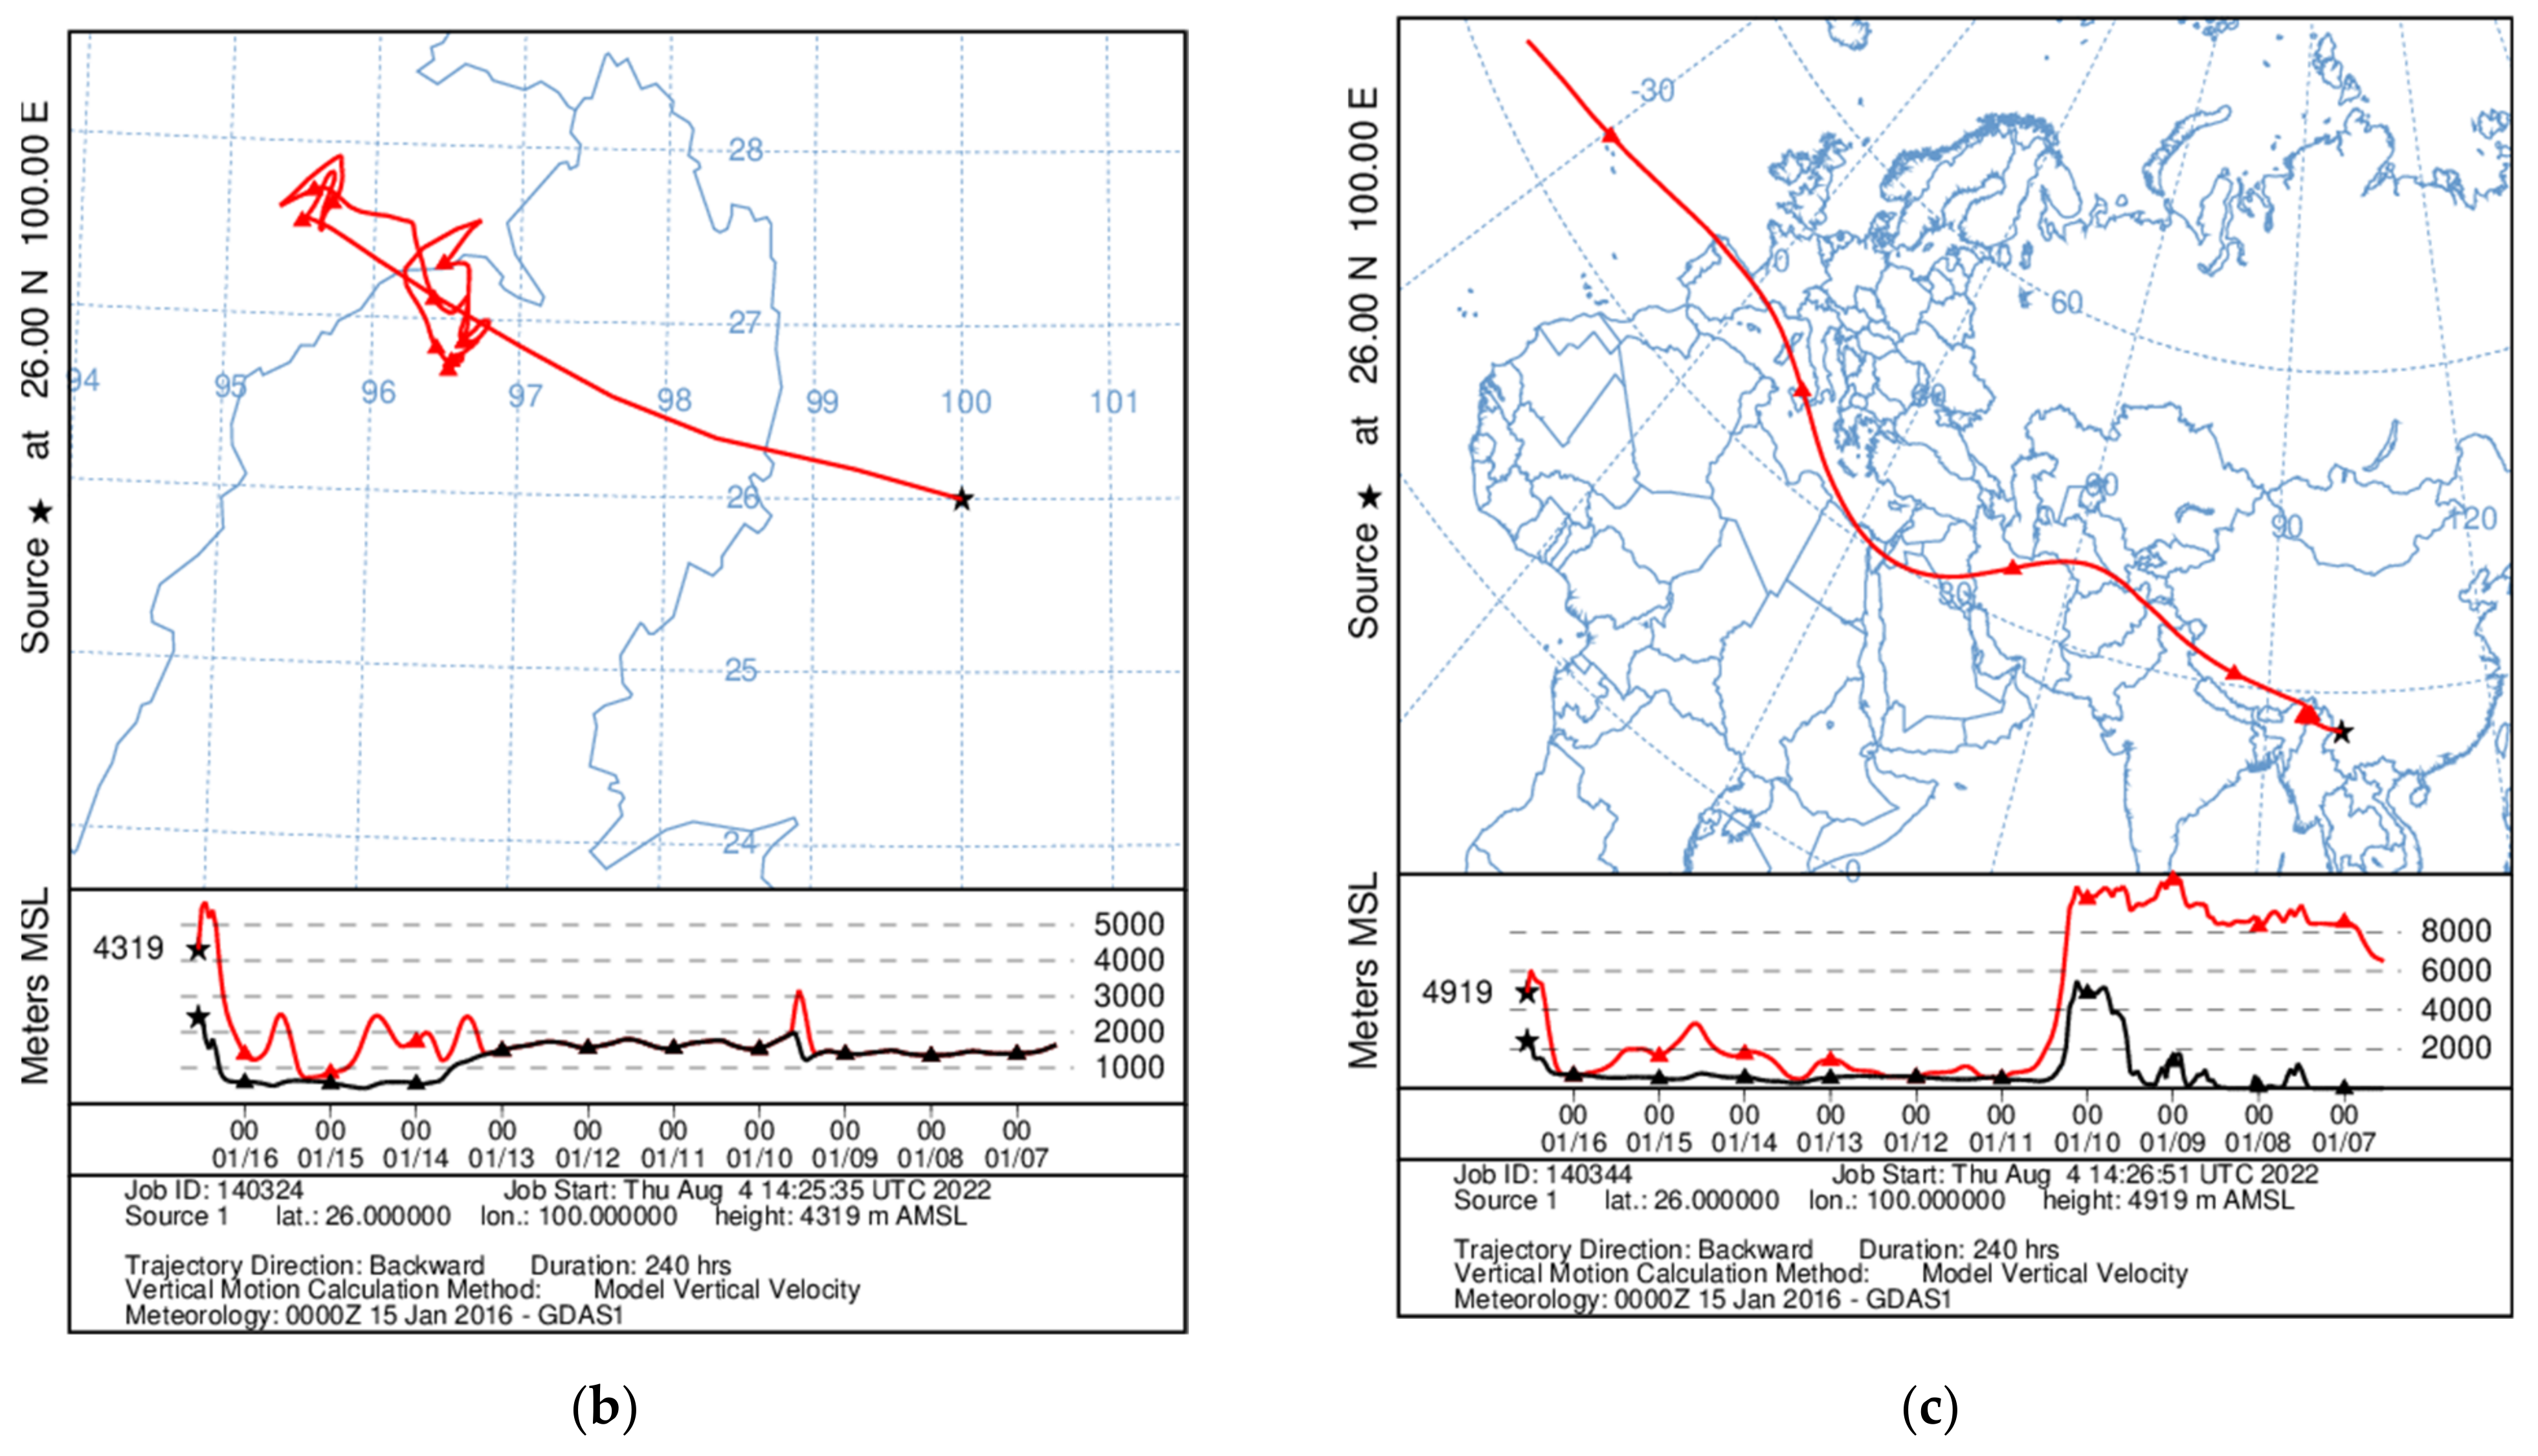
As regards the event at 13.00 UTC at ≈1000 m, ≈1900 m, and ≈2500 m AGL, the results are reported in Figure 5.
As for the back trajectories reaching 1900 m AGL, displayed in panel b of Figure 5, one can observe that the aerosol layer comes from the ground level (black line) of the border areas between Myanmar and the regions of Assam and Nagaland in northern India. These regions are renowned for being among the most polluted areas in the world and are characterized by poor air quality [34,35], mainly caused by high rates of black carbon (BC).
Instead, the back trajectory shown in Figure 5c suggests that the aerosol layer located at ≈2500 m AGL has a different provenance. At the beginning of its temporal evolution, it originates at a rather high altitude. Then, it overpasses the Tibetan Plateau (TP) at the height of about 3000 m from the ground, entering the planetary boundary layer (PBL). In fact, many studies dedicated to the uniqueness of the TP PBL height and more recent reports show even more clearly how, during the winter season, the PBL is much deeper than expected and extends for more than 5000 m AGL (9400 m ASL) [36], therefore, well above the altitude of the trajectory passage. The passage inside the PBL of the TP involves a probable additional transport of its typical aerosol, such as ice, organic carbon [37], as well as dust from the close Taklimakan desert [38]. Successively, the air mass progressively lowers towards the ground level, passing in the same areas crossed by the other layer located at 1900 m AGL, before arriving at the observation site. A similar back trajectory characterizes the lower layer located at ≈1000 m (see Figure 5a).
Therefore, one should expect that the types of aerosols observed in the three layers at 13.00 UTC are characterized by a broad size spectrum, going from a few hundred nm of the BC [39] to several hundred μm of desert dust [40].
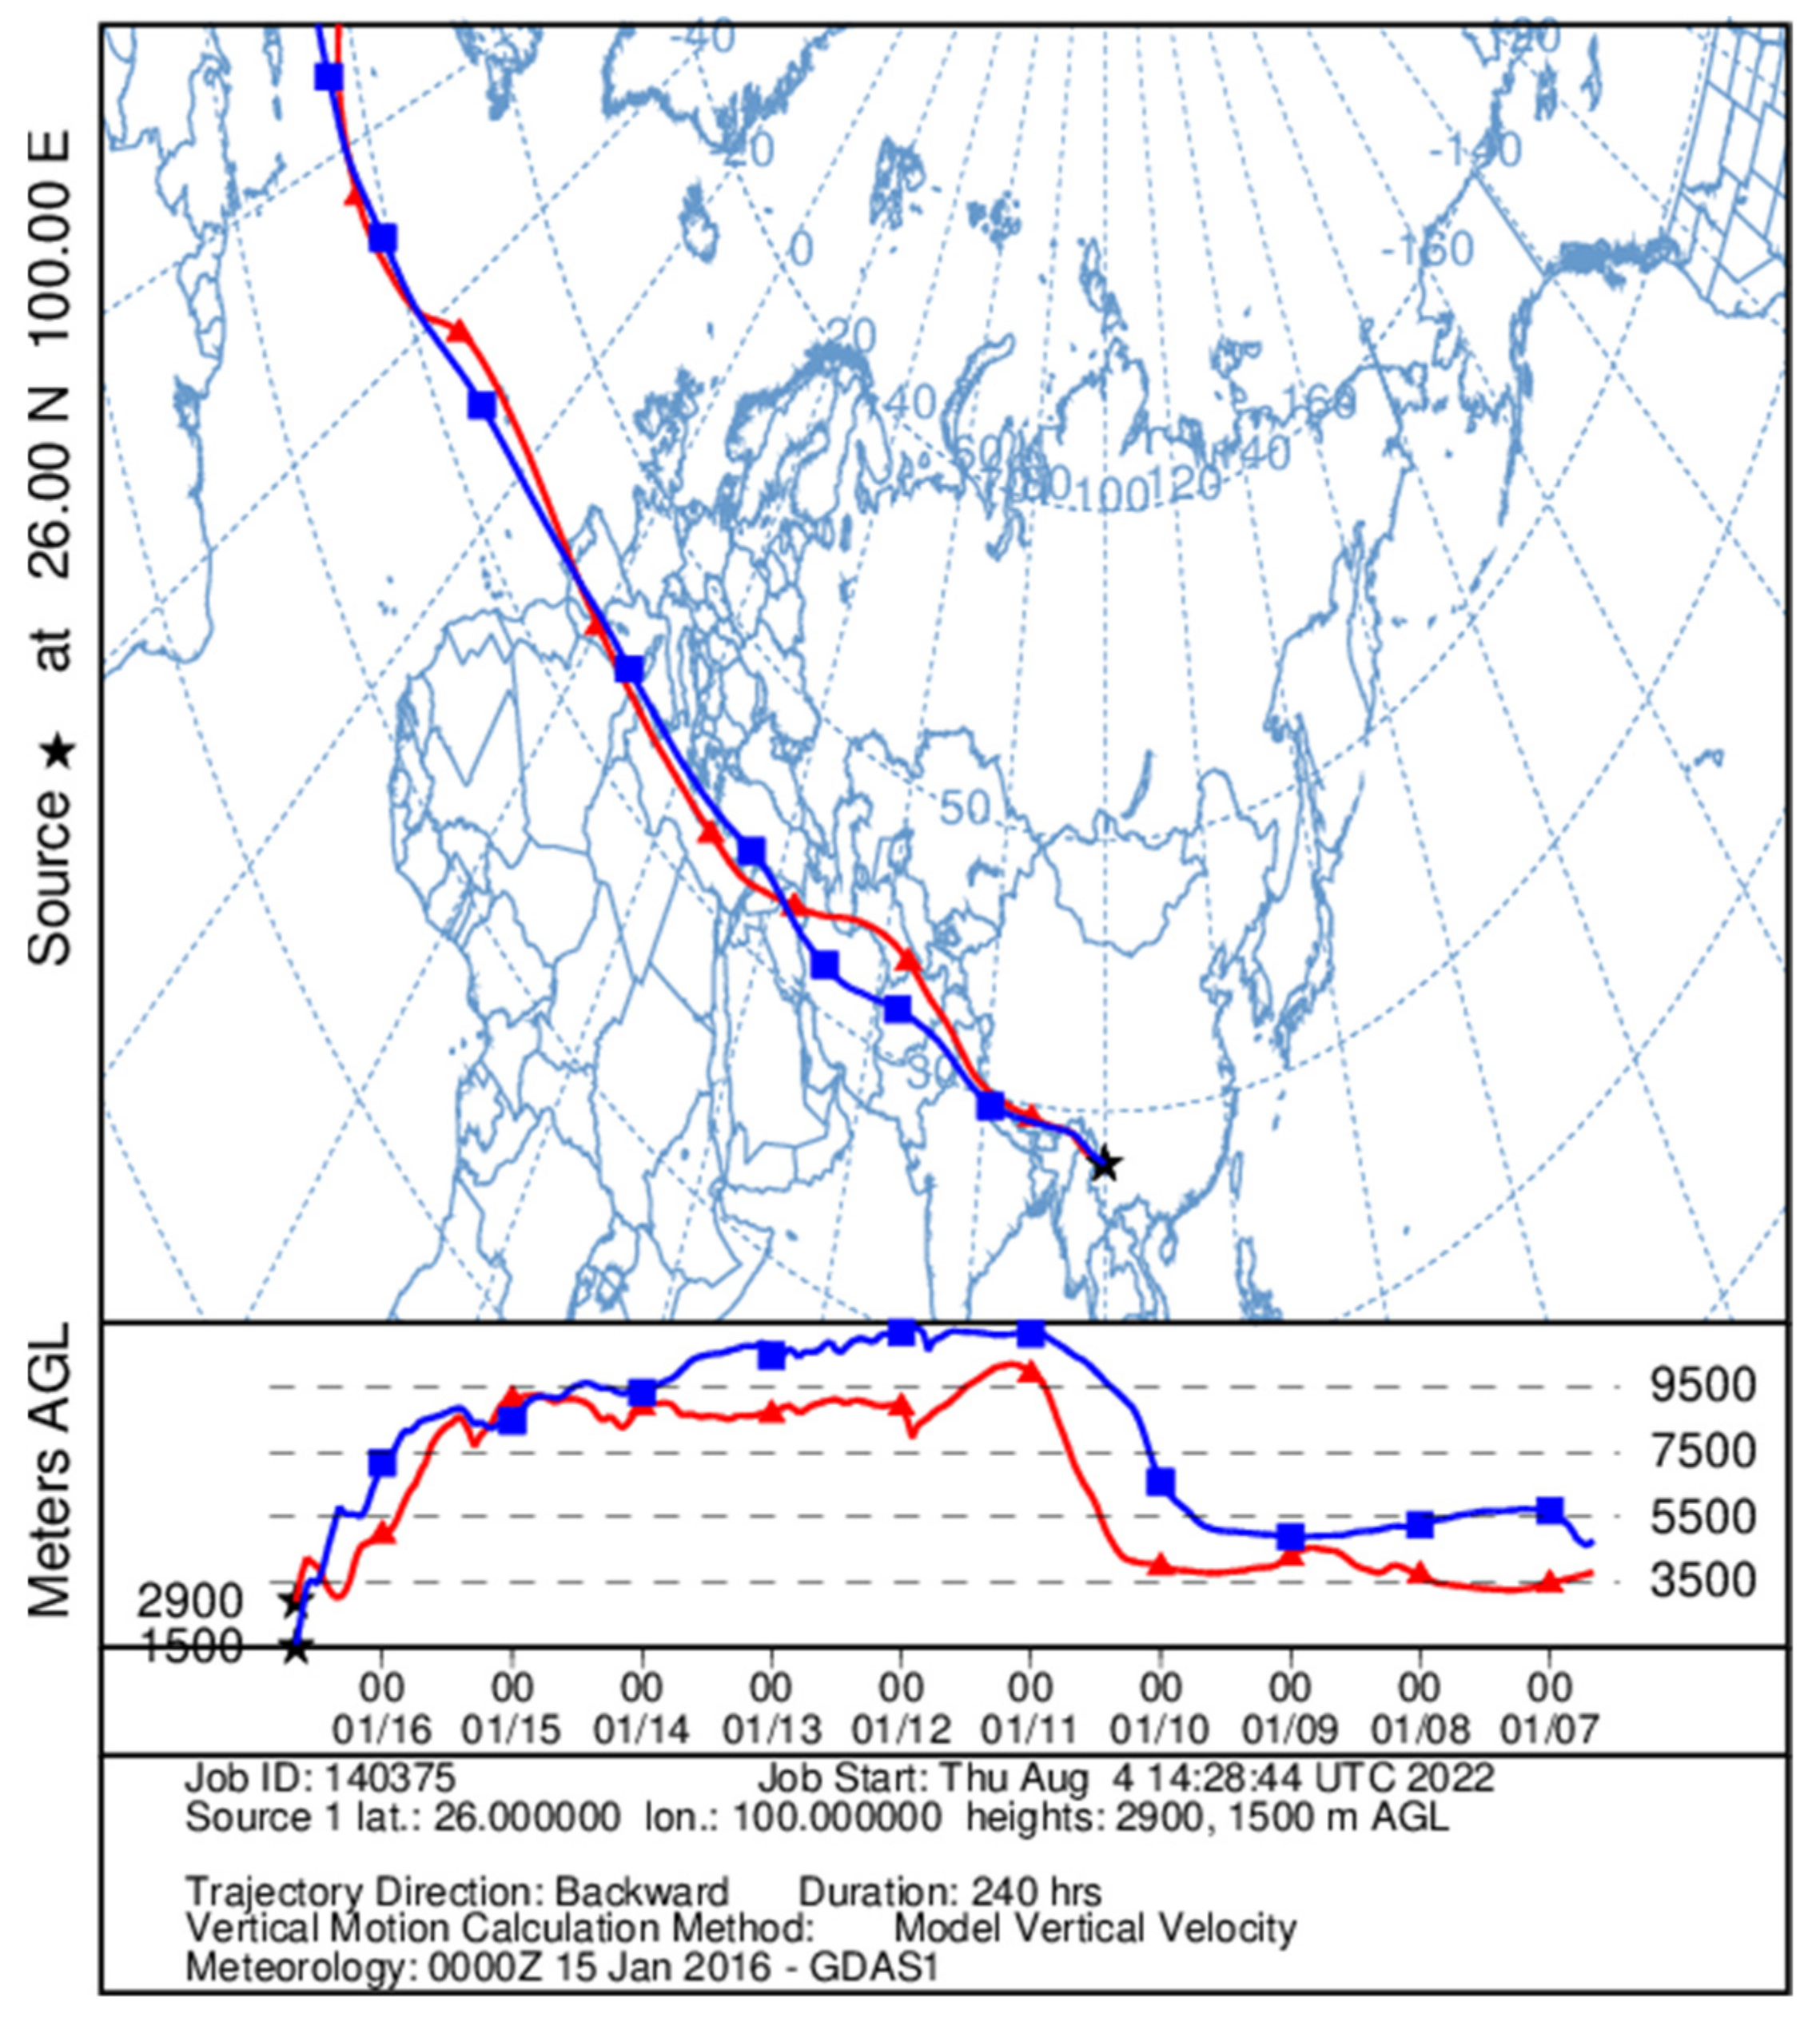
The back trajectories corresponding to the two lower layers at ≈1500 and ≈2900 m AGL are reported in Figure 6. They suggest that the air masses remain at a very high altitude along the entire route to the observational site. Therefore, the layers evidenced by the lidar signals can be reliably ascribed to previous aerosol arrivals.
Even if an exact identification of the aerosol type is hindered by the mix of particles originating from different sources, the observed values of δa and CR (Table 1) result in fairly good agreement with those reported in [41], where the TP aerosol was characterized using the CALIOP satellite lidar data, finding average values of 21% for δa and 0.83 for CR.On the other hand, the CR values at 16.00 UTC suggest a greater diversification between the two layers. This can be ascribed to a gradual descent towards lower heights of the coarser aerosol particles, as expected in a fallout phenomenon. Some studies indicate CR values of large particles in the range of 0.6–1.2 [42]; moreover, a higher CR is expected considering aerosol aging and an increase in the coarser size fraction during the long-range transport of polluted aerosol. Moreover, the lower layer has an aerosol depolarization ratio comparable, within the uncertainty, with that found at 13.00 UTC at similar altitudes, thus reinforcing the idea of deposition coming from the same aerosol event.
The progressive deposition of the aerosol without further feeding by new aerosol particles arriving at the observation site progressively brings the atmospheric condition towards its typical, cleaner situation exemplified by the profiles registered on 18 January and reported as green circles in Figure 4, for the sake of comparison.
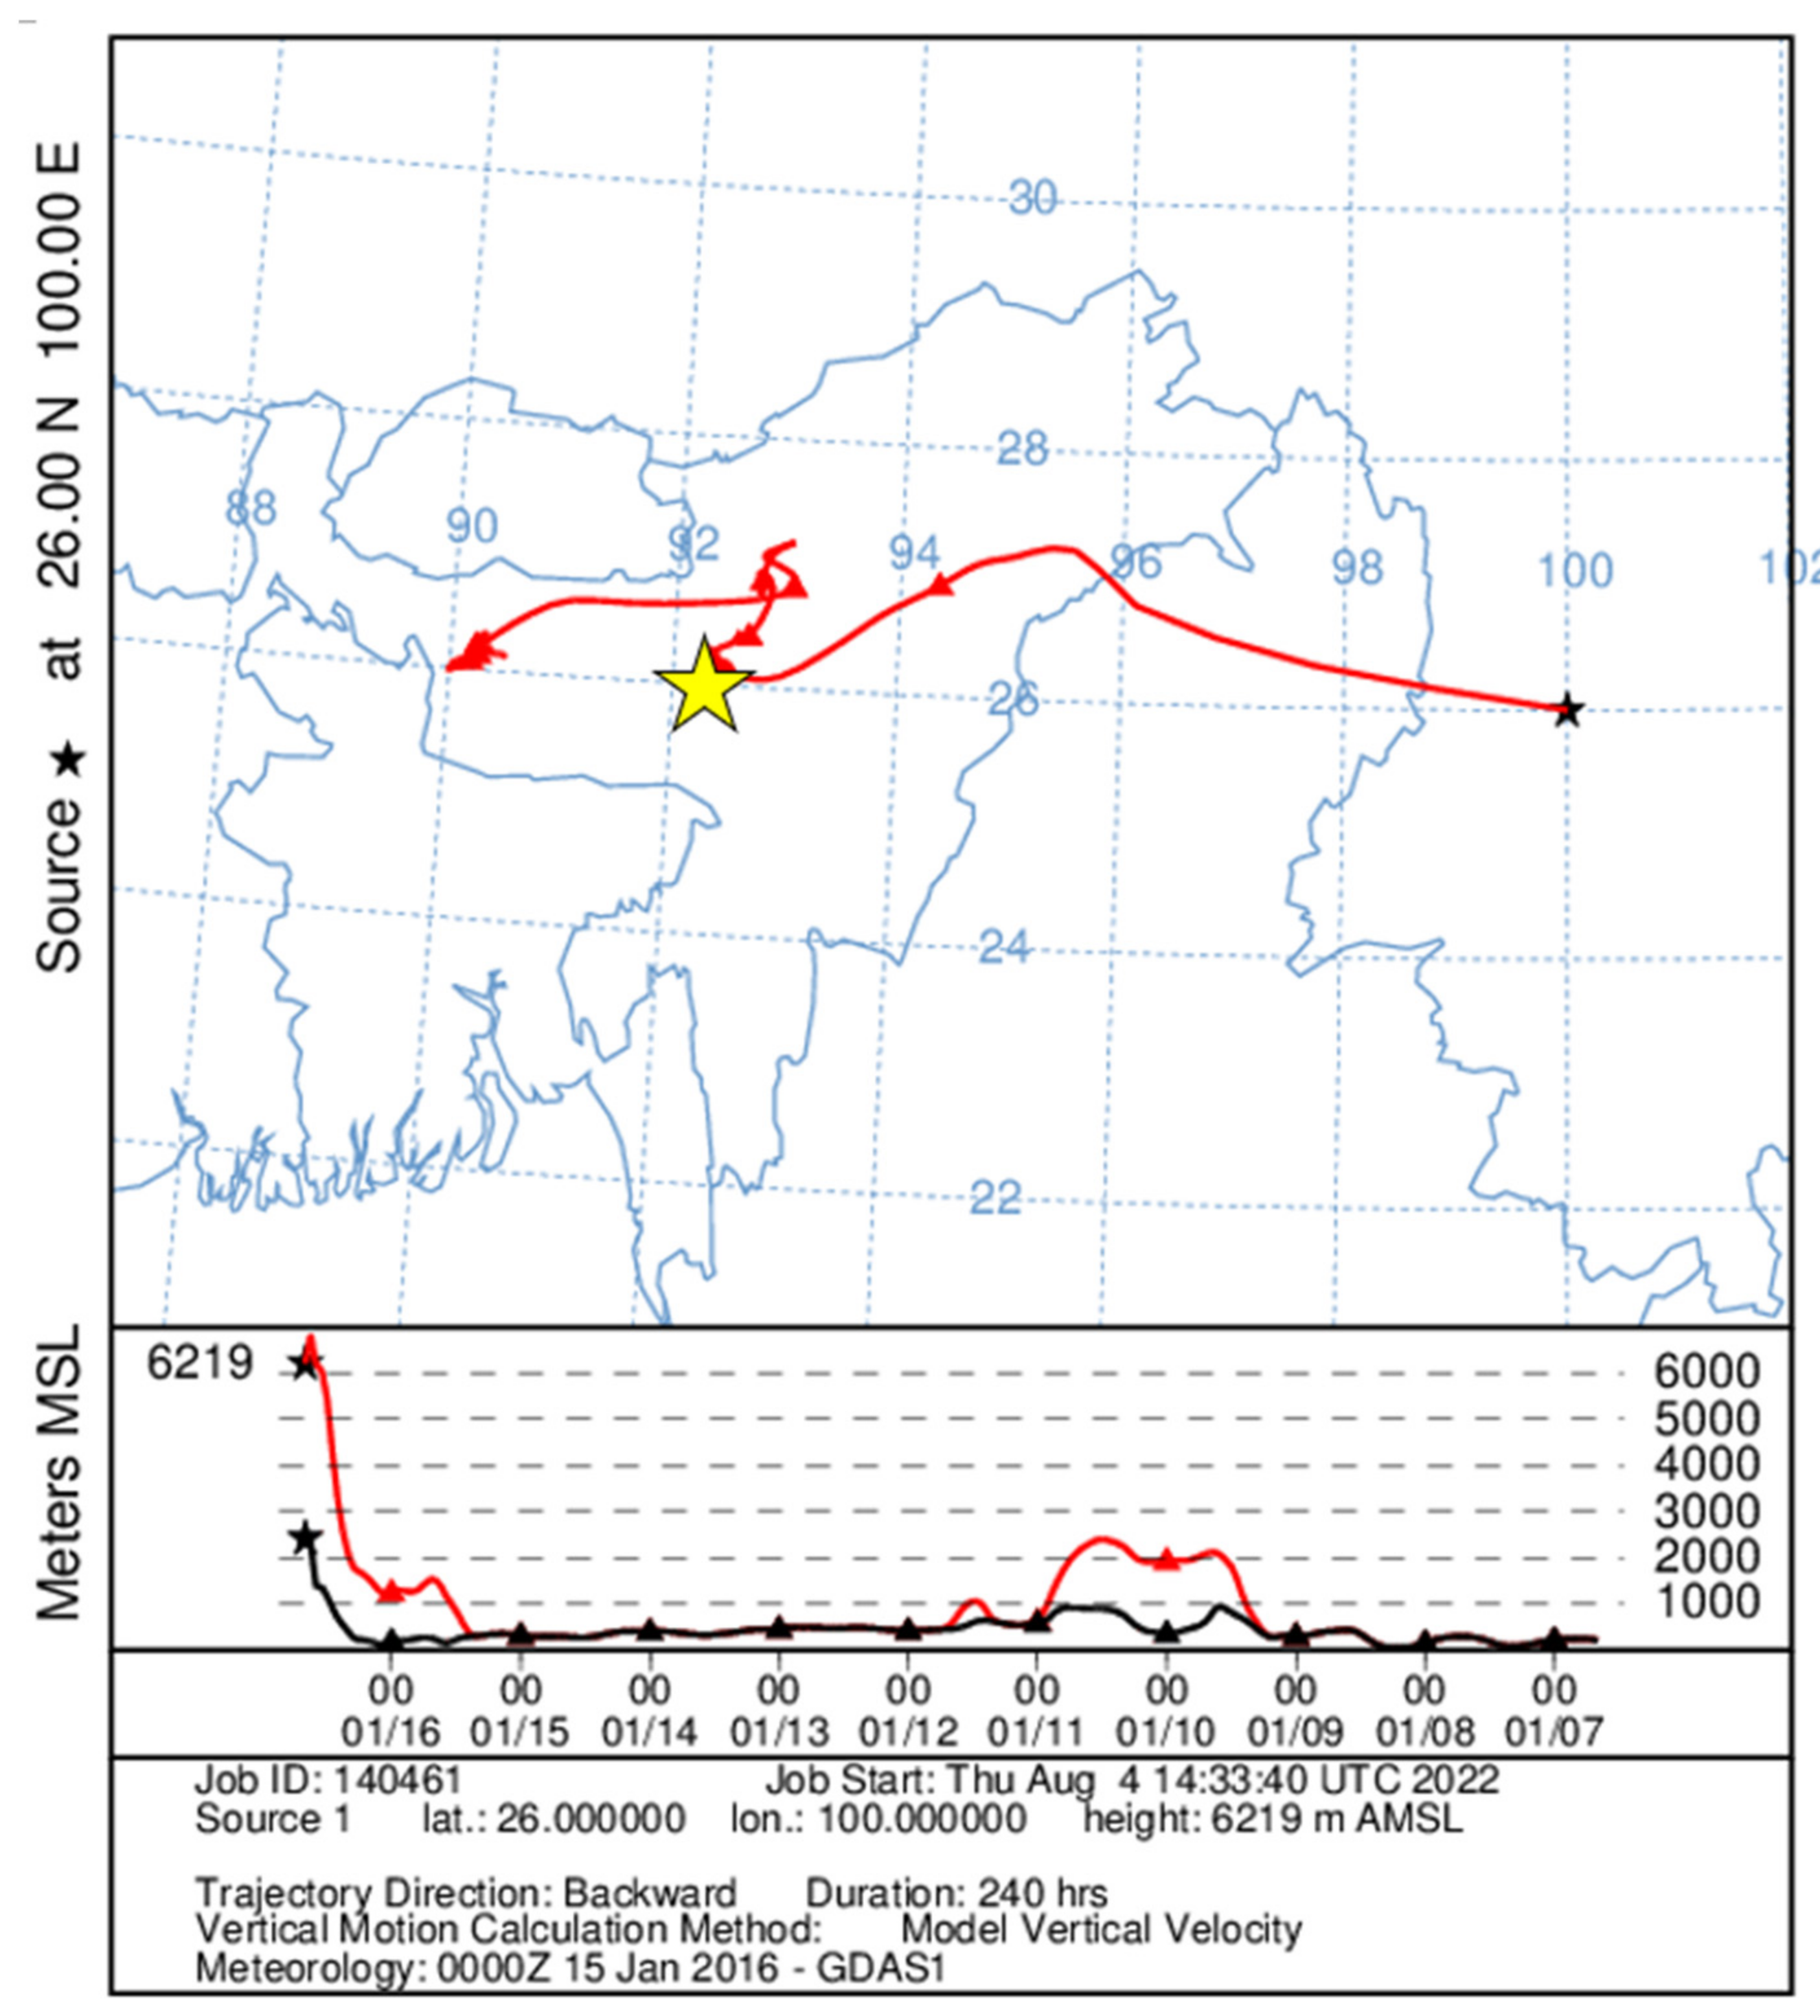
Finally, we discuss the faint trace recognized at 16.00 UTC around ≈3800 m in Figure 2 and Figure 3. The backscattering data in the interval 3390–3990 m leads to an average CR value of (3.1 ± 0.5) that can be associated with a particulate finer than the previous ones. Unfortunately, the height of this layer, combined with the small number of particles, leads to a depolarization ratio signal characterized by a high level of uncertainties (10 ± 17)%, which does not allow the gaining of further information. However, the corresponding back trajectory (Figure 7) highlights an air mass arriving at 3800 m which is completely derived from the ground level (black line) of Uttar Pradesh and, in particular, from the Assam region, touching the regions on the banks of the Brahmaputra several times. As previously mentioned, this area is highly polluted, and the city of Guwahati (highlighted by a yellow-black asterisk in Figure 6) is one of the most polluted Indian cities and is often the subject of study due to the high rate of black carbon emission into the atmosphere [35,43].

5. Conclusions

In summary, we reported on an interesting observation of different aerosol layers in the high mountains (3200 m) during the measurement campaign at the Chinese plateau of Yulong Naxi Autonomous County. The aerosol transport event was analyzed by exploiting a multi-wavelength lidar system that allowed evidencing different types of atmospheric aerosols by means of the color ratio and aerosol depolarization ratio. The analysis of the back trajectories allowed highlighting that the atmospheric aerosols come from two different sites: northern India and PBL of the Tibetan Plateau. Studies in the literature characterize the Tibetan Plateau aerosol as coarse and non-spherical due mainly to the sands of Taklimakan and ice crystals. On the other hand, northern India, particularly the area around the city of Guwahati, is renowned for poor air quality, mainly due to black carbon emissions. The experimental findings on the aerosol features provided by lidar measurements are coherent with this scenario.
The observed phenomenon provides an interesting example of the possibilities offered by aerosol studies carried out in high mountains, and specifically in a region of growing interest, due to its proximity to glaciers and their erosion due to pollutants, where the presence of monitoring stations is still limited, and very few of them are equipped with a lidar system.

Author Contributions

Conceptualization, A.S.; Data curation, A.S., S.A. and A.B.; Formal analysis, A.S. and A.B.; Investigation, A.S.; Methodology, A.S.; Project administration, Y.Z.; Resources, X.W. and Y.Z.; Supervision, S.A.; Validation, A.S., S.A., A.B. and X.W.; Visualization, A.B.; Writing–original draft, A.S.; Writing–review and editing, A.S., S.A. and A.B. All authors have read and agreed to the published version of the manuscript.

Funding

This research funded by Italian MUR Programma Nazionale Infrastrutture di Ricerca (PNIR) (Grant No. CIR01_00015).

Data Availability Statement

Data are available online: https://www.arl.noaa.gov/hysplit/ (accessed on 22 June 2022).

Acknowledgments

A.S. acknowledges the financial support received in the frame of the project ACTRIS-Aerosol: Clouds and Trace Gases Research Infrastructure.

Conflicts of Interest

The authors declare no conflict of interest.

References

  1. Pósfai, M.; Molnár, Á. Aerosol Particles in the Troposphere: A Mineralogical Introduction; Mineralogical Society of Great Britain and Ireland: Twickenham, UK, 2000; pp. 197–252. [Google Scholar] [CrossRef]
  2. Mahowald, N.; Ward, D.S.; Kloster, S.; Flanner, M.G.; Heald, C.L.; Heavens, N.G.; Hess, P.G.; Lamarque, J.-F.; Chuang, P.Y. Aerosol impacts on climate and biogeochemistry. Annu. Rev. Environ. Resour. 2011, 36, 45–74. [Google Scholar] [CrossRef] [Green Version]
  3. Quan, J.; Gao, Y.; Zhang, Q.; Tie, X.; Cao, J.; Han, S.; Meng, J.; Chen, P.; Zhao, D. Evolution of planetary boundary layer under different weather conditions, and its impact on aerosol concentrations. Particuology 2013, 11, 34–40. [Google Scholar] [CrossRef]
  4. Jaenicke, R. Chapter 1 Tropospheric Aerosols. In Hobbs, International Geophysics; Peter, V., Ed.; Academic Press: Cambridge, MA, USA, 1993; Volume 54, pp. 1–31. ISSN 0074-6142. ISBN 9780123507259. [Google Scholar] [CrossRef]
  5. Bitar, L.; Duck, T.J.; Kristiansen, N.I.; Stohl, A.; Beauchamp, S. Lidar observations of Kasatochi volcano aerosols in the troposphere and stratosphere. J. Geophys. Res. Atmos. 2010, 115, 1–2. [Google Scholar] [CrossRef] [Green Version]
  6. Smith, W. The cost of stratospheric aerosol injection through 2100. Environ. Res. Lett. 2020, 15, 114004. [Google Scholar] [CrossRef]
  7. Sagar, R.; Kumar, B.; Dumka, U.C.; Moorthy, K.K.; Pant, P. Characteristics of aerosol spectral optical depths over Manora Peak: A high-altitude station in the central Himalayas. J. Geophys. Res. Atmos. 2004, 109, 1–8. [Google Scholar] [CrossRef] [Green Version]
  8. Pan, Z.; Zhu, J.; Liu, J.; Gu, J.; Liu, Z.; Qin, F.; Pan, Y. Estimation of air temperature and the mountain-mass effect in the Yellow River Basin using multi-source data. PLoS ONE 2021, 16, e0258549. [Google Scholar] [CrossRef] [PubMed]
  9. Zhou, S.; Collier, S.; Jaffe, D.A.; Zhang, Q. Free tropospheric aerosols at the Mt. Bachelor Observatory: More oxidized and higher sulfate content compared to boundary layer aerosols. Atmos. Chem. Phys. 2019, 19, 1571–1585. [Google Scholar] [CrossRef] [Green Version]
  10. Ou-Yang, C.-F.; Lin, N.-H.; Lin, C.-C.; Wang, S.-H.; Sheu, G.-R.; Lee, C.-T.; Schnell, R.; Lang, P.M.; Kawasato, T.; Wang, J.-L. Characteristics of atmospheric carbon monoxide at a high-mountain background station in East Asia. Atmos. Environ. 2014, 89, 613–622. [Google Scholar] [CrossRef]
  11. Buchunde, P.S.; Safai, P.D.; Mukherjee, S.; Raju, M.P.; Meena, G.S.; Sonbawne, S.M.; Pandithurai, G. Seasonal abundances of primary and secondary carbonaceous aerosols at a high-altitude station in the Western Ghat Mountains, India. Air Qual. Atmos. Health 2022, 15, 209–220. [Google Scholar] [CrossRef]
  12. Gao, Y.; Wang, Q.; Li, L.; Dai, W.; Yu, J.; Ding, L.; Li, J.; Xin, B.; Ran, W.; Han, Y.; et al. Optical properties of mountain primary and secondary brown carbon aerosols in summertime. Sci. Total Environ. 2022, 806, 150570. [Google Scholar] [CrossRef]
  13. Perezramirez, D.; Aceituno, J.; Ruiz, B.; Olmo, F.; Alados-Arboledas, L. Development and calibration of a star photometer to measure the aerosol optical depth: Smoke observations at a high mountain site. Atmos. Environ. 2008, 42, 2733–2738. [Google Scholar] [CrossRef]
  14. Xia, X.; Zong, X.; Cong, Z.; Chen, H.; Kang, S.; Wang, P. Baseline continental aerosol over the central Tibetan plateau and a case study of aerosol transport from South Asia. Atmos. Environ. 2011, 45, 7370–7378. [Google Scholar] [CrossRef]
  15. Draxler, R.R. HYSPLIT4 User’s Guide; NOAA Tech. Memo. ERL ARL-230; NOAA Air Resources Laboratory: Silver Spring, MD, USA, 1999.
  16. Available online: https://www.arl.noaa.gov/hysplit/ (accessed on 22 June 2022).
  17. Escudero, M.; Stein, A.; Draxler, R.R.; Querol, X.; Alastuey, A.; Castillo, S.; Avila, A. Determination of the contribution of northern Africa dust source areas to PM10 concentrations over the central Iberian Peninsula using the Hybrid Single-Particle Lagrangian Integrated Trajectory model (HYSPLIT) model. J. Geophys. Res. Atmos. 2006, 111, 1–4. [Google Scholar] [CrossRef]
  18. Uno, I.; Eguchi, K.; Yumimoto, K.; Takemura, T.; Shimizu, A.; Uematsu, M.; Liu, Z.; Wang, Z.; Hara, Y.; Sugimoto, N. Asian dust transported one full circuit around the globe. Nat. Geosci. 2009, 2, 557–560. [Google Scholar] [CrossRef]
  19. Sannino, A. Atmospheric Particles Properties Retrieval in China-Italy Aerosol Multi-Wavelength Polarization Lidar Experiment (AMPLE) Systems. Ph.D. Thesis, University “Federico II” di Napoli, Napoli, Italy, 2017. [Google Scholar]
  20. Boselli, A.; Scollo, S.; Leto, G.; Sanchez, R.Z.; Sannino, A.; Wang, X.; Coltelli, M.; Spinelli, N. First volcanic plume measurements by an elastic/Raman Lidar close to the Etna summit craters. Front. Earth Sci. 2018, 6, 125. [Google Scholar] [CrossRef]
  21. Zhao, Y.; Li, Y.; Li, L.; Yu, Y.; Pan, C.; Song, C.; Boselli, A.; Pisani, G.; Spinelli, N.; Wang, X. Implementation of high dynamic Raman lidar system for 3D map of particulate optical properties and their time evolution. Int. J. Remote Sens. Appl. 2013, 3, 240. [Google Scholar] [CrossRef]
  22. Wang, X.; Boselli, A.; Sannino, A.; Song, C.; Spinelli, N.; Zhao, Y.; Pan, C. Calibration of multi-wavelength raman polarization lidar. EPJ Web Conf. 2015, 89, 1002, EDP Sciences. [Google Scholar] [CrossRef] [Green Version]
  23. Klett, J.D. Stable analytical inversion solution for processing lidar returns. Appl. Opt. 1981, 20, 211–220. [Google Scholar] [CrossRef] [Green Version]
  24. Fernald, F.G. Analysis of atmospheric lidar observations: Some comments. Appl. Opt. 1984, 23, 652–653. [Google Scholar] [CrossRef]
  25. Liu, T.; He, Q.; Chen, Y.; Liu, J.; Liu, Q.; Gao, W.; Huang, G.; Shi, W.; Yu, X. Long-term variation in aerosol lidar ratio in Shanghai based on Raman lidar measurements. Atmos. Chem. Phys. 2021, 21, 5377–5391. [Google Scholar] [CrossRef]
  26. Dong, Q.; Huang, Z.; Li, W.; Li, Z.; Song, X.; Liu, W.; Wang, T.; Bi, J.; Shi, J. Polarization Lidar Measurements of Dust Optical Properties at the Junction of the Taklimakan Desert–Tibetan Plateau. Remote Sens. 2022, 14, 558. [Google Scholar] [CrossRef]
  27. Omar, A.H.; Winker, D.M.; Vaughan, M.A.; Hu, Y.; Trepte, C.R.; Ferrare, R.A.; Lee, K.-P.; Hostetler, C.A.; Kittaka, C.; Rogers, R.R.; et al. The CALIPSO automated aerosol classification and lidar ratio selection algorithm. J. Atmos. Ocean. Technol. 2009, 26, 1994–2014. [Google Scholar] [CrossRef]
  28. Liu, Z.; Sugimoto, N.; Murayama, T. Extinction-to-backscatter ratio of Asian dust observed with high-spectral-resolution lidar and Raman lidar. Appl. Opt. 2002, 41, 2760. [Google Scholar] [CrossRef] [Green Version]
  29. Rocadenbosch, F.; Reba, M.N.; Sicard, M.; Comerón, A. Practical analytical backscatter error bars for elastic one-component lidar inversion algorithm. Appl. Opt. 2010, 49, e3380–e3393. [Google Scholar] [CrossRef] [PubMed]
  30. Chen, W.-N.; Tsai, F.; Chou, C.; Chang, S.; Chen, Y.; Chen, J. Optical properties of Asian dusts in the free atmosphere measured by Raman lidar at Taipei, Taiwan. Atmos. Environ. 2007, 41, 7698–7714. [Google Scholar] [CrossRef]
  31. Guerrero-Rascado, J.L.; Ruiz, B.; Alados-Arboledas, L. Multi-spectral Lidar characterization of the vertical structure of Saharan dust aerosol over southern Spain. Atmos. Environ. 2008, 42, 2668–2681. [Google Scholar] [CrossRef]
  32. Freudenthaler, V.; Esselborn, M.; Wiegner, M.; Heese, B.; Tesche, M.; Ansmann, A.; Müller, D.; Althausen, D.; Wirth, M.; Fix, A.; et al. Depolarization ratio profiling at several wavelengths in pure Saharan dust during SAMUM 2006. Tellus B Chem. Phys. Meteorol. 2009, 61, 165–179. [Google Scholar] [CrossRef] [Green Version]
  33. Pisani, G.; Boselli, A.; Coltelli, M.; Leto, G.; Pica, G.; Scollo, S.; Spinelli, N.; Wang, X. Lidar depolarization measurement of fresh volcanic ash from Mt. Etna, Italy”. Atmos. Environ. 2012, 62, 34–40. [Google Scholar] [CrossRef]
  34. State of Environmental of Assam. 2014. Available online: http://www.pcbassam.org/publications/State%20of%20Env%20of%20Assam.pdf (accessed on 22 April 2022).
  35. Bhunia, G.S.; Ding, D. Temporal and spatial statistical analysis of ambient air quality of Assam (India). J. Air Waste Manag. Assoc. 2020, 70, 775–794. [Google Scholar] [CrossRef]
  36. Chen, X.; Škerlak, B.; Rotach, M.W.; Añel, J.A.; Su, Z.; Ma, Y.; Li, M. Reasons for the extremely high-ranging planetary boundary layer over the western Tibetan Plateau in winter. J. Atmos. Sci. 2016, 73, 2021–2038. [Google Scholar] [CrossRef]
  37. Zhao, C.; Yang, Y.; Fan, H.; Huang, J.; Fu, Y.; Zhang, X.; Kang, S.; Cong, Z.; Letu, H.; Menenti, M. Aerosol characteristics and impacts on weather and climate over the Tibetan Plateau. Natl. Sci. Rev. 2020, 7, 492–495. [Google Scholar] [CrossRef] [PubMed]
  38. Pokharel, M.; Guang, J.; Liu, B.; Kang, S.; Ma, Y.; Holben, B.N.; Xia, X.; Xin, J.; Ram, K.; Rupakheti, D.; et al. Aerosol properties over Tibetan Plateau from a decade of AERONET measurements: Baseline, types, and influencing factors. J. Geophys. Res. Atmos. 2019, 124, 13357–13374. [Google Scholar] [CrossRef]
  39. Kahnert, M.; Kanngießer, F. Modelling optical properties of atmospheric black carbon aerosols. J. Quant. Spectrosc. Radiat. Transf. 2020, 244, 106849. [Google Scholar] [CrossRef]
  40. Sannino, A.; Amoruso, S.; Damiano, R.; Scollo, S.; Sellitto, P.; Boselli, A. Optical and microphysical characterization of atmospheric aerosol in the Central Mediterranean during simultaneous volcanic ash and desert dust transport events. Atmos. Res. 2022, 271, 106099. [Google Scholar] [CrossRef]
  41. Huang, J.; Minnis, P.; Yi, Y.; Tang, Q.; Wang, X.; Hu, Y.; Liu, Z.; Ayers, K.; Trepte, C.; Winker, D. Summer dust aerosols detected from CALIPSO over the Tibetan Plateau. Geophys. Res. Lett. 2007, 34, 1–5. [Google Scholar] [CrossRef] [Green Version]
  42. Sugimoto, N.; Matsui, I.; Shimizu, A.; Uno, I.; Asai, K.; Endoh, T.; Nakajima, T. Observation of dust and anthropogenic aerosol plumes in the northwest Pacific with a two-wavelength polarization lidar on board the research vessel Mirai. Geophys. Res. Lett. 2002, 29, 7-1–7-4. [Google Scholar] [CrossRef] [Green Version]
  43. Das, M.; Patel, D.K.; Sarma, A.K.; Baruah, B.K.; Banu, S.; Kotoky, J. Assessment of polycyclic aromatic hydrocarbons and heavy metals pollution in soils of Guwahati city, Assam, India. Curr. Sci. 2016, 110, 2285–2292. Available online: http://www.jstor.org/stable/24908474 (accessed on 22 June 2022). [CrossRef]
Figure 1. The left panel reports a geographical map of the region showing the position (red star) of the observational site location. The right panel shows a picture of the instrumentation; the red arrow in the picture indicates the position of the AMPLE lidar during the measurement campaign. On the bottom is the AMPLE system.
Remotesensing 14 03773 g001
Figure 2. Time series of the lidar RCS measured at 532 nm from 12.00 to 00.00 UTC on 16 January 2016. Times are shown in UTC.
Remotesensing 14 03773 g002
Figure 3. Time series of the aerosol depolarization ratio retrieved at 532 nm, from 12.00 to 00.00UTC on 16 January 2016. Times are shown in UTC.
Remotesensing 14 03773 g003
Figure 4. 532 nm backscattering profile (a) and aerosol depolarization ratio (b) at 13.00 (black squares) and 16.00 (red triangles) on 16 January 2016. The profiles registered at 21.00 (green circles) on 18 January, showing the gradual end of the recorded event with an integration time of 30 min and a spatial resolution of 60 m. Error bars are shown at representative quotes indicating the corresponding uncertainty on the measured quantity.
Remotesensing 14 03773 g004
Figure 5. Back trajectories (red lines) calculated over 240 h prior to their arrival at the measurement site at 13.00 on 16 January for the following 3 altitudes: (a) 1000 m AGL (3396 above sea level–ASL); (b) 1900 m AGL (4319 ASL); (c) 2500 m AGL (4919 m ASL). The black line indicates the height of the ground-level ASL.
Remotesensing 14 03773 g005aRemotesensing 14 03773 g005b
Figure 6. Back trajectories calculated over 240 h with arrival at the measurement site at 16.00 on 16 January at the following altitudes of 1500 (red lines) and 2900 (blue lines) m above ground level–AGL.
Remotesensing 14 03773 g006
Figure 7. Back trajectories (red line) calculated over 240 h with arrival at the measurement site at 16.00 on 16 January at 3800 m AGL (6219 m ASL). The black line indicates the height of the ground. The black-yellow star shows the position of Guwahati city.
Remotesensing 14 03773 g007
Table 1. Values of the color ratio (CR) at 355/532 nm and the aerosol depolarization ratio (δa) calculated in the affected layers at 13.00 and 16.00 UTC.
Layer (m) @13.00 UTCCRδa (%)Layer (m) @16.00 UTCCRδa (%)
1000–14000.6 ± 0.18 ± 51000–23400.9 ± 0.112 ± 2
1400–21900.8 ± 0.114 ± 22340–33901.6 ± 0.219 ± 3
2190–30300.9 ± 0.230 ± 2
Publisher’s Note: MDPI stays neutral with regard to jurisdictional claims in published maps and institutional affiliations.