Article

Spatiotemporal Variations in Drought and Vegetation Response in Inner Mongolia from 1982 to 2019

1
College of Resource Environment and Tourism, Capital Normal University, Beijing 100048, China
2
Beijing Laboratory of Water Resources Security, Capital Normal University, Beijing 100048, China
3
State Key Laboratory Incubation Base of Urban Environmental Processes and Digital Simulation, Capital Normal University, Beijing 100048, China
4
Commonwealth Scientific and Industrial Research Organization, Canberra, ACT 2601, Australia
*
Author to whom correspondence should be addressed.
Remote Sens. 2022, 14(15), 3803; https://doi.org/10.3390/rs14153803
Submission received: 27 June 2022 / Revised: 30 July 2022 / Accepted: 4 August 2022 / Published: 7 August 2022
(This article belongs to the Section Ecological Remote Sensing)

Abstract

:
Drought events cause ecological problems, including reduced water resources and degraded vegetation. Quantifying vegetation responses to drought is essential for ecological management. However, in existing research, the response relationships (correlations and lags) were typically determined based on Pearson correlation coefficient and the resultant lag times were constrained by the spatial and temporal resolutions of the analyzed data. Inner Mongolia is an important ecological barrier in northern China. Ecological security is one of the most concerned issues of the region’s sustainable development. Herein, we combined Global Inventory Modeling and Mapping Studies (GIMMS) normalized difference vegetation index (NDVI3g) with Systeme Probatoire d’Observation de la Terra-vegetation (SPOT-VGT) NDVI data through spatial downscaling. The obtained 1 km-resolution NDVI dataset spanning Inner Mongolia from 1982 to 2019 was used to represent the refined vegetation distribution. The standardized precipitation evapotranspiration index (SPEI) derived from gridded meteorological data was used to measure drought over the same period. We investigated the spatiotemporal characteristics of vegetation and drought in the region in the past 38 years. We then discussed changes in different vegetation responses to drought across eastern Inner Mongolia using cross wavelet transform (XWT) and wavelet coherence (WTC). The results reveal that in 82.4% of the study area, NDVI exhibited rising trends, and the SPEI values exhibited declining trends in 78.5% of the area. In eastern Inner Mongolia, the grassland NDVI was positively correlated with SPEI and significantly affected by drought events, while NDVI in forestlands, including shrubs, broad-leaved forests, and coniferous forests, was negatively correlated with SPEI in the short term and weakly affected by drought. The NDVI lag times behind SPEI in grasslands, coniferous forests, and broad-leaved forests were 1–1.5, 4.5, and 7–7.5 months, respectively. These findings provide a scientific foundation for environmental preservation in the region.

Graphical Abstract

1. Introduction

Vegetation maintains water and soil conditions, regulates the climate, and controls the energy balance of terrestrial ecosystems which rely heavily on it for their survival [1]. Climate variations can lead to changes in vegetation which in turn is an “indicator” of global climate change [2]. It is therefore of great significance to quantify the spatial patterns and temporal dynamics of the important relationship between them [3].
According to the sixth assessment report released by the United Nations Intergovernmental Panel on Climate Change (IPCC) in 2021, the global average surface temperature in 2011–2020 has increased by 1.09 °C compared with pre-industrialization (1850–1900) [4]. In the context of global warming, the frequent occurrence of drought has a huge impact on the vegetation ecosystem [5]. Meteorological drought is a disaster caused by water shortages resulting from the destruction of the water balance [6]. Drought can cause vegetation to wilt and, in severe cases, die from dehydration [7]. Drought reduces plant photosynthesis, leading to reduced vegetation productivity [8]. Vegetation is highly sensitive to drought [9], and its response to drought has always been a research focus in the field of global climate change [10].
The normalized difference vegetation index (NDVI) is one of the most popular remote sensing means for monitoring vegetation and ecological changes [11]. Widely used NDVI datasets include the Global Inventory Modeling and Mapping Studies (GIMMS) NDVI3g, Moderate Resolution Imaging Spectroradiometer (MODIS) NDVI, and Systeme Probatoire d’Observation de la Terra-vegetation (SPOT-VGT) NDVI datasets. Bai et al. [12] compared these three NDVI products, as well as the Landsat 8 NDVI dataset, on the Mongolian Plateau from 2000 to 2014 and found that the consistency between the SPOT-VGT NDVI and Landsat 8 NDVI was better than that of GIMMS NDVI3g or MODIS NDVI. The MODIS NDVI and SPOT-VGT NDVI datasets have relatively short time series lengths of 22 and 24 years, respectively. Both are insufficient in studying long-term changes in vegetation [13]. The GIMMS NDVI3g dataset is currently the longest-series NDVI dataset (34 years). However, its low spatial resolution (approximately 8 km) causes difficulty capturing fine vegetation changes [14]. According to research by Li et al. [15], the spatial resolution or time series length of the above datasets can introduce uncertainty into the study results of vegetation response to drought. Therefore, it is particularly crucial to acquire NDVI datasets with long time series and high resolution for analyzing long time series and fine vegetation changes [11].
The complex impact of drought on vegetation is commonly analyzed using the drought index. The standardized precipitation evapotranspiration index (SPEI) is one of the most extensively applied indices in regional drought evaluation [16,17,18,19]. Pei et al. [20] estimated the standardized precipitation index (SPI) and SPEI using meteorological station data in Inner Mongolia and discovered that SPEI was better for monitoring drought conditions in this area than SPI. Previous studies mainly calculated drought indices based on site meteorological data, and then performed interpolation to meet the requirements of regional drought monitoring [16,17,18,19,20]. The density of meteorological stations and the interpolation methods could have a major impact on the uncertainties of the calculation results [15]. Using spatially continuous meteorological grid data can compensate for the lack of meteorological stations and improve the overall accuracy of drought monitoring [5].
Existing studies have explored the responses of vegetation to drought including the correlation and hysteresis in arid, semiarid, and humid areas in West Africa [21], the United States [22], the Loess Plateau [6], Yunnan Province [23], and Northwest China [5]. According to their findings, various plant types have distinct drought responses and lag times. The lag responses of vegetation to drought were typically studied using the Pearson correlation coefficient [24,25,26,27]. However, this method is limited by the sampling rate of the original data, and the minimum lag time depends on the time interval of the data. As a consequence, the accuracy of the outcomes can be inadequate. Grinsted et al. [28] constructed cross wavelet transform (XWT) and wavelet coherence (WTC) methods to show the coherence and hysteresis characteristics of the two sequences of wintertime Arctic Oscillation (AO) and Baltic maximum sea ice (BMI) in the time–frequency domain. They proved that the combination of the two time–frequency techniques provided more accurate lag times than the Pearson correlation coefficient [28,29].
Inner Mongolia is an arid and semiarid region where droughts have become more common in recent years, causing ecological issues such as grassland degradation and increasingly prominent land desertification [30,31]. It is necessary to study the response of different vegetation types to drought. Previous studies performed in the region found that NDVI was negatively correlated with drought in the northeast forest area and western desert area, while it was positively correlated with drought in the grassland region [15,32,33,34]. These studies were based on the NDVI dataset acquired by a single sensor, used the meteorological station data to calculate SPEI, and then used the Pearson correlation coefficient to generate the correlation between the two. Few studies have explored the lag effect of vegetation to drought in Inner Mongolia which is a vast region with few meteorological stations in the western desert area. Therefore, overcoming the deficiencies of previous studies resulting from insufficient data resolution, time series length, and research method selection remains a key issue in investigating spatiotemporal variations and the responsive relations between vegetation and drought in the region.
Therefore, the objectives of this study are (1) to construct annual NDVI and SPEI datasets with a suitable spatial resolution (1 km) in Inner Mongolia from 1982 to 2019, (2) to analyze the temporal and spatial characteristics of vegetation and drought in this region over the past 38 years, and (3) to explore the correlation and lag response of different vegetation types to drought events using wavelet analysis (XWT and WTC) in eastern Inner Mongolia where vegetation types are rich. The research results can provide important guidance for ecological protection and water resources management in the region.

2. The Study Area and Datasets

2.1. Study Area

Inner Mongolia is located on China’s northern frontier and covers approximately 1.2 million km2 (Figure 1a). It governs 12 prefecture-level administrative regions. In 1929, Professor Zhu Kezhen proposed the first climate zoning in China [35]. It is mainly divided according to precipitation and heat, which can be divided into subtropical monsoon climate, temperate monsoon climate, temperate continental climate, and alpine plateau climate. Inner Mongolia is dominated by a temperate continental monsoon climate with an annual average temperature of 4.7 °C (1961–2018) and annual precipitation totals ranging from 50 to 450 mm. The distribution of water resources is uneven, with more resources in the east and shortages in most of the central and western regions. The water resources of the Hetao Plain in the south are relatively rich due to the presence of water from the Yellow River. The study area mainly comprises plateau landforms with forests, grasslands, deserts, and other vegetation types from east to west. According to the “China Meteorological Geographical Division”, it can be divided into eastern, central, and western divisions, and the eastern part is rich in vegetation types (Figure 1b) [33]. The forested area, which is the largest in China, spans 261,500 km2, accounting for 23% of the whole area (Statistical Bulletin of National Economic and Social Development, 2020). According to the monitoring of the Inner Mongolia Ecological and Agricultural Meteorological Center, as of July 2019, the arid area in the region was 469,000 km2, accounting for 44.3% of the total area.

2.2. Datasets and Processing

2.2.1. NDVI Data

The GIMMS NDVI3g dataset is the longest available NDVI time series in the world [11]. It contains 816 images with a temporal resolution of 15 days covering the period from 1982 to 2015. However, because its spatial resolution is approximately 8 km, capturing detailed changes in vegetation using this dataset is difficult [11]. We downloaded these images from the National Aeronautics and Space Administration (NASA) (https://ecocast.arc.nasa.gov/data/pub/gimms/, accessed on 11 December 2021). The maximum value composite (MVC) method was used to regenerate a new image by extracting the maximum pixel value from several images. This method can eliminate the influences of clouds and the atmosphere [36]. In this work, MVC was applied to synthesize monthly data, and a total of 408 images were obtained.
The monthly 1 km-resolution SPOT-VGT NDVI dataset contains 252 images covering the 1999–2019 period. We downloaded these images from the Resource and Environmental Science and Data Center of the Chinese Academy of Sciences (https://www.resdc.cn/, accessed on 11 December 2021). The MVC was used to process the GIMMS NDVI3g and SPOT-VGT NDVI datasets to obtain annual and seasonal data. At the same time, the GIMMS NDVI3g dataset was resampled to 1 km to match the pixel size of the SPOT-VGT NDVI dataset.

2.2.2. Thematic Data
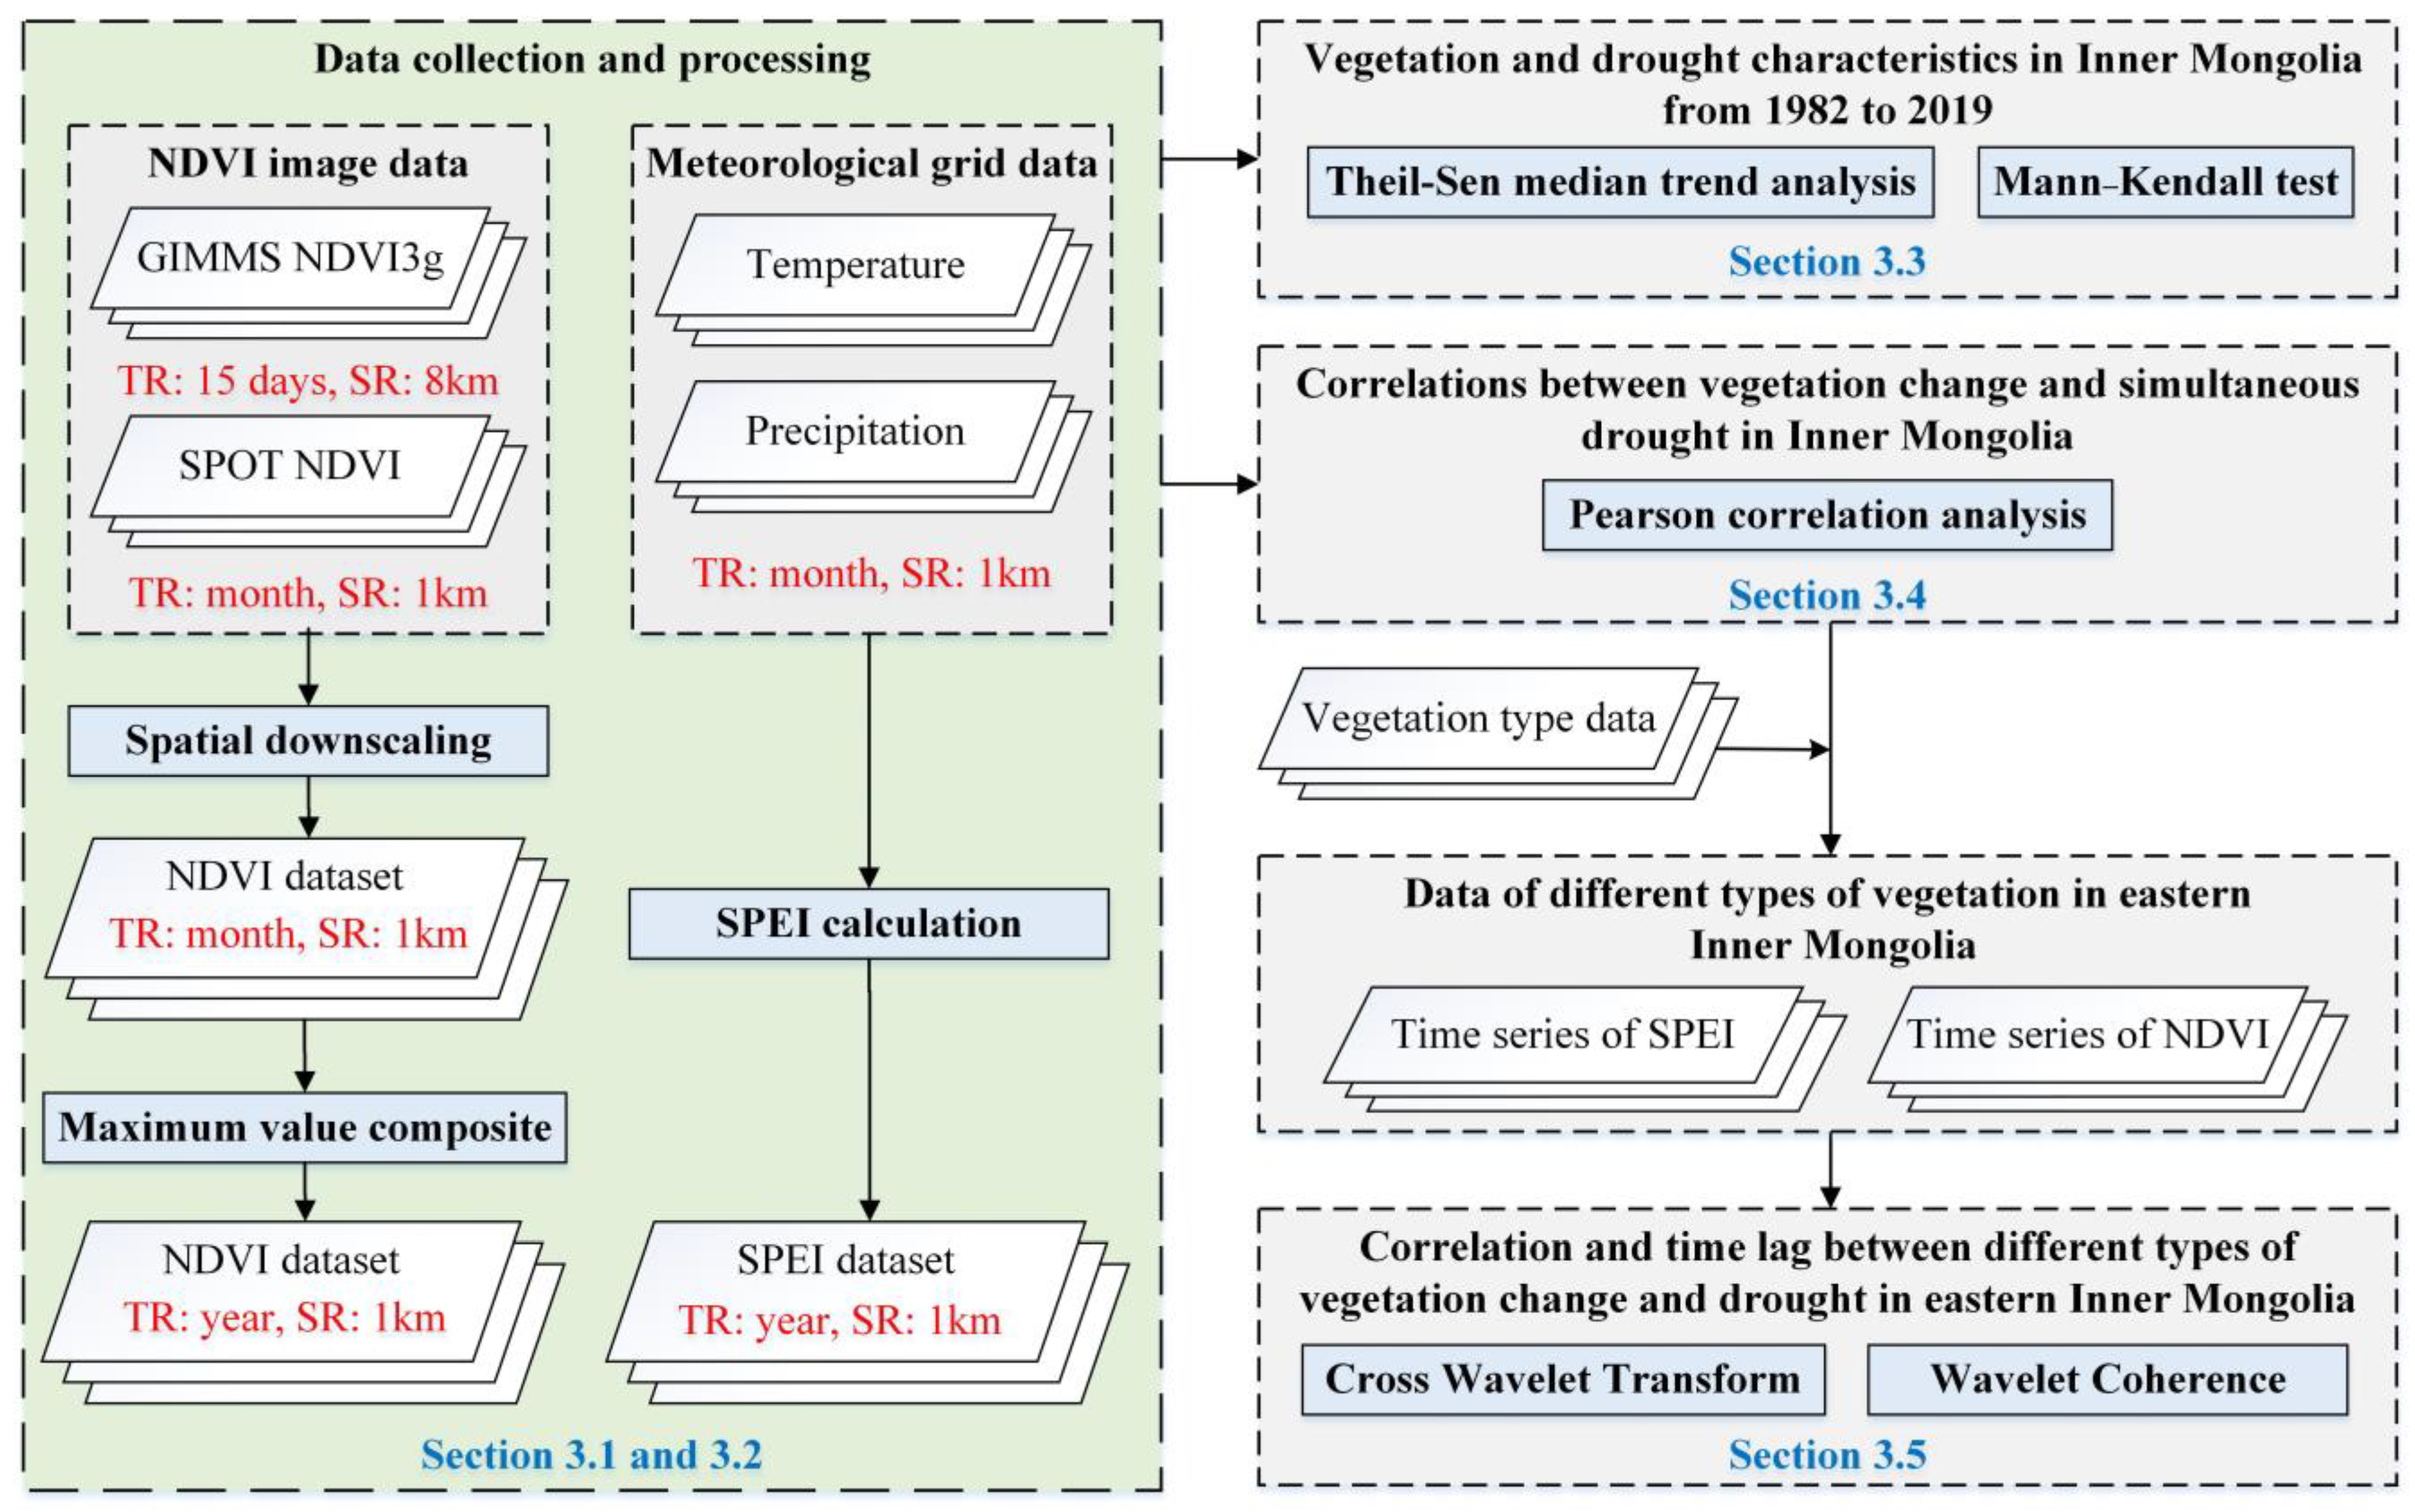
The National Qinghai-Tibet Plateau Science Data Center (https://data.tpdc.ac.cn/zh-hans/, accessed on 11 December 2021) provided gridded meteorological data on the monthly scale from 1982 to 2019, including 1 km-resolution monthly temperature and precipitation data. These data were generated using a spatial downscaling scheme based on long-time-series, low-spatial-resolution (approximately 55 km) meteorological data from the Climate Research Unit (CRU). The downscaled results obtained for China were evaluated based on data recorded at 496 meteorological stations, and the monthly temperature and precipitation deviations were 0.82–1.28 °C and 13.3 mm, respectively [37]. The total number of downloaded monthly temperature and precipitation images was 912.
The vegetation type data (CCI-LC) came from the global land cover dataset of the European Space Agency, which was created during the second climate change action phase (http://maps.elie.ucl.ac.be/CCI/viewer/, accessed on 11 December 2021). The data covered a time period from 1992 to 2019, and the pixel size was 300 × 300 m. Figure 1b shows the vegetation types in Inner Mongolia in 2019. Considering that the data employed herein have a long-time span (1982–2019) and that vegetation types inevitably change, this paper adopted vegetation type data at four different times: 1992, 2000, 2010, and 2019.

3. Methodology

Based on the three types of datasets listed above, the flowchart of the methodology is shown in Figure 2. First, the GIMMS NDVI3g and SPOT-VGT NDVI datasets were combined to obtain an annual NDVI dataset with a 1 km resolution from 1982 to 2019, and the accuracy was verified (Section 3.1). SPEI was calculated based on the gridded meteorological data at the same time, including monthly temperature and precipitation data (Section 3.2). Second, a trend analysis was conducted to examine the change dynamics of vegetation and drought over the past 38 years (Section 3.3). Then, by calculating the correlation coefficient (r) between NDVI and SPEI for each pixel in the whole Inner Mongolia from 1982 to 2019, the association between vegetation changes and simultaneous drought was understood (Section 3.4). Finally, the correlation and hysteresis characteristics between the vegetation and drought of four vegetation types, including grasslands, shrubs, broad-leaved forests, and coniferous forests in eastern Inner Mongolia were explored using XWT and WTC wavelet analysis techniques (Section 3.5).

3.1. Spatial Downscaling

The regression model method is a way to establish a linear or nonlinear relationship between forecast variables and predictors, and it is the earliest and most widely used statistical downscaling method [38]. With the help of the IDL programming language, the linear regression equation was established based on the overlapping SPOT-VGT NDVI and resampled GIMMS NDVI3g in 2000 to 2015 [39]. It can be expressed as follows:
G N i = a × S N i + b + c i
where G N i represents the GIMMS NDVI3g data in the ith year, S N i represents the SPOT-VGT NDVI data in the ith year, a and b are constants, and c i is the residual of the linear equation.
Based on Equation (1) the 8 km-resolution GIMMS NDVI3g data spanning from 1982 to 1999 were downscaled to 1 km-resolution data. Then, the downscaled NDVI data from 1999 was taken as an example to illustrate the downscaling accuracy because the SPOT-VGT NDVI data in 1999 did not participate in the linear regression analysis described above.

3.2. SPEI Calculation

Vicente-Serrano et al. [40] presented SPEI, which takes into account the influence of temperature on potential evapotranspiration, apart from precipitation, and improves the performance of the precipitation-based SPI. The calculation process is as follows [40,41].
First, based on the gridded monthly mean temperature from 1982 to 2019, the potential evapotranspiration (PET) was calculated by using the Thornthwaite approach [42].
P E T = 16 K ( 10 T i H ) A
H = i = 1 12 H i = i = 1 12 ( T i 5 ) 1 . 514  
where PET is the potential evapotranspiration, K is the correction coefficient of the latitude and month function, T i is the monthly average temperature, and H is the annual heat index. A is a constant, determined by H, where
A = 0 . 49 + 0 . 179 H 0 . 0000771 H 2 + 0 . 000000675 H 3
Second, the difference between monthly precipitation and evapotranspiration was calculated:
D i = P i P E T i
where D i is the difference between precipitation and evapotranspiration, P i is the monthly precipitation, and P E T i is the monthly evapotranspiration.
Third, the log-logistic probability distribution of three parameters was used to normalize the D i data sequence. The calculation formula of the log-logistic probability distribution function is as follows:
F ( x ) = [ 1 + ( α x γ ) β ] 1
where the α, β, and γ parameters are fitted by the linear moment method.
Finally, the cumulative probability density was standardized:
P = 1 F ( x )
ω = { 2 ln ( P ) ,   P     0 . 5 2 ln ( 1 P ) ,   P > 0 . 5
SPEI = { ω c 0 + c 1 ω + c 2 ω 2 1 + d 1 ω + d 2 ω 2 + d 3 ω 3 ,   P     0 . 5 c 0 + c 1 ω + c 2 ω 2 1 + d 1 ω + d 2 ω 2 + d 3 ω 3 ω ,   P > 0 . 5
where ω is the cumulative probability function value of the evapotranspiration precipitation derivation function. c 0 = 2.515517, c 1 = 0.802853, c 2 = 0.010328, d 1 = 1.432788, d 2 = 0.189269, and d 3 = 0.001308.
SPEI can be calculated at monthly, seasonal, annual, and biennial scales. Here, to assess annual drought conditions, the 12-month SPEI (SPEI-12) was calculated with the help of the Python programming language. According to the National Meteorological Drought Grade standard released in 2017 (GB/T20481-2017), the SPEI outputs were categorized as shown in Table 1.

3.3. Trend Analysis

3.3.1. Theil–Sen Median Trend Analysis

To identify the vegetation and drought trends in time and space, Theil–Sen median trend analysis was utilized with the help of R language. Theil–Sen median trend analysis is a reliable nonparametric approach for calculating statistical trends that is superior to regression analysis in terms of preventing error [43,44]. The calculation formula is as follows:
β = Median ( x j x i j i )  
where x j and x i are the NDVI or SPEI values for the jth year and the ith year, respectively. If the trend value (β) is greater than 0, it is considered to indicate a rise; otherwise, it indicates a decline.

3.3.2. Mann–Kendall Trend Test

The Mann–Kendall trend test is a nonparametric rank test method that is unaffected by missing values or outliers and widely used to judge the significance of long-time-series data trends [45,46].
Z   = { S 1 var ( s ) ,   S > 0   0 ,   S = 0 S + 1 var ( s ) ,   S < 0  
S = i = 1 n 1 j = i + 1 n sign ( x j x i )
var ( s ) = n ( n 1 ) ( 2 n + 5 ) 18
sign ( x j x i ) = { 1 ,   x j x i > 0 0 ,   x j x i = 0 1 ,   x j x i < 0
Where Z (−∞,+∞) is the statistic. It is significant when Z is larger than 1.96 or less than −1.96; otherwise, it is not significant. var ( s ) is the variance, n is the length of the time series, and sign is a symbolic function.

3.4. Pearson Correlation Analysis

To clarify the correlation between vegetation change and drought, we used the Pearson correlation coefficient to analyze the pixel-by-pixel correlation between vegetation NDVI and SPEI in Inner Mongolia from 1982 to 2019 with the help of R language, and used a t test to test the significance of the correlation coefficient. The Pearson correlation between NDVI and drought index indicates the impact of drought on vegetation [6].

3.5. Wavelet Analysis

Wavelet analysis is an effective tool for obtaining the time–frequency characteristics, including the periodic, correlation, and hysteresis characteristics, of two time series in the fields of meteorology, hydrology, and astronomy [47,48]. With the help of Python programming language, XWT and WTC, components of the wavelet analysis method, were used herein to identify the correlation and lag characteristics between the NDVI and SPEI sequences.
XWT can display the common power of the two sequences in the time–frequency domain [28,49]. Supposing that the two time series are represented by X = { x 1 , x 2 , x 3 , , x n } and Y = { y 1 , y 2 , y 3 , , y n } , the corresponding continuous wavelet transforms with frequency scale s can be denoted as W n X ( s ) and W n Y ( s ) . The cross wavelet spectrum is therefore defined as follows:
W n X Y ( s ) = W n X ( s ) W n Y * ( s )  
where W n Y * ( s ) is the complex conjugate of W n Y ( s ) . The cross wavelet power spectrum is | W n X Y ( s ) | .
WTC may be applied to detect remarkable coherence regardless of power level [28]. Its phase spectrum reflects the correlation and lag between the two time series. The WTC spectrum is defined as follows:
R n 2 ( n ) = | S ( s 1 W n X Y ( s ) ) | 2 S ( s 1 | W n X ( s ) | 2 ) · S ( s 1 | W n Y ( s ) | 2 )  
where s is the scale and S is the smoothing operator.
The phase angle in the phase spectrum can reflect the lag characteristics of two time series in different time domains, and the correlation between the two time series can be analyzed by considering the sign of the phase angle [28]. The average phase angle is defined as follows:
a m = arg ( x , y )   = arg [ i = 1 n cos a i , i = 1 n sin a i ]
where a i is a single phase angle in the wavelet transform time domain and i is the phase angle label.
To explore the response relationships between different types of vegetation changes and drought using XWT and WTC, based on the four-phase vegetation type data mentioned in Section 2.2.2, this paper extracted four vegetation types with relatively large distribution areas in eastern Inner Mongolia (Figure 1b), including grassland, shrub, broad-leaved forest, and coniferous forest. At the same time, the NDVI and SPEI datasets were resampled to 300 m using the nearest neighbor method in the resampling tool in ArcGIS 10.5 (https://desktop.arcgis.com/zh-cn/arcmap/10.5/tools/data-management-toolbox/resample.htm, accessed on 11 December 2021), with the same spatial resolution as the vegetation type data, so as to facilitate the extraction of NDVI and SPEI sequences at different vegetation types. Then, XWT and WTC were applied to the NDVI and SPEI sequences of the four vegetation types.

4. Results and Discussion

4.1. Accuracy Verification of the Downscaled NDVI Data

A total of 1000 pixels were randomly selected to compare the downscaled data and the SPOT-VGT NDVI in 1999 (Figure 3). The correlation coefficient was 0.98, indicating that the downscaled NDVI data were reliable.

4.2. Vegetation Characteristics in Inner Mongolia from 1982 to 2019

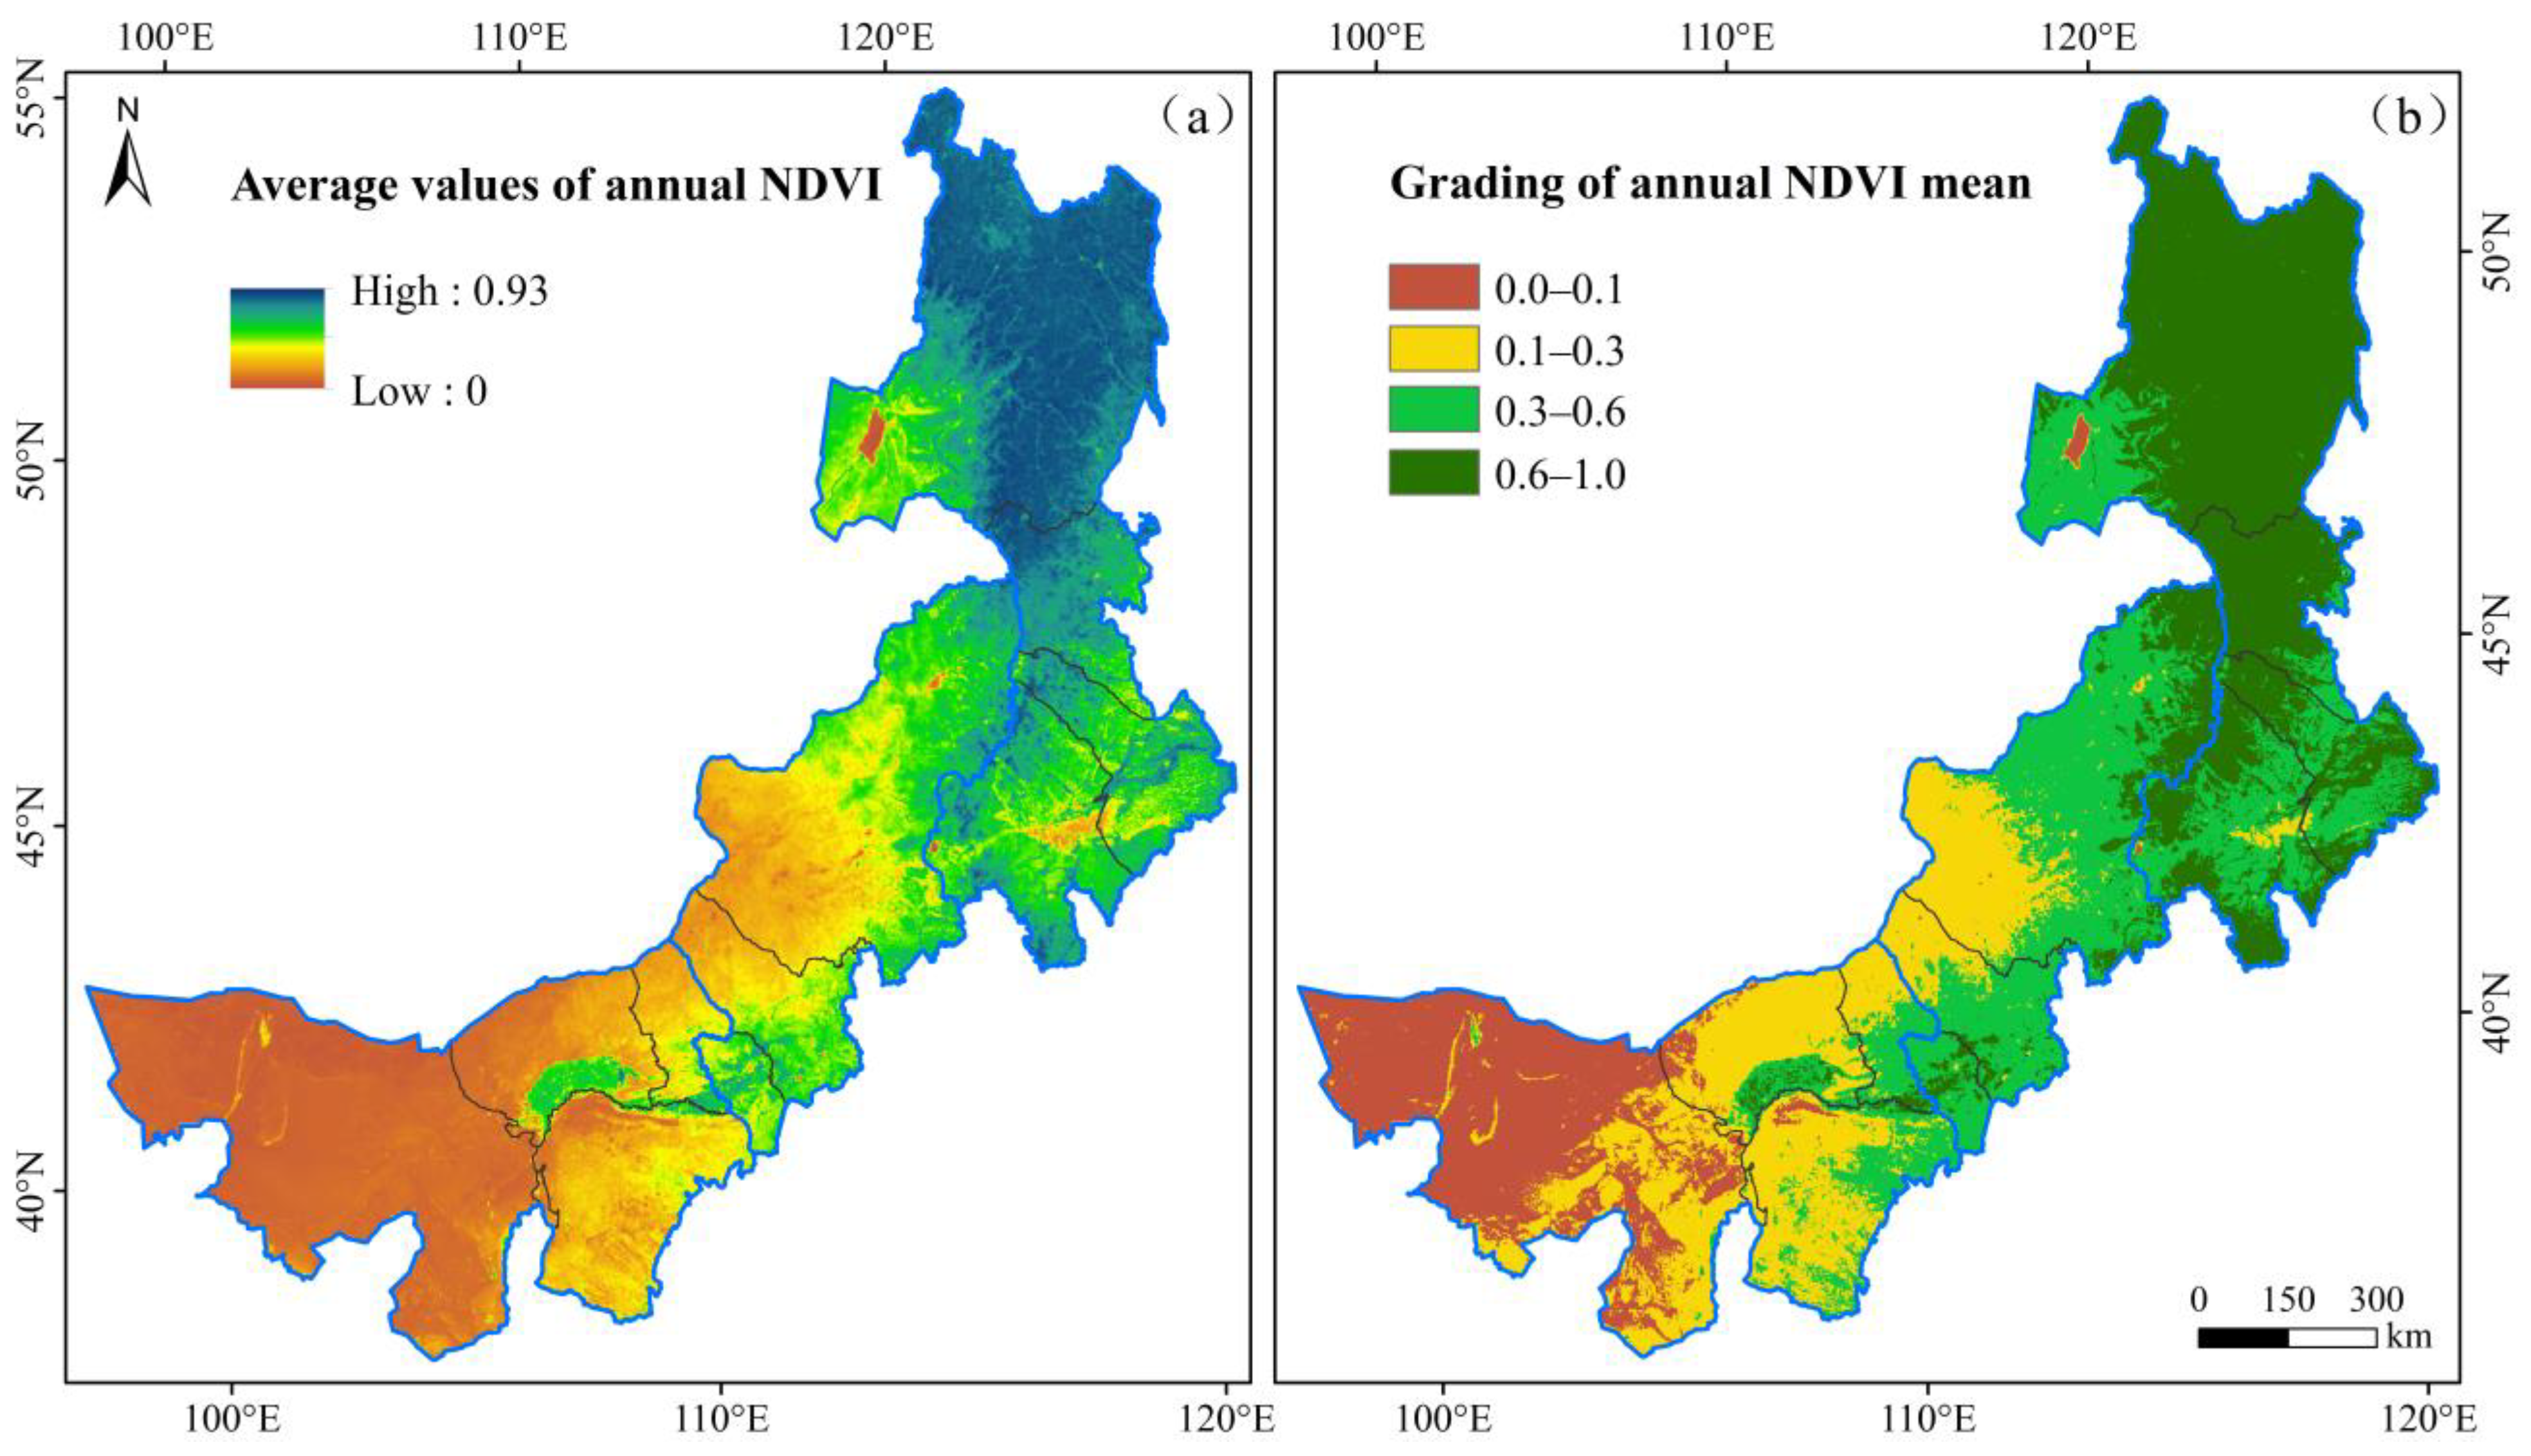
4.2.1. Distribution of Vegetation

The 38 year mean NDVI calculated using the annual NDVI data from 1982 to 2019 was low in western Inner Mongolia and high in the eastern region, exhibiting obvious regional heterogeneity (Figure 4a). The maximum value in eastern Inner Mongolia was 0.93, distributed in the Daxinganling Mountains. The minimum value was 0, corresponding to areas where lakes were located. The maximum value in the central region was 0.89, distributed in the eastern part of Xilin Gol League, and the minimum value was 0.03, distributed in the western part of Xilin Gol League. The maximum value in the western region was 0.84, distributed in the Hetao Plain, and the minimum value was 0, found in the desert regions.
The classified mean NDVI values fall into four categories, as shown in Table 2 and Figure 4b [5]. A total of 33.9% of the entire area was covered by areas with high vegetation and mostly found in eastern Inner Mongolia. Medium vegetation cover occupied 27.9% of the total area, which was mostly found in the grasslands of central and eastern Inner Mongolia. The areas with low vegetation coverage accounted for 22.4% of the total area and were mostly found in the desert steppe areas. Areas with no vegetation coverage accounted for 15.8% and were predominantly located in the desert regions of the west.

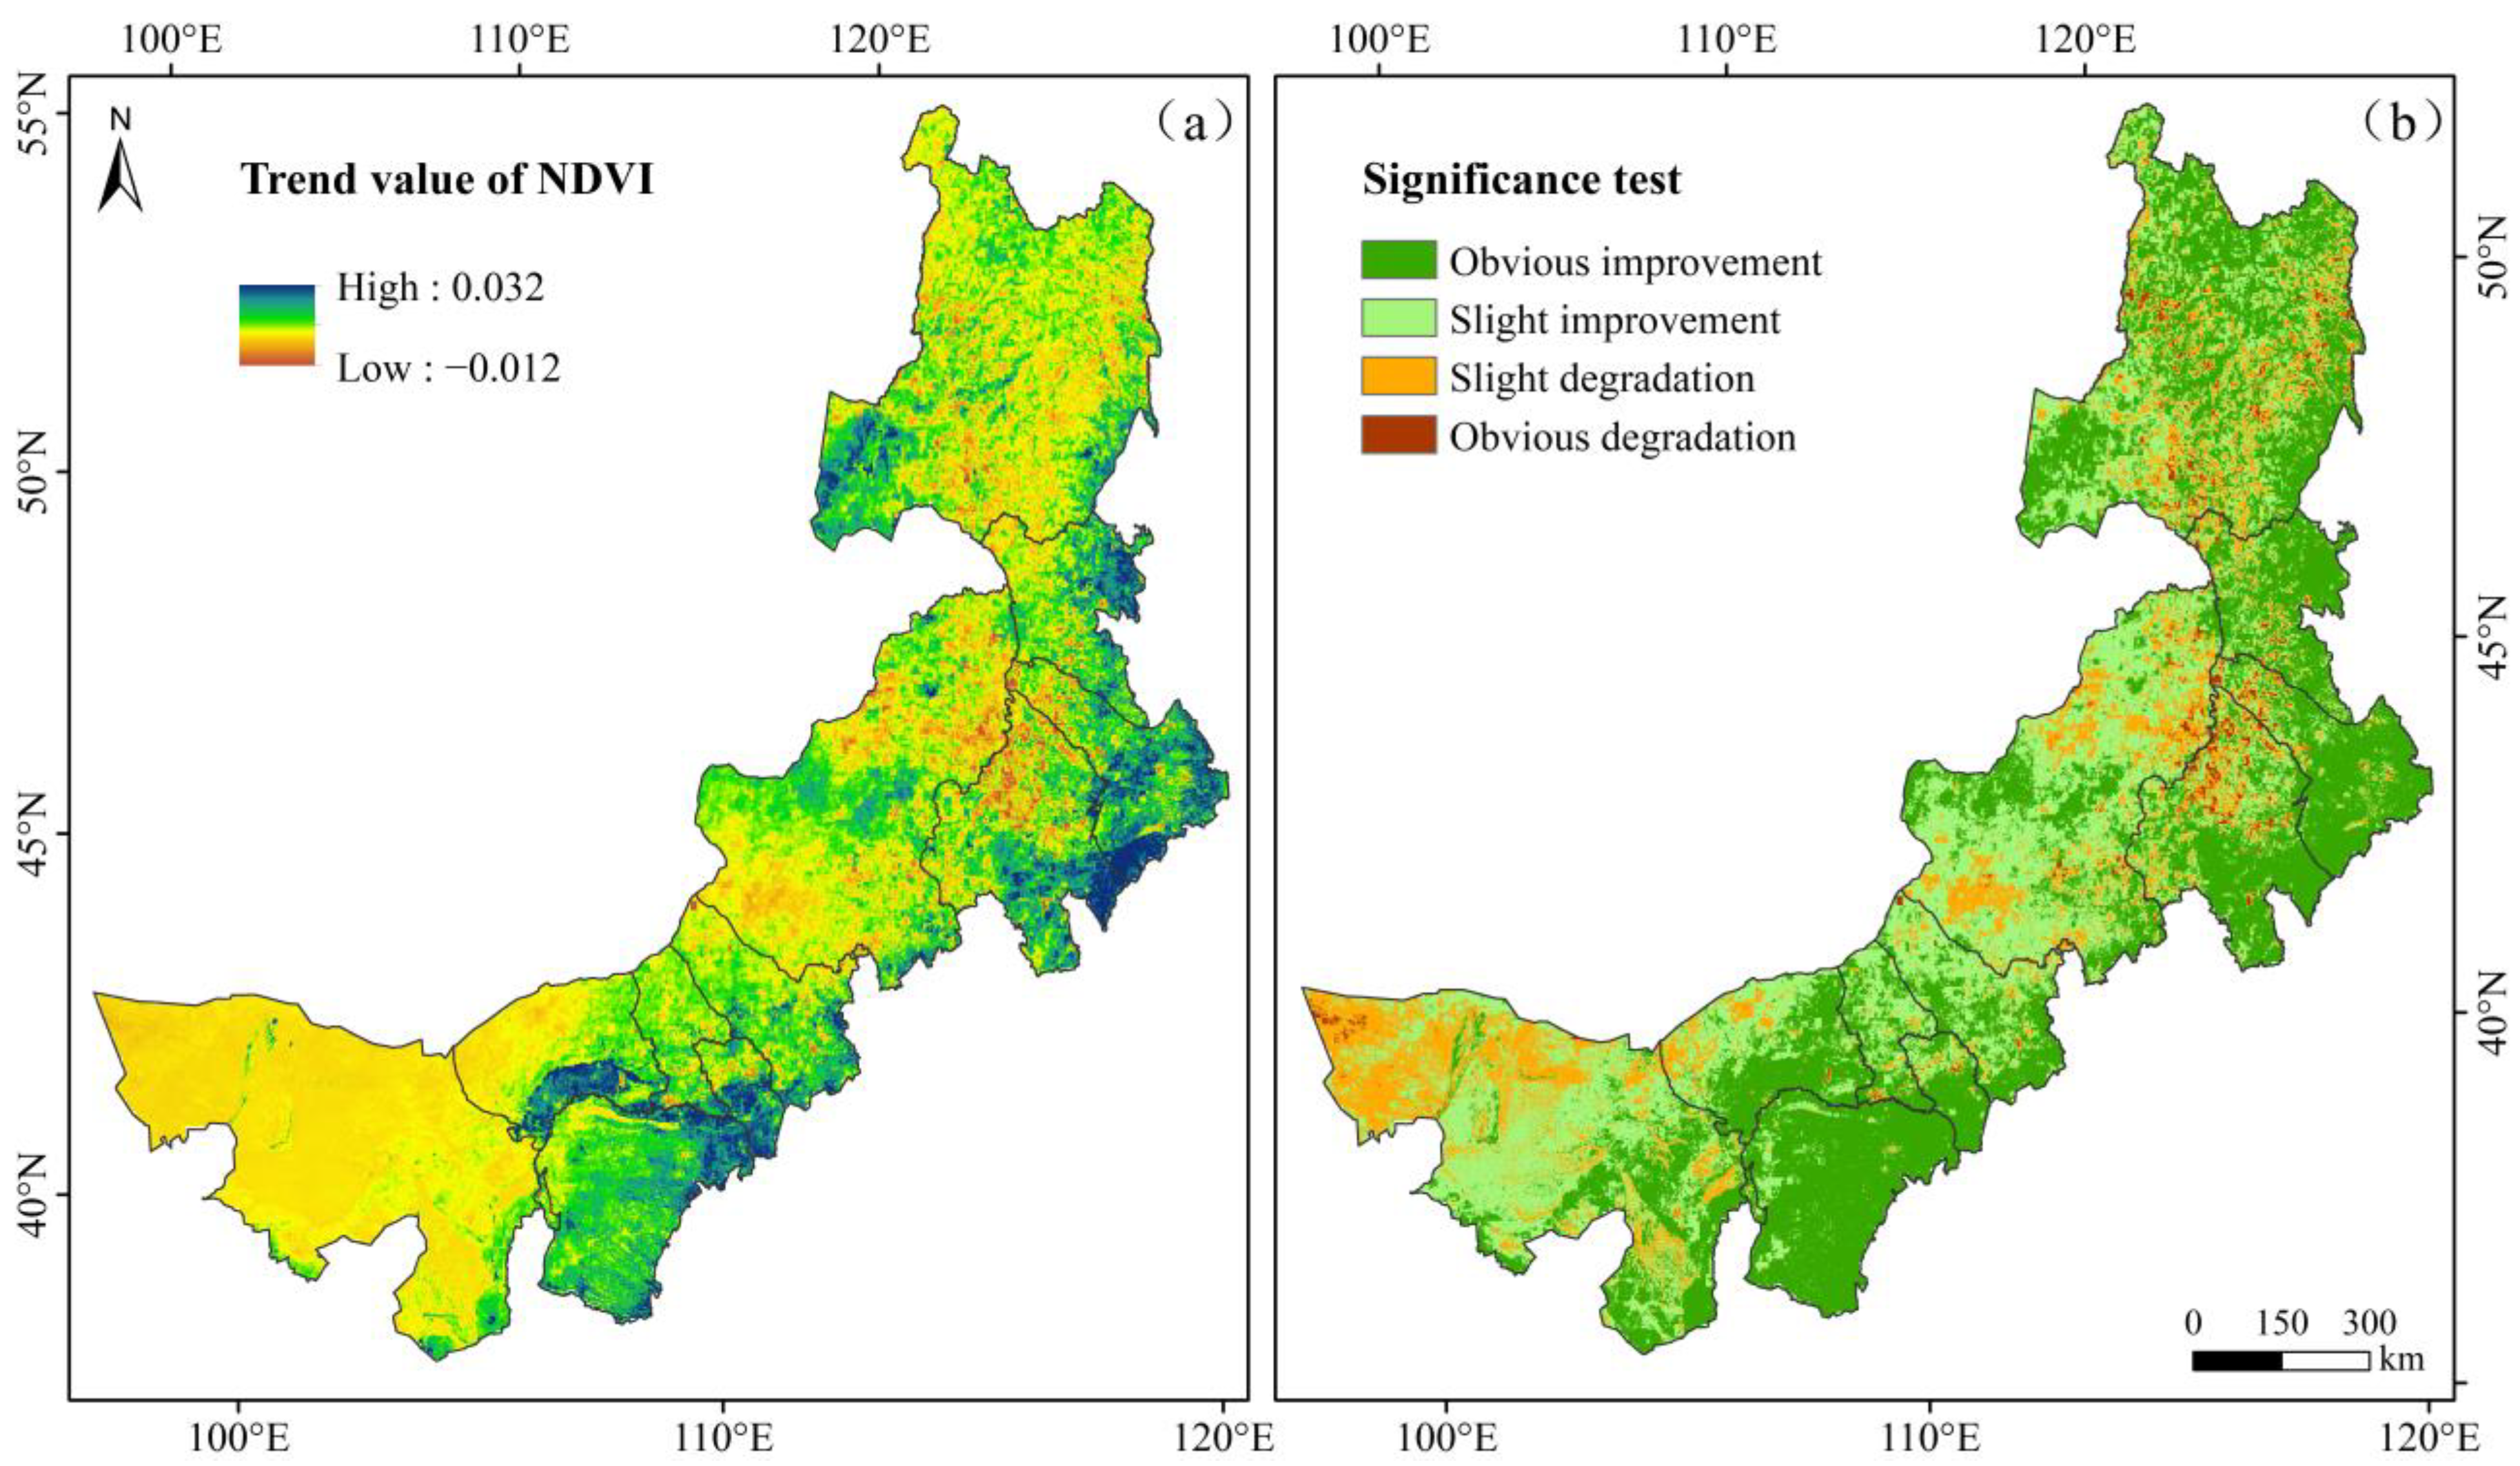
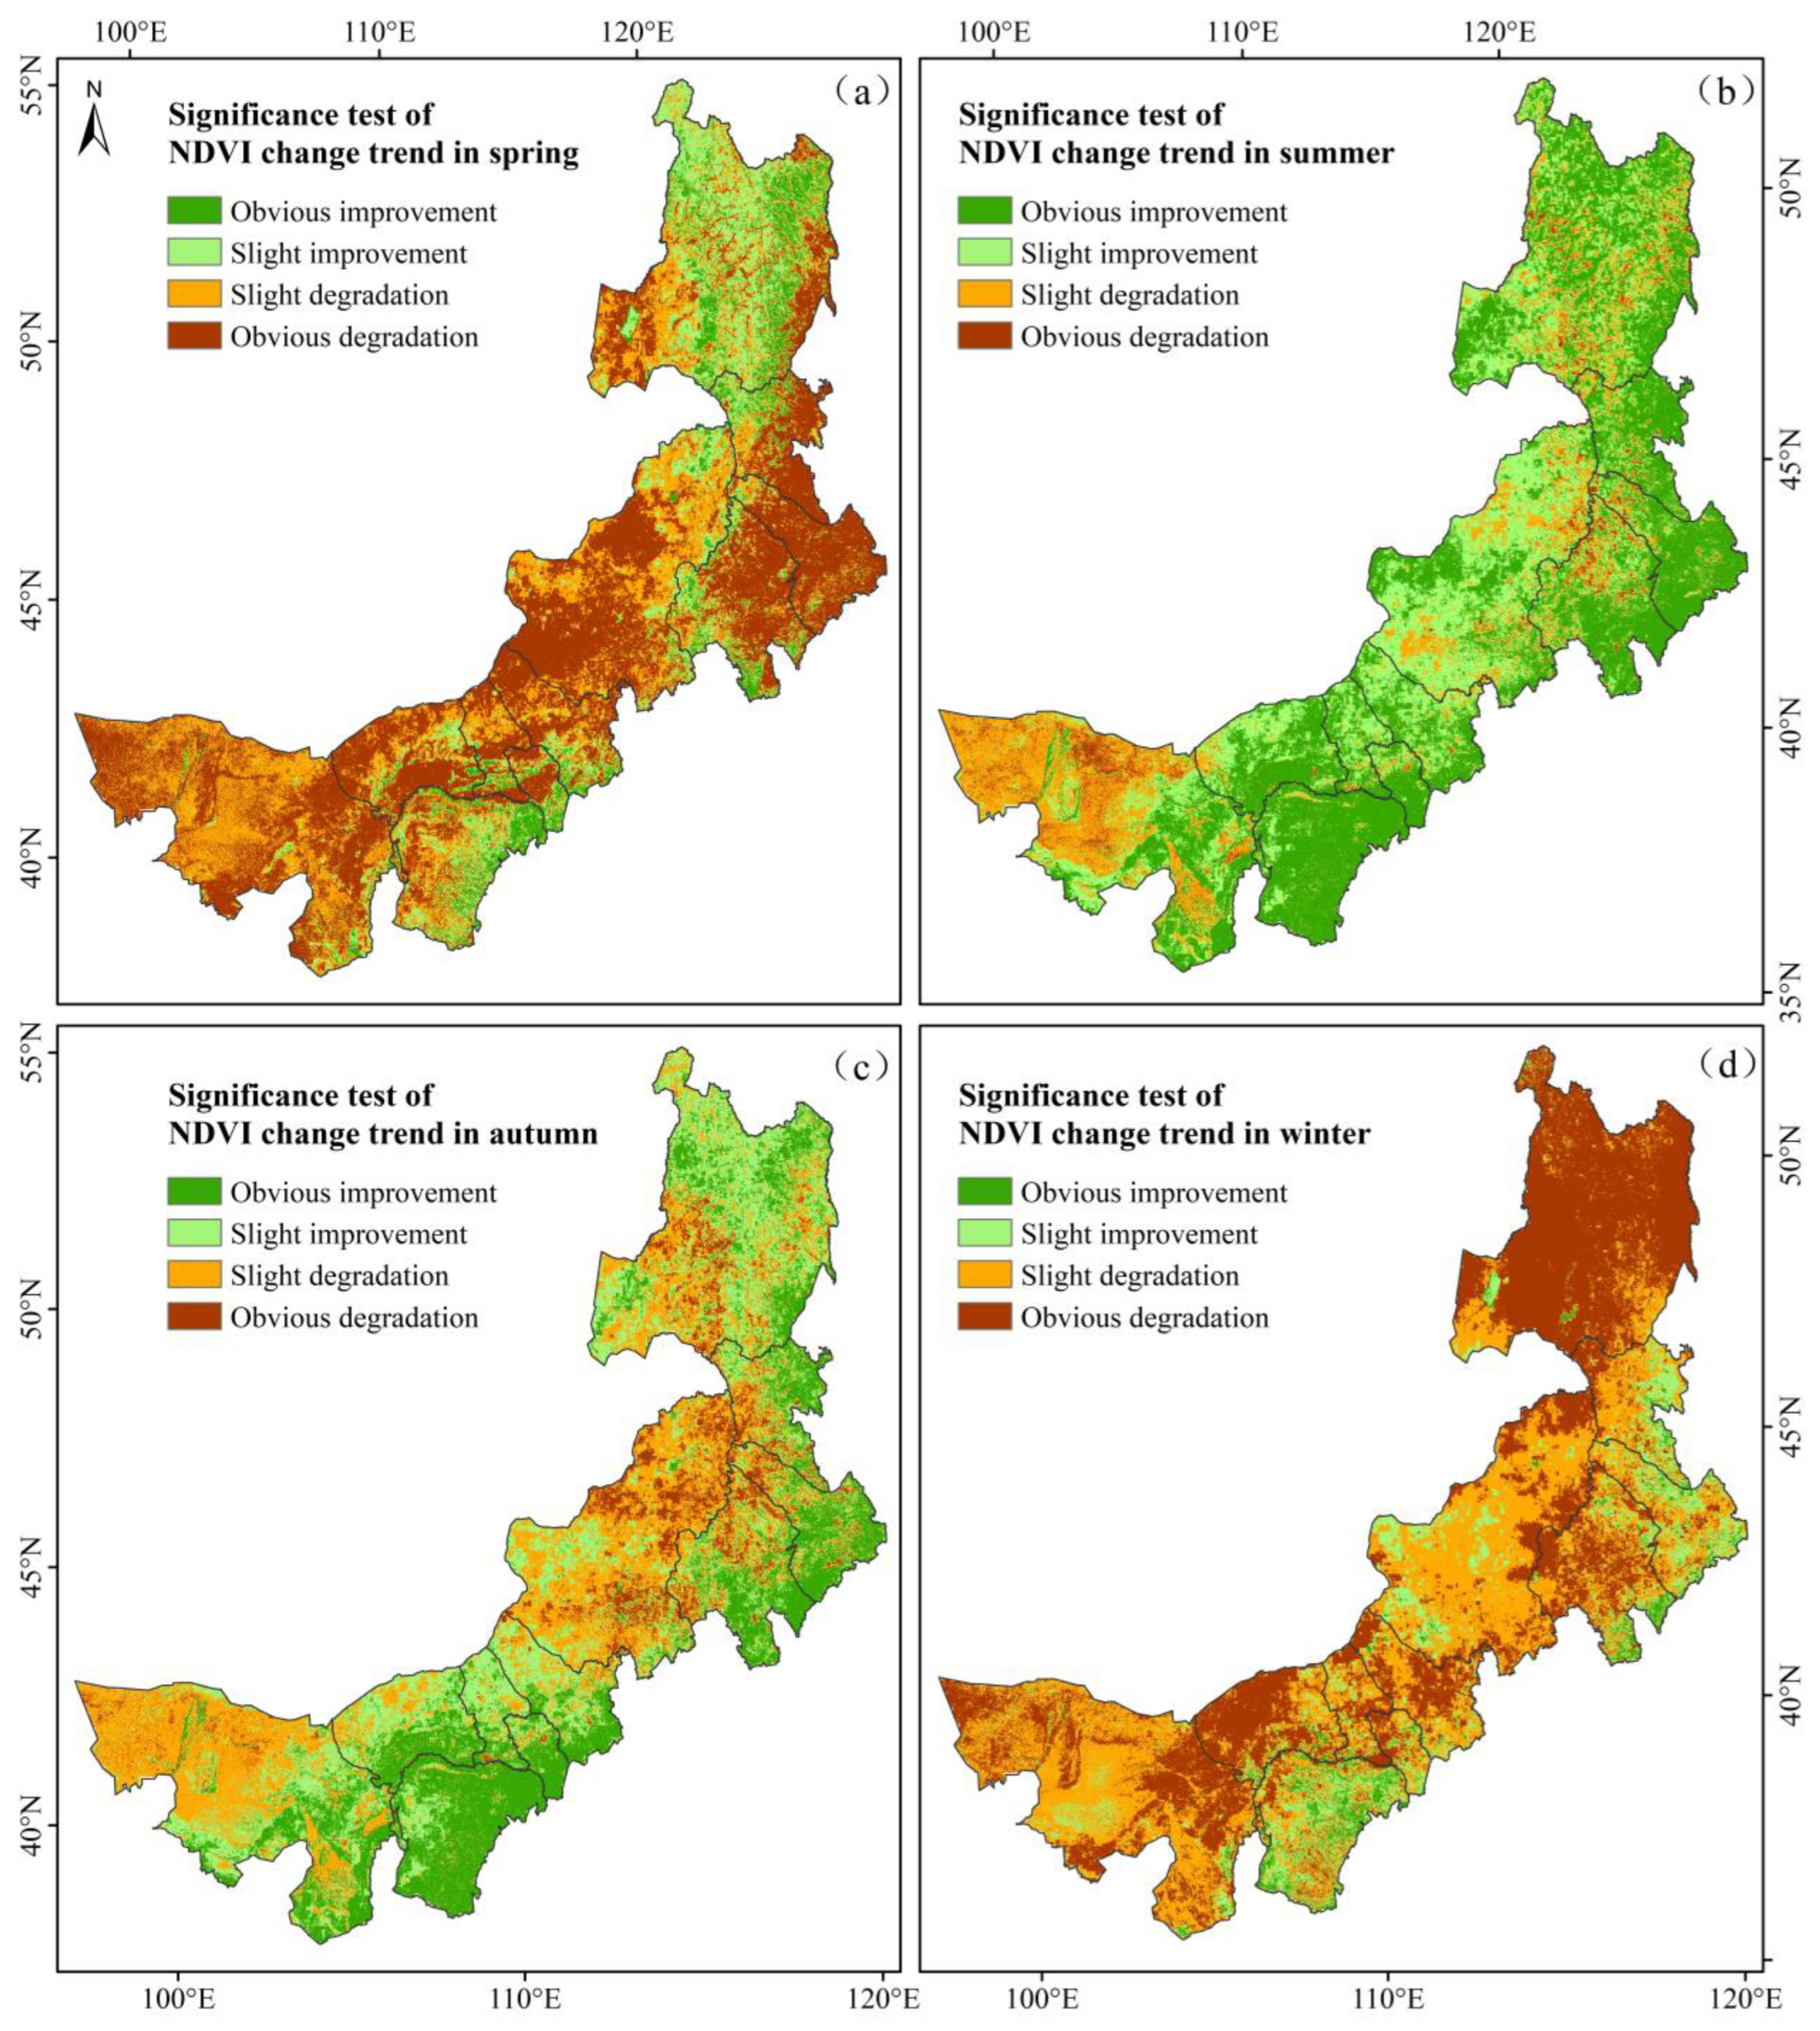
4.2.2. Vegetation Changes in Time and Space

The annual NDVI showed a rising trend, with an average value of 0.45 from 1982 to 2019, indicating that the vegetation status improved throughout this period (Figure 5). Among the 38 years of study, the NDVI values were above average in 14 years, including 1994, 2003, 2005, 2006, 2008, and 2011–2019. The maximum NDVI value appeared in 2018 at 0.51, while the minimum NDVI value appeared in 2001 at 0.41.
Seasonally, from 1982 to 2019, the average NDVI values of spring, summer, autumn, and winter in Inner Mongolia were 0.27, 0.44, 0.377, and 0.12, respectively (Figure 6). On the whole, the vegetation coverage was the highest in summer and the lowest in winter. NDVI in summer and autumn in Inner Mongolia showed a weak rising trend. In spring and winter, NDVI showed a weak declining trend.
The results of the Theil–Sen median trend analysis and Mann–Kendall test were superimposed to study the spatial vegetation variations. The classification and statistics of annual NDVI spatial change trends are shown in Table 3. Areas with rising trends in NDVI changes accounted for 82.4%, while areas with declining trends accounted for only 17.6%. The NDVI changes exhibited rising trends in most areas, corresponding to an improved vegetation status, and 45.1% of the total areas were significantly improved.
The spatial distribution of the annual NDVI change trends (Figure 7) showed that areas with rising NDVI (indicating improved vegetation) were distributed in each prefecture-level city. Obvious vegetation improvement was observed in the Hetao Plain and the eastern study area, while the central region exhibited slight vegetation improvement. The abundant water resources in the Hetao Plain and eastern Inner Mongolia are the reasons for the vegetation improvements. In addition, the execution of ecological construction projects, for instance, returning farmlands to forestlands and grasslands and restoring vegetation in mining areas, has greatly promoted the improvement in vegetation. The northwestern region of Alxa League in western Inner Mongolia, a portion of Xilin Gol League in central Inner Mongolia, and the Daxinganling Mountains to the east all had decreased NDVI, indicating that vegetation degradation had occurred. The Alxa League desert area and overgrazed central grasslands in some areas caused vegetation degradation. The reasons for the vegetation degradation in the Daxinganling Mountains are likely due to its location as a transition zone from a plateau region to a plain region where the ecological environment is fragile, and anthropic activities, such as unreasonable logging measures, have occurred.
The spatial variation in vegetation in each season (Figure 8) and the area proportion of NDVI change trend classification (Table 4) showed that from 1982 to 2019, the spatial distribution of NDVI change trends in Inner Mongolia were quite different in each season. The areas with rising trends of NDVI in spring accounted for 25.1% of the total area, mainly in Hulunbuir and the eastern Ordos. The declining areas were widely distributed, accounting for 74.9% of the total area. The spatial distribution of the change trend of summer NDVI was similar to that of annual NDVI. In autumn, the areas of NDVI with rising trends accounted for 58.1%, and the areas with declining trends accounted for 41.9%. The declining areas were mainly distributed in central and western Inner Mongolia. In winter, NDVI in most regions showed declining trends (83.9%), while the rising areas accounted for only 16.1%, mainly distributed in eastern and southern Inner Mongolia. On the whole, the change trend of NDVI in spring and winter was mainly declining, and it was mainly rising in summer and autumn.
Inner Mongolia is a leading region with regard to the construction of a national ecological civilization. In recent years, the region has effectively implemented a series of ecological projects, such as preventing and controlling sand deposition, returning grazing lands to grasslands, and returning farmlands to forestlands. These projects have promoted an increase in vegetation coverage. However, overgrazing, reclamation, deforestation, and massive mining phenomena are ongoing in some areas. Natural disasters such as diseases, swarms of pests, and forest fires caused either directly or indirectly by the anthropic destruction of forest ecosystems are commonplace, thereby inducing vegetation degradation. Thus, the impacts of human activities should not be underestimated.

4.3. Drought Characteristics in Inner Mongolia from 1982 to 2019

4.3.1. Drought Monitoring Results

Drought occurred when the SPEI values were less than −0.5. The annual drought (SPEI-12) fluctuations (Figure 9) showed that the study area had a humid environment before 1999, followed by drought conditions. The drought conditions in Inner Mongolia showed an aggravating trend, especially after 2000, and the drought frequency increased significantly. During the same time period, Wang et al. [50], An et al. [51], and Qin et al. [52] achieved similar monitoring findings. According to the monitoring of the Inner Mongolia Ecological and Agricultural Meteorological Center, Inner Mongolia experienced severe drought in 2000, 2007, and 2017, which was consistent with the results of this paper.

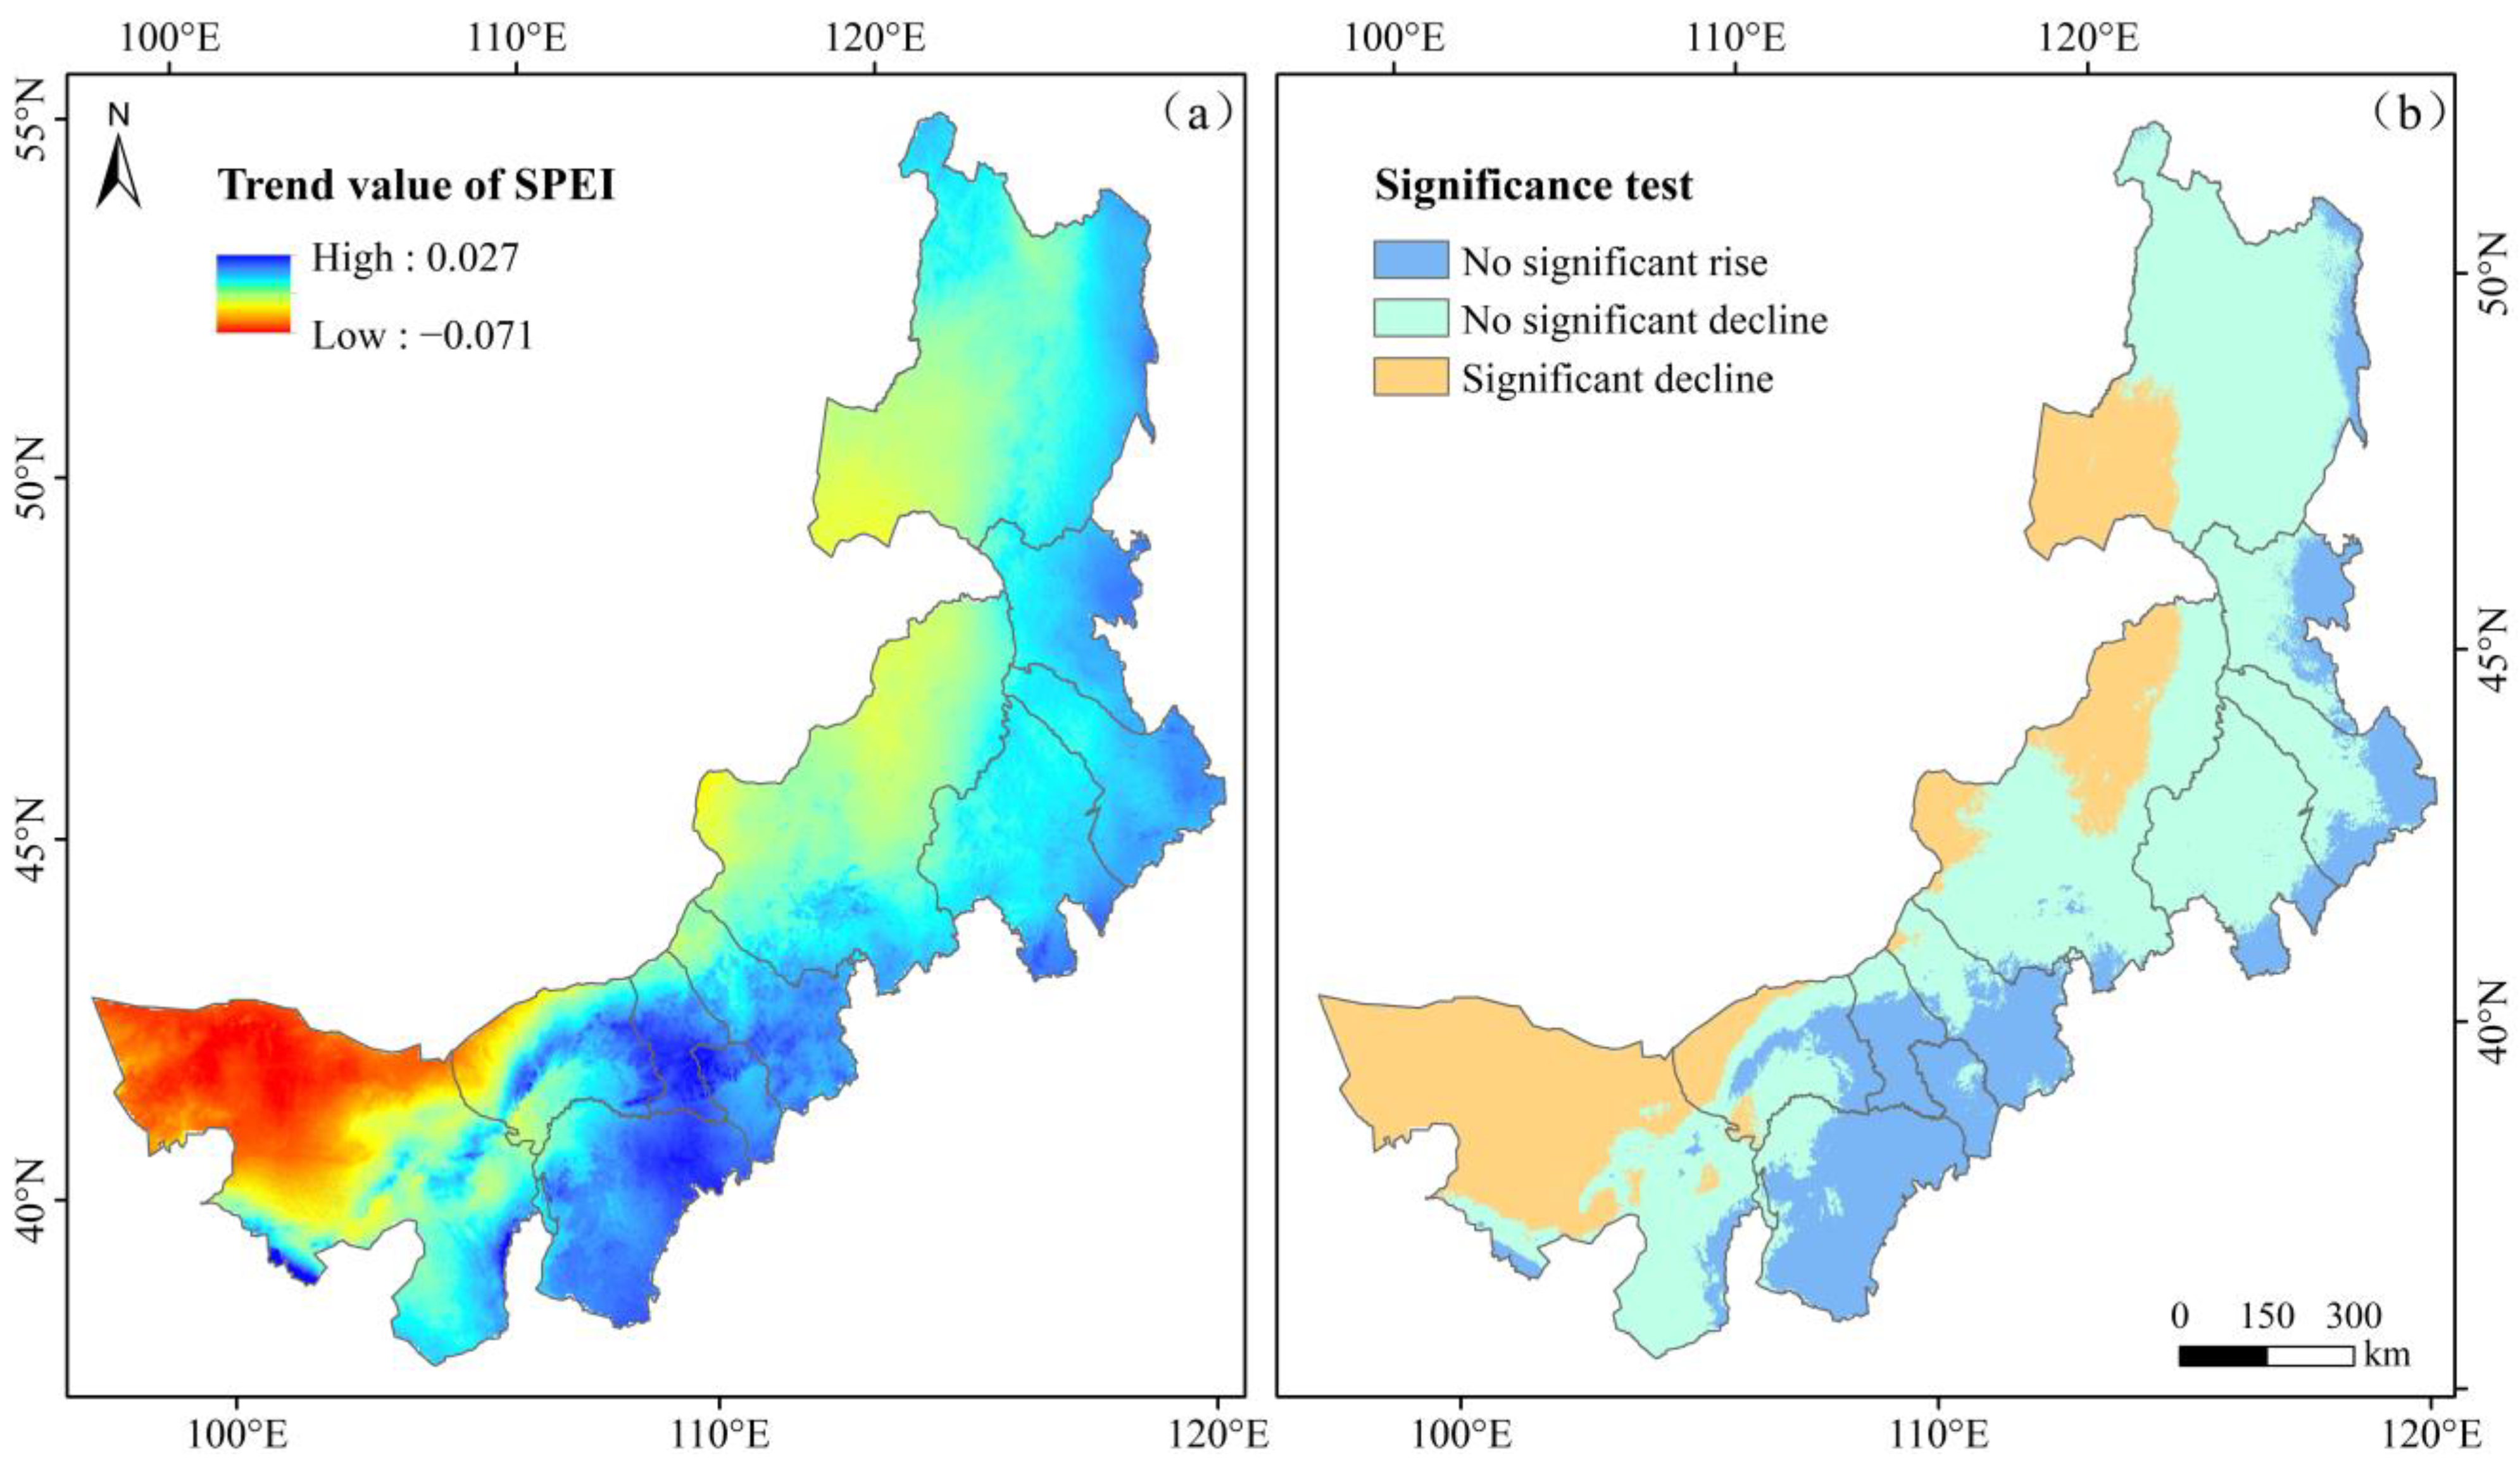
4.3.2. Drought Changes in Time and Space

The maximum SPEI was 1.3 in 1990, and the minimum was −1.45 in 2000 (Figure 10). In 2000, the total precipitation was 239.4 mm, and the average temperature was 3.7. This was the driest year from 1982 to 2019. The annual SPEI showed a declining–fluctuating trend, and the rate was −0.034 per year, meaning that the study area became increasingly arid. A drought event occurred in 1999, followed by droughts from 2000 to 2002, from 2004 to 2007, and in 2009, 2011, and 2017. The drought frequency was approximately 29%.
The annual SPEI change trend and the significance distribution from 1982 to 2019 (Figure 11) showed that the SPEI values ranged from −0.071 to 0.027. A total of 78.5% of the entire area was covered by areas with declining SPEI trends, indicating that most areas tended to be arid, among which 53.1% showed no significant declining trend; that is, the aridity was not obvious in these areas, while the remaining areas showed obvious aridification, including the Inner Mongolia Plateau and the western desert areas. The eastern edge of the study area, Ordos and its surrounding areas, accounted for 21.5% of the overall area with rising SPEI trends, although no portion of this area reached a significant level; that is, humidification was not obvious in any of these areas. The increasing rainfall in the east, the Yellow River water supply project in Ordos, and the implementation of artificial rain in Inner Mongolia all played positive roles in alleviating drought conditions.

4.4. Response of Vegetation to Drought in Inner Mongolia from 1982 to 2019

4.4.1. Correlation between Vegetation Changes and Simultaneous Drought in Inner Mongolia

By calculating the correlation coefficient (r) between NDVI and SPEI for each pixel from 1982 to 2019, the association between vegetation changes and simultaneous drought was discovered. The significance of these correlations was then tested using the p value obtained from the t test, and the significance was separated into four categories (Table 5).
According to the spatial distributions of the correlation coefficient results between NDVI and SPEI (Figure 12a), the range of r is −0.74–0.79. Positive correlation regions covered 63.6% of the research area, whereas negative correlation areas covered 36.4%, indicating that the vegetation status was well correlated with drought. According to Figure 12b, the correlations in 76.1% of the areas with positive correlations were not significant. Most of the areas with a significant correlation were located in the center of the study area, and they appear sporadically in the eastern cities. Grasslands can be found in abundance in these regions. Considering that grasslands have a low tolerance for drought, the occurrence of drought can seriously impact grasslands, causing NDVI to decline. The negatively correlated areas were distributed mainly in the Alxa League and Hetao Plain in western Inner Mongolia and part of Hulunbuir in eastern Inner Mongolia. Hulunbuir featured a diverse range of broad-leaved and coniferous forests, both of which had the ability to strongly resist drought. In addition, these areas are relatively cold, and low temperatures might have a considerable impact on vegetation [53]. The impact of human activities is also greater, whether positive (shelter forest projects) or negative (excessive logging). The Alxa League is a desert area with relatively sparse vegetation and little precipitation. Drought has no obvious impact on vegetation in the area. The vegetation in the Hetao Plain has improved mainly due to anthropic irrigation with water sourced from the Yellow River and ecological restoration projects.
Gu et al. [34] analyzed the impact of drought on vegetation in Inner Mongolia from 1982 to 2015, and pointed out that NDVI was negatively correlated with drought in northern forest areas and western desert areas of Inner Mongolia, and positively correlated with drought in central grassland. The findings are consistent with the results of this study. Based on the meteorological data of 41 stations in Inner Mongolia and GIMMS NDVI, Yang and Yang [33] discussed the response of vegetation to drought from 1982 to 2013. The correlation results of NDVI and SPEI obtained in this study are similar to the above research results in terms of spatial distribution, but the area of positive correlation is 18% lower than it. The difference may be caused by the difference in data spatial resolution and research period.

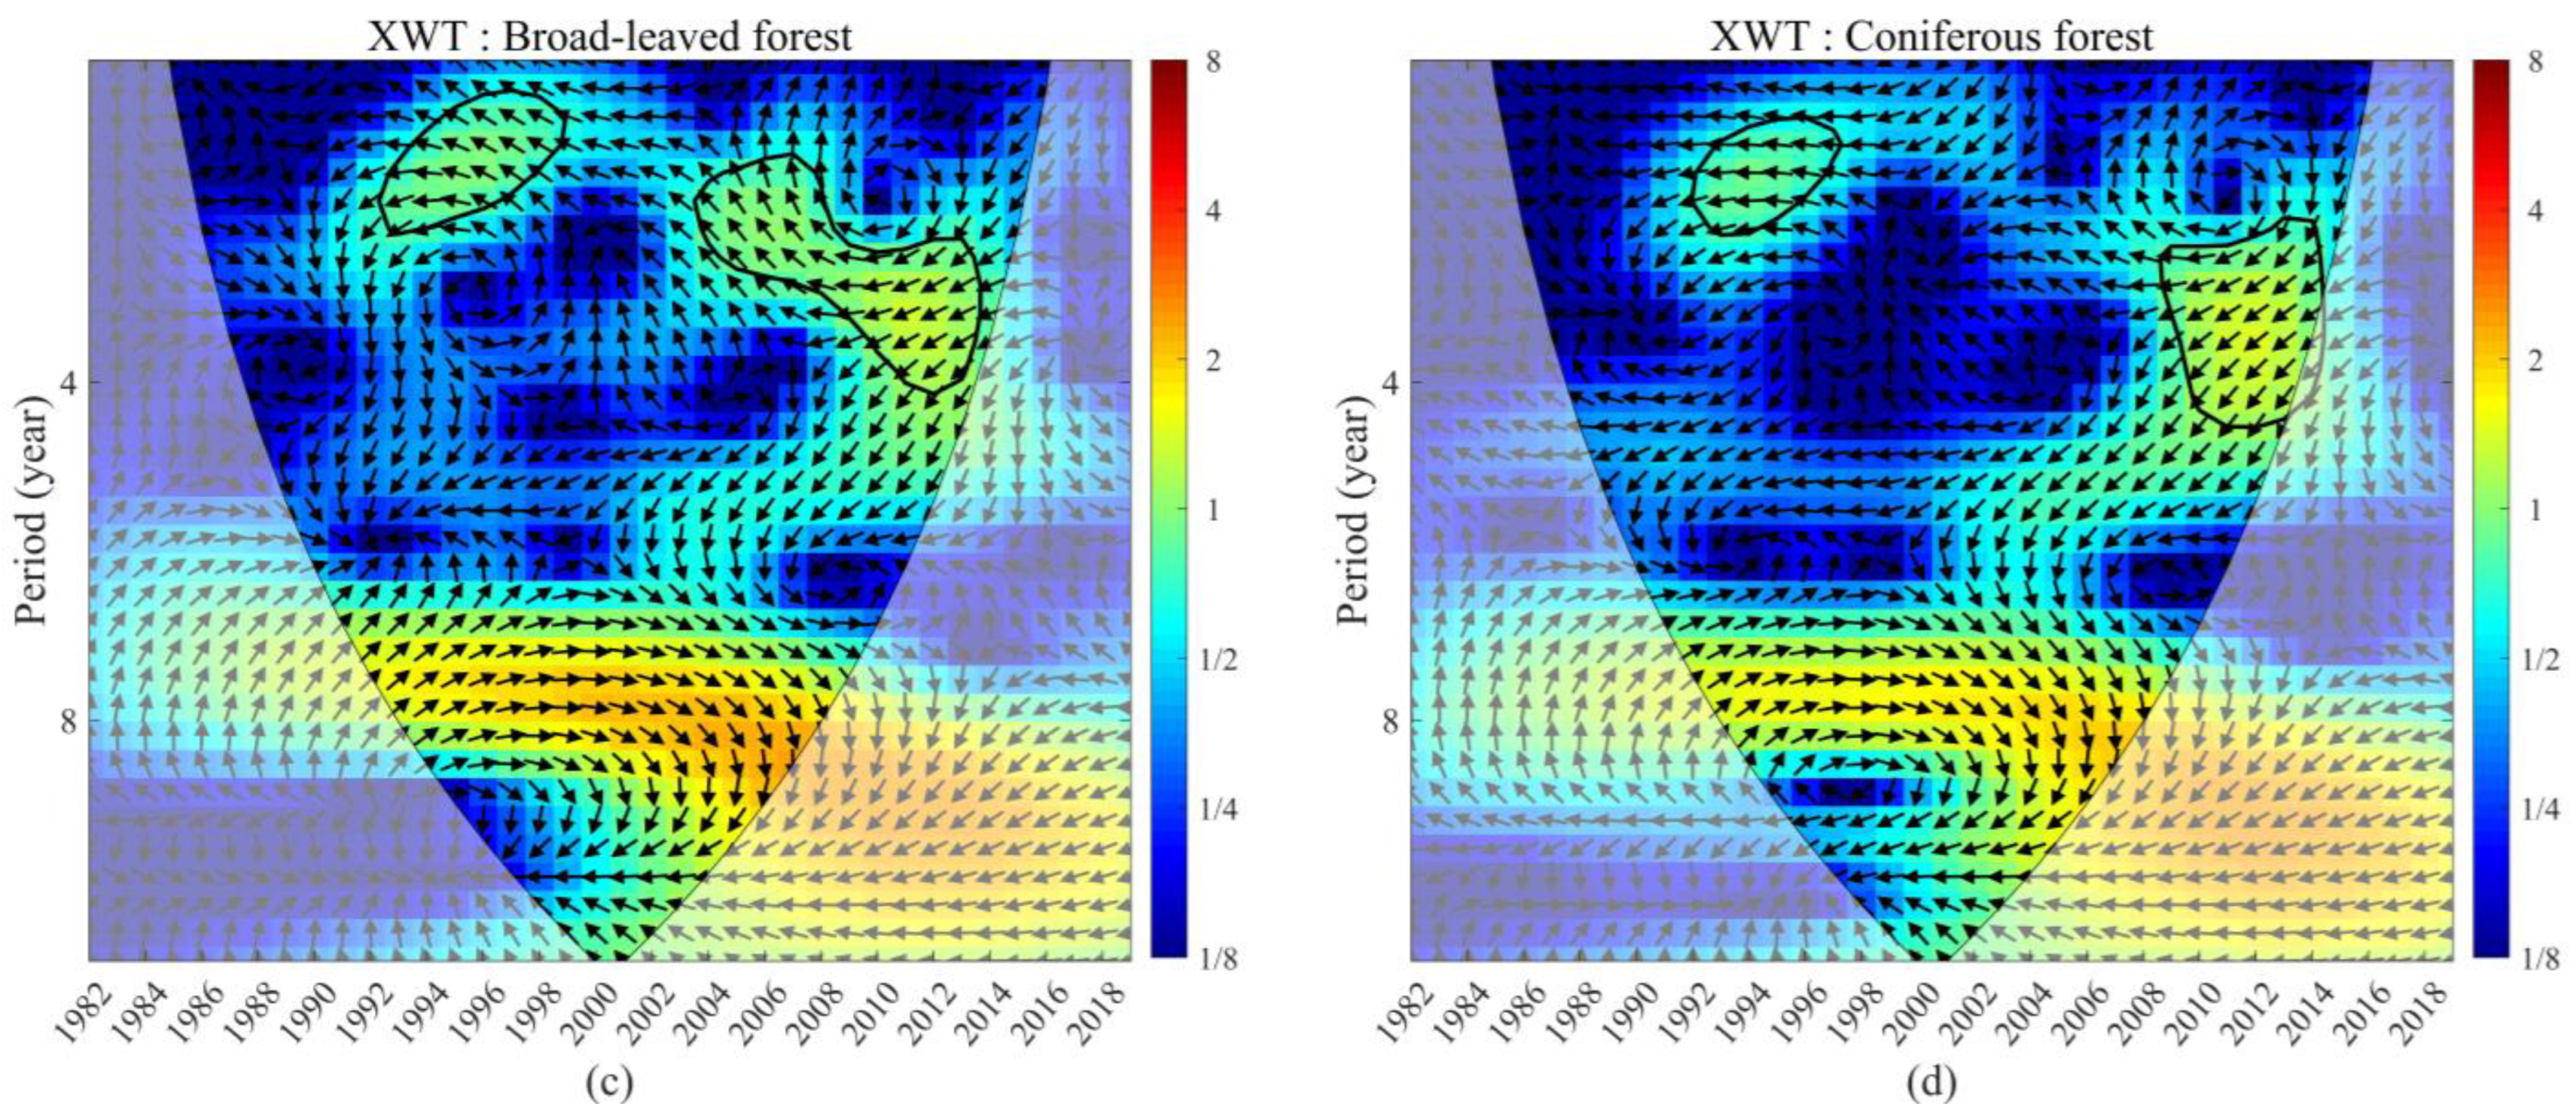
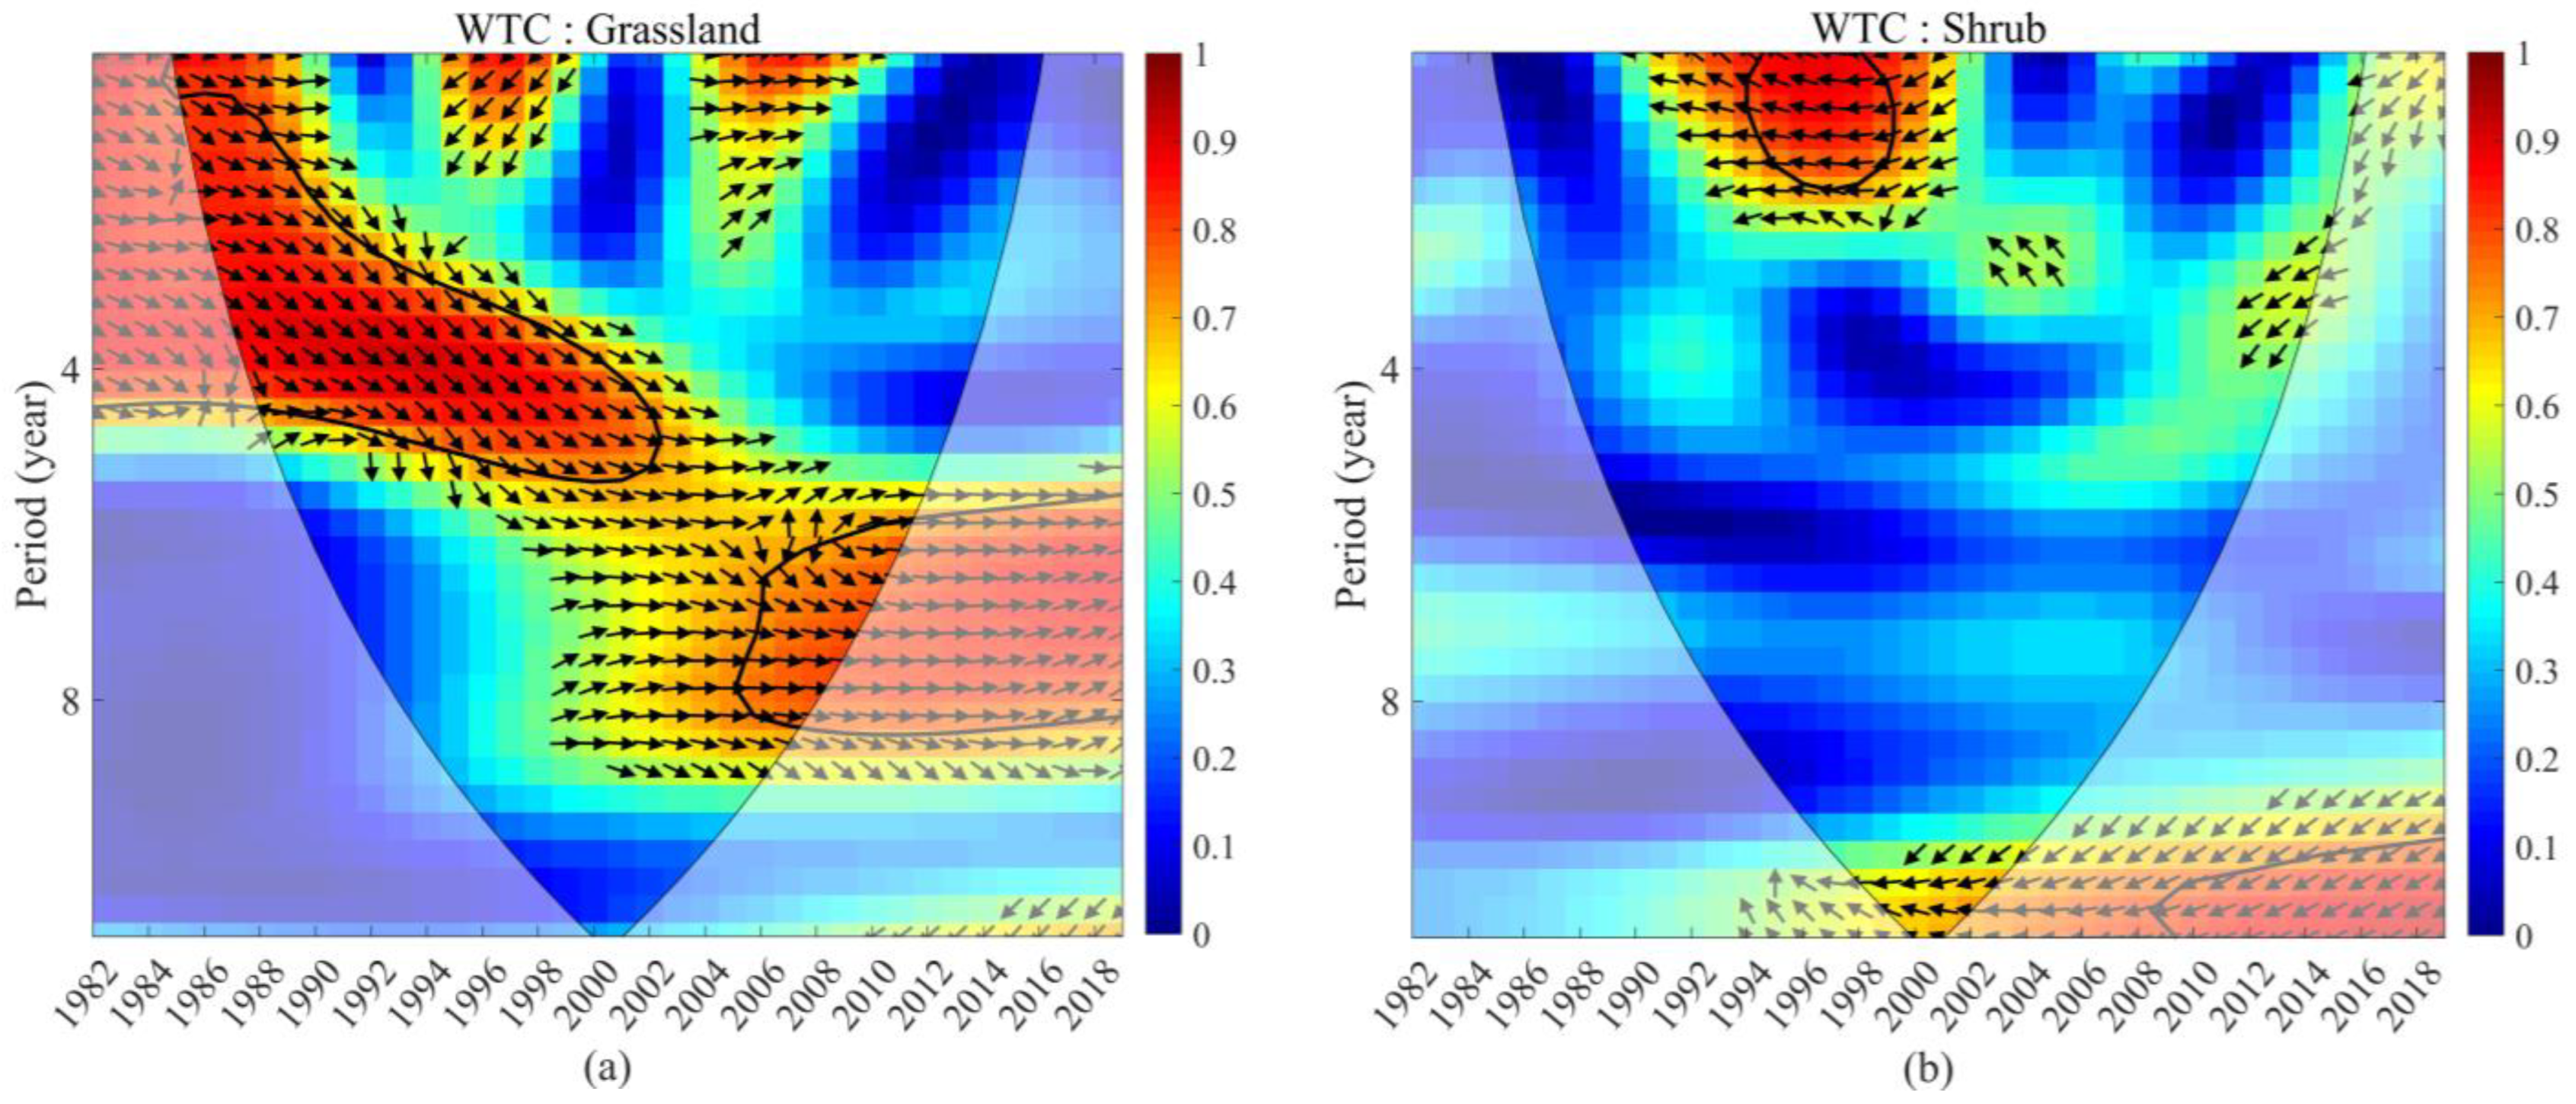
4.4.2. Relationships between Different Vegetation Types and Drought in Eastern Inner Mongolia

The results of Pearson correlation analysis in Section 4.4.1 showed a correlation between NDVI and SPEI, but large differences between different vegetation types were found. Therefore, XWT and WTC were used to further explore the response relationships between different types of vegetation changes and drought.
In the cross wavelet power spectrum and wavelet coherent condensation spectrum of SPEI and NDVI (Figure 13 and Figure 14), the arrows pointing to the right indicate positive correlations between SPEI and NDVI, while the arrows pointing to the left indicate negative correlations. The downward (upward) arrows indicate that SPEI changed 1/4 (3/4) of a cycle ahead of NDVI [54]. The average phase angle can be transformed into a lag time between SPEI and NDVI.
According to Figure 13a, the grassland SPEI and NDVI time series had a significant resonance period of 2.2–3.1 years from 2004 to 2008. The period was mainly in phase during these years. For shrubs, broad-leaved forests, and coniferous forests, the cross wavelet power spectra of SPEI and NDVI were similar and exhibited two significant resonance periods (Figure 13b–d). Figure 14a showed that SPEI had significant coherence with the grassland NDVI in the 5.5–8.3-year period from 2005 to 2011, with a notable positive correlation. The phase differences between SPEI and NDVI from 1985 to 2002 during the 2.3–4.9-year period were 30–45 degrees, meaning that the grassland NDVI lagged behind SPEI by 1–1.5 months. Figure 14b,d shows that SPEI were anti-phase with NDVI of shrubs and coniferous forests in the 2–2.7-year period from 1994 to 2000; that is, these values were significantly negatively correlated. The phase difference between SPEI and NDVI of coniferous forests from 2005 to 2014 in the 3.3–4.9-year period was 135 degrees; that is, NDVI of coniferous forests lagged behind SPEI by 4.5 months. Figure 14c showed that the phase differences between SPEI and NDVI of broad-leaved forests from 1995 to 2004 during the 0–3.1-year period were 210–225 degrees. In other words, NDVI of broad-leaved forests lagged behind SPEI by 7–7.5 months. The resonance periods of SPEI and NDVI of the three types of forestland were all short-lived, exhibiting short-term negative correlations and indicating that drought conditions have relatively little impact on forestlands. However, the phase relationship between the grassland SPEI and NDVI varied little, forming a stable positive correlation and showing that drought had a great influence on grasslands.
Liu et al. [32] analyzed the correlation between vegetation growth and drought in Inner Mongolia from 1998 to 2013, and the results showed that drought had a large impact on vegetation changes in Inner Mongolia, but less impact on eastern forests. When drought occurs, vegetation can reduce water loss by reducing respiration, photosynthesis, and growth rate, so as to adapt to drought stress [55]. Due to the different structures and functions of different vegetation types, their adaptability to the climatic environment is different [14]. Usually, grassland vegetation has small plants, and a shallow root system and is sensitive to external environmental disturbances. When drought reduces the effective water content of the soil, grassland vegetation absorb water with difficulty, and leaves will wilt or even die [56]. Forest vegetation has a large leaf area and deep and developed roots, enabling it to adapt to drought and improve the water storage capacity under drought stress [56]. In addition, the forestland in Inner Mongolia is mainly distributed in the northeastern region. Studies have shown that the temperature in this area has a greater impact on vegetation, and drought events have a small impact on vegetation [53]. Our results of drought impact on vegetation based on wavelet analysis are consistent with the above conclusions.

4.5. Anthropogenic Factors on Forestland in Eastern Inner Mongolia from 1982 to 2019

The results of wavelet analysis showed that in eastern Mongolia, NDVI and SPEI of forestland were negatively correlated. In order to further understand the reasons, we counted the average values of NDVI and SPEI of the pixels where the three types of forestland are located in the eastern part of Inner Mongolia, and made a line graph of changes (Figure 15 and Figure 16).
As shown in the gray shadows in Figure 15 and Figure 16, the forestland NDVI showed a declining trend from 1990 to 1999, when the areas were humidified. In the 1990s, excessive logging and land reclamation in the forested areas of the Daxinganling Mountains caused a considerable loss of forestland resources. Therefore, the main reason for declines in NDVI was the destruction of forestlands by humans. Considering the adverse consequences of overcutting and land reclamation, the first stage of the natural forest protection project was fully completed from 2000 to 2010 [57], as shown by the blue shadows in Figure 15 and Figure 16. During this period, NDVI of forestlands showed a rising trend. Tong et al. [58] pointed out that since 2000, the project of converting farmland to forest in Inner Mongolia has been implemented on a large scale. However, our study found that most of the years were under dry conditions with SPEI values of less than -0.5. Such climatic conditions are not conducive to vegetation growth. However, the vegetation growth from 2000 to 2010 was relatively good, indicating that the national restoration project policy brought some improvements in vegetation coverage. The wavelet analysis results in Section 4.4.2 also revealed that NDVI and SPEI of forestlands were negatively correlated for a short period, mainly due to human activities (positive or negative). In the study of Sun et al. [59], it was pointed out that NDVI and SPEI in the eastern Inner Mongolia were negatively correlated, mainly due to human activities, such as deforestation, man-made fires, and ecological engineering, etc. It is consistent with the findings of this paper.

4.6. Study Limitations

Compared with previous studies, the research period of this paper is longer, the data resolution is higher, and the lag time obtained by time–frequency technology (wavelet analysis) is more accurate. These results can be used as a basis for formulating an ecosystem construction program in Inner Mongolia. However, there are also some limitations.
Firstly, the land surface temperature (LST) affects the energy distribution between the ground and vegetation and determines the surface air temperature [60]. LST is an important factor in global climate change and vegetation growth. Therefore, we should further study the effect of drought on vegetation in combination with surface temperature. Second, we only considered the effects of drought conditions on vegetation due to changes in precipitation and temperature. However, in addition to precipitation and temperature, soil, terrain, human activities, and other factors will also affect vegetation change [61]. According to the results of this study, human activities greatly impact the vegetation in Inner Mongolia. In follow-up research, we should further explore its impact on the vegetation change in combination with multiple influencing factors, especially human activities.

5. Conclusions

This study presents the spatiotemporal characteristics of vegetation and drought in Inner Mongolia from 1982 to 2019. The findings show that NDVI had a rising change trend, showing an improved vegetation status in 82.4% of the study area. The Hetao Plain and the eastern study area had the most obvious vegetation improvement, whereas the middle region had only a slight improvement. SPEI showed declining trends tending toward aridification in 78.5% of the study area. The Inner Mongolia Plateau and the western desert region were the primary areas that witnessed significant aridification.
Based on the relationships between different vegetation and drought in eastern Inner Mongolia, the NDVI and SPEI values of grasslands had a significant positive correlation, while the NDVI values of forestlands (shrubs, broad-leaved forests, and coniferous forests) were negatively correlated with the SPEI values during some short periods of time. These short-period fluctuations in forestland NDVI were related to human activities. XWT and WTC results show that grassland NDVI lagged behind SPEI by 1–1.5 months, coniferous forest NDVI lagged behind SPEI by 4.5 months, and broad-leaved forest NDVI lagged behind SPEI by 7–7.5 months.

Author Contributions

Conceptualization, Y.W., L.Z. and Y.C.; methodology, Y.W., L.Z., Y.C. and X.C.; validation, Y.W.; formal analysis, Y.W., L.Z., Y.C. and X.C.; investigation, Y.W.; resources, L.Z.; data curation, Y.W. and L.Z.; writing—original draft preparation, Y.W.; writing—review and editing, Y.W., L.Z., Y.C., X.C. and H.Y.; funding acquisition, L.Z. All authors have read and agreed to the published version of the manuscript.

Funding

This research was funded by the Beijing Laboratory Project of Water Resources Security (2153001) and the Natural Science Foundation of Beijing Municipality, grant number 8202008.

Data Availability Statement

Not applicable.

Acknowledgments

We thank NASA, the European Space Agency, the Resource and Environmental Science and Data Center of the Chinese Academy of Sciences and the National Qinghai-Tibet Plateau Science Data Center for their generosity in making NDVI, vegetation type, and meteorological data available to the public free of charge.

Conflicts of Interest

The authors declare no conflict of interest.

References

  1. Claussen, M.; Bathiany, S.; Brovkin, V.; Kleinen, T. Simulated climate-vegetation interaction in semi-arid regions affected by plant diversity. Nat. Geosci. 2013, 6, 954–958. [Google Scholar] [CrossRef]
  2. He, G.; Li, Z. Asymmetry of daytime and nighttime warming in typical climatic zones along the eastern coast of China and its influence on vegetation activities. Remote Sens. 2020, 12, 3604. [Google Scholar] [CrossRef]
  3. Zhang, J.; Zhang, L.; Xu, C.; Liu, W.; Qi, Y.; Wo, X. Vegetation variation of mid-subtropical forest based on MODIS NDVI data —A case study of Jinggangshan City, Jiangxi Province. Acta Ecol. Sin. 2014, 34, 7–12. [Google Scholar] [CrossRef]
  4. Tollefson, J. IPCC climate report: Earth is warmer than it’s been in 125,000 years. Nature 2021, 596, 171–172. [Google Scholar] [CrossRef]
  5. Zhang, H.; Xu, C.; Wang, H. Response of vegetation change to meteorological drought in Northwest China from 2001 to 2018. Sci. Geogr. Sin. 2020, 87, 85–98. [Google Scholar]
  6. Fang, W.; Huang, S.; Huang, Q.; Huang, G.; Wang, H.; Leng, G.; Wang, L.; Guo, Y. Probabilistic assessment of remote sensing-based terrestrial vegetation vulnerability to drought stress of the Loess Plateau in China. Remote Sens. Environ. 2019, 232, 111290. [Google Scholar] [CrossRef]
  7. Jiang, W.; Niu, Z.; Wang, L.; Yao, R.; Gui, X.; Xiang, F.; Ji, Y. Impacts of drought and climatic factors on vegetation dynamics in the Yellow River Basin and Yangtze River Basin, China. Remote Sens. 2022, 14, 930. [Google Scholar] [CrossRef]
  8. Zhao, A.; Zhang, A.; Liu, J.; Feng, L.; Zhao, Y. Assessing the effects of drought and "Grain for Green" Program on vegetation dynamics in China’s Loess Plateau from 2000 to 2014. Catena 2019, 175, 446–455. [Google Scholar] [CrossRef]
  9. Rojas, O.; Vrieling, A.; Rembold, F. Assessing drought probability for agricultural areas in Africa with coarse resolution remote sensing imagery. Remote Sens. Environ. 2011, 115, 343–352. [Google Scholar] [CrossRef]
  10. Barbosa, H.A.; Kumar, T.V.L.; Paredes, F.; Elliott, S.; Ayuga, J.G. Assessment of caatinga response to drought using Meteosat-SEVIRI normalized difference vegetation index (2008–2016). ISPRS J. Photogramm. Remote Sens. 2019, 148, 235–252. [Google Scholar] [CrossRef]
  11. Vicente-Serrano, S.M.; Azorin-Molina, C.; Pea-Gallardo, M.; Tomas-Burguera, M.; Domínguez-Castro, F.; Martín-Hernández, N.; Beguería, S.; Kenawy, A.E.; Noguera, I.; García, M. A high-resolution spatial assessment of the impacts of drought variability on vegetation activity in Spain from 1981 to 2015. Nat. Hazards Earth Syst. Sci. 2019, 19, 1189–1213. [Google Scholar] [CrossRef] [Green Version]
  12. Bai, Y.; Yang, Y.; Jiang, H. Intercomparison of AVHRR GIMMS3g, Terra MODIS, and SPOT-VGT NDVI products over the Mongolian Plateau. Remote Sens. 2019, 11, 2030. [Google Scholar] [CrossRef] [Green Version]
  13. Huete, A.; Didan, K.; Miura, T.; Rodriguez, E.P.; Gao, X.; Ferreira, L.G. Overview of the radiometric and biophysical performance of the MODIS vegetation indices. Remote Sens. Environ. 2002, 83, 195–213. [Google Scholar] [CrossRef]
  14. Vicente-Serrano, S.M.; Gouveia, C.; Camarero, J.J.; Beguería, S.; Sanchez-Lorenzo, A. Response of vegetation to drought time-scales across global land biomes. Proc. Natl. Acad. Sci. USA 2013, 110, 52–57. [Google Scholar] [CrossRef] [Green Version]
  15. Li, C.; Filho, W.L.; Yin, J.; Hu, R.; Wang, J.; Yang, C.; Yin, S.; Bao, Y.; Ayal, D. Assessing vegetation response to multi-time-scale drought across inner Mongolia plateau. J. Clean. Prod. 2018, 179, 210–216. [Google Scholar] [CrossRef]
  16. Vicente-Serrano, S.M.; Schrier, G.V.; Beguería, S.; Azorin-Molina, C.; Lopez-Moreno, J.I. Contribution of precipitation and reference evapotranspiration to drought indices under different climates. J. Hydrol. 2015, 526, 42–54. [Google Scholar] [CrossRef] [Green Version]
  17. Guo, H. Determining variable weights for an optimal scaled drought condition index (OSDCI): Evaluation in central Asia. Remote Sens. Environ. 2019, 231, 111220. [Google Scholar] [CrossRef]
  18. Polong, F.; Chen, H.; Sun, S.; Ongoma, V. Temporal and spatial evolution of the standard precipitation evapotranspiration index (SPEI) in the Tana River Basin, Kenya. Theor. Appl. Climatol. 2019, 138, 777–792. [Google Scholar] [CrossRef]
  19. Mahmood-Agha, O.M.A.; Al-Aqeeli, Y.H. Analysis of the standardized precipitation evapotranspiration index over Iraq and its relationship with the Arctic Oscillation Index. Hydrol. Sci. J. 2021, 66, 278–288. [Google Scholar] [CrossRef]
  20. Pei, Z.; Fang, S.; Wang, L.; Yang, W. Comparative analysis of drought indicated by the SPI and SPEI at various timescales in Inner Mongolia, China. Water 2020, 12, 1925. [Google Scholar] [CrossRef]
  21. Boschetti, M.; Nutini, F.; Brivio, P.A.; Bartholome, E.; Stroppiana, D.; Hoscilo, A. Identification of environmental anomaly hot spots in West Africa from time series of NDVI and rainfall. ISPRS J. Photogramm. Remote Sens. 2013, 78, 26–40. [Google Scholar] [CrossRef]
  22. Ji, L.; Peters, A.J. Assessing vegetation response to drought in the northern Great Plains using vegetation and drought indices. Remote Sens. Environ. 2003, 87, 85–98. [Google Scholar] [CrossRef]
  23. Liu, S.; Tian, Y.; Yin, Y.; An, N.; Dong, S. Temporal dynamics of vegetation NDVI and its response to drought conditions in Yunnan Province. Acta Ecol. Sin. 2016, 36, 4699–4707. [Google Scholar]
  24. Cai, S.; Song, X.; Hu, R.; Guo, D. Ecosystem-dependent responses of vegetation coverage on the Tibetan Plateau to climate factors and their lag periods. ISPRS Int. J. Geo-Inf. 2021, 10, 394. [Google Scholar] [CrossRef]
  25. Li, P.; Wang, J.; Liu, M.; Xue, Z.; Liu, M. Spatio-temporal variation characteristics of NDVI and its response to climate on the Loess Plateau from 1985 to 2015. Catena 2021, 203, 105331. [Google Scholar] [CrossRef]
  26. Zhong, S.; Sun, Z.; Di, L. Characteristics of vegetation response to drought in the CONUS based on long-term remote sensing and meteorological data. Ecol. Indic. 2021, 127, 107767. [Google Scholar] [CrossRef]
  27. Zuo, D.; Han, Y.; Xu, Z.; Li, P.; Yang, H. Time-lag effects of climatic change and drought on vegetation dynamics in an alpine river basin of the Tibet Plateau, China. J. Hydrol. 2021, 600, 126532. [Google Scholar] [CrossRef]
  28. Grinsted, A.; Moore, J.C.; Jevrejeva, S. Application of the cross wavelet transform and wavelet coherence to geophysical time series. Nonlinear Processes Geophys. 2004, 11, 561–566. [Google Scholar] [CrossRef]
  29. Kocaaslan, S.; Musaoğlu, N.; Karamzadeh, S. Evaluating drought events by time-frequency analysis: A case study in aegean region of Turkey. IEEE Access 2021, 9, 125032–125041. [Google Scholar] [CrossRef]
  30. Gang, C.; Zhou, W.; Chen, Y.; Wang, Z.; Sun, Z.; Li, J.; Qi, J.; Odeh, I. Quantitative assessment of the contributions of climate change and human activities on global grassland degradation. Environ. Earth Sci. 2014, 72, 4273–4282. [Google Scholar] [CrossRef]
  31. Cao, X.; Liu, Y.; Liu, Q.; Cui, X.; Chen, X.; Chen, J. Estimating the age and population structure of encroaching shrubs in arid/semiarid grasslands using high spatial resolution remote sensing imagery. Remote Sens. Environ. 2018, 216, 572–585. [Google Scholar] [CrossRef]
  32. Liu, S.; Wang, T.; Kang, W.; Guo, Z.; Zhang, X. Vegetation change and its response to drought in InnerMongolia of northern China from 1998 to 2013. Sci. Cold Arid. Reg. 2019, 11, 13. [Google Scholar] [CrossRef]
  33. Yang, S.; Yang, H. Drought evolution and vegetation response in Inner Mongolia from 1982 to 2013. J. Nat. Disasters 2019, 28, 175–183. [Google Scholar]
  34. Gu, X.; Guo, E.; Yin, S.; Wang, Y.; Na, R.; Wan, Z. Assessment of the cumulative and lagging effects of drought on vegetation grouth in Inner Mongolia. Acta Agrestia Sin. 2021, 29, 1301–1310. [Google Scholar]
  35. Qiu, B. Professor Zhu Kezhen’s contribution to climate regionalization of China. Sci. Geogr. Sin. 1990, 10, 7. [Google Scholar]
  36. Holben, B.N. Characteristics of maximum-value composite images from temporal AVHRR data. Int. J. Remote Sens. 1986, 7, 1417–1434. [Google Scholar] [CrossRef]
  37. Peng, S.; Ding, Y.; Liu, W.; Li, Z. 1 km monthly temperature and precipitation dataset for China from 1901 to 2017. Earth Syst. Sci. Data 2019, 11, 1931–1946. [Google Scholar] [CrossRef] [Green Version]
  38. Huth, R. Statistical downscaling of daily temperature in central Europe. J. Clim. 2002, 15, 1731–1742. [Google Scholar] [CrossRef]
  39. Wei, X.; Zhou, Q.; Zhang, J.; Tang, X.; Peng, Z.; Lin, L.; Yang, J. Spatial-temporal changes of NDVI and its influence factors in Guangxi, China during 1982–2016. Mt. Res. 2020, 38, 520–531. [Google Scholar]
  40. Vicente-Serrano, S.M.; Beguería, S.; López-Moreno, J.I. A multiscalar drought index sensitive to global warming: The standardized precipitation evapotranspiration index. J. Clim. 2010, 23, 1696–1718. [Google Scholar] [CrossRef] [Green Version]
  41. Beguería, S.; Vicente-Serrano, S.M.; Fergus, R.; Borja, L. Standardized precipitation evapotranspiration index (SPEI) revisited: Parameter fitting, evapotranspiration models, tools, datasets and drought monitoring. Int. J. Climatol. 2014, 34, 3001–3023. [Google Scholar] [CrossRef] [Green Version]
  42. Thornthwaite, C.W. An approach toward a rational classification of climate. Geogr. Rev. 1948, 38, 55–89. [Google Scholar] [CrossRef]
  43. Sen, K.P. Estimates of the regression coefficient based on kendall’s tau. Publ. Am. Stat. Assoc. 1968, 63, 1379–1389. [Google Scholar] [CrossRef]
  44. Theil, H. A rank-invariant method of linear and polynomial regression analysis. Ned. Akad. Wet. Serise A 1950, 12, 386–392. [Google Scholar] [CrossRef]
  45. Hamed, K.H. Trend detection in hydrologic data: The mann–kendall trend test under the scaling hypothesis. J. Hydrol. 2008, 349, 350–363. [Google Scholar] [CrossRef]
  46. Shao, Y.; Taff, G.N.; Ren, J.; Campbell, J.B. Characterizing major agricultural land change trends in the Western Corn Belt. ISPRS J. Photogramm. Remote Sens. 2016, 122, 116–125. [Google Scholar] [CrossRef] [Green Version]
  47. Sen, A.K.; Kern, Z. Wavelet analysis of low-frequency variability in oak tree-ring chronologies from east Central Europe. Open Geosci. 2016, 8, 478–483. [Google Scholar] [CrossRef] [Green Version]
  48. Torrence, C.; Compo, G.P. A practical guide to wavelet analysis. Bull. Am. Meteorol. Soc. 1998, 79, 61–78. [Google Scholar] [CrossRef] [Green Version]
  49. Li, K.; Gao, P.; Su, T. The schwabe and gleissberg periods in the wolf sunspot numbers and the group sunspot numbers. Sol. Phys. 2005, 229, 181–198. [Google Scholar] [CrossRef]
  50. Wang, Y.; Liu, G.; Guo, E. Spatial distribution and temporal variation of drought in Inner Mongolia during 1901–2014 using Standardized Precipitation Evapotranspiration Index. Sci. Total Environ. 2019, 654, 850–862. [Google Scholar] [CrossRef]
  51. An, Q.; He, H.; Nie, Q.; Cui, Y.; You, J. Spatial and temporal variations of drought in Inner Mongolia, China. Water 2020, 12, 1715. [Google Scholar] [CrossRef]
  52. Qin, Y.; Zhang, T.; Yi, G.; Wei, P.; Yang, D. Remote sensing monitoring and analysis of influencing factors of drought in Inner Mongolia growing season since 2000. J. Nat. Resour. 2021, 36, 459–475. [Google Scholar] [CrossRef]
  53. Mu, S.; Li, J.; Chen, Y.; Gang, C.; Zhou, W.; Ju, W. Spatial differences of variations of vegetation coverage in Inner Mongolia during 2001-2010. Acta Geogr. Sin. 2012, 67, 1255–1268. [Google Scholar]
  54. Chansaengkrachang, K.; Luadsong, A.; Aschariyaphotha, N. A study of the time lags of the Indian Ocean Dipole and rainfall over Thailand by using the cross wavelet analysis. Arab. J. Sci. Eng. 2015, 40, 215–225. [Google Scholar] [CrossRef]
  55. Liu, Y. Impacts of vegetation on drought trends. Chin. J. Atmos. Sci. 2016, 40, 142–156. [Google Scholar]
  56. Jones, J.A.; Creed, I.F.; Hatcher, K.L.; Warren, R.J. Ecosystem processes and human influences regulate streamflow response to climate change at long-term ecological research sites. Bioscience 2012, 62, 390–404. [Google Scholar] [CrossRef] [Green Version]
  57. Zhang, Y.; Liu, X.; Gao, W.; Li, H. Dynamic changes of forest vegetation carbon storage and the characteristics of carbon sink (source) in the Natural Forest Protection Project region for the past 20 years. Acta Ecol. Sin. 2021, 41, 5093–5105. [Google Scholar]
  58. Tong, S.; Zhang, J.; Bao, Y. Spatial and temporal variations of vegetation cover and the relationships with climate factors in Inner Mongolia based on GIMMS NDVI3g data. J. Arid. Land 2017, 9, 394–407. [Google Scholar] [CrossRef] [Green Version]
  59. Sun, Y.; Guo, P.; Yan, X.; Zhao, T. Dynamics of vegetation cover and its relationship with climate change and human activities in Inner Mongolia. J. Nat. Resour. 2010, 25, 407–414. [Google Scholar] [CrossRef]
  60. Shamsudeen, M.; Padmanaban, R.; Cabral, P.; Morgado, P. Spatio-temporal analysis of the impact of landscape changes on vegetation and land surface temperature over Tamil Nadu. Earth 2022, 3, 614–638. [Google Scholar] [CrossRef]
  61. Chen, Z.; Wang, W.; Fu, J. Vegetation response to precipitation anomalies under different climatic and biogeographical conditions in China. Sci. Rep. 2020, 10, 830. [Google Scholar] [CrossRef] [PubMed] [Green Version]
Figure 1. An overview of Inner Mongolia and vegetation type in 2019. (a) shows the geographic location, administrative division, elevation, and distribution of major rivers in Inner Mongolia. Digital elevation model (DEM) data was downloaded from Google Earth Engine (https://earthengine.google.com/, accessed on 11 December 2021). The vector data of administrative boundaries, rivers, and lakes were from China’s 4 million basic geographic database. (b) shows the distribution of vegetation types in 2019 and the three parts according to the “China Meteorological Geographical Division”. The vegetation type data came from the European Space Agency’s global land cover dataset (http://maps.elie.ucl.a-c.be.CCI/viewer, accessed on 11 December 2021). The eastern part is a typical area for exploring the response of different types of vegetation to drought.
Remotesensing 14 03803 g001
Figure 2. Flowchart of the methods used in this study. In the figure, TR represents temporal resolution and SR represents spatial resolution. Parallelograms represent datasets and rectangles represent research methods.
Remotesensing 14 03803 g002
Figure 3. Comparison between the downscaled NDVI and SPOT-VGT NDVI data in 1999 using the Pearson correlation coefficient. Black points are 1000 randomly selected pixels, and the red line is the fitting line. The fitting line equation is y = 0.93x + 0.027, p < 0.05.
Remotesensing 14 03803 g003
Figure 4. Spatial distribution of the average NDVI values (a) and its grading (b) in Inner Mongolia from 1982 to 2019.
Remotesensing 14 03803 g004
Figure 5. Change trend of the annual NDVI over time. The black points are the average value of NDVI of Inner Mongolia in each year. The red line is the trend fitting line. The slope of the trend line is 0.0015, p < 0.05.
Remotesensing 14 03803 g005
Figure 6. Change trend of NDVI in four seasons over time. The slopes of trend lines in spring, summer, autumn, and winter are −0.00076, 0.00152, 0.00054, and −0.00095, respectively (p < 0.05).
Remotesensing 14 03803 g006
Figure 7. Change trends and significance tests of the annual NDVI in space in Inner Mongolia. (a) shows the 38-year NDVI change trend values in Inner Mongolia calculated by Theil–Sen median trend analysis. Values greater than 0 represent vegetation improvement, and values less than 0 represent vegetation degradation. (b) are the results from superposition of the Theil–Sen trend analysis and the Mann–Kendall test, showing the significance of vegetation change trends.
Remotesensing 14 03803 g007
Figure 8. Significance tests of NDVI spatial change trend in four seasons in Inner Mongolia. (ad) represent spring, summer, autumn, and winter, respectively.
Remotesensing 14 03803 g008
Figure 9. SPEI-12 fluctuations in Inner Mongolia. The gradient color block represents the change of SPEI-12. Blue indicates wetting and orange indicates aridity. The blue dotted line indicates an SPEI value of −0.5, which is the boundary between drought conditions and non-drought conditions. The red dotted line indicates severe drought.
Remotesensing 14 03803 g009
Figure 10. Change trend of SPEI over time. The blue bar chart is the long-term average value of SPEI in Inner Mongolia. The red line is the trendline. The slope of the trend line is −0.034, p < 0.05. The black dotted line is the threshold for drought occurrence.
Remotesensing 14 03803 g010
Figure 11. Change trends and significance tests of SPEI in space in Inner Mongolia. (a) shows the 38-year SPEI change trend values in Inner Mongolia calculated by the Theil–Sen median trend analysis. Values greater than 0 represent wetting, and values less than 0 represent aridity. (b) are the results from the superposition of the Theil–Sen trend analysis and the Mann–Kendall test, showing the significance of drought change trends.
Remotesensing 14 03803 g011
Figure 12. The correlation and corresponding significance between NDVI and SPEI in Inner Mongolia. (a) shows the correlation coefficient between NDVI and SPEI for 38 years in Inner Mongolia using Pearson correlation analysis. (b) are the results from the superposition of the correlation coefficient and t test showing the significance of the correlation between vegetation and drought.
Remotesensing 14 03803 g012
Figure 13. XWT power spectrum results of SPEI and NDVI of grasslands (a), shrubs (b), broad-leaved forests (c), and coniferous forests (d). The red and blue regions in the figures indicate the peak and valley values of energy density, respectively. The color shades represent the relative changes in energy density. The values enclosed within the thick black solid contour represent those that passed the red noise test at the 95% confidence level, while the conical area within the thin black solid line is the cone of influence (COI).
Remotesensing 14 03803 g013aRemotesensing 14 03803 g013b
Figure 14. WTC condensation spectrum results of SPEI and NDVI of grasslands (a), shrubs (b), broad-leaved forests (c), and coniferous forests (d). The meanings of the colors, lines, and areas are the same as those in Figure 13.
Remotesensing 14 03803 g014aRemotesensing 14 03803 g014b
Figure 15. NDVI change trends of three forestlands in eastern Inner Mongolia. The gray highlights the period of excessive logging in the Daxinganling Mountains in the 1990s, and the blue highlights the construction period of the first stage of the natural forest protection project.
Remotesensing 14 03803 g015
Figure 16. SPEI change trends of three forestlands in eastern Inner Mongolia. The meanings of the gray and blue backgrounds are the same as those in Figure 15. The black dotted line is the threshold for drought occurrence.
Remotesensing 14 03803 g016
Table 1. Classification of drought levels.
TypeSPEI
No drought>−0.5
Mild drought−0.5~−1
Moderate drought−1~−1.5
Severe drought−1.5~−2
Extreme drought<−2
Table 2. Grade of vegetation coverage.
NDVIGrade
NDVI > 0.6High vegetation coverage
0.3 < NDVI < 0.6Medium vegetation coverage
0.1 < NDVI < 0.3Low vegetation coverage
NDVI < 0.1No vegetation coverage
Table 3. Classification and area proportion statistics of the NDVI change trends.
βZ ValueNDVI Change TrendProportion of the Study Area (%)
β > 0|Z| > 1.96Significant rise (obvious improvement)45.1
β > 0|Z| ≤ 1.96No significant rise (slight improvement)37.3
β < 0|Z| ≤ 1.96No significant decline (slight degradation)16.0
β < 0|Z| > 1.96Significant decline (obvious degradation)1.6
Table 4. Classification and area proportion statistics of the NDVI change trends in four seasons.
NDVI Change TrendProportion of the Study Area (%)
SpringSummerAutumnWinter
Significant rise (obvious improvement)8.145.727.23.5
No significant rise (slight improvement)17.031.030.912.6
No significant decline (slight degradation)29.918.932.939.9
Significant decline (obvious degradation)45.04.49.044.0
Table 5. Classification of correlations.
rp ValueClassification
r > 0p < 0.05Significant positive correlation
r > 0p ≥ 0.05No significant positive correlation
r < 0p ≥ 0.05No significant negative correlation
r < 0p < 0.05Significant negative correlation
Publisher’s Note: MDPI stays neutral with regard to jurisdictional claims in published maps and institutional affiliations.

