Article

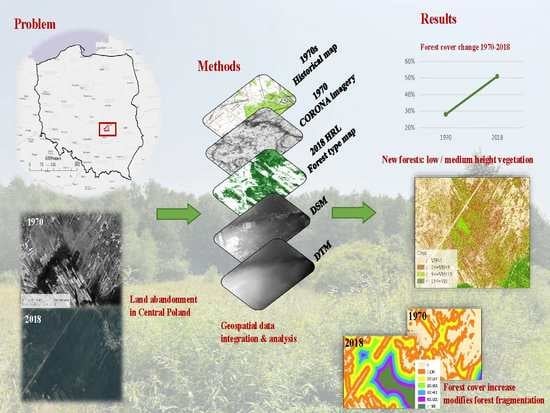
The Substantial Increase of Forest Cover in Central Poland Following Extensive Land Abandonment: Szydłowiec County Case Study

Institute of Geography and Spatial Management, Faculty of Geography and Geology, Jagiellonian University, Gronostajowa 7, 30-387 Krakow, Poland
*
Author to whom correspondence should be addressed.
Remote Sens. 2022, 14(16), 3852; https://doi.org/10.3390/rs14163852
Submission received: 29 June 2022 / Revised: 29 July 2022 / Accepted: 8 August 2022 / Published: 9 August 2022

Abstract

:
Nowadays, Poland is one of the European countries most affected by agricultural land abandonment (ALA). Though considered to be a negative phenomenon, ALA opens up several options for planning future land uses critical for biodiversity conservation or future carbon sequestration. So far, many studies of ALA have been done in the mountainous areas in Poland, but less is known about the magnitude of ALA in other regions. In this paper we use the declassified CORONA satellite imagery (1969) to backdate the information on land cover and land abandonment from topographic maps from 1970s for the region located in central Poland and currently affected by widespread ALA. The information from archival materials is compared with current High-Resolution Layers and airborne laser scanning products, indicating that a forest cover increase of 23% was observed. The output of vegetation height analysis confirmed significant land use transformation from non-forest and ALA into forest area. Additionally, analysis of forest pattern change revealed that although forest core areas have increased since 1970, its share in total forest cover decreased due to newly established small forest patches. Our research shows the importance of archival remote sensing materials and indicates their role in understanding ALA-related forest cover change in Poland over the last 50 years.

Graphical Abstract

1. Introduction

In various regions of the world, agricultural lands have undergone extensive transformation to forests in the regions with suitable climate [1], especially since the 1900s when this trend appeared in many European countries [2]. Such an increase in forest cover in areas formerly used in agriculture is commonly the final outcome of the cessation of agricultural activities referred to agricultural land abandonment (ALA) [3]. In Europe, the highest ALA rate has been seen in the Mediterranean, and Central and Eastern Europe [4]. In Eastern Europe, agricultural areas have diminished considerably since the early 1990s due to the collapse of communism in the region [5], and various subsequent political, social and economic changes making many farms unprofitable. Only in Poland, the census detailed that between 1990 and 2019, agricultural land efficiency declined by 21% [6]. Following the transition to a market economy, farmers stopped cultivating fields, and vegetation succession began to occur [7]. As the agricultural land is still the most important type of land use in Europe, with 34% cropland and 14% for grassland [8], its abandonment and gradual conversion to forests affects therefore many hectares with linked implications [9,10], providing also a chance to create new ecosystems and opportunities for new land uses, diversification, re-design of existing landscapes, the promotion of rewilding and the management of succession of less-productive land area [11,12].
ALA is a compound process with interconnected economic, environmental and social aspects [13] with several positive and negative consequences in human life and environment [14,15]. One of the positive consequences of ALA and subsequent forest re-growth is the temporary increase in biodiversity [16]. However, ALA has also several negative impacts on the environment and society, such as soil erosion or decreasing food supply [4]. ALA and the resulting restoration of vegetation cover considerably alter also rural land use patterns, the agricultural landscape, and farmers’ livelihoods [4], interrupting agricultural management in typically fragmented land located in marginal areas [6]. Due to its significance for land use, assessments of ALA play a significant role in sustainable agricultural resources and forestry management, contributing to a better understanding of the determinants of land-use change and future agricultural policies development [12].
Monitoring the spatial pattern of ALA is still not sufficient [17]. It remains difficult as ALA tangible land cover effects may not be clearly visible in the landscape for some time, making the assessment and evaluation of ALA over wide spatial scales hard due to its complicated characteristics and specificity [6,12]. Currently, several data acquisition technologies are used to assess land cover changes resulting from ALA, for instance airborne laser scanning (ALS) data and high or very high-resolution satellite and airborne image data [18]. Also historical maps processed with Geographic Information Systems (GIS) tools are used to assess long-term forest cover changes and conclude about potential ALA effects [19]. Yet analysis over large areas with historical maps is still generally uncommon, since it requires broad relevant experience and is a time-consuming process [20,21].
Detailed assessments of ALA were so far mainly conducted in either marginal (e.g., mountain) or suburban areas [22,23,24], while less is known on ALA rates in areas with formerly dominant agricultural function, which have experienced slow depopulation [24] and, at some point in time, have started to cope with declining profitability of agriculture. This research aimed therefore to assess agricultural land abandonment in a study area located in central Poland and over the last 50 years, where agriculture used to be one of the dominant sectors of economy in the past, to quantify related changes of landscape pattern and to test various datasets that potentially allow long-term ALA quantification and characterization. Except for maps, the research explores a range of geospatial data that have recently been made available (e.g., high-resolution satellite data, satellite data products, Digital Elevation and Surface Models), attempting to provide a more nuanced image of land cover change, when compared to many of previous studies based on categorical historical maps.

2. Materials and Methods
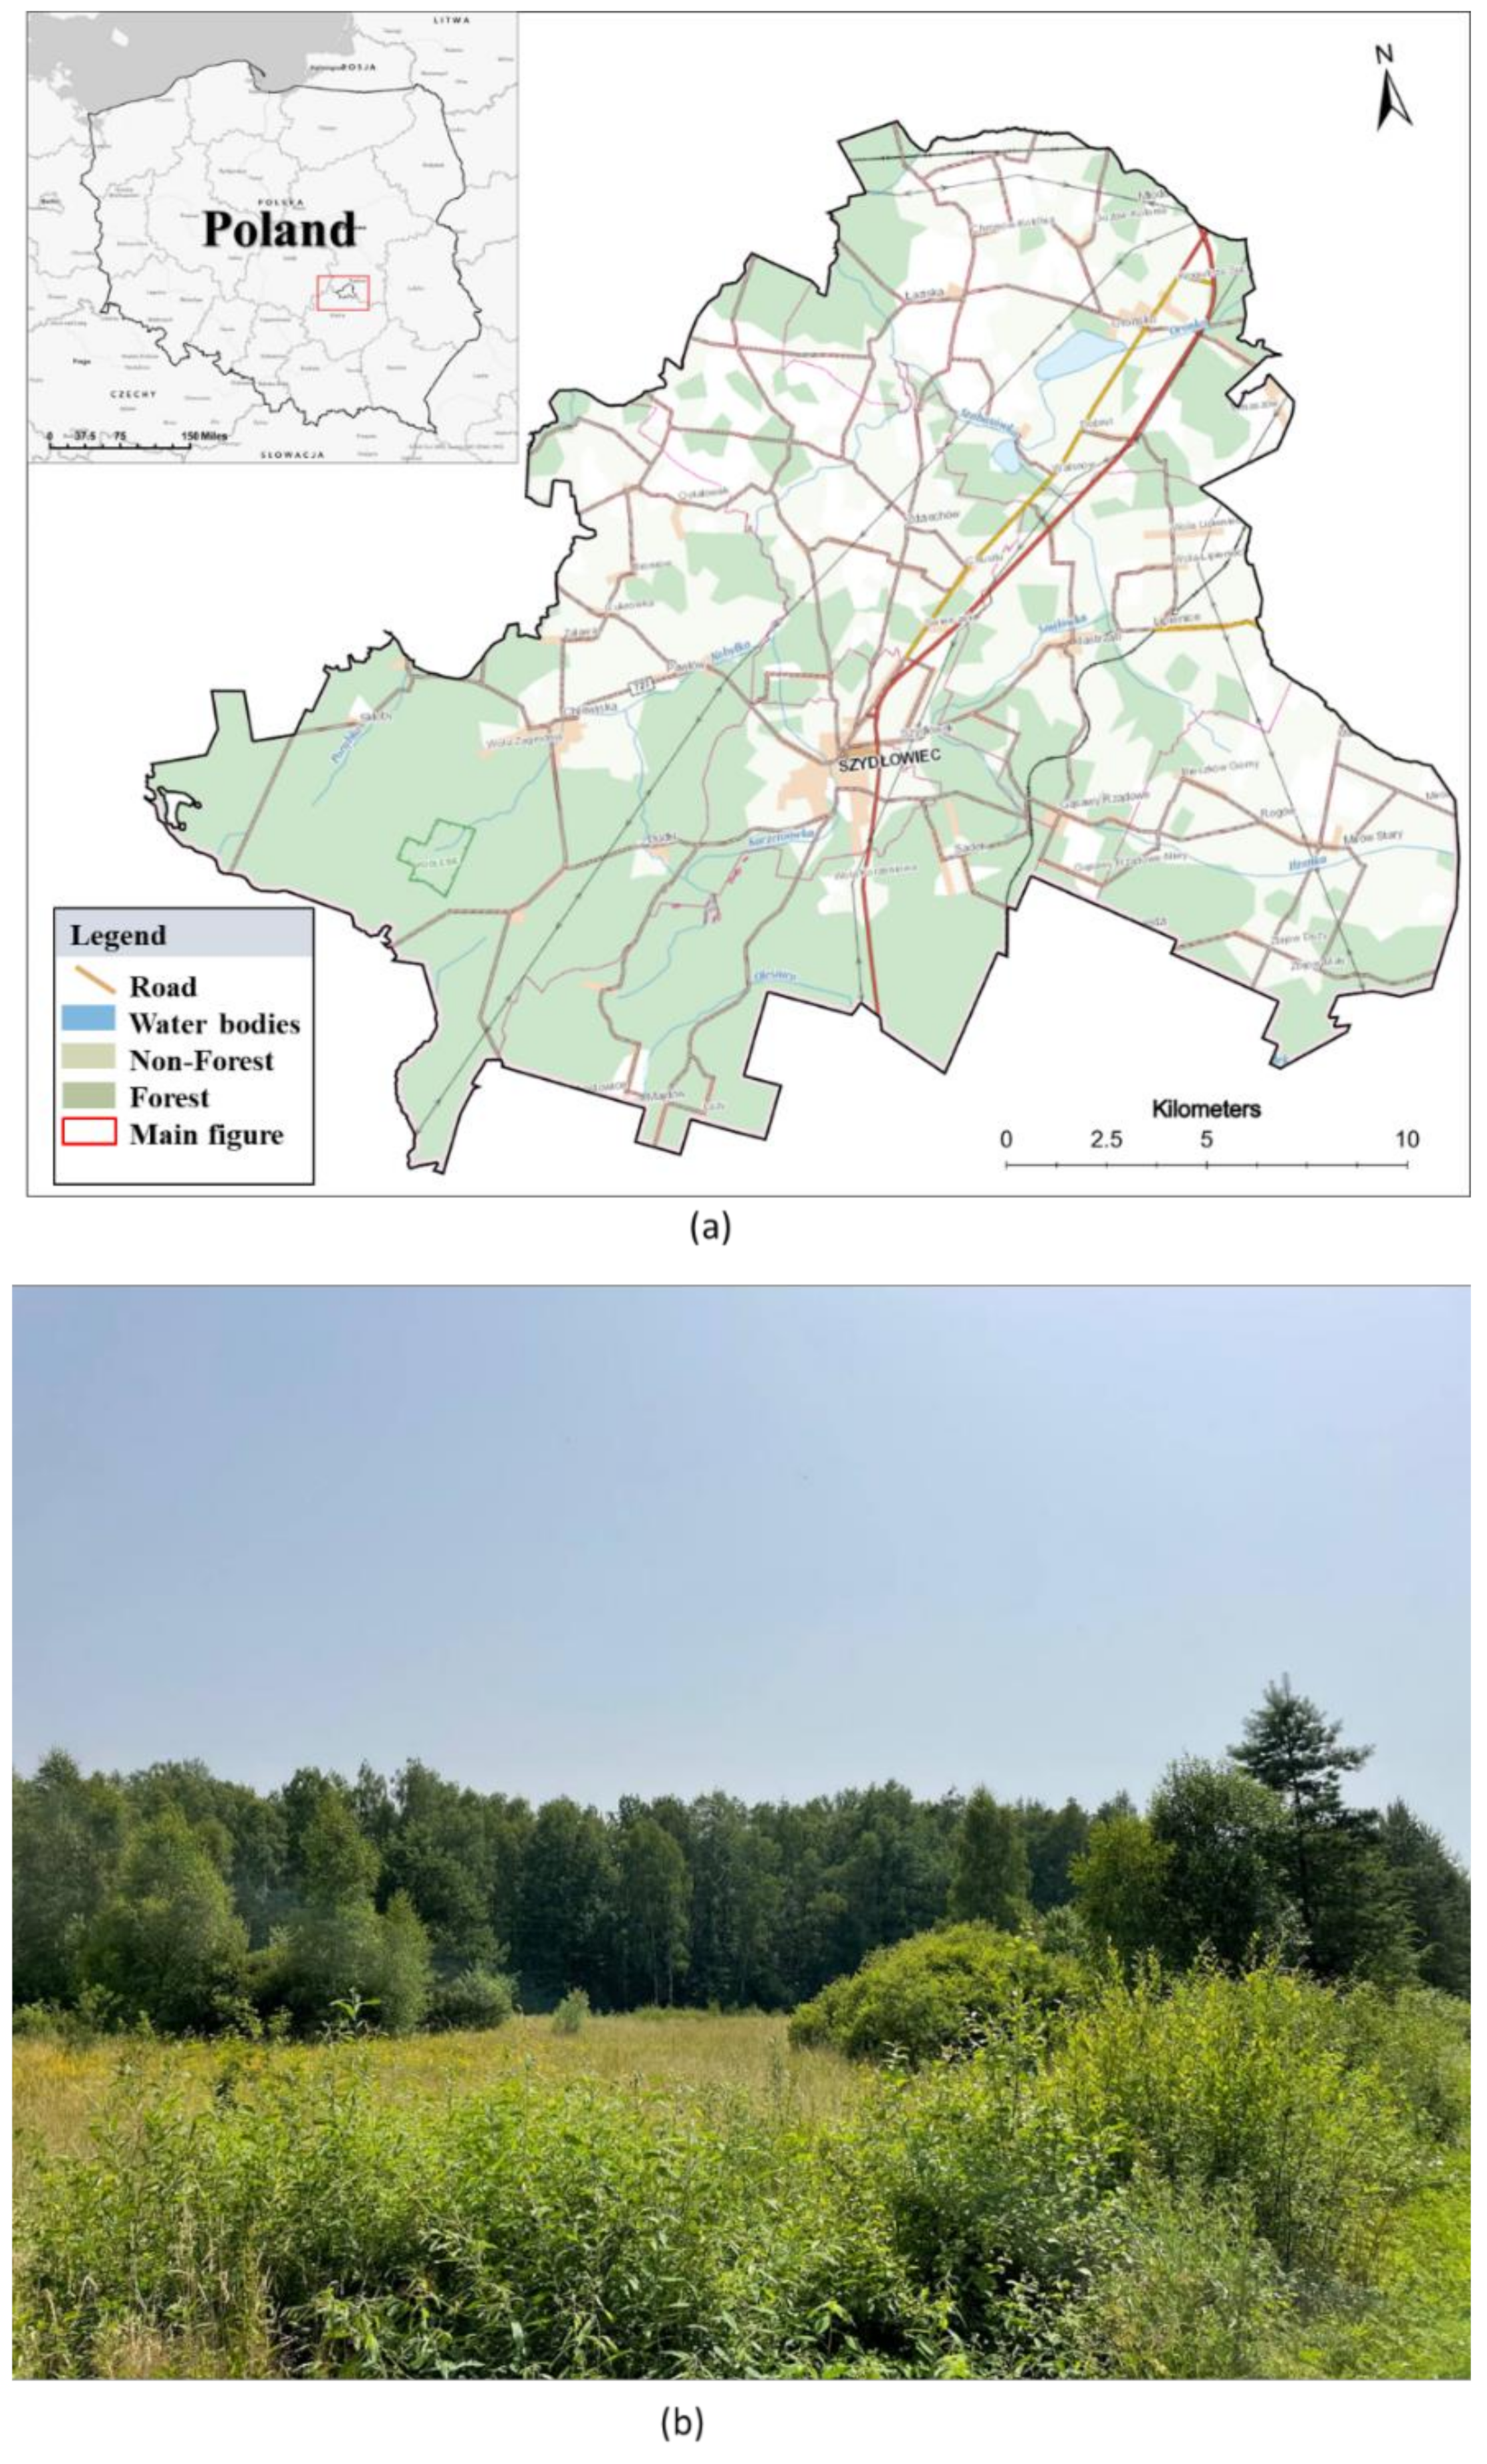
2.1. Study Area

To study land abandonment, we have selected the Szydłowiec county (powiat szydłowiecki), a unit of territorial administration (Nomenclature of Territorial Units for Statistics NUTS-3 level) in the Masovian Voivodeship in the east-central Poland (Figure 1), with a center coordinate of 51°14′N and 20°51′E. Due to historical processes of the 19th and 20th century resulting in the dominance of small-scale family farming, central and south-eastern Poland developed a specific fragmented agricultural land use [25] that had persisted under the communist regime. Such small-scale private farms had been mostly negatively impacted by the economic transformation in Poland in the 1990s [26]. Central Poland shows therefore significant ALA in recent years [6,27] and the selected study area well represents this major region.
The area of the Szydłowiec county is 45,181 ha which included 57% agricultural land, 34% forest, 4% built-up area, 4% wooded area and 1% of other land uses in 2014. The population of the county is 39,547 people (2020), resulting in population density of 87 people per 1 km2, lower than the average value for Poland. The agricultural land is mostly in private hands. The number of farms is 3928, with an average farm area equal to approximately 6.5 ha (in 2010). On the contrary, most of the forested area in the county (64% of the total area in 2020) is owned by the State Forests (a national company) [28]. The capital of the county—the historical town of Szydłowiec—serves mostly as a local center of services for surrounding rural areas; its overall economic and population potential in relation to the whole Masovia region is average and standard of living is rather low. Overall, socio-economic conditions of the region favour the decisions of out-migration, e.g., to Warsaw with a potential impact on the land use [29,30].

2.2. Data

In this study we used very high-resolution satellite imagery (CORONA imagery) and topographic maps to assess the land cover in the 1960–1970s, and satellite land cover products (High-Resolution Layers, HRLs) and Digital Elevation and Surface Model (DEM, DSM) to characterize present-day land cover.

2.2.1. CORONA Imagery

CORONA imagery is one of the first Earth observation datasets which covers large areas and is valuable for detecting long-term land changes due to its adequate spatial resolution and availability from the 1960s [31]. Satellites providing CORONA imagery were operating from August 1960 to May 1972, controlled by the Central Intelligence Agency of the United States National Reconnaissance Office. The images are panchromatic and have a high spatial resolution depending on mission and specific camera [32,33]. CORONA images deliver a spaceborne photography with spatial resolution ranging from 1 to 10 m [34]. The dataset was declassified in 1995, but the images have not been georeferenced due to the complications which occur when processing the panoramic imaging geometry, film distortions and limited metadata availability needed for georeferencing [31]. In the current research, 2 strips of CORONA imagery acquired for 28 July 1969 were purchased from CORONA declass1 archive (entity ID DS1107-1074DA041-42), with center coordinates 51.15°N, 20.115°E and 51.01°N, 20.203°E.

2.2.2. Historical Topographic Map

Historical topographic maps were received as high-resolution scans from the Head Office of Geodesy and Cartography. The maps are part of the Polish topographical map published in the late 1970s and early 1980s with a scale of 1:25,000 in 300 dpi [35]. The topographic maps do not detail most of land use and land cover types except for forests presented in dark green and wooded area with hachure in light green.

2.2.3. Digital Elevation and Digital Surface Models

DEM and DSM are national products derived for the entire country from airborne laser scanning (ALS) data and offer suitable data for topographic mapping and 3D analysis, representing both vegetation cover on the ground [36] as well as its density and height. As a result of the dense sampling, high quality, and ability to cover inaccessible and remote areas by lidar technology, ALS data are suitable for major studies in land use and land cover change [37]. The acquisition dates of the DEM and DSM data vary for the study area (October–November 2012, mostly southern and western parts of the study area, and March–April 2014, central, eastern and northern parts) [38]. Data for the study area are open access data, and the map sheets for the study area were received from the National Geoportal of Poland [38] as raster layers with 1 m spatial resolution.

2.2.4. Copernicus High-Resolution Layers
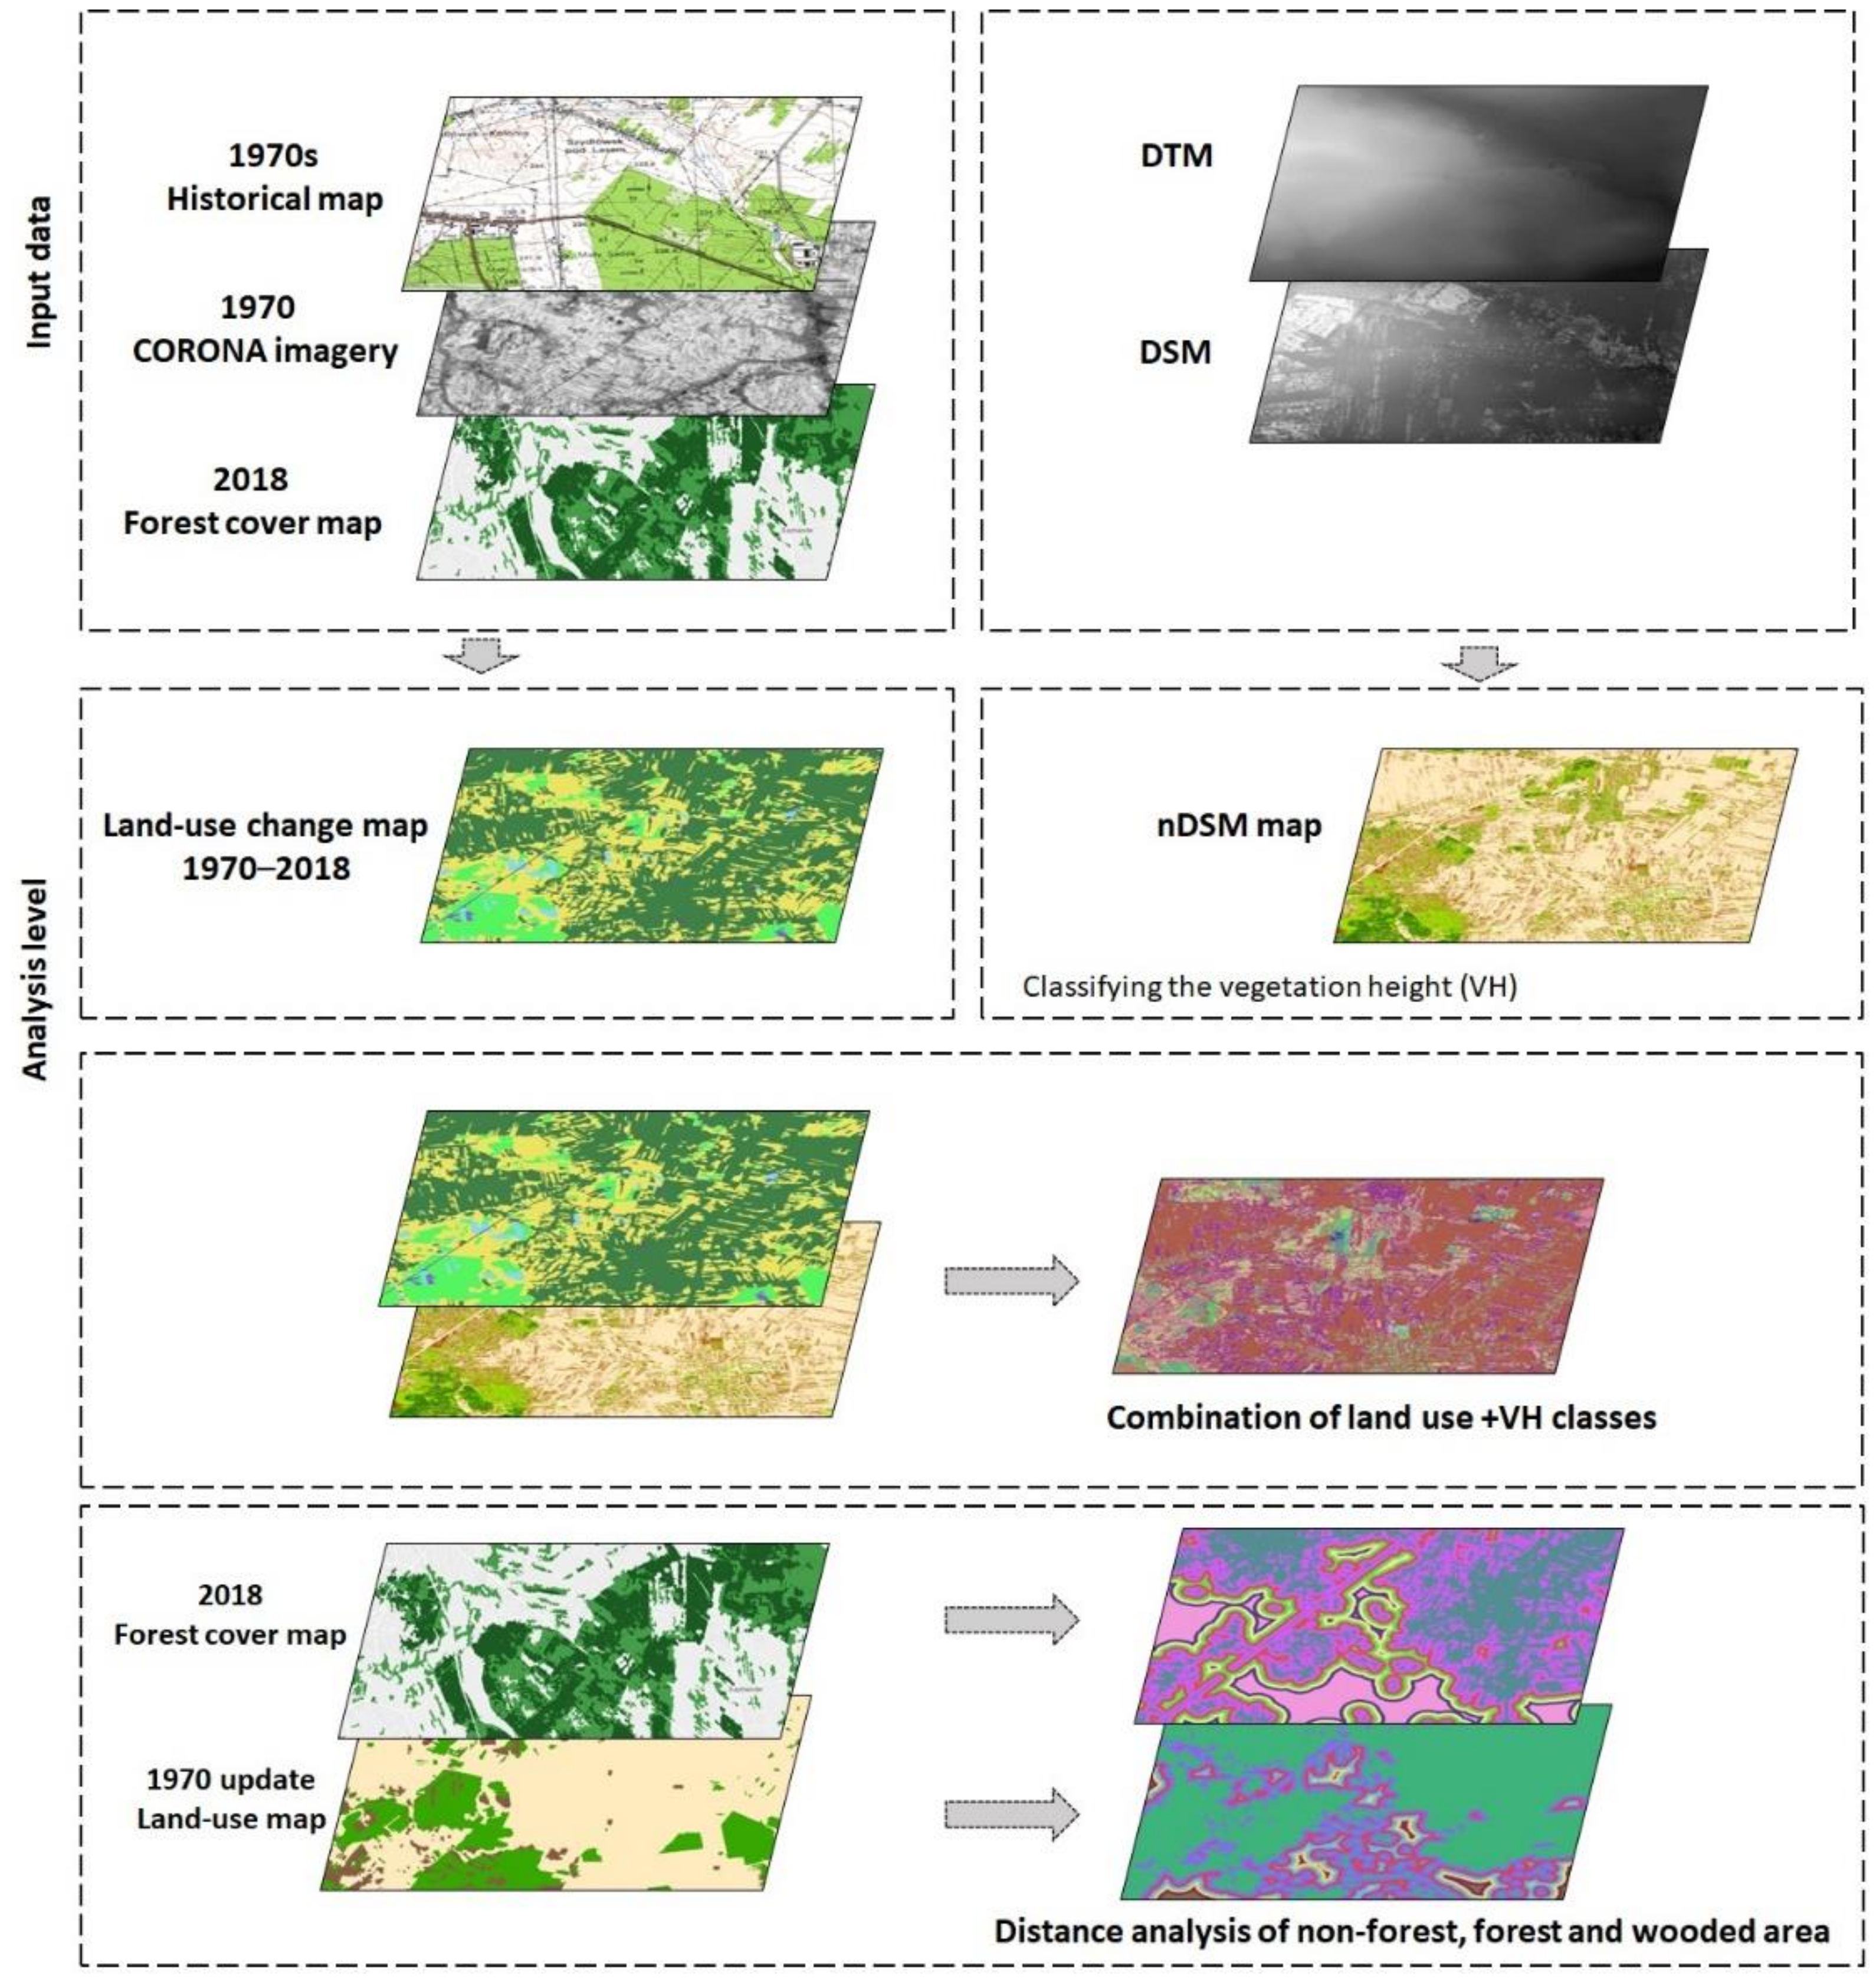
HRLs provide information on certain land cover types and are complementary to thematic land cover and land use mapping efforts, for instance, in the CORINE land cover (CLC) datasets. The HRLs are generated from satellite imagery through a combination of automatic processing and interactive rule-based classification [39]. In the study we used Forest Type 2018, one of the Forest HRLs, presenting distribution of forested areas in 2018 with two forest categories—broadleaved and coniferous forests. The forest HRL is delivered in Lambert Azimuthal Equal-Area (LAEA) projection in a geo-tiff format. The spatial resolution of the layer is 10 m; however, the layer production implies a minimum mapping unit of 0.5 ha [40]. The thematic accuracy is minimum 90% for both user and producer accuracy for broadleaved and coniferous forest classes; geometric accuracy is less than half a pixel [41].

2.3. Methods

This research considered various processing steps to produce consistent land cover data for 1970s and the contemporary period, and subsequently to map and investigate ALA and related landscape changes in the study area (Figure 2). The processing steps are detailed in the subsequent sections.

2.3.1. Preparing Land Cover Layer for the 1970

The historical maps of 1970s include five major land use and land cover categories: water bodies, settlements, forests, wooded area and non-forest area. Due to our interest in ALA, the maps were first vectorized manually into 3 classes: forests, wooded area and non-forest area. Forest definition was based on land use and size. So, forest was a tree-covered area under forest management, and clear-cuts are not presented on the maps. The size of the minimum forest patch was 10 mm2, which is 0.625 ha in the scale of the map [42]. Wooded areas were the other (usually smaller) areas with tree cover, where forest management was not obligatory. Both forest and wooded areas were marked on the maps with green, although with different symbols. Non-forest areas were all the other classes presented on the maps. The initial land cover layer for 1970s was then backdated using information from the CORONA imagery (1969). CORONA imagery was mostly used to test the quality of map information with respect to forest and wooded area categories delineation, searching for regions which showed a different land cover to that presented in topographical maps.
CORONA images were georeferenced using ground control points (GCPs). The set of 40 GCPs per image was used that might be easily identified using contemporary orthoimagery. The images were georeferenced with an RMSE of 11.57 m resulting in a mosaic of CORONA raster images with a full coverage of the study area. To backdate the vector layer derived from the 1970s topographic map, the vector layer was overlaid on CORONA image. Forests, wooded area and other land stored in the vector layer derived from the map were visually checked for consistency with image data. Whenever a region had a different land cover than that shown by the map, the differences were recognized and edited into a new vector layer (Figure 3). For instance, in some regions, wooded areas or forests shown in the topographic map were considered to be non-forest (agricultural) areas in CORONA, while some non-forest areas in the map showed clear signs of forest succession. Finally, the vector layer from the map and vector layers with updates from CORONA were integrated into a raster file with spatial resolution of 10 m, presenting three land cover classes (forest, wooded area, non-forest). Backdating the topographic map is important because of increasing the accuracy of land cover change and landscape pattern analysis with high quality data. Based on the date of CORONA imagery acquisition, the final historical land cover dataset is considered to present the land cover at the beginning of 1970s and we refer to it as “1970”.

2.3.2. Preparing Land Cover Layer for 2018 and Change Analysis

The Forest Type 2018 HRL was reclassified to include only two land cover classes, forest and non-forest, with broadleaved and coniferous forests merged into one forest class. The historical dataset for 1970 with three classes (forest, wooded area, non-forest) was then combined with the 2018 map with two classes (forest, non-forest), receiving the output change map with six classes showing stable land cover and land cover change categories. Forest cover gain categories were subsequently interpreted as abandoned land that has undergone vegetation succession.

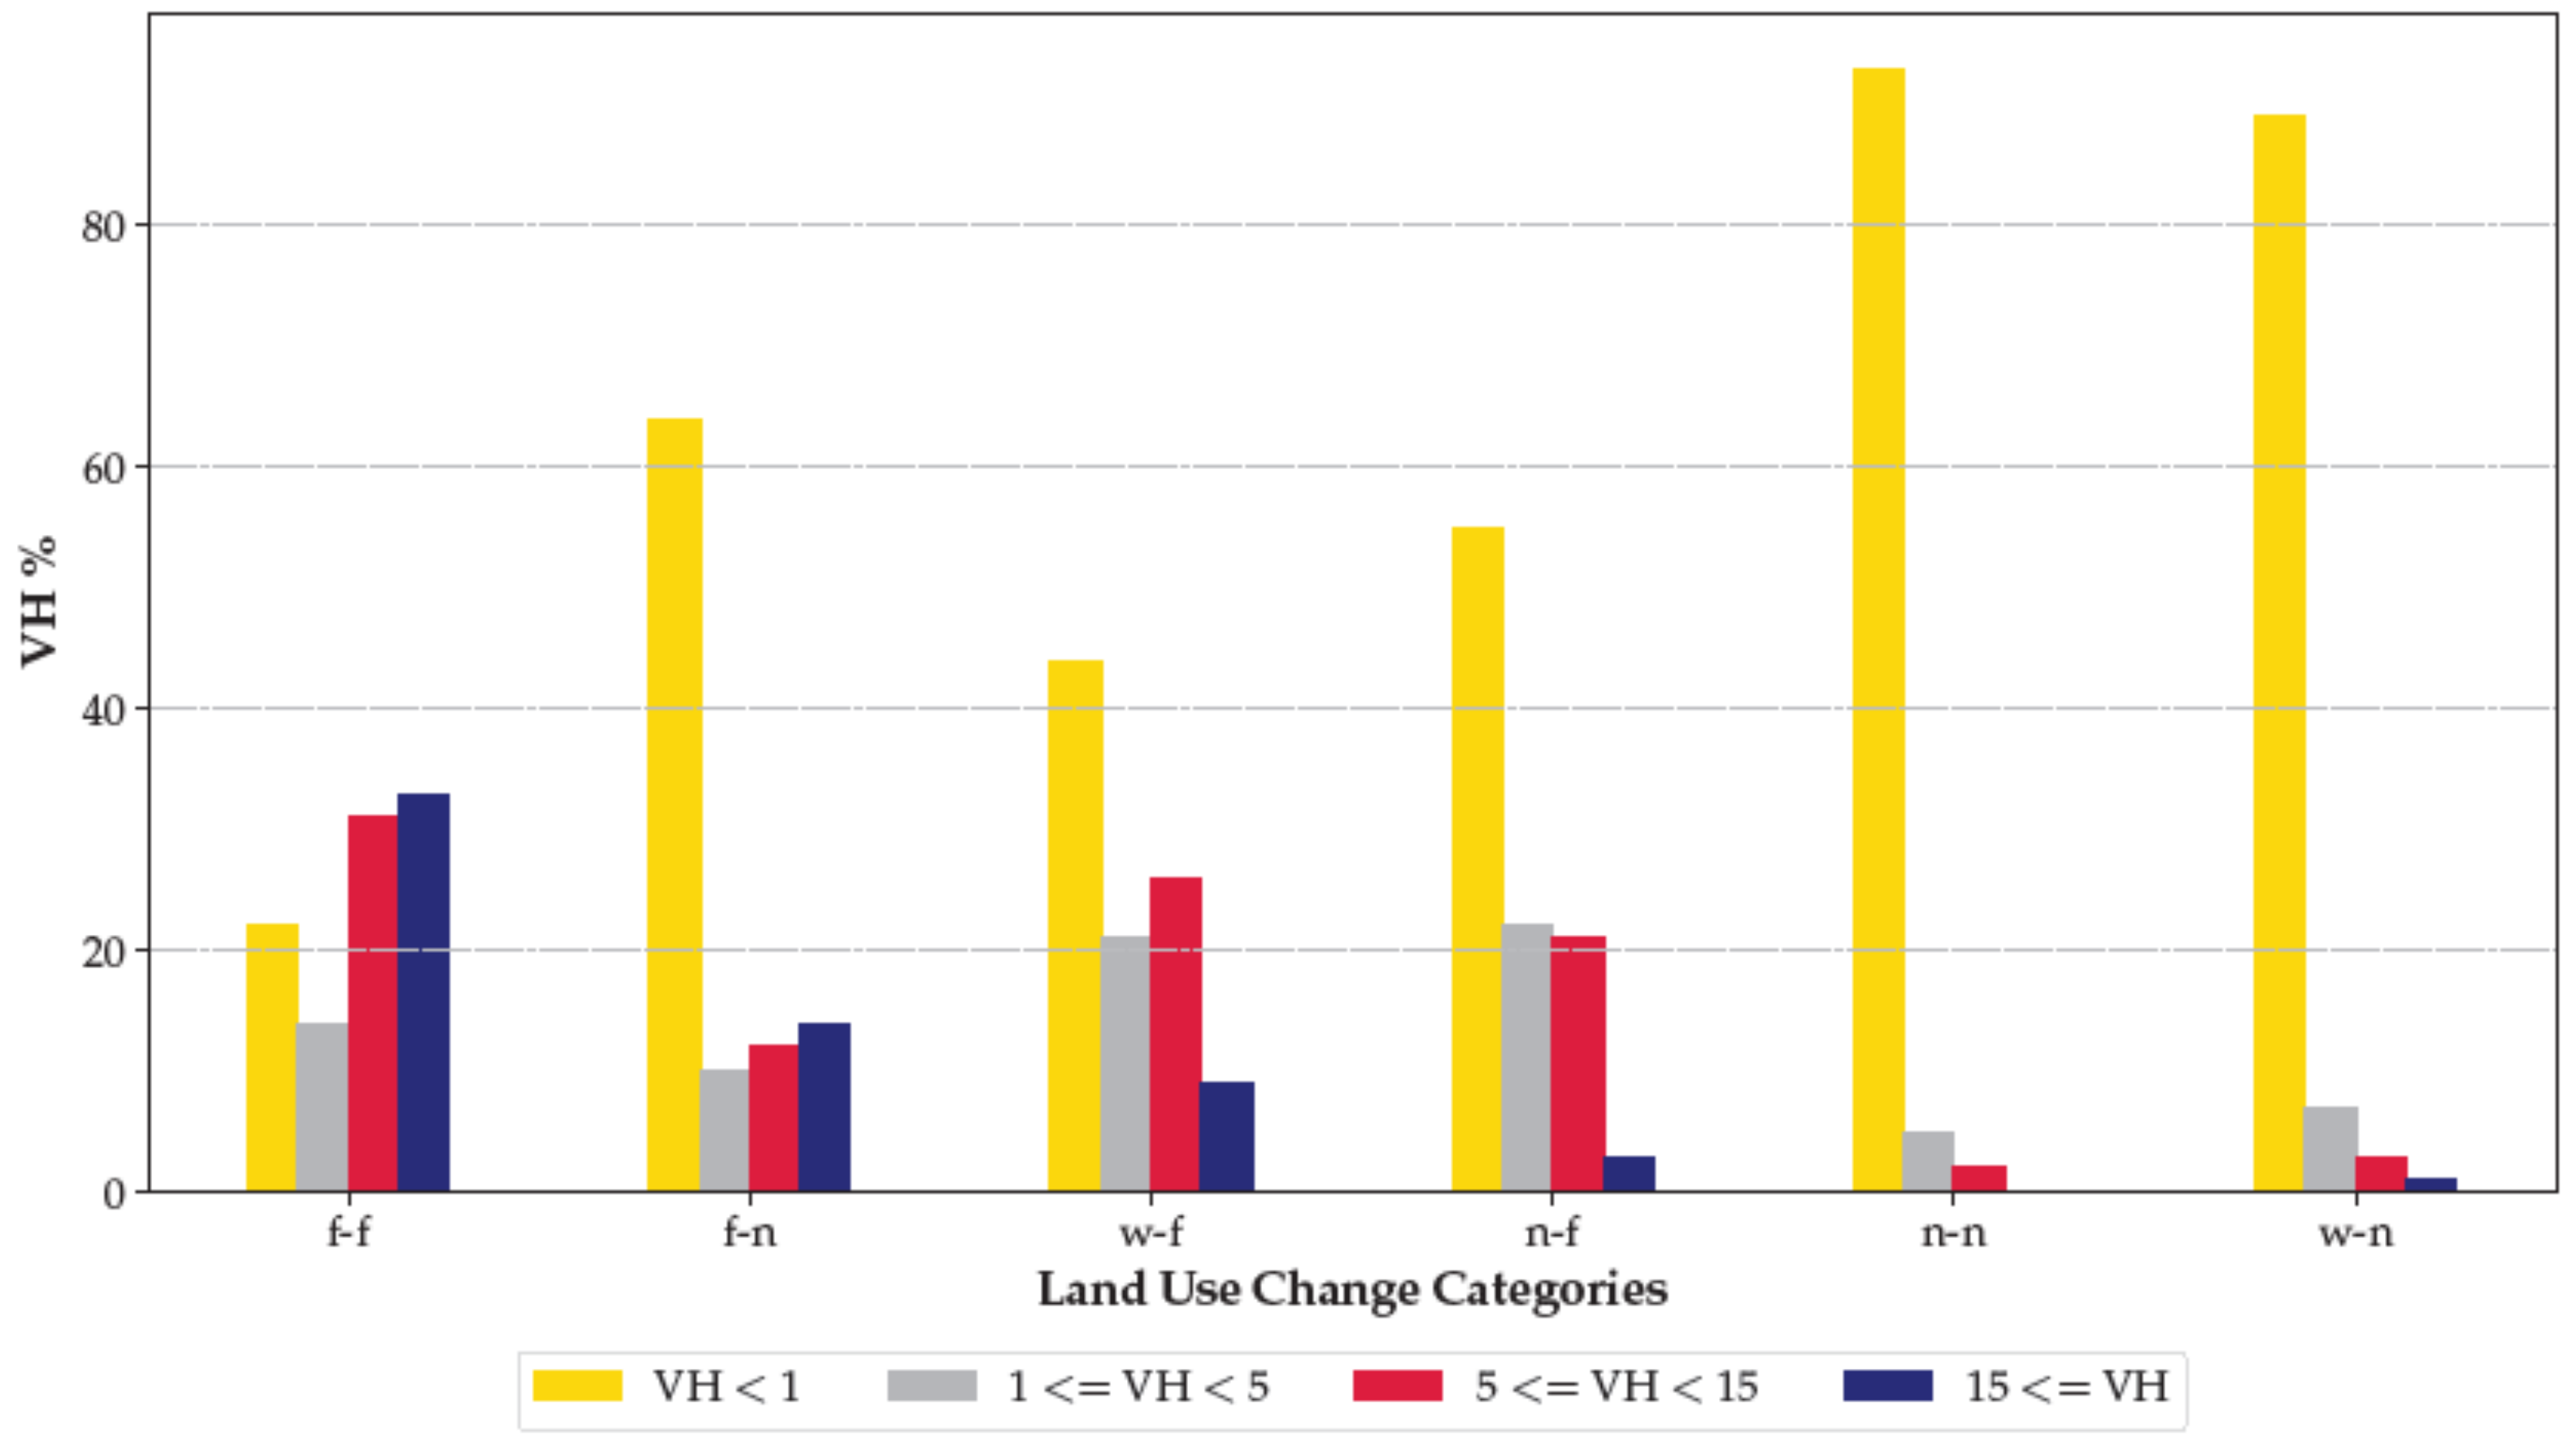
2.3.3. Assessing Vegetation Height for Land Cover Change Classes

DEM was subtracted from DSM to create a normalized Digital Surface Model (nDSM) layer in the raster format and resampled to 10 m spatial resolution, providing the vegetation height (VH) values for the study area. The nDSM was re-classified into four classes: (1) VH less than 1 m, (2) VH equal or greater than 1 m and less than 5 m, (3) VH equal or greater than 5 m and less than 15 m, (4) VH equal or greater than 15 m. Class 1 represents vegetation of mostly open, non-forested areas; class 4 signifies tree-covered (forest) areas vegetation; classes 2 and 3 represent vegetation of transitional, successional communities (e.g., young trees, shrubs). The land cover change maps produced in the previous step and the nDSM were then overlaid, receiving distribution of VH classes for each stable and change land cover category.

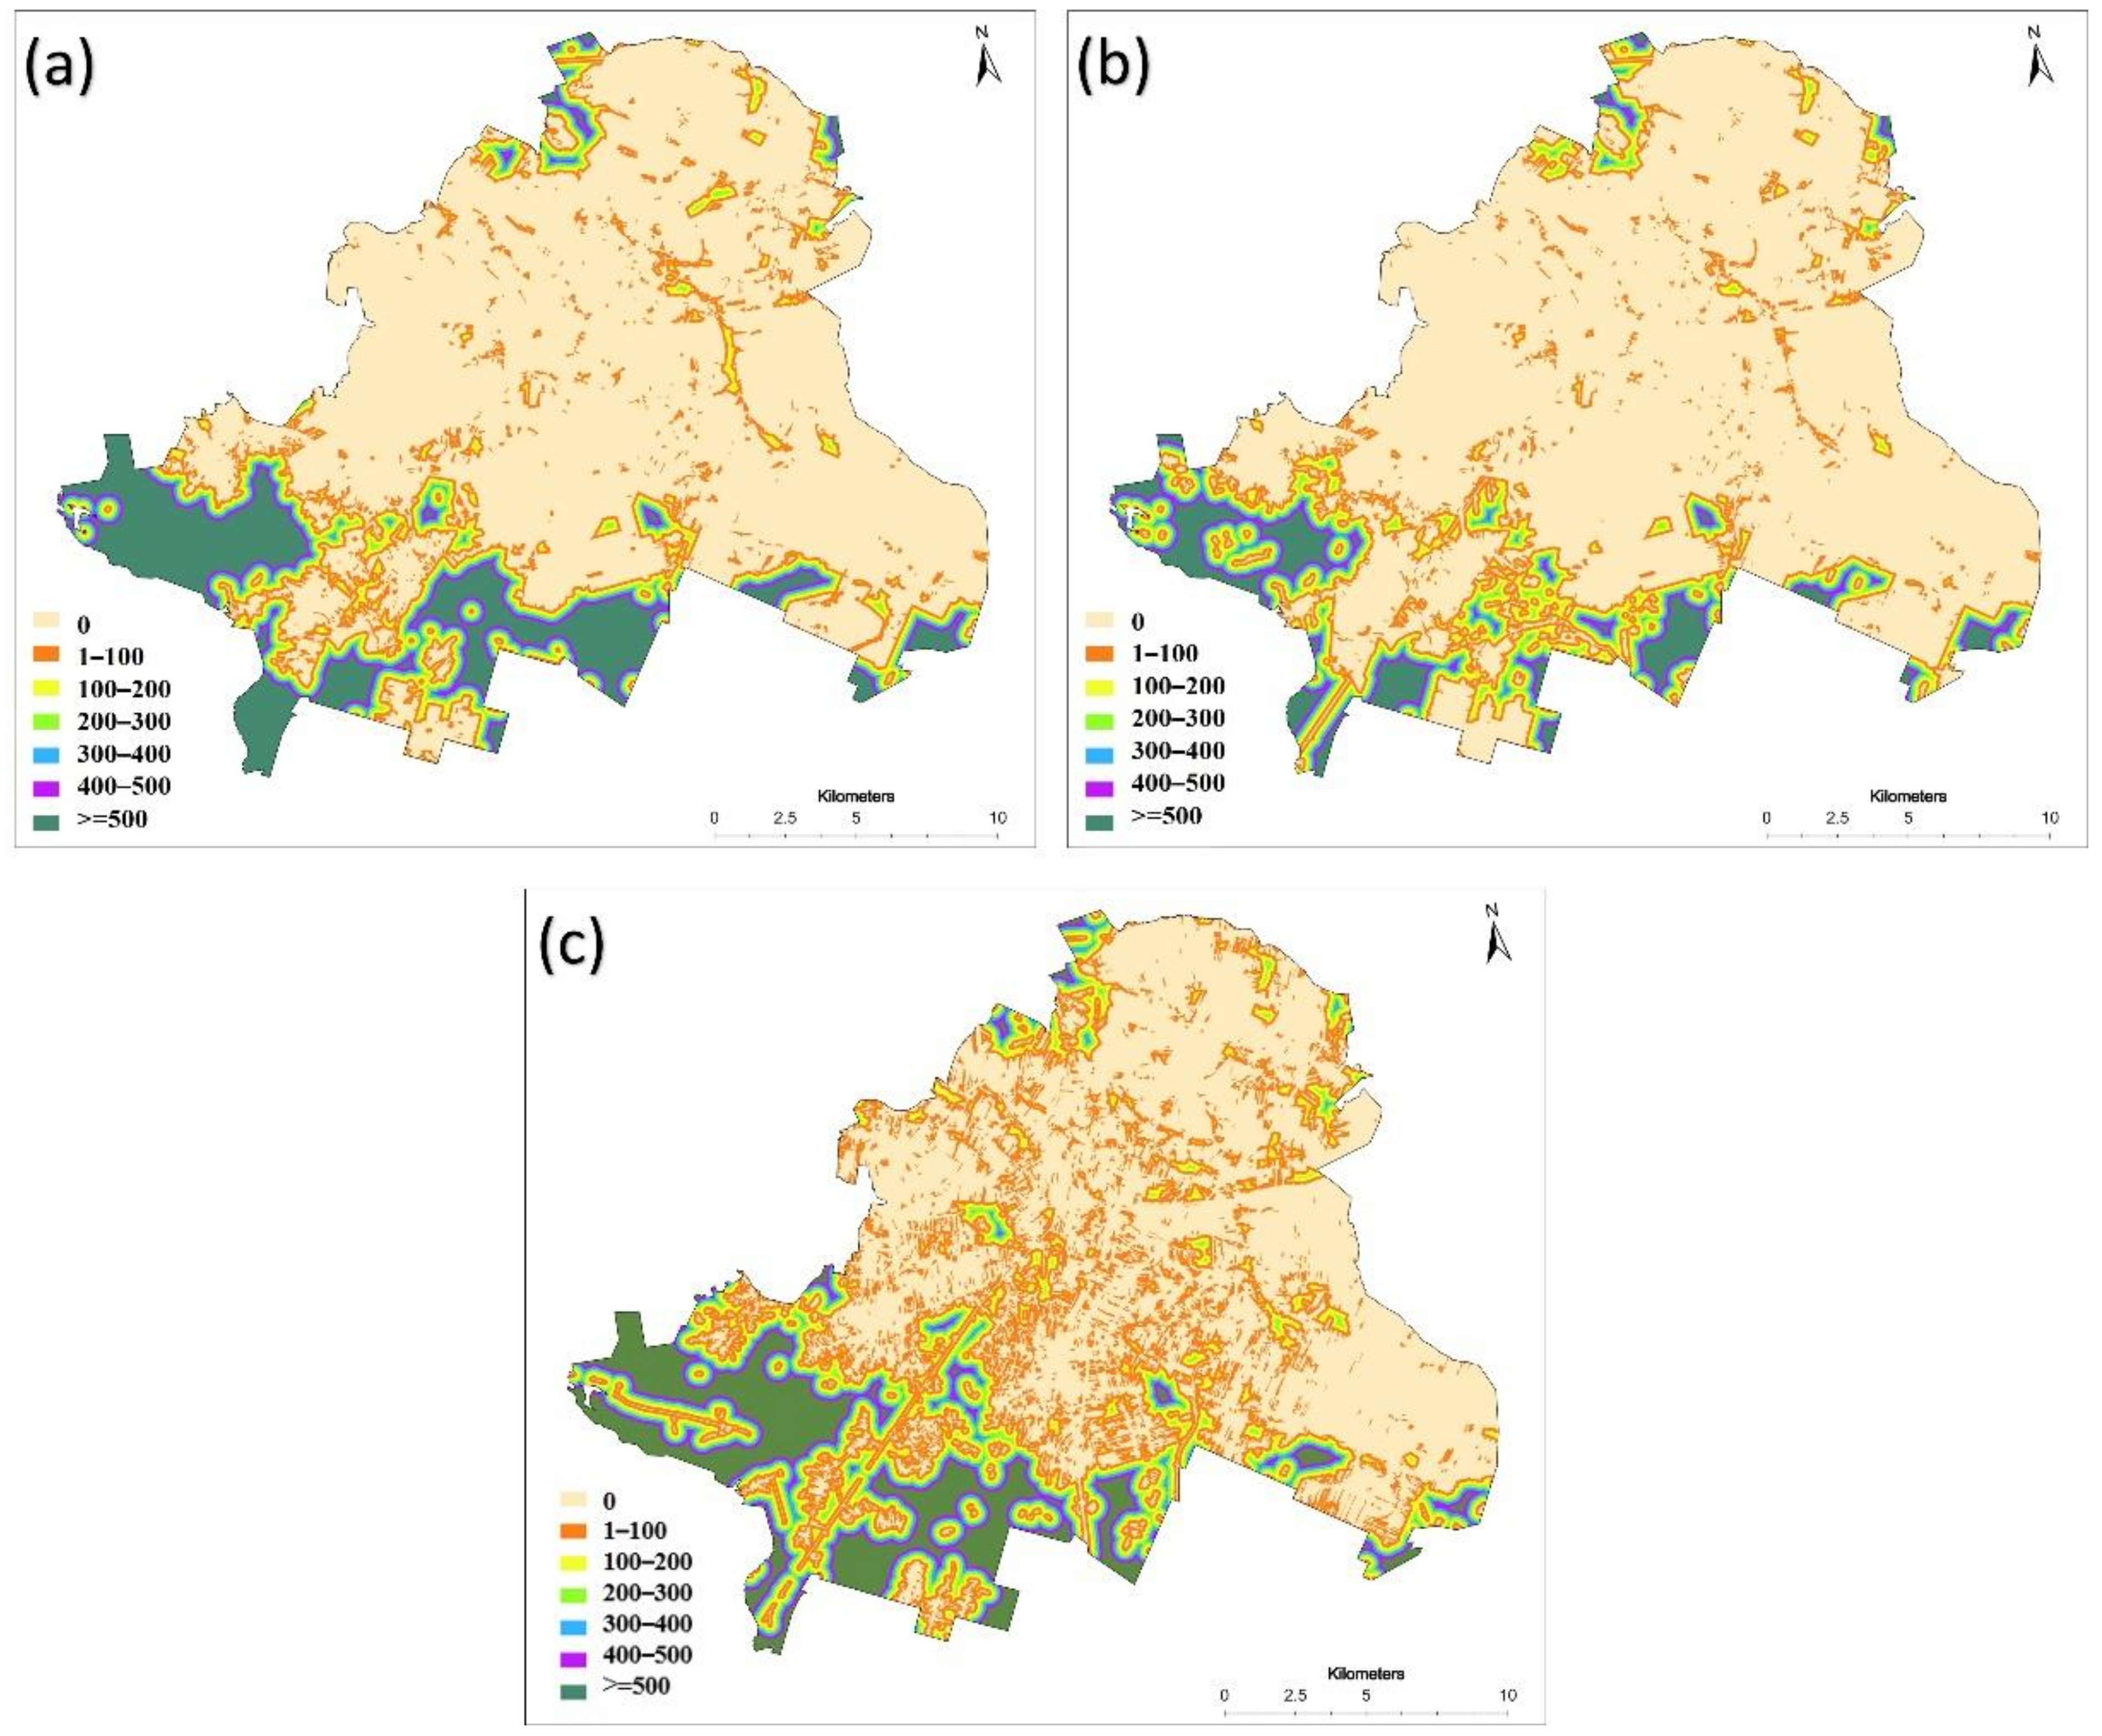
2.3.4. Forest Pattern Change

To assess changes in landscape pattern related to ALA and subsequent forest cover gain, we analysed changes in the area and proportions of two forest pattern categories: forest edge and forest core [43] for 1970 and 2018. Forest core and forest edge categories were received by measuring distance from the forest boundary into the forest area, with 6 distance classes: 0 to 100 m, 100–200 m, 200–300 m, 300–400 m, 400–500 m and more than 500 m. The first distance class (0–100 m) was considered to represent forest edges, while the last one (more than 500 m) signified forest core areas, with distance classes from 100–500 m representing a transition from forest edge to forest core category. Relative proportions of forest edge and forest core categories are meaningful in the context of increasing or decreasing forest fragmentation; for instance, forest fragmentation may increase with emergence of new forested patches that are too small to contain core forest category [43]. For 1970 forest maps, forest pattern analysis was carried out both for the forest area only and for forests combined with a wooded area category.

3. Results

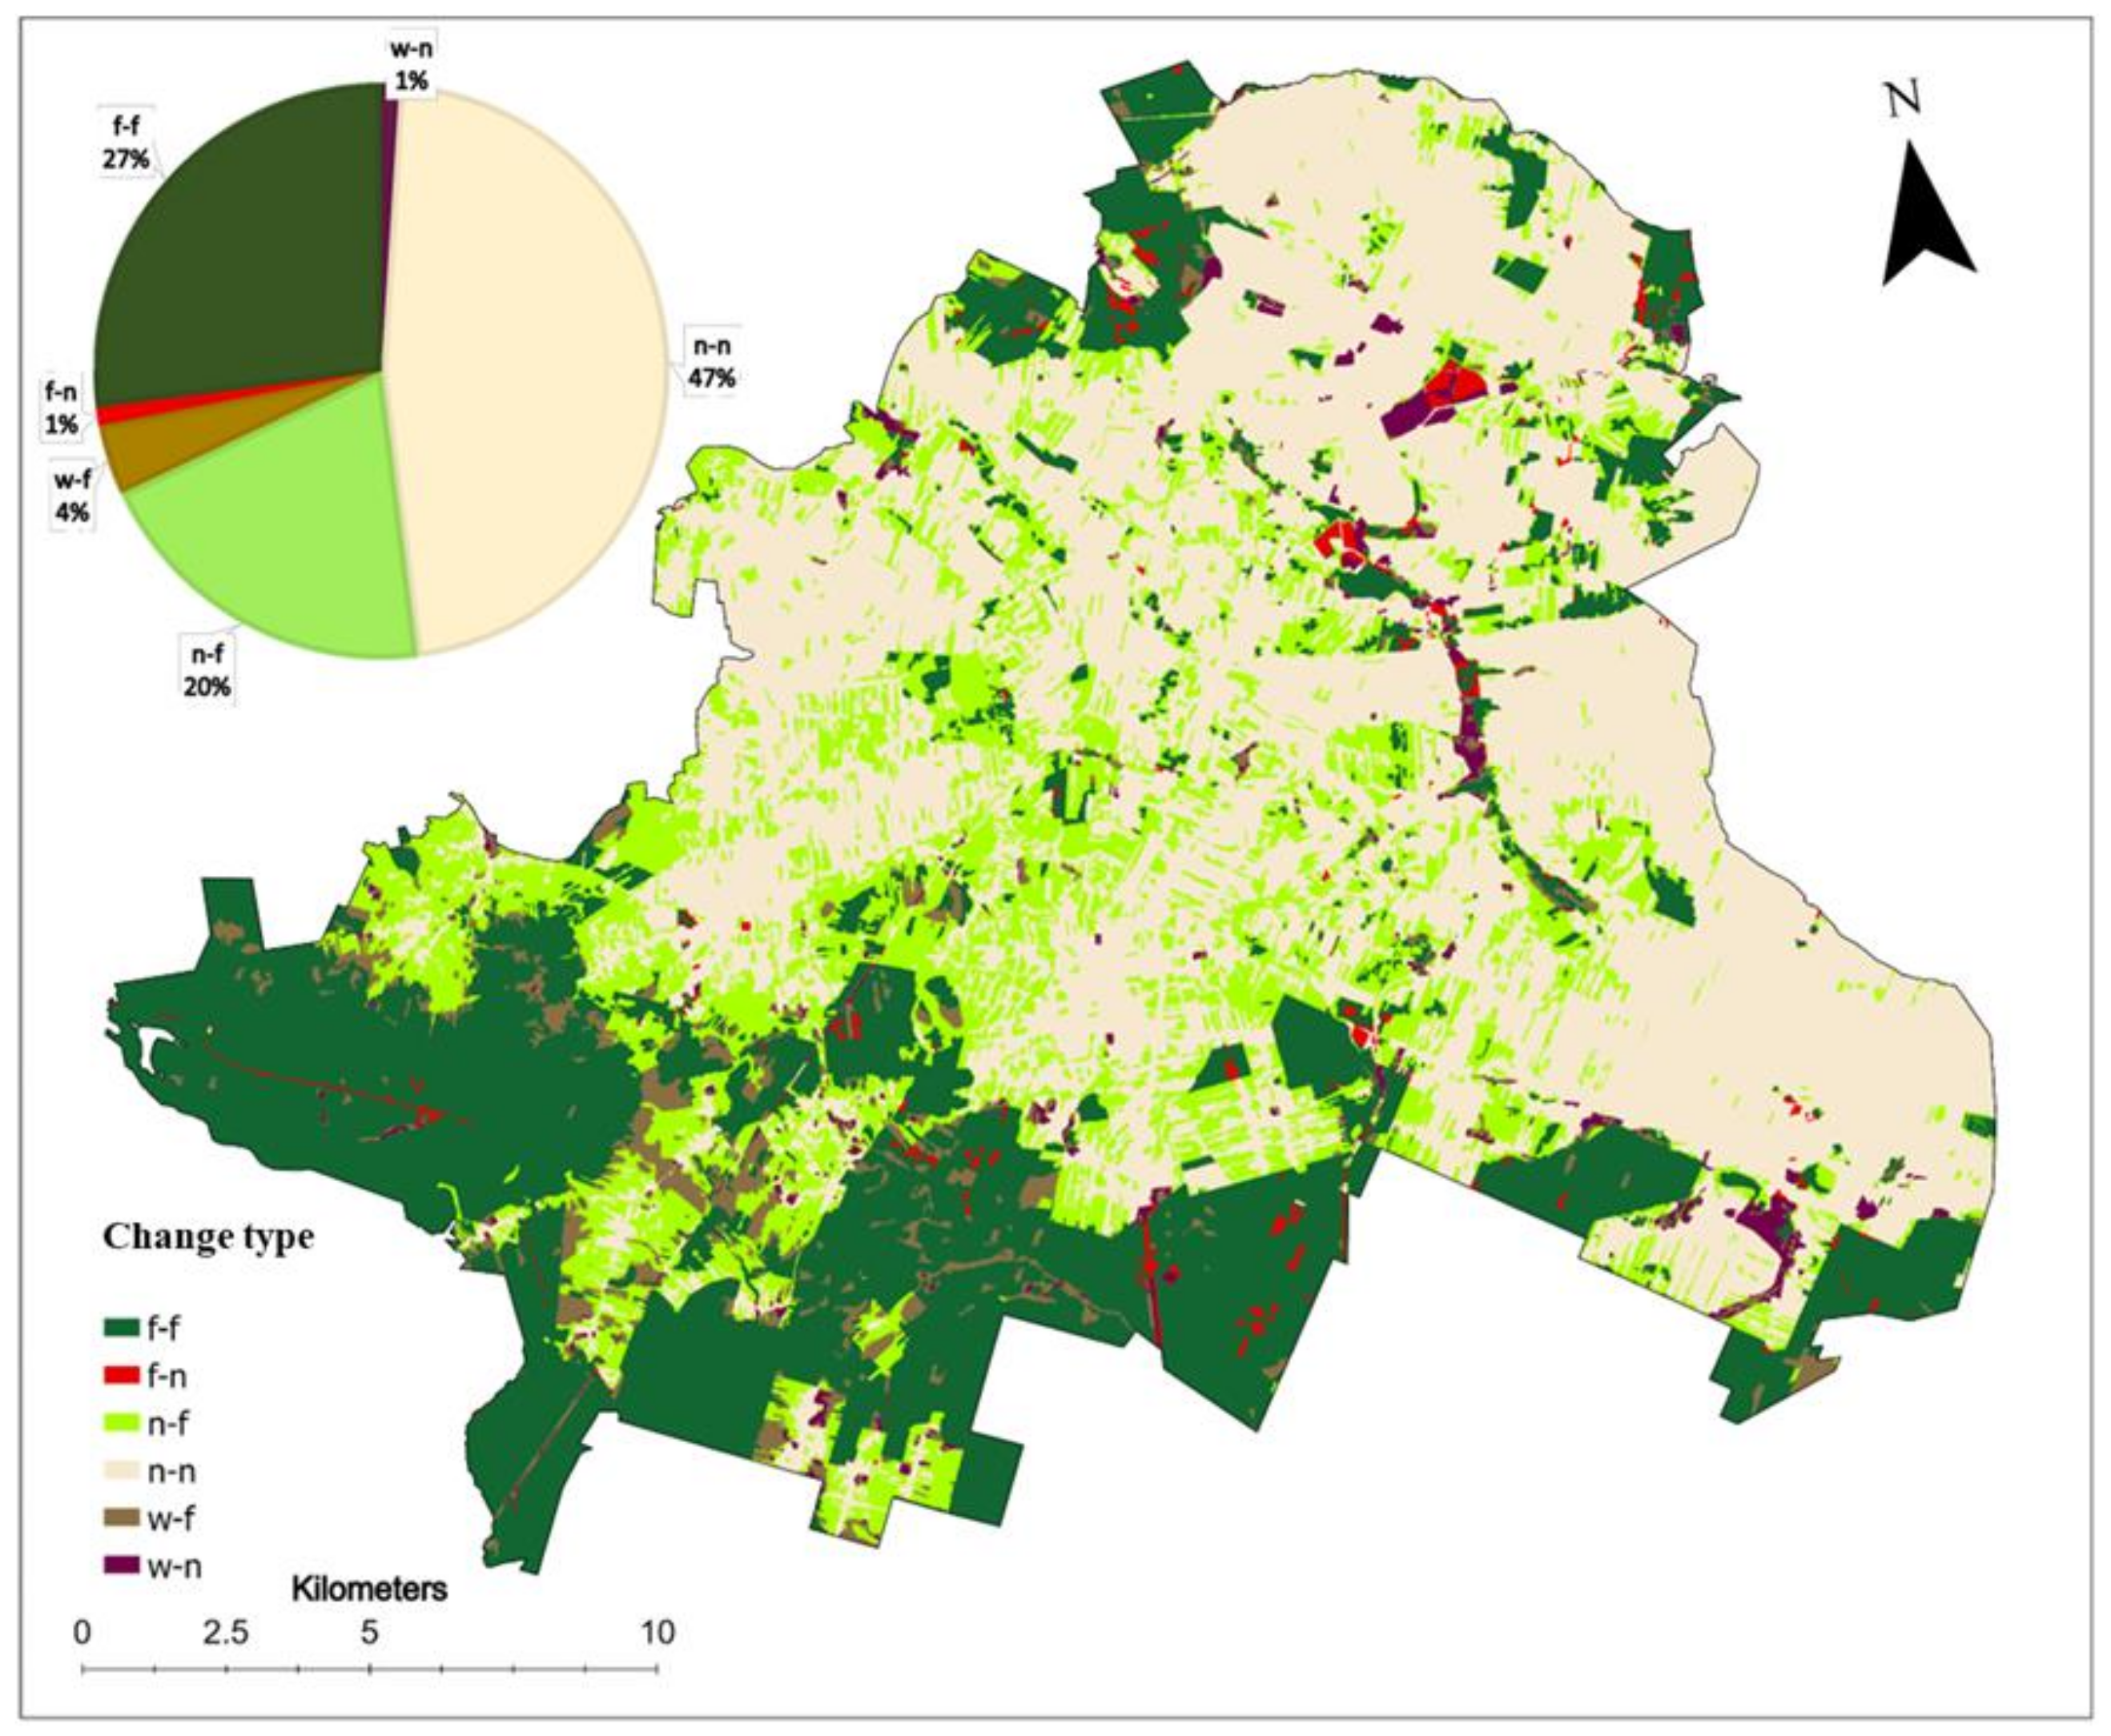
3.1. Forest Cover Change 1970–2018

The major land cover change in the Szydłowiec county between 1970 and 2018 was the increase of forest cover due to a gradual conversion of agricultural open land to forests (Figure 4). It is visible all over the area, however most changes of this type were observed in the southern part of the study area. Additionally, the transformation of former wooded area into forest was observed in several patches (Figure 4).
The area of forest gain between 1970–2018 was 23% of the county area, much larger than forest cover loss area, only 2% of the county area (Figure 4), resulting in the substantial increase of forest cover in the county, from 28% (or 33% if wooded area is merged with forests) to 51%.

3.2. Relation of Land Cover Change to Vegetation Height

The percentage of low vegetation height (VH less than 1 m) in stable non-forest or forest loss areas is high due to the lack of trees and shrubs and the dominance of grasslands and croplands in this land cover change category. Stable forest areas have a high percentage of the highest vegetation, while two change categories, non-forest to forest and wooded area to forest, show higher a percentage of medium VH classes, with transitional, non-mature secondary forest succession vegetation, and a lower percentage of the highest VH as compared to stable forests (Figure 5).

3.3. Changes of Forest Pattern

The proportion of forest edge category in the total forest area was the highest in 2018, and the lowest in 1970 when wooded area was analyzed jointly with the forest category. Forest core proportion had the highest value in 1970 for wooded area analyzed jointly with the forest category. Forest core proportion in 2018 was only slightly higher than the value calculated for 1970 solely for the forest category, and the dominant forest pattern category in 2018 was forest edge, mostly due to the emergence of forest patches too small to contain the forest core category (Figure 6). Both in 1970 and 2018, forest core areas were located mostly in the southern part of the study area (Figure 7).

4. Discussion

This research identified a major change in land cover in the study area over the past 48 years, 1970–2018. The patterns of these changes are not uniform across the whole of Szydłowiec county. In the southern part of the study area, ALA and the resulting conversion of agricultural areas to wooded area and forests was more frequent than in other parts of the county. The land cover in the northern part of the county was more stable than in the southern part, with most forest loss patches occurring there, representing relatively small and scattered areas. In general, forest gains significantly exceeded minor forest losses and in consequence, forest increased by 23% in the study period. Currently, the non-forest area covers 49% of the powiat while 51% of the area is forest cover (Figure 4). Our findings confirm significance of recent ALA-related land cover changes in central Poland indicated in several other studies [6,7]. The Szydłowiec county represents an area not attractive for agricultural activities anymore with non-agricultural functions becoming more important as a source of livelihood in the eastern and central Poland [44]. Notably, actual forest cover in the county is significantly higher than reported in the official statistics, by 17 percentage points [28], which indicates that official land cover data quite likely do not account for forest gain resulting from ALA—a problem reported in Poland in various studies relying on remote sensing data [45].
We found significant differences in the VH in land cover change categories. Quite clearly, high vegetation dominates stable forests, and low vegetation dominates both the stable non-forest class and the wooded area to non-forest change class. For two change classes, wooded area to forest and non-forest area to forest, the distribution of VH is more complex, with vegetation higher than 1 m occupying around half of the class area. This indicates a relatively gradual transition from open to shrub or tree-covered land, suggesting that forest cover gains are mostly related to secondary succession and not to afforestation. Quite remarkably, forest to non-forest change class shows also a high share of vegetation higher than 1 m (around one third), indicating that this change class occurrence is related mostly to clear-cuts, with some remaining higher vegetation. The result of VH analysis is mostly in line with the previous research which used ALS data in Poland [46,47], for instance Janus and Bożek showed that land abandonment remarkably changes the spatial pattern of land use and forest expansion in Southern Poland, contributing to the increasing share of high vegetation also outside forested areas [46]. Such a process is important, as even outside forests, the higher vegetation cover is a shelter and may offer a place to hide for many animals such as rodents [48]. By considering that 31% of the study area is covered with vegetation higher than 1 m, also outside forests, this region could play an important role in increasing biodiversity richness.
We found significant changes of the forest pattern and forest fragmentation in Szydłowiec county in the last 50 years, supporting evidence in other studies that forest cover gains in many landscapes of Europe strongly influence forest patterns [49]. Our findings show that in spite of the significant forest cover increase, the area of forest core (>500 m distance from forest edge) has not expanded since 1970, and most of the forest cover gain contributed to the emergence of relatively small forest patches, following the spatially dispersed ALA on small agricultural parcels. The small forest patches may play a significant role for ecosystem services delivery and biodiversity conservation, for instance through seed dispersal or the provision of steppingstones for animals moving across the landscape [50,51,52], thus contributing to the increase of population of forest-preferring species. Such changes of forest pattern may, for instance, affect the ongoing wolf population recovery in Poland [53].
Providing reliable maps of estimated ALA is important for assessing and identifying various environmental and societal effects of ALA on, for instance, the restoration of forests, carbon storage, wildfire risk, soil erosion, changes of biodiversity, food supply, and changes in water availability [54]. Using CORONA data to backdate historical topographic maps allowed to extend a study period, providing high accuracy map for analyzing forest pattern and a better understanding of the ALA process and its consequences. As, except for aerial imagery, there is no other high-resolution imagery for the region, CORONA offers the potential of determining the intensity of ALA over the long-term in the entire region due to its accessibility and coverage [55,56]. While this study used time-consuming manual vectorization and geo-referencing of the CORONA images, several studies offer new tools and methods that may accelerate processing of the CORONA data into useful land cover products [31,57]. Our study showed also that existing land cover products, such as HRLs, may be successfully used to characterize land cover changes in local context. Due to the wide-area coverage of these data, it is easy to apply them to larger areas, also because such data are increasingly being offered to the scientific community [58]. Our study showed that for local-level studies DSM data derived from ALS are particularly useful to characterize vegetation height, providing detailed insight into gradual processes of vegetation succession on abandoned land.

5. Conclusions

In this study we used different datasets and methods to address ALA-related land cover change in Central Poland in a period of 1970–2018. We found out that ALA is widespread in the studied area and has contributed to substantial forest cover increase since 1970, with the initial value equal to 28% and the current forest cover exceeding 50%. This ALA-related land cover change resulted mostly from a major transformation of the socio-economic system of Poland in the 1990s that affected small agricultural farms. The vegetation height in abandoned areas indicates that secondary succession is still ongoing as vegetation height in abandoned areas differs from the vertical structure of vegetation that is typical for mature forests. The significant increase in forest cover has not contributed to the expansion of forest core areas—rather, new forest patches emerged in the study area, increasing the share of forest edges and overall forest fragmentation. These changes have significant environmental and societal consequences contributing for instance to the biodiversity restoration [59] and recovery of animal populations [60,61].
We conclude that the use of various datasets, including high-resolution imagery (CORONA), topographic maps, DEM and DSM, and land cover products derived from Earth observation data (HRL Forest product) facilitates land cover change analysis and allows a deeper understanding of the complex nature of ALA-related forest cover increase. Especially, using CORONA imagery provides options to extend the period of analysis and improve the accuracy of land cover delimitation as compared to simplified information available in topographic maps. With advances in geospatial data processing and development of machine learning tools, CORONA imagery may become a valuable source for studying ALA-related land cover changes for large areas [55,62].

Author Contributions

Conceptualization, all authors; methodology, data processing and analysis, M.S.; writing—original draft preparation, M.S.; writing—review and editing, all authors; visualization and graphics, M.S.; supervision, J.K. and D.K.; project administration, M.S.; funding acquisition, M.S. All authors have read and agreed to the published version of the manuscript.

Funding

This research has been supported from the Anthropocene Priority Research Area budget under the program “Excellence Initiative—Research University” at the Jagiellonian University. (Funding number: ATP.2.12.2020.6).

Data Availability Statement

All data supporting the findings of this study are available upon request from the first author.

Acknowledgments

The author wishes to thank anonymous reviewers for their useful comments and suggestions that help to improve this paper.

Conflicts of Interest

The authors declare no conflict of interest. The funders had no role in the design of the study; in the collection, analyses, or interpretation of data; in the writing of the manuscript, or in the decision to publish the results.

References

  1. Kuemmerle, T.; Kaplan, J.; Prishchepov, A.; Rylsky, I.; Chaskovskyy, O.; Tikunov, V.S.; Müller, D. Forest transitions in Eastern Europe and their effects on carbon budgets. Glob. Chang. Biol. 2015, 21, 3049–3061. [Google Scholar] [CrossRef] [PubMed]
  2. Khanal, N.R.; Watanabe, T. Abandonment of agricultural land and its consequences. Mt. Res. Dev. 2006, 26, 32–40. [Google Scholar] [CrossRef] [Green Version]
  3. Feranec, J.; Jaffrain, G.; Soukup, T.; Hazeu, G. Determining changes and flows in European landscapes 1990–2000 using CORINE land cover data. Appl. Geogr. 2010, 30, 19–35. [Google Scholar] [CrossRef]
  4. Li, S.; Li, X. Global understanding of farmland abandonment: A review and prospects. J. Geogr. Sci. 2017, 27, 1123–1150. [Google Scholar] [CrossRef]
  5. Baumann, M.; Kuemmerle, T.; Elbakidze, M.; Ozdogan, M.; Radeloff, V.C.; Keuler, N.S.; Prishchepov, A.V.; Kruhlov, I.; Hostert, P. Patterns and drivers of post-socialist farmland abandonment in Western Ukraine. Land Use Policy 2011, 28, 552–562. [Google Scholar] [CrossRef]
  6. Kolecka, N. Greening trends and their relationship with agricultural land abandonment across Poland. Remote Sens. Environ. 2021, 257, 112340. [Google Scholar] [CrossRef]
  7. Ortyl, B.; Kasprzyk, I. Land abandonment and restoration in the Polish Carpathians after accession to the European Union. Environ. Sci. Policy 2022, 132, 160–170. [Google Scholar] [CrossRef]
  8. Verburg, P.H.; Schulp, C.; Witte, N.; Veldkamp, A. Downscaling of land use change scenarios to assess the dynamics of European landscapes. Agric. Ecosyst. Environ. 2006, 114, 39–56. [Google Scholar] [CrossRef]
  9. Castillo, C.P.; Aliaga, E.C.; Lavalle, C.; Llario, J.C.M. An assessment and spatial modelling of agricultural land abandonment in Spain (2015–2030). Sustainability 2020, 12, 560. [Google Scholar]
  10. Levers, C.; Schneider, M.; Prishchepov, A.V.; Estel, S.; Kuemmerle, T. Spatial variation in determinants of agricultural land abandonment in Europe. Sci. Total Environ. 2018, 644, 95–111. [Google Scholar] [CrossRef]
  11. Van der Zanden, E.H.; Carvalho-Ribeiro, S.M.; Verburg, P.H. Abandonment landscapes: User attitudes, alternative futures and land management in Castro Laboreiro, Portugal. Reg. Environ. Change 2018, 18, 1509–1520. [Google Scholar] [CrossRef] [Green Version]
  12. Kolecka, N.; Kozak, J. Wall-to-wall parcel-level mapping of agricultural land abandonment in the Polish Carpathians. Land 2019, 8, 129. [Google Scholar] [CrossRef] [Green Version]
  13. Helming, K.; Pérez-Soba, M.; Tabbush, P. Sustainability Impact Assessment of Land Use Changes; Springer: Berlin/Heidelberg, Germany, 2008. [Google Scholar]
  14. Tasser, E.; Mader, M.; Tappeiner, U. Effects of land use in alpine grasslands on the probability of landslides. Basic Appl. Ecol. 2003, 4, 271–280. [Google Scholar] [CrossRef]
  15. Pazur, R.; Prishchepov, A.V.; Myachina, K.; Verburg, P.H.; Levykin, S.; Ponkina, E.V.; Kazachkov, G.; Yakovlev, I.; Akhmetov, R.; Rogova, N.; et al. Restoring steppe landscapes: Patterns, drivers and implications in Russia’s steppes. Landsc. Ecol. 2021, 36, 407–425. [Google Scholar] [CrossRef]
  16. Laiolo, P.; Dondero, F.; Ciliento, E.; Rolando, A. Consequences of pastoral abandonment for the structure and diversity of the alpine avifauna. J. Appl. Ecol. 2004, 41, 294–304. [Google Scholar] [CrossRef]
  17. Löw, F.; Fliemann, E.; Abdullaev, I.; Conrad, C.; Lamers, J.P. Mapping abandoned agricultural land in Kyzyl-Orda, Kazakhstan using satellite remote sensing. Appl. Geogr. 2015, 62, 377–390. [Google Scholar] [CrossRef]
  18. Szostak, M.; Wezyk, P.; Tompalski, P. Aerial orthophoto and airborne laser scanning as monitoring tools for land cover dynamics: A case study from the Milicz Forest District (Poland). Pure Appl. Geophys. 2014, 171, 857–866. [Google Scholar] [CrossRef] [Green Version]
  19. Zgłobicki, W.; Gawrysiak, L.; Baran-Zgłobicka, B.; Telecka, M. Long-term forest cover changes, within an agricultural region, in relation to environmental variables, Lubelskie province, Eastern Poland. Environ. Earth Sci. 2016, 75, 1373. [Google Scholar] [CrossRef] [Green Version]
  20. Kaim, D.; Kozak, J.; Kolecka, N.; Ziółkowska, E.; Ostafin, K.; Ostapowicz, K.; Gimmi, U.; Munteanu, C.; Radeloff, V.C. Broad scale forest cover reconstruction from historical topographic maps. Appl. Geogr. 2016, 67, 39–48. [Google Scholar] [CrossRef]
  21. Lieskovský, J.; Lieskovská, D. Cropland Abandonment in Slovakia: Analysis and Comparison of Different Data Sources. Land 2021, 10, 334. [Google Scholar] [CrossRef]
  22. Estacio, I.; Basu, M.; Sianipar, C.P.; Onitsuka, K.; Hoshino, S. Dynamics of land cover transitions and agricultural abandonment in a mountainous agricultural landscape: Case of Ifugao rice terraces, Philippines. Landsc. Urban Plan. 2022, 222, 104394. [Google Scholar] [CrossRef]
  23. Bezáková, M.; Bezák, P. Which sustainability objectives are difficult to achieve? The mid-term evaluation of predicted scenarios in remote mountain agricultural landscapes in Slovakia. Land Use Policy 2022, 115, 106020. [Google Scholar] [CrossRef]
  24. Kolecka, N.; Kozak, J.; Kaim, D.; Dobosz, M.; Ostafin, K.; Ostapowicz, K.; Price, B. Understanding farmland aban-donment in the Polish Carpathians. Appl. Geogr. 2017, 88, 62–72. [Google Scholar] [CrossRef]
  25. Bański, J. Gospodarka Ziemią w Polsce w Okresie Restrukturyzacji; Polska Akademia Nauk, Instytut Geografii i Przestrzennego Zagospodarowania im, Stanisława Leszczyckiego PAN: Warszawa, Poland, 1998. [Google Scholar]
  26. Bański, J. Changes in agricultural land ownership in Poland in the period of the market economy. Agric. Econ. 2011, 57, 93–101. [Google Scholar] [CrossRef] [Green Version]
  27. Janus, J.; Bożek, P.; Taszakowski, J.; Doroż, A. Decaying villages in the centre of Europe with no population decline: Long-term analysis using historical aerial images and remote sensing data. Habitat Int. 2022, 121, 102520. [Google Scholar] [CrossRef]
  28. GUS—Bank Danych Lokalnych, Bdl.stat.gov.pl. 2022. Available online: https://bdl.stat.gov.pl/ (accessed on 27 June 2022).
  29. Czapiewski, K.; Banski, J.; Górczynska, M. The impact of location on the role of small towns in regional development: Mazovia, Poland. Eur. Countrys. 2016, 8, 413. [Google Scholar] [CrossRef] [Green Version]
  30. Rymuza, K.; Bombik, A. Multidimensional analysis of social and economic development of some counties in Mazovia Voivodeship. Acta Sci. Polonorum. Oeconomia 2014, 13, 81–93. [Google Scholar]
  31. Ghuffar, S.; Bolch, T.; Rupnik, E.; Bhattacharya, A. A pipeline for AUTOMATED processing of Corona KH-4 (1962–1972) stereo imagery. arXiv 2022, arXiv:220107756. [Google Scholar]
  32. Challis, K.; Priestnall, G.; Gardner, A.; Henderson, J.; O’Hara, S. Corona remotely-sensed imagery in dryland archaeology: The Islamic city of al-Raqqa, Syria. J. Field Archaeol. 2004, 29, 139–153. [Google Scholar] [CrossRef]
  33. The CORONA Program. Web Page: National Reconnaissance Office Above and Beyond. Available online: https://www.nro.gov/History-and-Studies/Center-for-the-Study-of-National-Reconnaissance/The-CORONA-Program/ (accessed on 27 June 2022).
  34. Fekete, A. CORONA high-resolution satellite and aerial imagery for change detection assessment of natural hazard risk and urban growth in El Alto/La Paz in Bolivia, Santiago de Chile, Yungay in Peru, Qazvin in Iran, and Mount St. Helens in the USA. Remote Sens. 2020, 12, 3246. [Google Scholar] [CrossRef]
  35. Ostafin, K.; Iwanowski, M.; Kozak, J.; Cacko, A.; Gimmi, U.; Kaim, D.; Psomas, A.; Ginzler, C.; Ostapowicz, K. Forest cover mask from historical topographic maps based on image processing. Geosci. Data J. 2017, 4, 29–39. [Google Scholar] [CrossRef] [Green Version]
  36. Zhang, X.; Meng, X.; Li, C.; Shang, N.; Wang, J.; Xu, Y.; Wu, T.; Mugnier, C. Micro-Topography Mapping through Terrestrial LiDAR in Densely Vegetated Coastal Environments. ISPRS Int. J. Geo-Inf. 2021, 10, 665. [Google Scholar] [CrossRef]
  37. Leigh, C.L.; Kidner, D.B.; Thomas, M.C. The use of LiDAR in digital surface modelling: Issues and errors. Trans. GIS 2009, 13, 345–361. [Google Scholar] [CrossRef]
  38. Grudzień, M. “Geoportal.gov.pl”, Mapy.geoportal.gov.pl. 2022. Available online: https://mapy.geoportal.gov.pl/ (accessed on 27 June 2022).
  39. Malinowski, R.; Lewiński, S.; Rybicki, M.; Gromny, E.; Jenerowicz, M.; Krupiński, M.; Nowakowski, A.; Wojtkowski, C.; Krupiński, M.; Krätzschmar, E.; et al. Automated production of a land cover/use map of Europe based on Sentinel-2 imagery. Remote Sens. 2020, 12, 3523. [Google Scholar] [CrossRef]
  40. Copernicus Program. 2022. Available online: https://land.copernicus.eu/pan-european/high-resolution-layers/forests/forest-type-1/status-maps/forest-type-2018?tab=metadata (accessed on 27 June 2022).
  41. Copernicus Program User Manual. Available online: https://land.copernicus.eu/user-corner/technical-library/forest-2018-user-manual.pdf (accessed on 27 June 2022).
  42. Główny Urząd Geodezji i Kartografii. Instrukcja Techniczna K-2—Mapy Topograficzne do Celów Gospodarczych, 2nd ed.; Główny Urząd Geodezji i Kartografii: Warszawa, Poland, 1980.
  43. Vogt, P.; Riitters, K.H.; Estreguil, C.; Kozak, J.; Wade, T.G.; Wickham, J.D. Mapping spatial patterns with morphological image processing. Landsc. Ecol. 2007, 22, 171–177. [Google Scholar] [CrossRef]
  44. Zgłobicki, W.; Karczmarczuk, K.; Baran-Zgłobicka, B. Intensity and driving forces of land abandonment in Eastern Poland. Appl. Sci. 2020, 10, 3500. [Google Scholar] [CrossRef]
  45. Hościło, A.; Mirończuk, A.; Lewandowska, A. Determination of the actual forest area in Poland based on the available spatial datasets. Sylwan 2016, 160, 627–634. [Google Scholar]
  46. Janus, J.; Bozek, P. Land abandonment in Poland after the collapse of socialism: Over a quarter of a century of increasing tree cover on agricultural land. Ecol. Eng. 2019, 138, 106–117. [Google Scholar] [CrossRef]
  47. Budniak, P.; Zięba, S. Effects of Forest Fragmentation on the Volume of Wood Resources in Managed, Pine-Dominated Forests in Poland. Forests 2022, 13, 590. [Google Scholar] [CrossRef]
  48. Meyer, S.T.; Heuss, L.; Feldhaar, H.; Weisser, W.W.; Gossner, M.M. Land-use components, abundance of predatory arthropods, and vegetation height affect predation rates in grasslands. Agric. Ecosyst. Env. Ment 2019, 270, 84–92. [Google Scholar] [CrossRef]
  49. Biró, M.; Molnár, Z.; Öllerer, K.; Demeter, L.; Bölöni, J. Behind the general pattern of forest loss and gain: A long-term assessment of semi-natural and secondary forest cover change at country level. Landsc. Urban Plan. 2022, 220, 104334. [Google Scholar] [CrossRef]
  50. Batáry, P.; Fronczek, S.; Normann, C.; Scherber, C.; Tscharntke, T. How do edge effect and tree species diversity change bird diversity and avian nest survival in Germany’s largest deciduous forest? For. Ecol. Manag. 2014, 319, 44–50. [Google Scholar] [CrossRef]
  51. Fornal-Pieniak, B.; Łowicki, D.; Schwerk, A.; Li, J. Where is the forest core area? Gradients of flora in the ecotone of urban forests in Warsaw. Landsc. Urban Plan. 2022, 224, 104427. [Google Scholar] [CrossRef]
  52. Proesmans, W.; Bonte, D.; Smagghe, G.; Meeus, I.; Decocq, G.; Spicher, F.; Kolb, A.; Lemke, I.; Diekmann, M.; Bruun, H.H.; et al. Small forest patches as pollinator habitat: Oases in an agricultural desert? Landsc. Ecol. 2019, 34, 487–501. [Google Scholar] [CrossRef] [Green Version]
  53. Bojarska, K.; Maugeri, L.; Kuehn, R.; Król, W.; Theuerkauf, J.; Okarma, H.; Gula, R. Wolves under cover: The importance of human-related factors in resting site selection in a commercial forest. For. Ecol. Manag. 2021, 497, 119511. [Google Scholar] [CrossRef]
  54. Leal Filho, W.; Mandel, M.; Al-Amin, A.Q.; Feher, A.; Chiappetta Jabbour, C.J. An assessment of the causes and consequences of agricultural land abandonment in Europe. Int. J. Sustain. Dev. World Ecol. 2017, 24, 554–560. [Google Scholar] [CrossRef] [Green Version]
  55. Rendenieks, Z.; Nita, M.D.; Nikodemus, O.; Radeloff, V.C. Half a century of forest cover change along the Latvian-Russian border captured by object-based image analysis of Corona and Landsat TM/OLI data. Remote Sens. Environ. 2020, 249, 112010. [Google Scholar] [CrossRef]
  56. Jabs-Sobocińska, Z.; Affek, A.N.; Ewiak, I.; Nita, M.D. Mapping mature post-agricultural forests in the Polish eastern Carpathians with archival remote sensing data. Remote Sens. 2021, 13, 2018. [Google Scholar] [CrossRef]
  57. Watanabe, N.; Nakamura, S.; Liu, B.; Wang, N. Utilization of Structure from Motion for processing CORONA satellite images: Application to mapping and interpretation of archaeological features in Liangzhu Culture, China. Archaeol. Res. Asia 2017, 11, 38–50. [Google Scholar] [CrossRef]
  58. Congedo, L.; Sallustio, L.; Munafò, M.; Ottaviano, M.; Tonti, D.; Marchetti, M. Copernicus high-resolution layers for land cover classification in Italy. J. Maps 2016, 12, 1195–1205. [Google Scholar] [CrossRef] [Green Version]
  59. Fischer, R.; Taubert, F.; Müller, M.S.; Groeneveld, J.; Lehmann, S.; Wiegand, T.; Huth, A. Accelerated forest fragmentation leads to critical increase in tropical forest edge area. Sci. Adv. 2021, 7, eabg7012. [Google Scholar] [CrossRef] [PubMed]
  60. Cimatti, M.; Ranc, N.; Benítez-López, A.; Maiorano, L.; Boitani, L.; Cagnacci, F.; Čengić, M.; Ciucci, P.; Huijbregts, M.A.J.; Krofel, M.; et al. Large carnivore expansion in Europe is associated with human population density and land cover changes. Divers. Distrib. 2021, 27, 602–617. [Google Scholar] [CrossRef]
  61. Hu, X.; Huang, B.; Verones, F.; Cavalett, O.; Cherubini, F. Overview of recent land-cover changes in biodiversity hotspots. Front. Ecol. Environ. 2021, 19, 91–97. [Google Scholar] [CrossRef]
  62. Saleem, A.; Corner, R.; Awange, J. On the possibility of using CORONA and Landsat data for evaluating and mapping long-term LULC: Case study of Iraqi Kurdistan. Appl. Geogr. 2018, 90, 145–154. [Google Scholar] [CrossRef]
Figure 1. (a) The location of Szydłowiec county. Background national geographic map; (b) A photo of abandoned fields taken in July 2021, M. Shahbandeh.
Remotesensing 14 03852 g001
Figure 2. Flowchart of data preparation and analysis.
Remotesensing 14 03852 g002
Figure 3. Detecting objects and backdating the historical map by CORONA imagery in Szydłowiec county.
Remotesensing 14 03852 g003
Figure 4. 1970–2018 land cover change map and share of land cover change types in the Szydłowiec county. “f” represents forest, “n” represents non-forest, and “w” represents wooded area.
Remotesensing 14 03852 g004
Figure 5. Distribution of VH classes in land cover change categories.
Remotesensing 14 03852 g005
Figure 6. Distribution of distance classes from forest boundary.
Remotesensing 14 03852 g006
Figure 7. Maps of distribution of distance classes from forest boundary (a) 1970 forest and wooded area; (b) 1970 forest; (c) 2018 forest.
Remotesensing 14 03852 g007
Publisher’s Note: MDPI stays neutral with regard to jurisdictional claims in published maps and institutional affiliations.

