Article

Towards a New MAX-DOAS Measurement Site in the Po Valley: NO2 Total VCDs

1
National Research Council (CNR), Institute of Atmospheric Sciences and Climate (ISAC), Via Piero Gobetti 101, 40129 Bologna, Italy
2
Dipartimento di Fisica e Astronomia, Universitá di Bologna, Viale Berti Pichat 6/2, 40127 Bologna, Italy
3
Serco Italia S.p.A., Via Sciadonna 24, 00044 Frascati, Italy
*
Author to whom correspondence should be addressed.
Remote Sens. 2022, 14(16), 3881; https://doi.org/10.3390/rs14163881
Submission received: 21 June 2022 / Revised: 26 July 2022 / Accepted: 26 July 2022 / Published: 10 August 2022

Abstract

:
Multi-AXis Differential Optical Absorption Spectroscopy (MAX-DOAS) instruments are used worldwide to retrieve pollutant information from visible (VIS) and ultra-violet (UV) diffuse solar spectra. A similar instrument, able to meet the Fiducial Reference Measurements for DOAS (FRM4DOAS) standard requirements, is not yet present in the Po Valley (Italy), one of the most polluted regions in Europe. Our purpose is to close this gap exploiting the SkySpec-2D, a FRM4DOAS-compliant MAX-DOAS instrument bought by the Italian research institute CNR-ISAC in May 2021. As a first step, SkySpec-2D was involved in two measurement campaigns to assess its performance: the first one in August 2021 in Bologna where TROPOGAS, a research-grade custom-built MAX-DOAS instrument is located; the second one in September 2021 at the BAQUNIN facility at La Sapienza University (Rome) near the Pandora#117 instrument. Both campaigns revealed a good quality of SkySpec-2D measurements. Indeed, good agreement was found with TROPOGAS (correlation 0.77 ), Pandora#117 (correlation 0.9 ) and satellite (TROPOMI and OMI) measurements. Having assessed its performance, the SkySpec-2D was permanently moved to the “Giorgio Fea” observatory in San Petro Capofiume, located in the middle of the Po Valley, where it has been continuously acquiring zenith and off-axis diffuse solar spectra from the 1 October 2021. Nowadays, its MAX-DOAS measurements are routinely provided to the FRM4DOAS team with the purpose to be soon included in the FRM4DOAS validation network.

1. Introduction

The direct link between traffic, pollution from industries, and health diseases, especially in big cities, has been reported by several studies. NO 2 , CO, O 3 and CH 4 concentrations, as well as particulates (PM2.5 and PM10), can have an impact on different types of diseases (from cardiovascular [1] to respiratory [2]). For this reason, the monitoring of those species, routinely carried out by local and national agencies, provides an important contribution to the success of sustainable development goals [3] such as ensuring healthy lives and making cities safe and sustainable. In particular, NO x (the sum of NO and NO 2 ) plays a crucial role in air quality but also in climate change issues.
Tropospheric NO x is mainly due to anthropogenic sources. According to [4], in Italy in 2018 the main source of NO x emissions was road transport (about 43%); other mobile sources and machinery contribute to the total emissions with 19%, combustion in energy contributes for 6% and combustion in industry for 9%. Non-industrial combustion plants account for 13% of the total. In 2019, due to the lockdown restrictions adopted to contain the COVID-19 pandemic, a reduction of NO 2 tropospheric concentrations has been observed over Europe from ground-based and satellite instruments [5,6]. In Italy, an important pollution reduction has been observed around Rome [7,8] and in the Po Valley [9,10], in the northern part of Italy. The Po Valley is the most industrialized and polluted area of Italy; here, high mountains surround the Po basin, preventing pollution from dispersion, especially in wintertime.
The Differential Optical Absorption Spectroscopy (DOAS) technique is used worldwide to derive information on trace gas concentrations, e.g., of NO 2 . In particular, zenith-sky measurements have been exploited to retrieve NO 2 Vertical Column Densities (VCDs) [11] and tropospheric columns [12], while Multi-AXis DOAS (MAX-DOAS) instruments, employed in the most polluted Western European countries (e.g., in Belgium, Germany, and the Netherlands), are particularly suitable for deriving NO 2 vertical profiles in the lower part of the troposphere. In addition to their importance for air quality studies, MAX-DOAS instruments are particularly suitable for the validation of satellite products (together with Zenith-Sky DOAS and Direct Sun instruments (e.g., Pandora)) [13,14,15]. These aspects motivated the European Space Agency (ESA) to fund a project named Fiducial References Measurements for DOAS (FRM4DOAS, https://frm4doas.aeronomie.be, last access on 5 August 2022) for the homogenization of MAX-DOAS measurements and processing practices [16,17].
Despite being the most polluted Italian area, no continuous DOAS/MAX-DOAS measurements compliant with FRM4DOAS standards are performed in the Po Valley. DOAS measurements not compliant with the standards were performed in the framework of a few campaigns (e.g., [18,19]) and from two DOAS/MAX-DOAS instruments, developed at CNR-ISAC and located in the Emilia Romagna Region: one at Mount Cimone and the other in Bologna. The instrument located in Bologna is the Tropospheric Gas Analyser Spectrometer (TROPOGAS) and has measured diffuse solar spectra on the roof of the CNR-ISAC building since 2018. This remote sensing UV–VIS system has the capability to measure at different elevations and azimuthal angles, which is necessary for MAX-DOAS applications.
The need for DOAS measurements satisfying Quality Assurance (QA) criteria motivates, in the frame of the Instrument Data Evaluation and Analysis Service (IDEAS+) Quality Assurance for Earth Observation (QA4EO) service DOAS-BO ESA project, the assessment of the performances of the TROPOGAS spectrometer with respect to FRM4DOAS requirements and the update of its measurement configuration and data analysis to follow the FRM4DOAS standards as much as possible [20]. In May 2021, the CNR-ISAC institute acquired a new MAX-DOAS system in the context of the Italian funded project “Sviluppo delle Infrastrutture e Programma Biennale degli Interventi del Consiglio Nazionale delle Ricerche—Potenziamento Infrastrutturale: progetti di ricerca strategici per l ente. Progetto 32—ASSE NORD Pianura Padana Mt. Cimone, Bologna, San Pietro Capofiume”. The chosen system is the SkySpec-2D-210 (herein SkySpec-2D), which is compliant with FRM4DOAS requirements. The selected location for this system is the “Giorgio Fea” meteorological observatory at San Pietro Capofiume (herein SPC), Bologna, in the middle of the Po Valley and far from cities and local polluted hot spots. That position is representative of the background pollution in the Po Valley and makes these measurements suitable for satellite validation.
The two projects mentioned above create opportunities to:
  • re-enforce the Italian know-how on DOAS/MAX-DOAS techniques, following the legacy of the CNR-ISAC institute;
  • re-enforce the observational potential of the Po Valley infrastructure through the acquisition of a ground-based remote sensing instrument compliant with ESA reference standards that can be used for both satellite validation and scientific studies of air quality in one of the most polluted European regions.
In this paper, we describe the work carried out to set up the new MAX-DOAS measurement site at SPC in the Po Valley. To assess its performance against a similar instrument, the SkySpec-2D system was employed in an inter-comparison campaign with the research-grade custom-built TROPOGAS spectrometer in Bologna in August 2021. Then, at the beginning of September 2021, the instrument took part in a second inter-comparison campaign at the Boundary-layer Air Quality-analysis Using Network of Instruments (BAQUNIN, [21]) super-site at La Sapienza University in Rome, where the Pandora#117 instrument, fiducial reference instrument for satellite validation, is located. Finally, at the end of September 2021, the SkySpec-2D was installed at its final location at the “Giorgio Fea” SPC observatory. Here, we describe the results of the inter-comparison campaigns and show the first results of NO 2 total VCD retrievals obtained in a nine-month period by the SkySpec-2D at SPC. Comparisons with collocated satellite data are also reported (e.g., from the TROPOspheric Monitoring Instrument (TROPOMI) [22] and the Ozone Monitoring Instrument (OMI) [23]). For the comparisons, we consider the total NO 2 VCDs, retrieved from zenith-sky MAX-DOAS measurements, from sun direct Pandora measurements, and from satellite measurements.
The paper is structured as follows: Section 2 briefly describes the instruments used during this work, the analysis method adopted and the inter-comparison campaigns performed to evaluate the performances of the SkySpec-2D instrument that is now installed at the “Giorgio Fea” SPC station. Results are given in Section 3, discussion in Section 4 and conclusions in Section 5.

2. Materials and Methods

2.1. Ground-Based Instruments

As the primary objective of this paper is to assess the SkySpec-2D performances, its measurements have been compared to the ones acquired by two other ground-based remote sensing systems: the TROPOGAS and the Pandora systems. A brief description of the three instruments involved in this study is given in this section.

2.1.1. SkySpec-2D

The SkySpec-2D is developed by Airyx GmbH (previously EnviMes) (https://airyx.de, last access on 5 August 2022). Since the SkySpec instrument series allows for low-effort, efficient, and reliable atmospheric observations with the passive DOAS method (according to Verein Deutscher Ingenieure (VDI) standard 4212), they are commonly used by the DOAS community. Its spectra, acquired in the UV and VIS spectral regions (from 300 nm to 550 nm approximately), provide information on the tropospheric and stratospheric concentration and distribution of various trace gases, e.g., NO 2 , SO 2 , formaldehyde, and aerosol optical depth. The SkySpec-2D system is composed of a measurement PC, a case containing two spectrometers (one for VIS and the other for UV) that must be placed indoors, and a telescope coupled with the spectrometers through an optical fiber. To increase the signal-to-noise ratio (SNR), each spectrum is acquired in a total time between 20 and 50 s, depending on the time of day, and is the sum of several spectra, each of them measured within an exposure time automatically estimated to prevent the saturation of the CCD sensor. This model of Airyx instrument already took part in FRM4DOAS campaigns such as the Cabauw Intercomparison of Nitrogen Dioxide Measuring Instruments (CINDI) [24].

2.1.2. TROPOGAS

The TROPOGAS spectrometer is a research-grade, custom-built system developed at CNR-ISAC. It has a spectral resolution of about 0.4 nm in the UV region and 0.5 nm in the VIS region and measures zenith and off-axis atmospheric scattered radiation in the spectral region from 300 to 600 nm. In the core of the spectrometer, the radiation is measured by a cooled (at 20 C to reduce the thermal noise and dark current) charge-coupled device (CCD) sensor. For spectral analysis, a spectral binning is performed to improve the signal-to-noise ratio as well as the time resolution of the measurements. The TROPOGAS spectrometer is coupled with an Alt-Azimuth platform, developed and implemented at CNR-ISAC in collaboration with the Evora University, with an optical fibre, and it is used for off-axis and zenith-sky measurements of diffuse solar radiation. The Alt-Azimuth platform is a small telescope with a mirror lens, a field of view (FOV) of a few degrees, and both azimuth and zenith movements. Every spectrum acquired by TROPOGAS is the average of a fixed number of 36 spectra, each of them acquired in the same time, from 0 to 3 s, automatically estimated to prevent the saturation of the CCD sensor. In general, the acquisition of a TROPOGAS measurement requires a higher total time than SkySpec-2D. More details on the system can be found in [25,26].

2.1.3. Pandora

The Pandora instrument performs direct-sun measurements in the UV–VIS spectral range (280–525 nm) and provides NO 2 , O 3 , and CH 2 O total VCDs, among other products. The trace gas amount is determined using the DOAS technique and the theoretical solar spectrum as a reference. Data are retrieved with a temporal resolution of 80 s. The Pandonia Global Network (PGN) is the net of instruments used to monitor trace gases all over the world (currently over 100 locations, see https://www.pandonia-global-network.org, last access on 5 August 2022). The data produced by PGN instruments are calibrated, processed, visualized, and distributed on the PGN central server. The full description of the Pandora instrument and the algorithm for the inversion methodology can be found in [27]. In this work, we use the data of the Pandora#117 system located at the BAQUNIN super-site of University La Sapienza in Rome (https://www.baqunin.eu/, last access on 5 August 2022) [21].

2.2. Analysis Method

Here, we describe the general analysis steps performed to estimate the NO 2 VCDs from the measurements acquired by the two MAX-DOAS instruments (SkySpec-2D and TROPOGAS) during both the measurement campaigns. More specific details on each campaign will be provided in Section 2.3 and Section 2.4.

2.2.1. DOAS Fit for SCDs Estimate

We analyse the zenith-sky spectra measured by the two CNR-ISAC MAX-DOAS systems (TROPOGAS and SkySpec-2D) with the DOAS technique to retrieve NO 2 Total VCDs. The full description of the technique is beyond the scope of the present work and more details can be found in [28]. In the first step, NO 2 Slant Column Densities (SCDs) are estimated from the measured zenith-sky spectra. The zenith-sky spectra are processed by the QDOAS (https://uv-vis.aeronomie.be/software/QDOAS/, last access on 5 August 2022) software, which estimates the NO 2 SCDs and their errors due to the fit. These errors are about 10 15 molec/cm 2 for both TROPOGAS and SkySpec-2D and can be considered random. In this step, all the measurements acquired by each of the two MAX-DOAS instruments are analyzed with respect to a fixed reference spectrum, chosen at low SZA (around noon), in order to avoid high atmospheric absorption.
For the QDOAS analysis, NO 2 cross-sections at different temperatures can be used depending on the target of the analysis: the cross-section at 220 K is used for stratospheric VCDs retrievals, while the one at 298 K is mainly used for tropospheric NO 2 VCD retrievals and in MAX-DOAS applications. In the next Section 2.3 and Section 2.4, we will discuss the choices of the NO 2 absorption cross-sections used in the different campaigns. Moreover, the effect of using NO 2 cross-sections at different temperatures is further discussed in Section 3.

2.2.2. Air Mass Factors Simulation

The SCDs are converted into VCDs using Air Mass Factors (AMFs) calculated with the SCIATRAN code [29]. The AMFs are simulated considering standard trace gases, temperature and pressure vertical profiles available in the SCIATRAN code, which account for monthly and latitudinal variations. No presence of aerosol and a constant surface albedo of 0.3 are used for the simulations. However, real AMFs can strongly differ from the simulated ones, introducing an important source of error [30,31]. Indeed, we performed some tests that showed us that just the NO 2 input profile can affect the simulated AMFs more than 100% in highly polluted conditions and mainly at high SZAs.

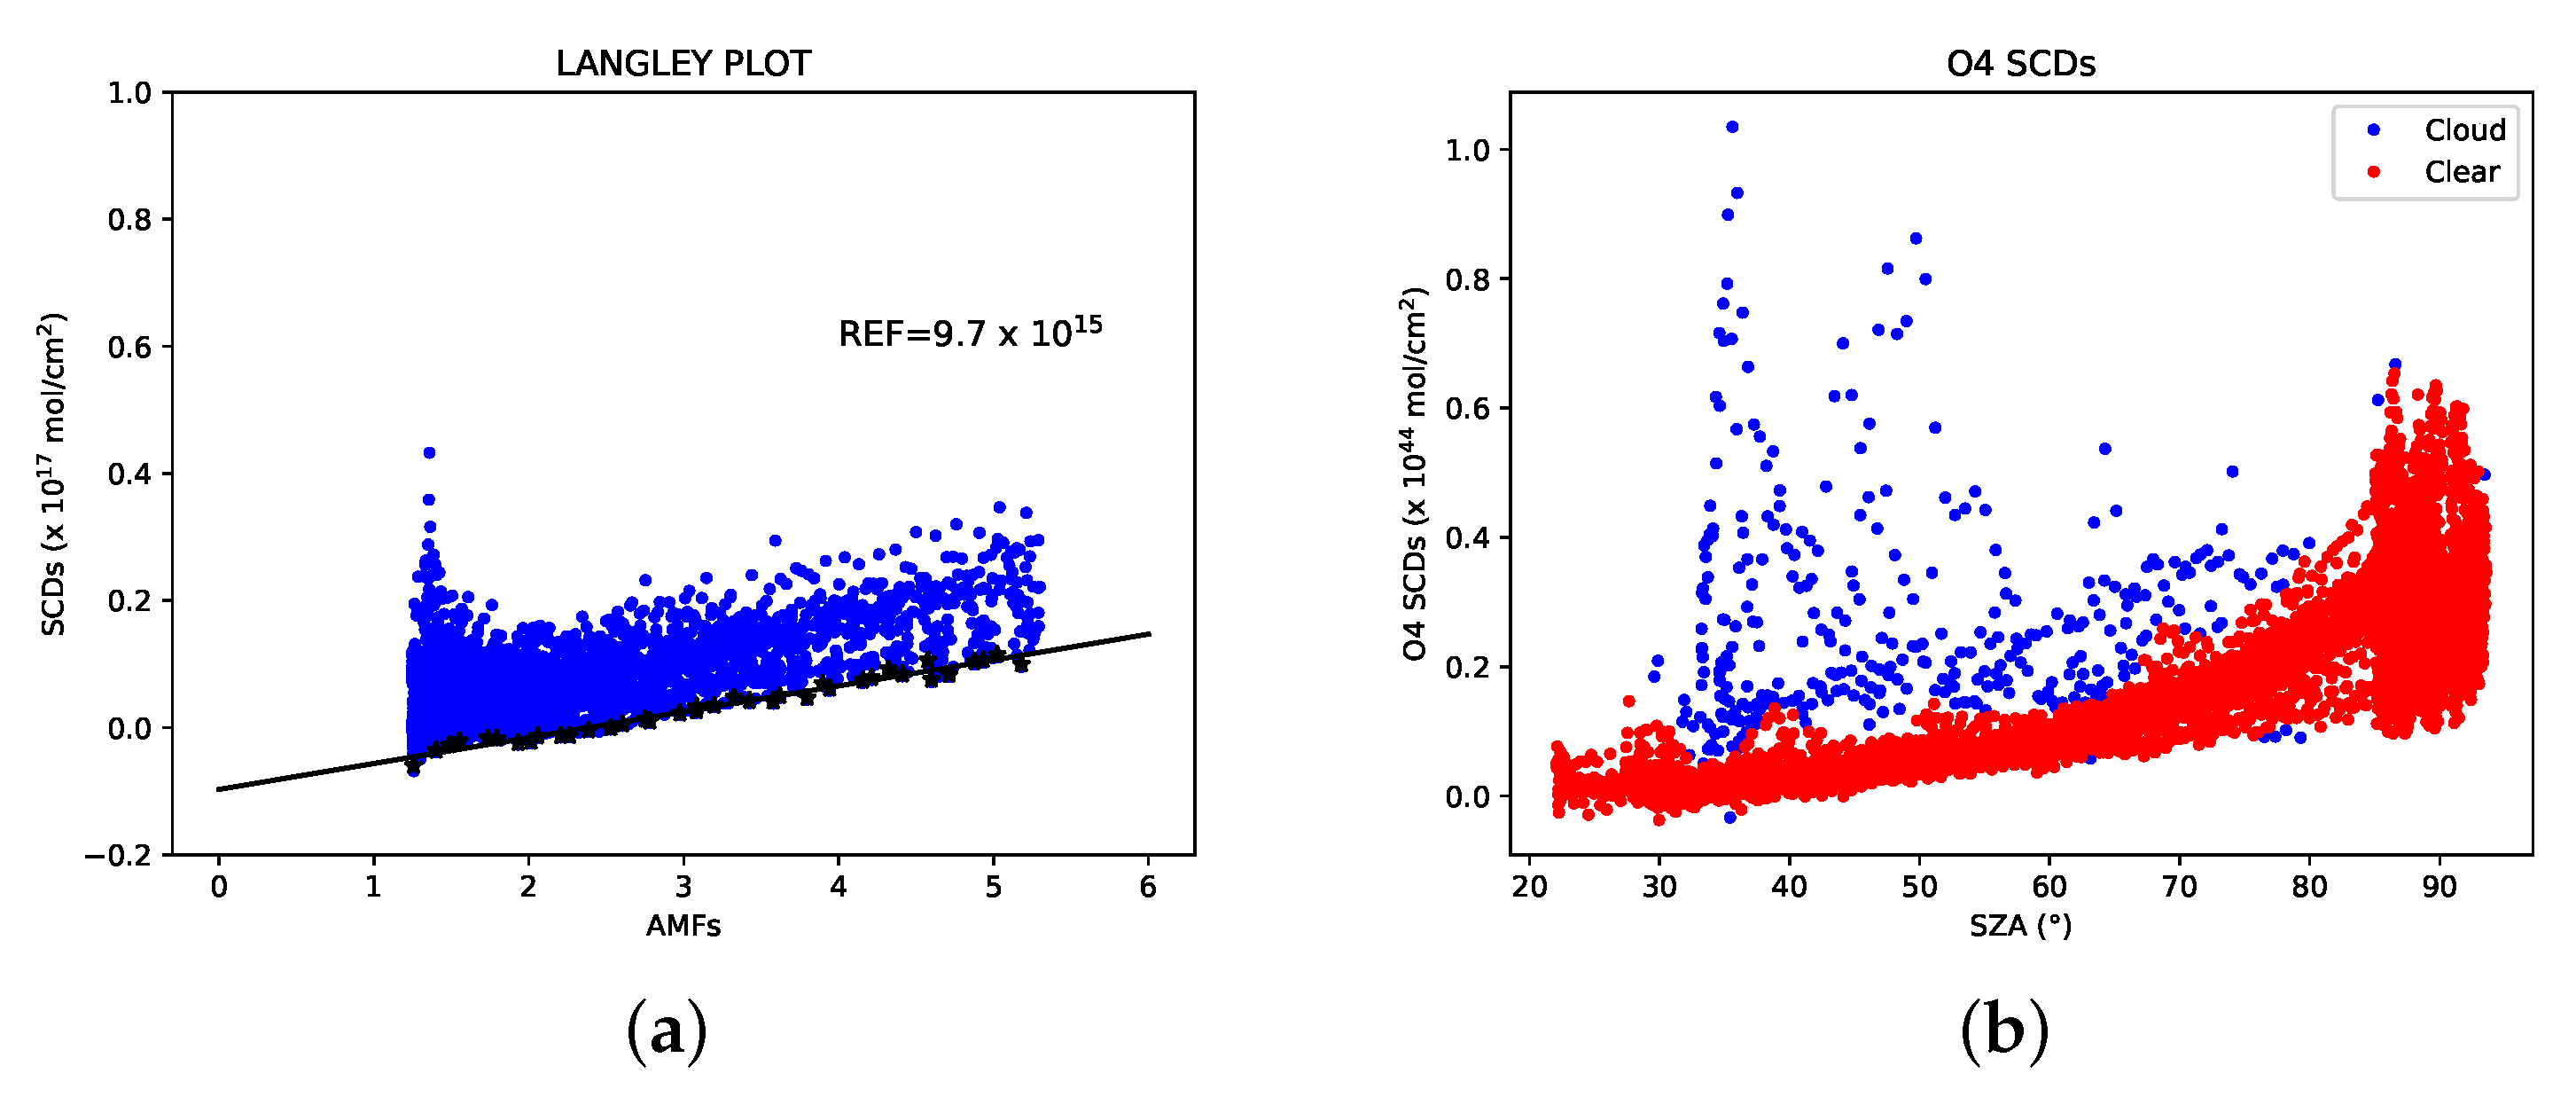
2.2.3. Reference Contribution Estimate

Since the NO 2 absorption in the reference spectrum is not negligible, its contribution is inferred through the use of the Minimum Langley Extrapolation (MLE) [27] and is added to the retrieved SCDs. For the MLE plot analysis, all the measurements relative to SZAs < 80 are considered. We divide the SCDs into different AMFs bins (0.1 width), finding the lowest SCD value (please consider that we removed the outliers that fall outside 3 standard deviations). Linear interpolation is then applied to the minimum values relative to the bins which contain a significant population. The value of the intercept is the SCD reference contribution. To estimate the uncertainty related to the knowledge of the reference contribution, we analyzed a long period of SkySpec-2D data with the QDOAS, with respect to the same reference spectrum, and then we applied the MLE plot method to different measurement periods. We have noticed that the estimated intercepts tend to differ with a spread of the order of 2 × 10 15 molec/cm 2 . We consider this as the error in the reference contribution. Its contribution to the final NO 2 VCDs errors will depend on the AMFs, affecting the NO 2 VCDs related to low AMFs more heavily. Final results on the estimated references for both TROPOGAS and SkySpec-2D, in the two measurement campaigns, are shown in the Section 2.3 and Section 2.4.

2.2.4. Filtering of Data Affected by Clouds

Since O 4 presents absorption features in the same spectral windows used to retrieve NO 2 SCDs, we also retrieved the O 4 SCDs that are used to filter out the measurements heavily affected by clouds (see [32]). Indeed, as O 4 concentrations are almost constant in the atmosphere, variations in its SCDs are related to different paths crossed by light, due to scattering processes. The filtering is based on an iterative process that exploits the information coming from the O 4 SCDs and NO 2 VCDs retrieved in the current iteration. This type of filtering is applied to zenith measurements only. The first step consists of dividing all the O 4 SCDs into 3 -wide SZA bins and computing the O 4 SCD median value for each bin. Since we know that most days during the campaigns were sunny, we assume that all these median values correspond to clear-sky conditions. At this point, to classify clear and cloudy data, we need to define, for each SZA bin, a maximum distance from the O 4 SCD median value. In this way, data with O 4 SCDs which fall outside the chosen range are filtered out. This threshold is estimated through an iterative process. In the first step, the criterion is very stringent, leading to a low number of clear-sky data. During every iteration, the O 4 range, in each SZA bin is increased, leading to more clear-sky data. The process, in each SZA bin, stops when an important difference arises between the retrieved NO 2 VCDs labeled as clear and cloudy. In this way, we are confident to be filtering out the NO 2 VCDs labeled as cloudy that are systematically biased compared to the clear-sky ones. Final filtering results for both TROPOGAS and SkySpec-2D instruments, in the two measurement campaigns, are reported in the Section 2.3 and Section 2.4.

2.3. Bologna Inter-Comparison Campaign

The inter-comparison campaign between SkySpec-2D and TROPOGAS was performed on the roof of the CNR-ISAC headquarter (Lat: 44.52 N, Lon: 11.34 E, Altitude: 39 m a.s.l., 25 m a.g.l., Figure 1) within the CNR campus (Via Gobetti 101, Bologna, Italy) located in the city suburbs. The measurement site is classified as urban background. The A14 motorway, the Bologna (BLQ) international airport, and the city center are located 0.8 km to the north, 2.6 km to the west and 1.7 km to the south, respectively. The SkySpec-2D vs TROPOGAS campaign was held from 4 August to 2 September 2021. The period was characterized by generally stable and sunny weather. The TROPOGAS used a measurement configuration that follows the FRM4DOAS guidelines. The SkySpec-2D operated in a similar way.
The TROPOGAS analysis was performed using a fixed reference spectrum (measured on 11 August 2021 at 29.10 SZA). QDOAS set-up is reported in Table A1. We decided to analyse the TROPOGAS spectra using the absorption cross-section at 298 K. This choice is in agreement with the results in [33], where the authors state that, in polluted European regions, the effective temperatures representing NO 2 total column is estimated to be about 270–280 K.
The SkySpec-2D analysis set-up is reported in Table A2. This set-up is almost the same used for TROPOGAS apart from the larger spectral interval used.
In this case, we also chose to fit the NO 2 SCDs using the cross-section at 298 K in order to be consistent with the TROPOGAS analysis. Moreover, for consistency reasons, the fixed reference spectrum used in the SkySpec-2D analysis was chosen as much as possible in close time coincidence with the one used for the TROPOGAS analysis (measured on 11 August 2021 at 29 . 38 SZA).
The MLE plot analysis applied to TROPOGAS and SkySpec-2D SCDs provides the reference contributions of 4.5 × 10 15 molec/cm 2 (see Figure 2a) and 9.7 × 10 15 molec/cm 2 (see Figure 3a). Although the two chosen reference spectra are close in time, the two reference contributions are different due to the high temporal variability in NO 2 VCDs occurring in the central hours of that day.
At the end of the filtering process, 94% of data, acquired by TROPOGAS, were marked as not heavily contaminated by clouds, as can be seen in Figure 2b, while the SkySpec-2D clear-sky make up 96% of the observations (Figure 3b).
For comparison with satellite data, the TROPOGAS and SkySpec-2D VCDs were averaged in a time interval of ±60 min centered on the satellite overpass time. This high averaging time-range was applied to improve statistical significance, since TROPOGAS exposure times are higher than those for SkySpec-2D, leading to fewer measured spectra in a given amount of time.

2.4. BAQUNIN Inter-Comparison Campaign

The SkySpec-2D vs Pandora inter-comparison campaign was performed at the physics department of La Sapienza University (Lat: 41.90 N, Lon: 12.52 E, Altitude: 75 m a.s.l., Figure 1), part of the BAQUNIN super-site [21]. Since the super-site has among its primary objectives the validation of satellite products, best practices and QA procedures were applied. The campaign was held in the time period from 6 to 21 September 2021. The weather was sunny for the majority of the days, allowing the collection of good-quality spectra. The inter-comparison campaign was performed simultaneously to the QUAlity and TRaceabiliy of Atmospheric aerosol Measurements (QUATRAM)3 campaign.
In contrast with the analysis method described for the campaign in Bologna, we decided to analyze the data, acquired during the measurement campaign in Rome, using the cross-section at 254.5 K, in order to be as consistent as possible with the Pandora analysis. Indeed, for the Pandora processing, the NO 2 cross-section used was corrected for the effective temperature which, during the measurement campaign, was estimated to be on average around 270 K. Regardless, for completeness, we will show the impact of the different cross-section temperatures on the final SkySpec-2D VCDs (see Section 3.2).
For the BAQUNIN campaign, the fixed reference spectrum used in the analysis was chosen on a clear-sky day according to the pictures recorded by the SkySpec-2D cameras (spectrum measured on 12 September 2021 at 37 . 89 SZA). The MLE plot, reported in Figure 4a, shows an estimated reference contribution of 1.0 × 10 16 molec/cm 2 .
The zenith SCDs were further processed to remove the heavily cloud-contaminated measurements. The filtering based on using O 4 SCDs excludes 5% of the observations (Figure 4b).
For comparison with satellite data, the SkySpec-2D VCDs are averaged in a ±15 min time interval centered on the satellite overpass time.

2.5. Correlative Data

2.5.1. Pandora Data

During the BAQUNIN campaign, the SkySpec-2D and the Pandora#117 operated in close coincidence. The PGN centrally processes the spectra acquired by the Pandora instruments. The Pandora #117 data were directly downloaded from the PGN website (https://www.pandonia-global-network.org/, last access on 5 August 2022). We used the most updated version of the data for NO 2 (rnvs3p1-8). We considered only Pandora retrievals with a data quality flag value of 0 or 10, corresponding to the so-called assured high-quality data [34]. We will restate here that for the Pandora data analysis, the effective temperature of the NO 2 profile is estimated during the fit. The average value of the retrieved effective temperature during the campaign corresponds to about 270 K.
For comparison with satellite data, the Pandora #117 VCDs were averaged in a time interval of ±15 min centered on the satellite overpass time.

2.5.2. TROPOMI and OMI Satellite Data

Both Pandora- and MAX-DOAS-retrieved VCDs are routinely used for satellite validation [14,15,35,36]. In particular, they are used for TROPOMI NO 2 product validation.
TROPOMI is a passive-sensing hyperspectral nadir-viewing imager aboard the S-5P satellite, a near-polar Sun-synchronous orbit satellite flying at an altitude of 817 km, with an overpass local time at ascending node of 13:30. TROPOMI has a swath width of approximately 2600 km and a spatial resolution of 3.5 × 7 (5.5) km. TROPOMI has four separate spectrometers that measure UV to SWIR in order to retrieve the concentrations of several atmospheric constituents, including O 3 , NO 2 , SO 2 , CO, CH 4 , and CH 2 O, as well as aerosol properties and surface UV radiation. The instrument and the product data are described in detail in [22,37].
OMI is a UV–VIS nadir-viewing spectrometer developed by the Netherlands’ Agency for Aerospace Programs and the Finnish Meteorological Institute. It is onboard NASA’s EOS-Aura satellite platform. EOS-Aura has a Sun-synchronous polar orbit with an overpass local time at ascending node of 13:30. The nominal footprint of the OMI ground pixels is 24 × 13 km (across × along-track) at nadir to 165 × 13 km at the edges of the 2600 km swath. For more details on the instrument, see [23,38].
For S-5P TROPOMI, we used the OFFL NO 2 products [39,40]. For EOS-Aura OMI, we used the Multi-Decadal Nitrogen Dioxide and Derived Products from Satellites (MINDS) [41], which have been developed with the aim to be consistent data records currently spanning about 15 years. At the moment, the MINDS archive covers the period from 1 October 2004 to 1 October 2021. For this reason, no comparison with OMI data after September 2021 was performed.
During this work, for both satellites, we used the NO 2 summed total column, which is the sum of the tropospheric and stratospheric VCDs. This product is described by the data provider as the best physical estimate of the NO 2 vertical column and recommended for comparison to ground-based total column observations [42].
For TROPOMI, we used only products with a combined quality assurance value (qa_value) higher than 0.75 in order to remove cloudy spectra, parts of the scenes covered by snow/ice, errors and problematic retrievals [40]. Since a quality flag is not available for OMI, we used only data having the inverse of the cloud fraction greater than 0.75, as suggested in [43].
For the comparison with ground-based products, the satellite data were averaged over a circle centred on the ground site. For this, we used a 5 km radius for TROPOMI and 20 km radius for OMI, due to its lower spatial resolution.

3. Results

3.1. Bologna Inter-Comparison Campaign

The comparison between products from two MAX-DOAS instruments with different characteristics processed with the same analysis method is useful for the assessment of the instruments’ performances. This motivated the TROPOGAS versus SkySpec-2D comparison.
Figure 5a shows NO 2 filtered VCDs retrieved from 4 to 30 of August 2021 by SkySpec-2D and TROPOGAS and averaged over 5 min intervals. We observe a generally good agreement between the two ground-based instruments considering both the absolute VCDs values and their behavior during the day: the average difference is about 9%, with SkySpec-2D-retrieved VCDs higher than for the TROPOGAS ones (see Table 1). Zooming on the days 5 and 6 August (Figure 5b), we can appreciate how good the agreement is between the two instruments in reproducing the NO 2 variations during the day.
Considering again data averaged over 5 min intervals, the agreement between the two instruments, over the whole campaign period, is characterized by a correlation coefficient of 0.77, as can be seen from the scatterplot in Figure 6.
Moreover, the comparison with satellite data shows good results: in Figure 7 we report the comparison between S-5P TROPOMI NO 2 VCDs and ground-based instrument retrievals averaged in a time interval of 60 min around the TROPOMI overpass time. The average difference between satellite and ground-based results is about −15% with respect to SkySpec-2D and −3% with respect to TROPOGAS.
The comparison with OMI data was performed using the same time criteriom (60 min) and a relaxed spatial coincidence criteriom (20 km), to include a significant number of satellite data. The bias is of the order of −22% with respect to SkySpec-2D and −12% with respect to TROPOGAS (see Table 2).

3.2. BAQUNIN Inter-Comparison Campaign

Although the SkySpec-2D series of instruments are included in the FRM4DOAS network, to quantify the performances of our instrument we compared its measurements to the reference fiducial instrument Pandora#117. To evaluate the quality of the products of the SkySpec-2D instrument in the frame of satellite validation, we also compared the SkySpec-2D and Pandora #117 NO 2 VCDs to similar products retrieved from the S-5P TROPOMI and the EOS-Aura OMI observations.
The differences between the two ground-based datasets were evaluated considering the entire period of the measurement campaign. The two datasets were averaged on 5 min intervals. The plots in Figure 8 and Figure 9 show the scatterplot and daily distributions of NO 2 VCDs, respectively, retrieved by the two instruments. We observe an extremely high correlation between the two datasets (0.902). SkySpec-2D correctly reproduces all the features of the NO 2 distributions observed by Pandora #117. The bias between the two ground-based datasets is about −0.230 × 10 16 molecules/cm 2 (−24%). We analyzed the differences between SkySpec-2D and Pandora NO 2 VCDS also as a function of the hour of the day, the solar zenith angle and solar azimuthal angle. Since we are used only the SkySpec-2D zenith-sky observation, the only instrument that changes its observation geometry (directly pointing to the Sun) is the Pandora. We did not observe any evident dependency on these three quantities.
As already stated, for this campaign, we used NO 2 cross sections for an equivalent temperature of 254.5 K. However, in order to evaluate the impact and the uncertainty introduced by non-representative cross sections, we computed the SkySpec-2D VCDs considering also the cross sections at 220 K and 298 K, and we compared the different products with respect to the Pandora #117 VCDs, see Figure 9.
Generally, we observed that different cross sections work as an offset, and that they do not introduce any evident dependency from the SZA. We also observed that the uncertainty introduced using a non-representative cross section is up to 10%, as reported in [44]. We observed the best agreement using the NO 2 cross section at 298 K (−19% difference).
Finally, we evaluated the agreement between the ground-based instruments and the satellite datasets, exploiting the S-5P and EOS-Aura overpasses during the measurement campaign. In Figure 10, we report the distributions of the ground-based observations and the differences between these and the TROPOMI observations. Generally, we observed that both Pandora #117 and SkySpec-2D NO 2 VCDs overestimated the satellite NO 2 VCDs. We observed a bias of −25% for SkySpec-2D and −34% for Pandora#117 against S-5P TROPOMI, and of −60% for SkySpec-2D and −73% for Pandora#117 with respect to EOS-Aura OMI (not shown, coincidence criteria: 15 min, 20 km).

3.3. Routine Measurements of SkySpec-2D at SPC

After the two inter-comparison campaigns, the SkySpec-2D system was installed in its final destination, the “Giorgio Fea” observatory at SPC, on 1 October 2021. The “Giorgio Fea” meteorological station (Lat: 44.65 N, Lon: 11.62 E, Altitude: 11 m a.s.l., Figure 1) owned by the Agenzia regionale per la prevenzione, l’ambiente e l’energia dell’Emilia-Romagna (Arpae) is a historic base founded in the early 1980s. Several measurement activities, such as micro-meteorological and project campaigns, are performed at the center. The observatory, classified as rural background, hosts one of the two meteorological Arpae radars, the CMN-PV facility, and is part of the Aerosol, Clouds and Trace Gases Research Infrastracture (ACTRIS) Italy network.
In this work, we consider the SkySpec-2D retrieved total NO 2 VCDs from the 1 October to the 4 June 2022. Since, according to [33], the effective temperatures representing the NO 2 total column is estimated to be about 270–280 K in polluted European regions, as already mentioned in Section 2.3, the cross-section at 298 K was used. Apart from the 14 November 2021, the period from the end of December 2021 to 4 January 2022 and some days during May 2022 (interruptions due to technical issues), the Skyspec-2D operated continuously. The average NO 2 VCD is 0.70 × 10 16 molecules/cm 2 .
The comparison between TROPOMI data (averaged in a radius of 5 km around the “Giorgio Fea” observatory) and SkySpec-2D NO 2 VCDs (averaged in a time interval of 15 min around the TROPOMI overpass time) is shown in Figure 11. The average difference between satellite and ground-based results is of the order of +9%. As can be seen, the satellite- and ground-base-retrieved VCDs behave similarly.

4. Discussions

We compared NO 2 total VCDs retrieved from SkySpec-2D zenith-sky spectra with NO 2 total VCDs retrieved from the TROPOGAS instrument and with the ones from the Pandora#117 instrument. Results are summarized in Table 1.
The comparison was performed using mostly similar parameters for SCDs retrieval (e.g., cross-sections) to limit errors due to different processing methods. This can be easily done for the comparison with the TROPOGAS (bias +9%, see Table 1) instrument, where we can process the spectra in a very similar way through the use of similar configurations in the QDOAS software. The only contribution to the bias coming from the processing method is due to the uncertainties in the estimated references. As we wrote in Section 2.2.3, we estimated the error in the reference contribution to be about 2 × 10 15 molec/cm 2 . Since most of the measurements acquired during the campaign in Bologna are related to AMFs lower than 4 (see Figure 2a and Figure 3a), the reference contribution errors will affect most of the final NO 2 VCDs, for each instrument, with at least 0.5 × 10 15 molec/cm 2 . From these considerations, the bias found between SkySpec-2D and TROPOGAS (0.57 × 10 15 molec/cm 2 ) is fully consistent with the reference contribution errors. On the other hand, the errors in the AMFs (identical for both instruments) and in the SCDs (random errors), from the fit, do not contribute to the systematic bias. Part of the discrepancies found between SkySpec-2D and TROPOGAS NO 2 VCDs are also due to the instrumental differences, such as different FOVs and integration times.
Similar considerations can be made for the comparison with the satellite data during the campaign in Bologna. The biases between TROPOMI and SkySpec-2D (−1 × 10 15 molec/cm 2 ) and between TROPOMI and TROPOGAS (−0.2 × 10 15 molec/cm 2 ) are fully consistent with the reference contribution errors. Indeed, the TROPOMI overpass always occurs around noon, when the AMFs are lower than 2, leading to an error, propagated to the final NO 2 VCDs, of at least 1 × 10 15 molec/cm 2 . The spatial and temporal mismatches between satellite and ground-based acquisitions are responsible for the observed spread.
Different considerations must be made for the comparison with the Pandora#117 instrument, since the processing is performed by the PGN central facility and the instrument has a different measurement configuration (direct radiance measurements). For this reason, the bias is not only related to the uncertainties in the reference contributions, but also to the errors in the AMFs. Considering that we have a bias of −24% with cross-section at 254.5 K and of −19% at 298 K, we can evince that using a cross-section at 270 K, which is not present in literature and which represents the effective temperature for the Pandora#117 data (see Section 2.5.1), the bias would be of the order of −20%.
In addition, if we compare the performances of both ground-based instruments with respect to satellite data (central row of Table 2), we can find that SkySpec-2D and Pandora#117 have more similar biases (−25% and −34%, respectively) against TROPOMI than the bias found in the comparison between SkySpec-2D and Pandora#117 (−24%). This implies that the two instruments are affected by a lower bias near the satellite overpass time. This can be mainly due to the fact that near 1 PM, the position of the Sun determines a more similar viewing geometry between the two instruments than at other hours of the day, thus reducing possible differences due to errors in the AMFs.
In general, we can conclude that the SkySpec-2D results are within the range of the TROPOGAS and Pandora#117 ones; indeed, the SkySpec-2D NO 2 VCDs are higher than the TROPOGAS (9%) and lower than the Pandora#117 results (−20%).
This result highlights the quality of the SkySpec-2D NO 2 total VCDs and also the quality of the NO 2 total VCDs retrieved from the research-grade custom-built TROPOGAS instrument: despite the old design, the instrument is still competitive.
Table 2 shows the results of the comparison of satellite and ground-based retrieved NO 2 total VCDs for different locations, instruments and months. In general, the satellite data underestimate the NO 2 total VCDs with respect to the ground-based instruments in all locations for August, September, and October 2021. These differences are consistent with the well-known biases reported in the literature between NO 2 VCDs derived from satellite and ground-based instruments. In [13], the comparison between TROPOMI and Pandora instruments reveals that TROPOMI underestimates the NO 2 VCDs, mainly in polluted areas, by up to 40%. A similar bias affects OMI measurements in highly polluted conditions, by up to 50% [45]. Indeed, we found higher biases, in absolute values, in Rome, where the pollution conditions are worse than in Bologna.
Our results also reveal that the bias for OMI is, in absolute values, higher than for TROPOMI, mainly at La Sapienza (Rome). This is probably due to the low capability of OMI, due to its low spatial resolution, to properly detect polluted hot spots like Rome.
The only case where the satellite NO 2 total VCDs are higher than the corresponding SkySpec-2D ones is for the whole period from November to February in SPC, as can be seen from Figure 11. This is mainly related to the fact that our AMFs, simulated with NO 2 input profiles which contain low tropospheric amounts, differ a lot from the real AMFs, mainly during winter. Indeed, the Po Valley is known to be heavily polluted, mainly during the winter season, when thermal inversion conditions are usually present.
Figure 12a shows the impact that high NO 2 concentrations in the lower troposphere have on the NO 2 AMFs. As we can see, the AMFs are biased in different ways depending on the SZA. In particular, the AMFs that we used for estimating the NO 2 VCDs would be underestimated for low SZAs and overestimated for high SZAs in highly polluted conditions. Consequently, this would lead to an overestimation of the NO 2 VCDs for low SZAs and an underestimation for high SZAs. In Figure 12b, we can see that the bias between TROPOMI and DOAS NO 2 VCDs seems to agree with the previous considerations on the AMFs. Indeed, the bias increases with the SZAs and becomes large, mainly in highly polluted conditions. For low SZAs, the expected underestimation is less detectable because, as we can see, the NO 2 content is low. This dependence of the NO 2 VCDs on the SZAs is due to the fact that the TROPOMI overpass occurs almost at the same time, which corresponds to higher SZAs during December and January and lower SZAs in October and after March.
Another reason for the observed discrepancies during winter may be linked to the important spatial inhomogeneities in the NO 2 VCDs observed by TROPOMI only during winter (see Figure 11). Indeed, SkySpec-2D, being located in a rural area far from streets and other local pollution sources, may be representative of a very local low-pollution condition. These spatial inhomogeneities may be related to the atmospheric conditions in the Po Valley that, during winter, are affected by low vertical and horizontal mixing, due to the presence of thermal inversion and low wind conditions.

5. Conclusions

Although the Po Valley is the most polluted Italian area, no continuous DOAS/MAX-DOAS measurements compliant with FRM4DOAS standards have been performed there until now. The need for DOAS measurements satisfying QA criteria motivates, in the frame of the IDEAS-QA4EO DOAS-BO ESA project, the assessment of the performances of a built-in spectrometer (the TROPOGAS, located in Bologna) with respect to FRM4DOAS requirements. In addition, the CNR-ISAC institute acquired a new FRM4DOAS-compliant MAX-DOAS system (SkySpec-2D) in the frame of an Italian funded project. The selected location for this system is the “Giorgio Fea” meteorological observatory at SPC.
Since CNR-ISAC acquired the SkySpec-2D, the necessity of assessing the performances of an old-fashioned MAX-DOAS system, like the TROPOGAS, with respect to a new state-of-the-art system has been clear. For this purpose, we performed an inter-comparison campaign in Bologna during August 2021. We observed a generally good agreement (correlation of 0.77 considering filtered data) between the two ground-based MAX-DOAS instruments considering the absolute VCD values and their behavior during the day. TROPOGAS underestimates the NO 2 VCDs by about 9 % with respect to SkySpec-2D, and both ground-based instruments overestimate the NO 2 columnar content with respect to the satellite. Nevertheless, despite the old design and the aging of a few components, the analysis has shown that the TROPOGAS is still a remarkable instrument. It represents the MAX-DOAS know-how still present in Italy, and there is the intention to maintain it operative on the roof of the CNR-ISAC in Bologna as far as possible. The SkySpec-2D took part in the inter-comparison campaign at La Sapienza University in Rome (part of the BAQUNIN super-site) with the Pandora#117, part of the PGN, which provides valuable information on the total column of NO 2 and which is routinely used for satellite validation. The results highlight the good quality of SkySpec-2D measurements, with a correlation of 0.9 . SkySpec-2D underestimates the NO 2 VCDs with respect to Pandora#117 by about 20 % and both the ground-based instruments overestimate, more heavily than in Bologna, the NO 2 VCDs with respect to the satellite. The measurement campaign within the BAQUNIN super-site revealed the importance of having analogous systems close to each other to deeply investigate the production/destruction processes and the dynamics of the pollutants. Even on this basis, CNR-ISAC decided to pursue the opportunity to install the SkySpec-2D in the meteorological station “Giorgio Fea”, located at the rural site of SPC and to maintain the TROPOGAS at the CNR-ISAC premises in Bologna.
Finally, the SkySpec-2D has been deployed in its final collocation at SPC. The first months of zenith-sky spectra were analyzed to retrieve NO 2 total VCDs and compared with satellite products with good results (bias of 9 % ). To fully exploit the potential of MAX-DOAS measurements for retrieving aerosols and gaseous vertical profiles, a dedicated retrieval code is needed (e.g., [17]). We have not yet developed such a code, and we plan to do so in the future. For this reason, in this work, we report only results obtained using the DOAS technique and zenith-sky measurements. The quality of obtained NO 2 total VCDs, assessed against other ground-based and satellite products, is an indicator of the potential of this new MAX-DOAS station. Recently, the spectra recorded by the SkySpec-2D were delivered to the FRM4DOAS team with the purpose of soon officially being included in their centralized processing.
This exercise represents the first step towards a new Italian MAX-DOAS network that aims to cover one of the most significant polluted areas in Italy with fully FRM4DOAS-compliant MAX-DOAS systems. This study has also shown the crucial importance of synergies between different instruments to better exploiting an individual instrument’s potential.

Author Contributions

Conceptualization, E.C., E.P. and M.V.; formal analysis, P.P., E.C. and E.P.; data curation, M.B.; writing—original draft preparation, E.C., P.P. and E.P.; writing—review and editing, P.P., E.C., E.P., M.V., M.B. and B.M.D.; visualization, M.V., P.P., E.C. and E.P.; project administration, E.C. and M.V. All authors have read and agreed to the published version of the manuscript.

Funding

The SkySpec-2D system was acquired under the project “Sviluppo delle Infrastrutture e Programma Biennale degli Interventi del Consiglio Nazionale delle Ricerche—Potenziamento Infrastrutturale: progetti di ricerca strategici per l’ente. Progetto 32—ASSE NORD Pianura Padana Mt. Cimone, Bologna, San Pietro Capofiume”. The Bologna and BAQUNIN inter-comparison campaigns were under the project IDEAS-QA4EO WPs-2250-2251: “DOAS-BO: Towards a new FRM4DOAS-compliant site” SERCO-IDEAS-QA4EO-BO/SUB27—IDEAS-QA4EO—Quality Assurance For Earth Observation—QA4EO/SER/SUB/27, Instrument Data quality Evaluation and Assessment Service—Quality Assurance for Earth Observation (IDEAS-QA4EO) contract funded by ESA-ESRIN (n. 4000128960/19/I-NS).

Institutional Review Board Statement

Not applicable.

Informed Consent Statement

Not applicable.

Data Availability Statement

All data used in this work acquired by SkySpec-2D and TROPOGAS are available upon request to the authors. Pandora#117 data can be downloaded from the PANDONIA global network (http://data.pandonia-global-network.org/Rome-SAP/Pandora117s1/, last access on 5 August 2022).

Acknowledgments

The authors gratefully acknowledge Daniele Bortoli from the University of Evora for sharing his competences on the TROPOGAS instrument, Francescopiero Calzolari from CNR-ISAC for his help in the installation of SkySpec-2D in SPC and Fabrizio Ravegnani from CNR-ISAC for sharing his DOAS experience with us. The authors acknowledge the DOAS UV–VIS team at BIRA-IASB led by M. Van Roozendael for QDOAS. The authors also acknowledge the SCIATRAN developers. A special acknowledgment goes also to the BAQUNIN team who hosted the authors and the SkySpec-2D instrument for the measurement campaign. We thank Stefano Casadio, Alexander Cede and staff for their effort in establishing and maintaining the PGN instruments within the University of Rome, La Sapienza. The PGN is a bilateral project supported with fundings from NASA and ESA.

Conflicts of Interest

The authors declare no conflict of interest.

Appendix A

Table A1. QDOAS settings for TROPOGAS NO 2 SCDs calculations in visible spectral range; “orto.” means that cross sections are orthogonalized with respect to another cross section at a different temperature.
NO 2 VisRef. Cross Section
Calibration455–495 nm (6 points)
spectral range
Retrieval460–490 nm
spectral range
Considered XSNO 2 298 Kfrom Van Daele [46]
NO 2 220 Kfrom Van Daele [46]
(orto. to NO 2 298 K)
O 3 223 Kfrom Bogumil [47]
O 4 from Herman [48]
Ringcomputed according to [49]
O 3 293 Kfrom Bogumil [47]
(orto. to O 3 223 K)
Glyoxalfrom Volkamer [50]
H 2 Ofrom Herman [48]
Other fitsPolynomial deg. 5
linear offset order 1
Table A2. QDOAS settings for SkySpec-2D NO 2 SCDs calculations in visible spectral range; “orto.” means that cross sections are orthogonalized with respect another cross section at a different temperature. The NO 2 cross sections used for the measurement campaigns in Bologna and Rome are labeled with (a) and (b), respectively.
NO 2 VisRef. Cross Section
Calibration420–500 nm (6 points)
spectral range
Retrieval430–490 nm
spectral range
Considered XS(a) NO 2 298 Kfrom Van Daele [46]
(a) NO 2 220 Kfrom Van Daele [46]
(a) (orto. to NO 2 298 K)
(b) NO 2 254.5 Kfrom Van Daele [46]
O 3 223 Kfrom Bogumil [47]
O 4 from Herman [48]
Ringcomputed according to [49]
O 3 293 Kfrom Bogumil [47]
(orto. to O 3 223 K)
Glyoxalfrom Volkamer [50]
H 2 Ofrom Herman [48]
Other fitsPolynomial deg. 5
linear offset order 1

References

  1. Cesaroni, G.; Forastiere, F.; Stafoggia, M.; Andersen, Z.J.; Badaloni, C.; Beelen, R.; Caracciolo, B.; de Faire, U.; Erbel, R.; Eriksen, K.T.; et al. Long term exposure to ambient air pollution and incidence of acute coronary events: Prospective cohort study and meta-analysis in 11 European cohorts from the ESCAPE Project. BMJ-Br. Med. J. 2014, 348, f7412. [Google Scholar] [CrossRef] [PubMed] [Green Version]
  2. Raaschou-Nielsen, O.; Andersen, Z.J.; Beelen, R.; Samoli, E.; Stafoggia, M.; Weinmayr, G.; Hoffmann, B.; Fischer, P.; Nieuwenhuijsen, M.J.; Brunekreef, B.; et al. Air pollution and lung cancer incidence in 17 European cohorts: Prospective analyses from the European Study of Cohorts for Air Pollution Effects (ESCAPE). Lancet Oncol. 2013, 14, 813–822. [Google Scholar] [CrossRef]
  3. Varotsos, C.A.; Cracknell, A.P. Remote Sensing Letters contribution to the success of the Sustainable Development Goals-UN 2030 agenda. Remote Sens. Lett. 2020, 11, 715–719. [Google Scholar] [CrossRef]
  4. Taurino, E.; Bernetti, A.; Caputo, A.; Cordella, M.; De Lauretis, R.; D’Elia, I.; Di Cristofaro, E.; Gagna, A.; Gonella, B.; Moricci, F.; et al. Italian Emission Inventory 1990–2018, Informative Inventory Report; Technical Report; Institute for Environmental Protection and Research: Rome, Italy, 2020; ISBN 978-88-448-0994-2. Available online: https://www.isprambiente.gov.it/files2020/pubblicazioni/rapporti/Rapporto_319_2020.pdf (accessed on 5 April 2022).
  5. Varotsos, C.; Christodoulakis, J.; Kouremadas, G.A.; Fotaki, E.F. The signature of the coronavirus lockdown in air pollution in Greece. Water Air Soil Pollut. 2021, 232, 119. [Google Scholar] [CrossRef]
  6. Filonchyk, M.; Hurynovich, V.; Yan, H. Impact of COVID-19 lockdown on air quality in the Poland, Eastern Europe. Environ. Res. 2021, 198, 110454. [Google Scholar] [CrossRef] [PubMed]
  7. Bassani, C.; Vichi, F.; Esposito, G.; Montagnoli, M.; Giusto, M.; Ianniello, A. Nitrogen dioxide reductions from satellite and surface observations during COVID-19 mitigation in Rome (Italy). Environ. Sci. Pollut. Res. 2021, 28, 22981–23004. [Google Scholar] [CrossRef] [PubMed]
  8. Campanelli, M.; Iannarelli, A.M.; Mevi, G.; Casadio, S.; Diemoz, H.; Finardi, S.; Dinoi, A.; Castelli, E.; di Sarra, A.; Di Bernardino, A.; et al. A wide-ranging investigation of the COVID-19 lockdown effects on the atmospheric composition in various Italian urban sites (AER—LOCUS). Urban Clim. 2021, 39, 100954. [Google Scholar] [CrossRef]
  9. Masiello, G.; Cersosimo, A.; Falabella, F.; Mastro, P.; Pasquariello, P.; Serio, C.; Venafra, S. Assessment of air quality with TROPOMI during COVID-19 pandemic: NO2 over the Po valley. In Proceedings of the Remote Sensing of Clouds and the Atmosphere XXVI, Online, 13–18 September 2021; Volume 11859, pp. 1–10. [Google Scholar] [CrossRef]
  10. Filippini, T.; Rothman, K.J.; Goffi, A.; Ferrari, F.; Maffeis, G.; Orsini, N.; Vinceti, M. Satellite-detected tropospheric nitrogen dioxide and spread of SARS-CoV-2 infection in Northern Italy. Sci. Total Environ. 2020, 739, 140278. [Google Scholar] [CrossRef]
  11. Pommereau, J.P.; Goutail, F. Stratospheric O3 and NO2 observations at the Southern Polar Circle in summer and fall 1988. Geophys. Res. Lett. 2000, 15, 895. [Google Scholar] [CrossRef]
  12. Chen, D.; Zhou, B.; Beirle, S.; Chen, L.M.; Wagner, T. Tropospheric NO2 column densities deduced from zenith-sky DOAS measurements in Shanghai, China, and their application to satellite validation. Atmos. Chem. Phys. 2009, 9, 3641–3662. [Google Scholar] [CrossRef] [Green Version]
  13. Verhoelst, T.; Compernolle, S.; Pinardi, G.; Lambert, J.C.; Eskes, H.J.; Eichmann, K.U.; Fjaeraa, A.M.; Granville, J.; Niemeijer, S.; Cede, A.; et al. Ground-based validation of the Copernicus Sentinel-5P TROPOMI NO2 measurements with the NDACC ZSL-DOAS, MAX-DOAS and Pandonia global networks. Atmos. Meas. Tech. 2021, 14, 481–510. [Google Scholar] [CrossRef]
  14. Dimitropoulou, E.; Hendrick, F.; Pinardi, G.; Friedrich, M.M.; Merlaud, A.; Tack, F.; De Longueville, H.; Fayt, C.; Hermans, C.; Laffineur, Q.; et al. Validation of TROPOMI tropospheric NO2 columns using dual-scan multi-axis differential optical absorption spectroscopy (MAX-DOAS) measurements in Uccle, Brussels. Atmos. Meas. Tech. 2020, 13, 5165–5191. [Google Scholar] [CrossRef]
  15. Wang, C.; Wang, T.; Wang, P.; Rakitin, V. Comparison and Validation of TROPOMI and OMI NO2 Observations over China. Atmosphere 2020, 11, 636. [Google Scholar] [CrossRef]
  16. Donner, S.; Kuhn, J.; Van Roozendael, M.; Bais, A.; Beirle, S.; Boesch, T.; Bognar, K.; Bruchkouski, I.; Chan, K.L.; Doerner, S.; et al. Evaluating different methods for elevation calibration of MAX-DOAS (Multi AXis Differential Optical Absorption Spectroscopy) instruments during the CINDI-2 campaign. Atmos. Meas. Tech. 2020, 13, 685–712. [Google Scholar] [CrossRef] [Green Version]
  17. Friess, U.; Beirle, S.; Bonilla, L.A.; Boesch, T.; Friedrich, M.M.; Hendrick, F.; Piters, A.; Richter, A.; van Roozendael, M.; Rozanov, V.V.; et al. Intercomparison of MAX-DOAS vertical profile retrieval algorithms: Studies using synthetic data. Atmos. Meas. Tech. 2019, 12, 2155–2181. [Google Scholar] [CrossRef] [Green Version]
  18. Heckel, A.; Richter, A.; Tarsu, T.; Wittrock, F.; Hak, C.; Pundt, I.; Junkermann, W.; Burrows, J. MAX-DOAS measurements of formaldehyde in the Po-Valley. Atmos. Chem. Phys. 2005, 5, 909–918. [Google Scholar] [CrossRef] [Green Version]
  19. Masieri, S.; Bortoli, D.; Petritoli, A.; Kostadinov, I.; Premuda, M.; Ravegnani, F.; Carnevale, C.; Pisoni, E.; Volta, M.; Giovanelli, G. Tropospheric profile of NO2 over the Po Valley measured with scan DOAS spectrometer. In Proceedings of the Remote Sensing for Environmental Monitoring, GIS Applications, and Geology IX, Berlin, Germany, 31 August–3 September 2009; Volume 7478, pp. 657–666. [Google Scholar] [CrossRef]
  20. Castelli, E.; Pettinari., P.; Papandrea, E.; Cristofanelli, P.; Busetto, M.; Fratticioli, C.; Valeri, M. QA4EO DOAS-BO: Towards a new FRM4DOAS site in the Po Valley. In Proceedings of the ATMOS 2021, Online, 22–26 November 2021. [Google Scholar]
  21. Iannarelli, A.M.; Bernardino, A.D.; Casadio, S.; Bassani, C.; Cacciani, M.; Campanelli, M.; Casasanta, G.; Cadau, E.; Diémoz, H.; Mevi, G.; et al. The Boundary Layer Air Quality-Analysis Using Network of Instruments (BAQUNIN) Supersite for Atmospheric Research and Satellite Validation over Rome Area. Bull. Am. Meteorol. Soc. 2022, 103, E599–E618. [Google Scholar] [CrossRef]
  22. Veefkind, J.P.; Aben, I.; McMullan, K.; Forster, H.; de Vries, J.; Otter, G.; Claas, J.; Eskes, H.J.; de Haan, J.F.; Kleipool, Q.; et al. TROPOMI on the ESA Sentinel-5 Precursor: A GMES mission for global observations of the atmospheric composition for climate, air quality and ozone layer applications. Remote Sens. Environ. 2012, 120, 70–83. [Google Scholar] [CrossRef]
  23. Levelt, P.; Van den Oord, G.; Dobber, M.; Malkki, A.; Visser, H.; de Vries, J.; Stammes, P.; Lundell, J.; Saari, H. The Ozone Monitoring Instrument. IEEE Trans. Geosci. Remote Sens. 2006, 44, 1093–1101. [Google Scholar] [CrossRef]
  24. Kreher, K.; Van Roozendael, M.; Hendrick, F.; Apituley, A.; Dimitropoulou, E.; Friess, U.; Richter, A.; Wagner, T.; Lampel, J.; Abuhassan, N.; et al. Intercomparison of NO2, O-4, O-3 and HCHO slant column measurements by MAX-DOAS and zenith-sky UV-visible spectrometers during CINDI-2. Atmos. Meas. Tech. 2020, 13, 2169–2208. [Google Scholar] [CrossRef]
  25. Bortoli, D.; Silva, A.M.; Giovanelli, G. A new multipurpose UV-Vis spectrometer for air quality monitoring and climatic studies. Int. J. Remote Sens. 2010, 31, 705–725. [Google Scholar] [CrossRef]
  26. Premuda, M.; Masieri, S.; Bortoli, D.; Kostadinov, I.; Petritoli, A.; Giovanelli, G. Evaluation of vessel emissions in a lagoon area with ground based Multi axis DOAS measurements. Atmos. Environ. 2011, 45, 5212–5219. [Google Scholar] [CrossRef]
  27. Herman, J.; Cede, A.; Spinei, E.; Mount, G.; Tzortziou, M.; Abuhassan, N. NO2 column amounts from ground-based Pandora and MFDOAS spectrometers using the direct-sun DOAS technique: Intercomparisons and application to OMI validation. J. Geophys. Res.-Atmos. 2009, 114. [Google Scholar] [CrossRef] [Green Version]
  28. Platt, U.; Stutz, J. Differential Optical Absorption Spectroscopy (DOAS)—Principles and Applications; Springer Science & Business Media: Berlin, Germany, 2008; Volume 15. [Google Scholar] [CrossRef] [Green Version]
  29. Rozanov, V.; Buchwitz, M.; Eichmann, K.; de Beek, R.; Burrows, J. SCIATRAN—A new radiative transfer model for geophysical applications in the 240–2400 nm spectral region: The pseudo-spherical version. Adv. Space Res. 2002, 29, 1831–1835. [Google Scholar]
  30. Wagner, T.; Burrows, J.; Deutschmann, T.; Dix, B.; Von Friedeburg, C.; Frieß, U.; Hendrick, F.; Heue, K.P.; Irie, H.; Iwabuchi, H.; et al. Comparison of box-air-mass-factors and radiances for Multiple-Axis Differential Optical Absorption Spectroscopy (MAX-DOAS) geometries calculated from different UV/visible radiative transfer models. Atmos. Chem. Phys. 2007, 7, 1809–1833. [Google Scholar] [CrossRef] [Green Version]
  31. Hendrick, F.; Van Roozendael, M.; Kylling, A.; Petritoli, A.; Rozanov, A.; Sanghavi, S.; Schofield, R.; Von Friedeburg, C.; Wagner, T.; Wittrock, F.; et al. Intercomparison exercise between different radiative transfer models used for the interpretation of ground-based zenith-sky and multi-axis DOAS observations. Atmos. Chem. Phys. 2006, 6, 93–108. [Google Scholar] [CrossRef] [Green Version]
  32. Wagner, T.; Von Friedeburg, C.; Wenig, M.; Otten, C.; Platt, U. UV-visible observations of atmospheric O4 absorptions using direct moonlight and zenith-scattered sunlight for clear-sky and cloudy sky conditions. J. Geophys. Res. Atmos. 2002, 107, AAC-3. [Google Scholar] [CrossRef]
  33. Spinei, E.; Cede, A.; Swartz, W.H.; Herman, J.; Mount, G.H. The use of NO2 absorption cross section temperature sensitivity to derive NO2 profile temperature and stratospheric-tropospheric column partitioning from visible direct-sun DOAS measurements. Atmos. Meas. Tech. 2014, 7, 4299–4316. [Google Scholar] [CrossRef] [Green Version]
  34. Cede, A. Manual for Blick Software Suite 1.7. December 2019, Issue 1, Luftblick og, Mutters, Austria, Version 11. Available online: https://www.pandonia-global-network.org/wp-content/uploads/2019/11/BlickSoftwareSuite_Manual_v1-7.pdf (accessed on 22 November 2021).
  35. Judd, L.M.; Al-Saadi, J.A.; Szykman, J.J.; Valin, L.C.; Janz, S.J.; Kowalewski, M.G.; Eskes, H.J.; Veefkind, J.P.; Cede, A.; Mueller, M.; et al. Evaluating Sentinel-5P TROPOMI tropospheric NO2 column densities with airborne and Pandora spectrometers near New York City and Long Island Sound. Atmos. Meas. Tech. 2020, 13, 6113–6140. [Google Scholar] [CrossRef]
  36. Zhao, X.; Griffin, D.; Fioletov, V.; McLinden, C.; Cede, A.; Tiefengraber, M.; Müller, M.; Bognar, K.; Strong, K.; Boersma, F.; et al. Assessment of the quality of TROPOMI high-spatial-resolution NO2 data products in the Greater Toronto Area. Atmos. Meas. Tech. 2020, 13, 2131–2159. [Google Scholar] [CrossRef]
  37. KNMI. Sentinel 5 Precursor/TROPOMI KNMI and SRON Level 2 Input Output Data Definition. Technical Report S5PKNMI-L2-0009-SD, Koninklijk Nederlands Meteorologisch Instituut (KNMI). 2019. Available online: https://sentinel.esa.int/documents/247904/3119978/Sentinel-5P-Level-2-Input-Output-Data-Definition (accessed on 11 January 2020).
  38. Levelt, P.F.; Joiner, J.; Tamminen, J.; Veefkind, J.P.; Bhartia, P.K.; Zweers, D.C.S.; Duncan, B.N.; Streets, D.G.; Eskes, H.; van der, A.R.; et al. The Ozone Monitoring Instrument: Overview of 14 years in space. Atmos. Chem. Phys. 2018, 18, 5699–5745. [Google Scholar] [CrossRef] [Green Version]
  39. Loyola, D.; Lutz, R.; Argyrouli, A.; Spurr, R. S5P/TROPOMI ATBD Cloud Products; S5P-DLR-L2-ATBD-400I Issue 2.2; Technical Report; DLR: Cologne, Germany, 2020. [Google Scholar]
  40. Eskes, H.; van Geffen, J.; Folkert, B.; Kai-Uwe, E.; Arnoud, A.; Mattia, P.; Maarten, S.; Pepijn, V.J.; Loyola, D. Sentinel-5 Precursor/TROPOMI Level 2 Product User Manual Nitrogendioxide; Technical Report; S5P-KNMI-L2-0021-MA, CI-7570-PUM, issue 4.0.2; Koninklijk Nederlands Meteorologisch Instituut (KNMI): De Bilt, The Netherlands, 2021; Available online: https://sentinels.copernicus.eu/documents/247904/2474726/Sentinel-5P-Level-2-Product-User-Manual-Nitrogen-Dioxide.pdf/ad25ea4c-3a9a-3067-0d1c-aaa56eb1746b?t=1637071405160 (accessed on 5 April 2022).
  41. Lok, L.N.; Krotkov, N.A.; Marchenko, S.V.; Joiner, J.; Oman, L.; Vasilkov, A.; Fisher, B.; Qin, W.; Yang, E.S.; Fasnacht, Z.; et al. OMI/Aura NO2 Tropospheric, Stratospheric fff Total Columns MINDS 1-Orbit L2 Swath 13 km × 24 km. NASA Goddard Space Flight Center, Goddard Earth Sciences Data and Information Services Center (GES DISC). 2020. Available online: https://disc.gsfc.nasa.gov/datasets/OMI_MINDS_NO2_1/summary (accessed on 5 April 2022).
  42. Van Geffen, J.; Boersma, K.F.; Eskesl, H.; Sneep, M.; ter Linden, M.; Zara, M.; Veefkind, J.P. S5P TROPOMI NO2 slant column retrieval: Method, stability, uncertainties and comparisons with OMI. Atmos. Meas. Tech. 2020, 13, 1315–1335. [Google Scholar] [CrossRef] [Green Version]
  43. Wang, H.; Souri, A.H.; González Abad, G.; Liu, X.; Chance, K. Ozone monitoring instrument (OMI) Total column water vapor version 4 validation and applications. Atmos. Meas. Tech. 2019, 12, 5183–5199. [Google Scholar] [CrossRef] [Green Version]
  44. Lambert, J.C.; Compernolle, S.; Eichmann, K.U.; de Graaf, M.; Hubert, D.; Keppens, A.; Kleipool, Q.; Langerock, B.; Sha, M.; Verhoelst, T.; et al. Quarterly Validation Report of the Copernicus Sentinel-5 Precursor Operational Data Products #12: April 2018–September 2021. S5P MPC Routine Operations Consolidated Validation Report Series; Version 12.01.00. 2021. Available online: http://www.tropomi.eu/sites/default/files/files/publicS5P-MPC-IASB-ROCVR-06.0.1-20200330_FINAL.pdf (accessed on 5 August 2022).
  45. Wang, Y.; Apituley, A.; Bais, A.; Beirle, S.; Benavent, N.; Borovski, A.; Bruchkouski, I.; Chan, K.L.; Donner, S.; Drosoglou, T.; et al. Inter-comparison of MAX-DOAS measurements of tropospheric HONO slant column densities and vertical profiles during the CINDI-2 campaign. Atmos. Meas. Tech. 2020, 13, 5087–5116. [Google Scholar] [CrossRef]
  46. Vandaele, A.C.; Hermans, C.; Simon, P.C.; Carleer, M.; Colin, R.; Fally, S.; Merienne, M.F.; Jenouvrier, A.; Coquart, B. Measurements of the NO2 absorption cross-section from 42,000 cm−1 to 10,000 cm−1 (238–1000 nm) at 220 K and 294 K. J. Quant. Spectrosc. Radiat. Transf. 1998, 59, 171–184. [Google Scholar] [CrossRef] [Green Version]
  47. Bogumil, K.; Orphal, J.; Homann, T.; Voigt, S.; Spietz, P.; Fleischmann, O.; Vogel, A.; Hartmann, M.; Kromminga, H.; Bovensmann, H.; et al. Measurements of molecular absorption spectra with the SCIAMACHY pre-flight model: Instrument characterization and reference data for atmospheric remote-sensing in the 230–2380 nm region. J. Photochem. Photobiol. A Chem. 2003, 157, 167–184. [Google Scholar] [CrossRef]
  48. Hermans, C.; Vandaele, A.C.; Carleer, M.; Fally, S.; Colin, R.; Jenouvrier, A.; Coquart, B.; Mérienne, M.F. Absorption cross-sections of atmospheric constituents: NO2, O2, and H2O. Environ. Sci. Pollut. Res. 1999, 6, 151–158. [Google Scholar] [CrossRef] [PubMed] [Green Version]
  49. Wagner, T. Satellite Observations of Atmospheric Halogen Oxides; Mensch & Buch: Berlin, Germany, 1999. [Google Scholar]
  50. Volkamer, R.; Spietz, P.; Burrows, J.; Platt, U. High-resolution absorption cross-section of glyoxal in the UV–vis and IR spectral ranges. J. Photochem. Photobiol. A Chem. 2005, 172, 35–46. [Google Scholar] [CrossRef]
Figure 1. Location of the CNR-ISAC in Bologna (black), of the San Pietro Capofiume “Giorgio Fea” observatory (red) and of the BAQUNIN super-site in Rome (blue). Photos of the instruments in the three locations are also shown.
Remotesensing 14 03881 g001
Figure 2. (a) Modified Langley plot and (b) O 4 SCDs data filtering for TROPOGAS during the Bologna inter-comparison campaign. Results for NO 2 cross sections at 298 K.
Remotesensing 14 03881 g002
Figure 3. (a) Modified Langley plot and (b) O 4 SCDs data filtering for SkySpec-2D during the Bologna inter-comparison campaign. Results for NO 2 cross sections at 298 K.
Remotesensing 14 03881 g003
Figure 4. (a) Modified Langley plot and (b) O 4 SCDs data filtering for SkySpec-2D during the BAQUNIN inter-comparison campaign. Results for NO 2 cross sections at 254.5 K.
Remotesensing 14 03881 g004
Figure 5. (a) NO 2 VCDs from TROPOGAS (in blue) and SkySpec-2D (in red), averaged in 5 min intervals, during the Bologna inter-comparison campaign. (b) Zoom onto days 5 and 6 August 2021.
Remotesensing 14 03881 g005
Figure 6. Scatterplot of NO 2 VCDs retrieved from TROPOGAS and SkySpec-2D during the Bologna inter-comparison campaign and averaged in 5 min intervals.
Remotesensing 14 03881 g006
Figure 7. NO 2 VCDs, averaged in 60 min intervals around the satellite overpass, from TROPOGAS (in red) and SkySpec-2D (in blue) versus TROPOMI (red and blue shadows, respectively) during the Bologna inter-comparison campaign. The TROPOMI shadows represent the mean values within the 5 km radius with standard deviations.
Remotesensing 14 03881 g007
Figure 8. Scatterplot of NO 2 VCDs retrieved from SkySpec-2D (NO 2 cross sections at 254.5 K) and Pandora#117 during the BAQUNIN inter-comparison campaign. Data are averaged in 5 min intervals.
Remotesensing 14 03881 g008
Figure 9. NO 2 VCDs retrieved from SkySpec-2D with NO 2 cross sections at different temperatures (220 K in blue, 254.5 K in yellow, 298 K in red) and Pandora#117 (grey shadow) during the BAQUNIN inter-comparison campaign, results and absolute differences. Data are averaged in 5 min intervals.
Remotesensing 14 03881 g009
Figure 10. NO 2 VCDs, averaged in 15 min intervals, retrieved from SkySpec-2D (in red) and Pandora#117 (in blue), and NO 2 VCDs measured by TROPOMI (grey shadow) during the BAQUNIN inter-comparison campaign. The TROPOMI shadows represent the mean values within the 5 km radius with standard deviations.
Remotesensing 14 03881 g010
Figure 11. NO 2 VCDs retrieved from SkySpec-2D (in red) and TROPOMI (grey shadows) at the “Giorgio Fea” observatory in SPC. SkySpec-2D data are averaged in 15 min around the S-5P overpass time. The TROPOMI shadows represent the mean values within the 5 km radius with standard deviations.
Remotesensing 14 03881 g011
Figure 12. (a) Percentage differences between NO 2 AMFs computed with increased NO 2 tropospheric content and non-perturbed profile. (b) Differences between NO 2 VCDs measured by TROPOMI and SkySpec-2D in SPC with respect to the SZA and the NO 2 VCDs measured by TROPOMI.
Remotesensing 14 03881 g012
Table 1. Relative bias and spread in NO 2 total VCDs retrieved from SkySpec-2D- versus ground-based instruments for different locations.
SiteGround-Based
(Month)TROPOGASPandora#117
Bologna
(August)9. ± 19%
BAQUNIN—La Sapienza
(September) −24. ± 23% at 254.5 K; −19. ± 21% at 298 K
Table 2. Relative bias and spread in NO 2 total VCDs retrieved from satellites versus ground-based instruments for different locations. The radius used for spatial coincidence is 5 km around the station for TROPOMI and 20 km for OMI, while the time interval is 15 or 60 min depending on instruments.
Site  TROPOMIOMI
(Month)TROPOGASPandora#117SkySpec-2DTROPOGASPandora#117SkySpec-2D
Time Coinc.60 min15 min15 min60 min15 min15 min
Bologna
(August)−3. ± 29% −15. ± 17%−12. ± 36% −22. ± 12%
BAQUNIN—La Sapienza
(September) −34. ± 32.%−25. ± 29.% −73. ± 57%−60. ± 57 %
SPC
(October–June) 9. ± 26%
Publisher’s Note: MDPI stays neutral with regard to jurisdictional claims in published maps and institutional affiliations.

