
Quantifying the Effects of Climate Variability, Land-Use Changes, and Human Activities on Drought Based on the SWAT–PDSI Model

 ,
, 
Abstract
:1. Introduction
2. Data and Methods
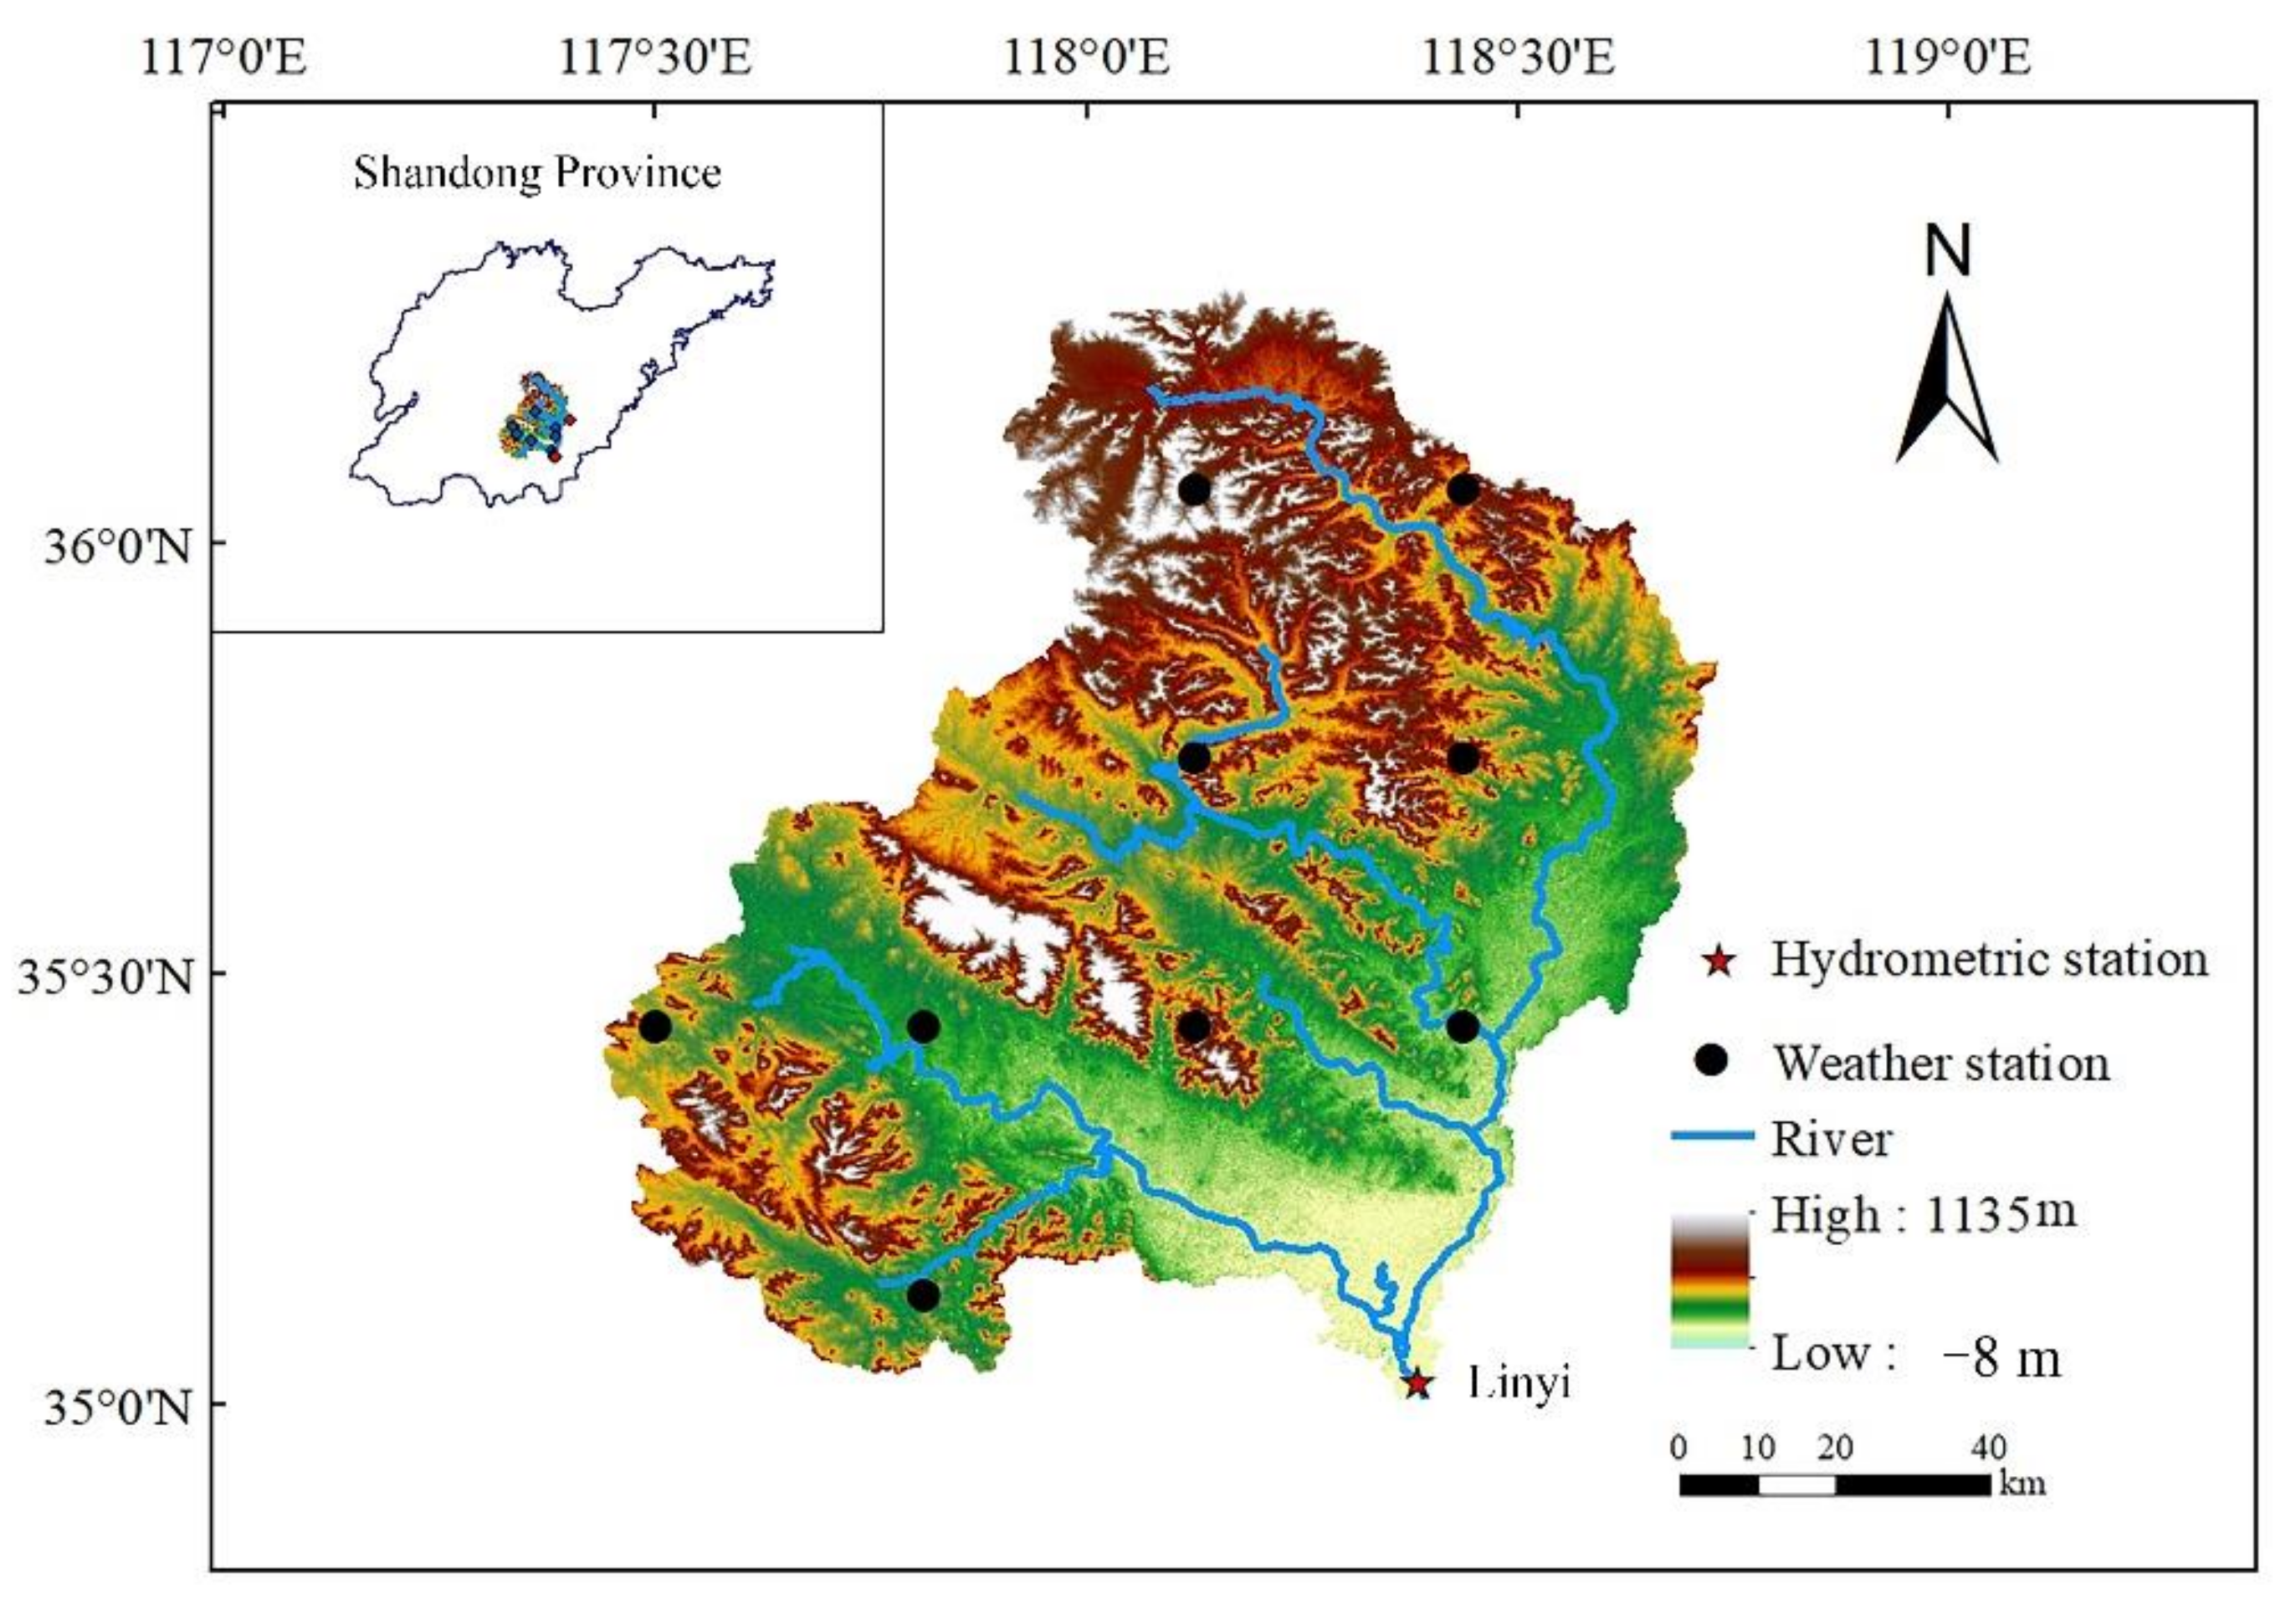
2.1. Study Area
2.2. Data Sources
2.3. Methodology
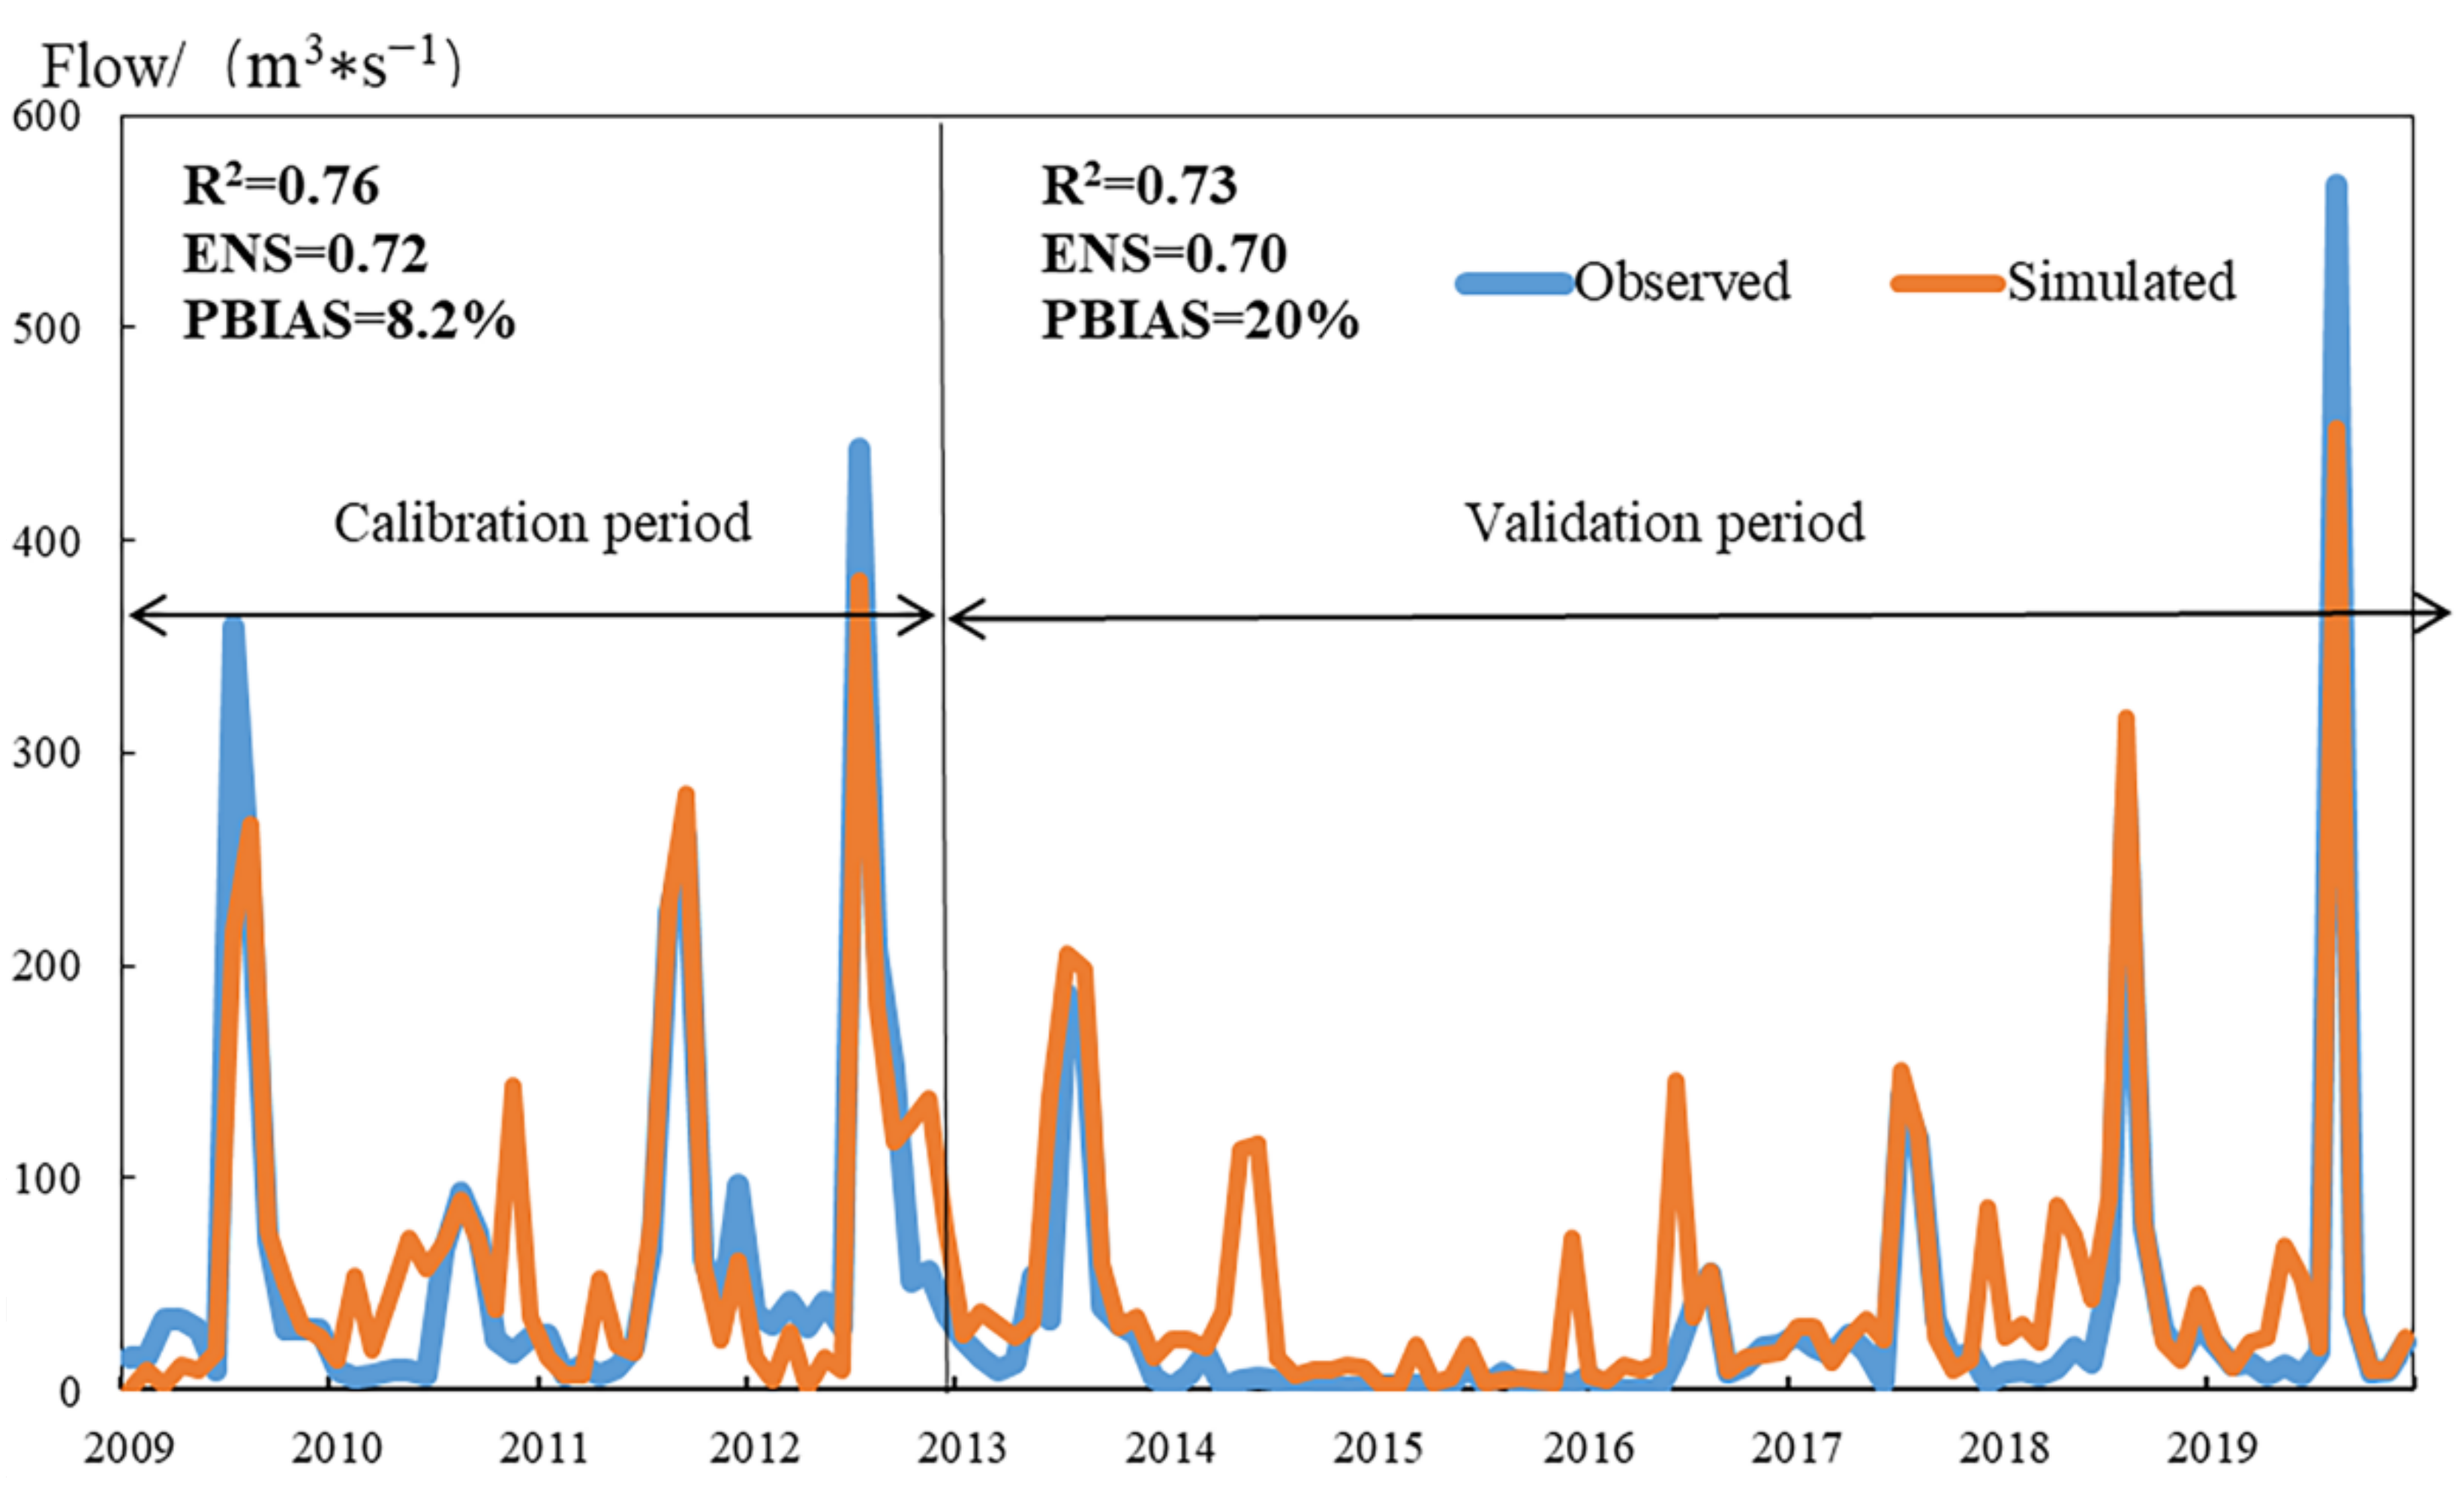
2.3.1. SWAT–PDSI Model
2.3.2. Climate Factors and Land-Use Changes
2.3.3. Quantitative Attribution of Drought Changes
3. Results and Analysis
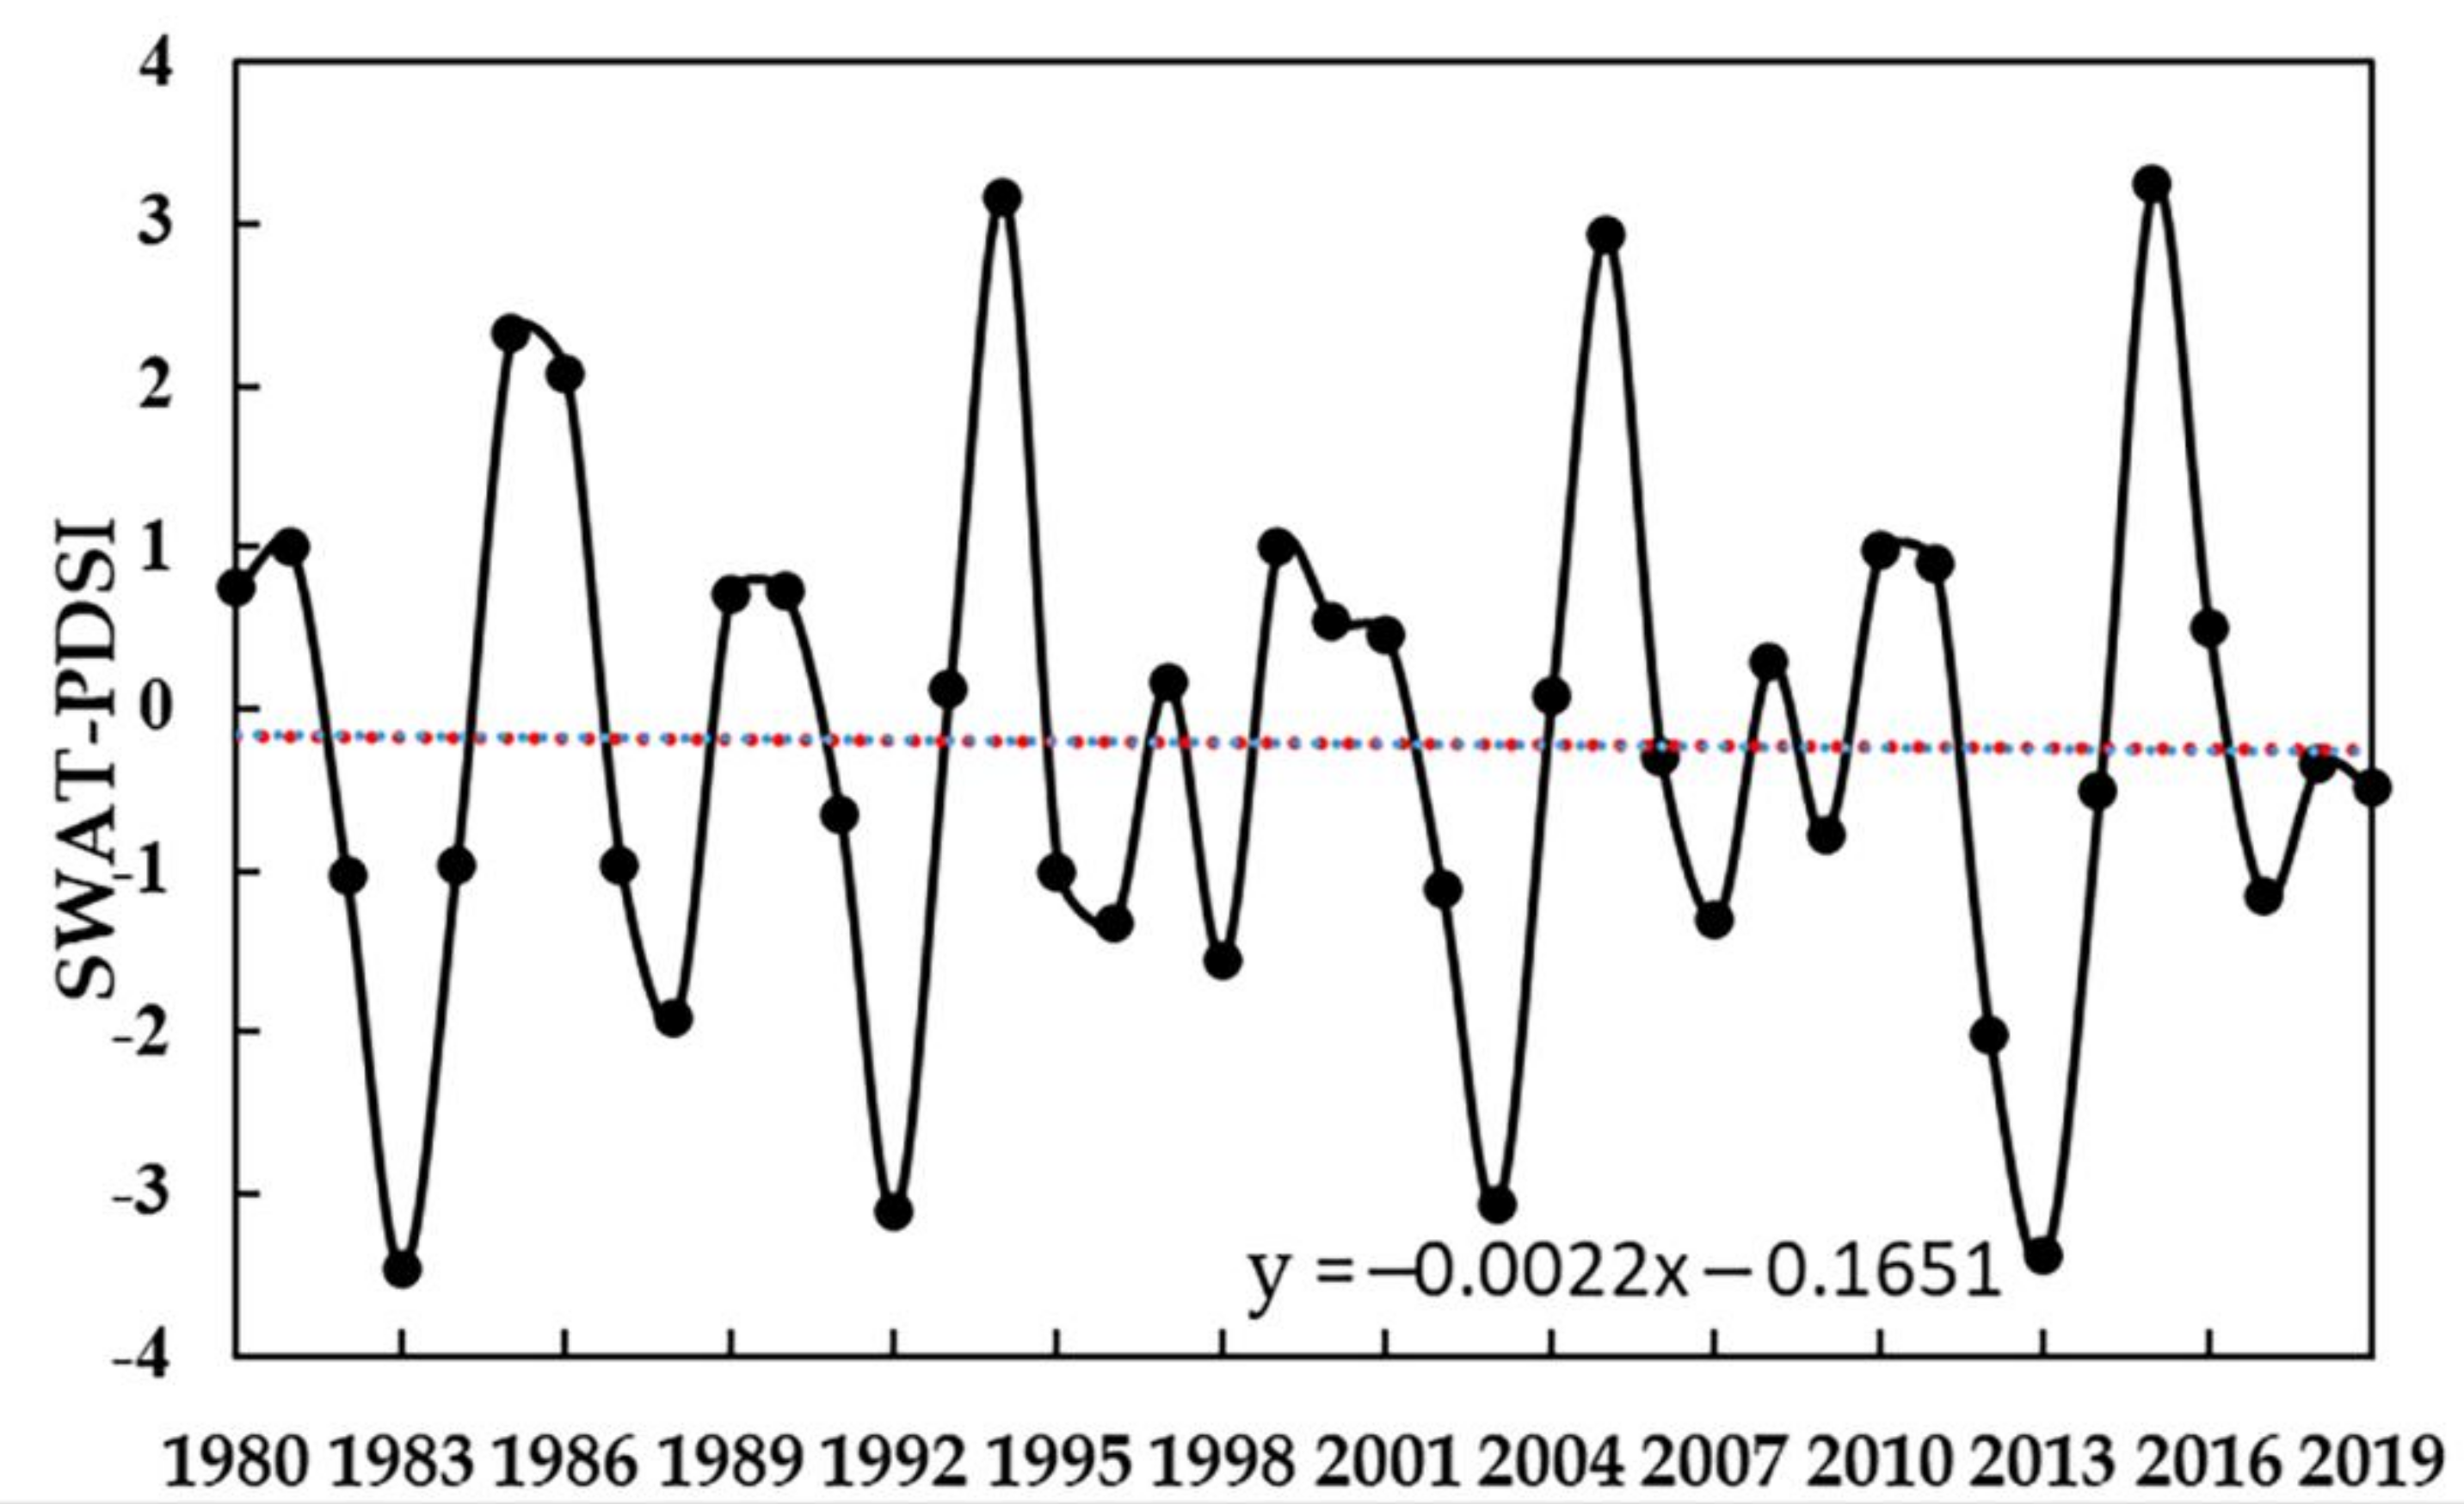
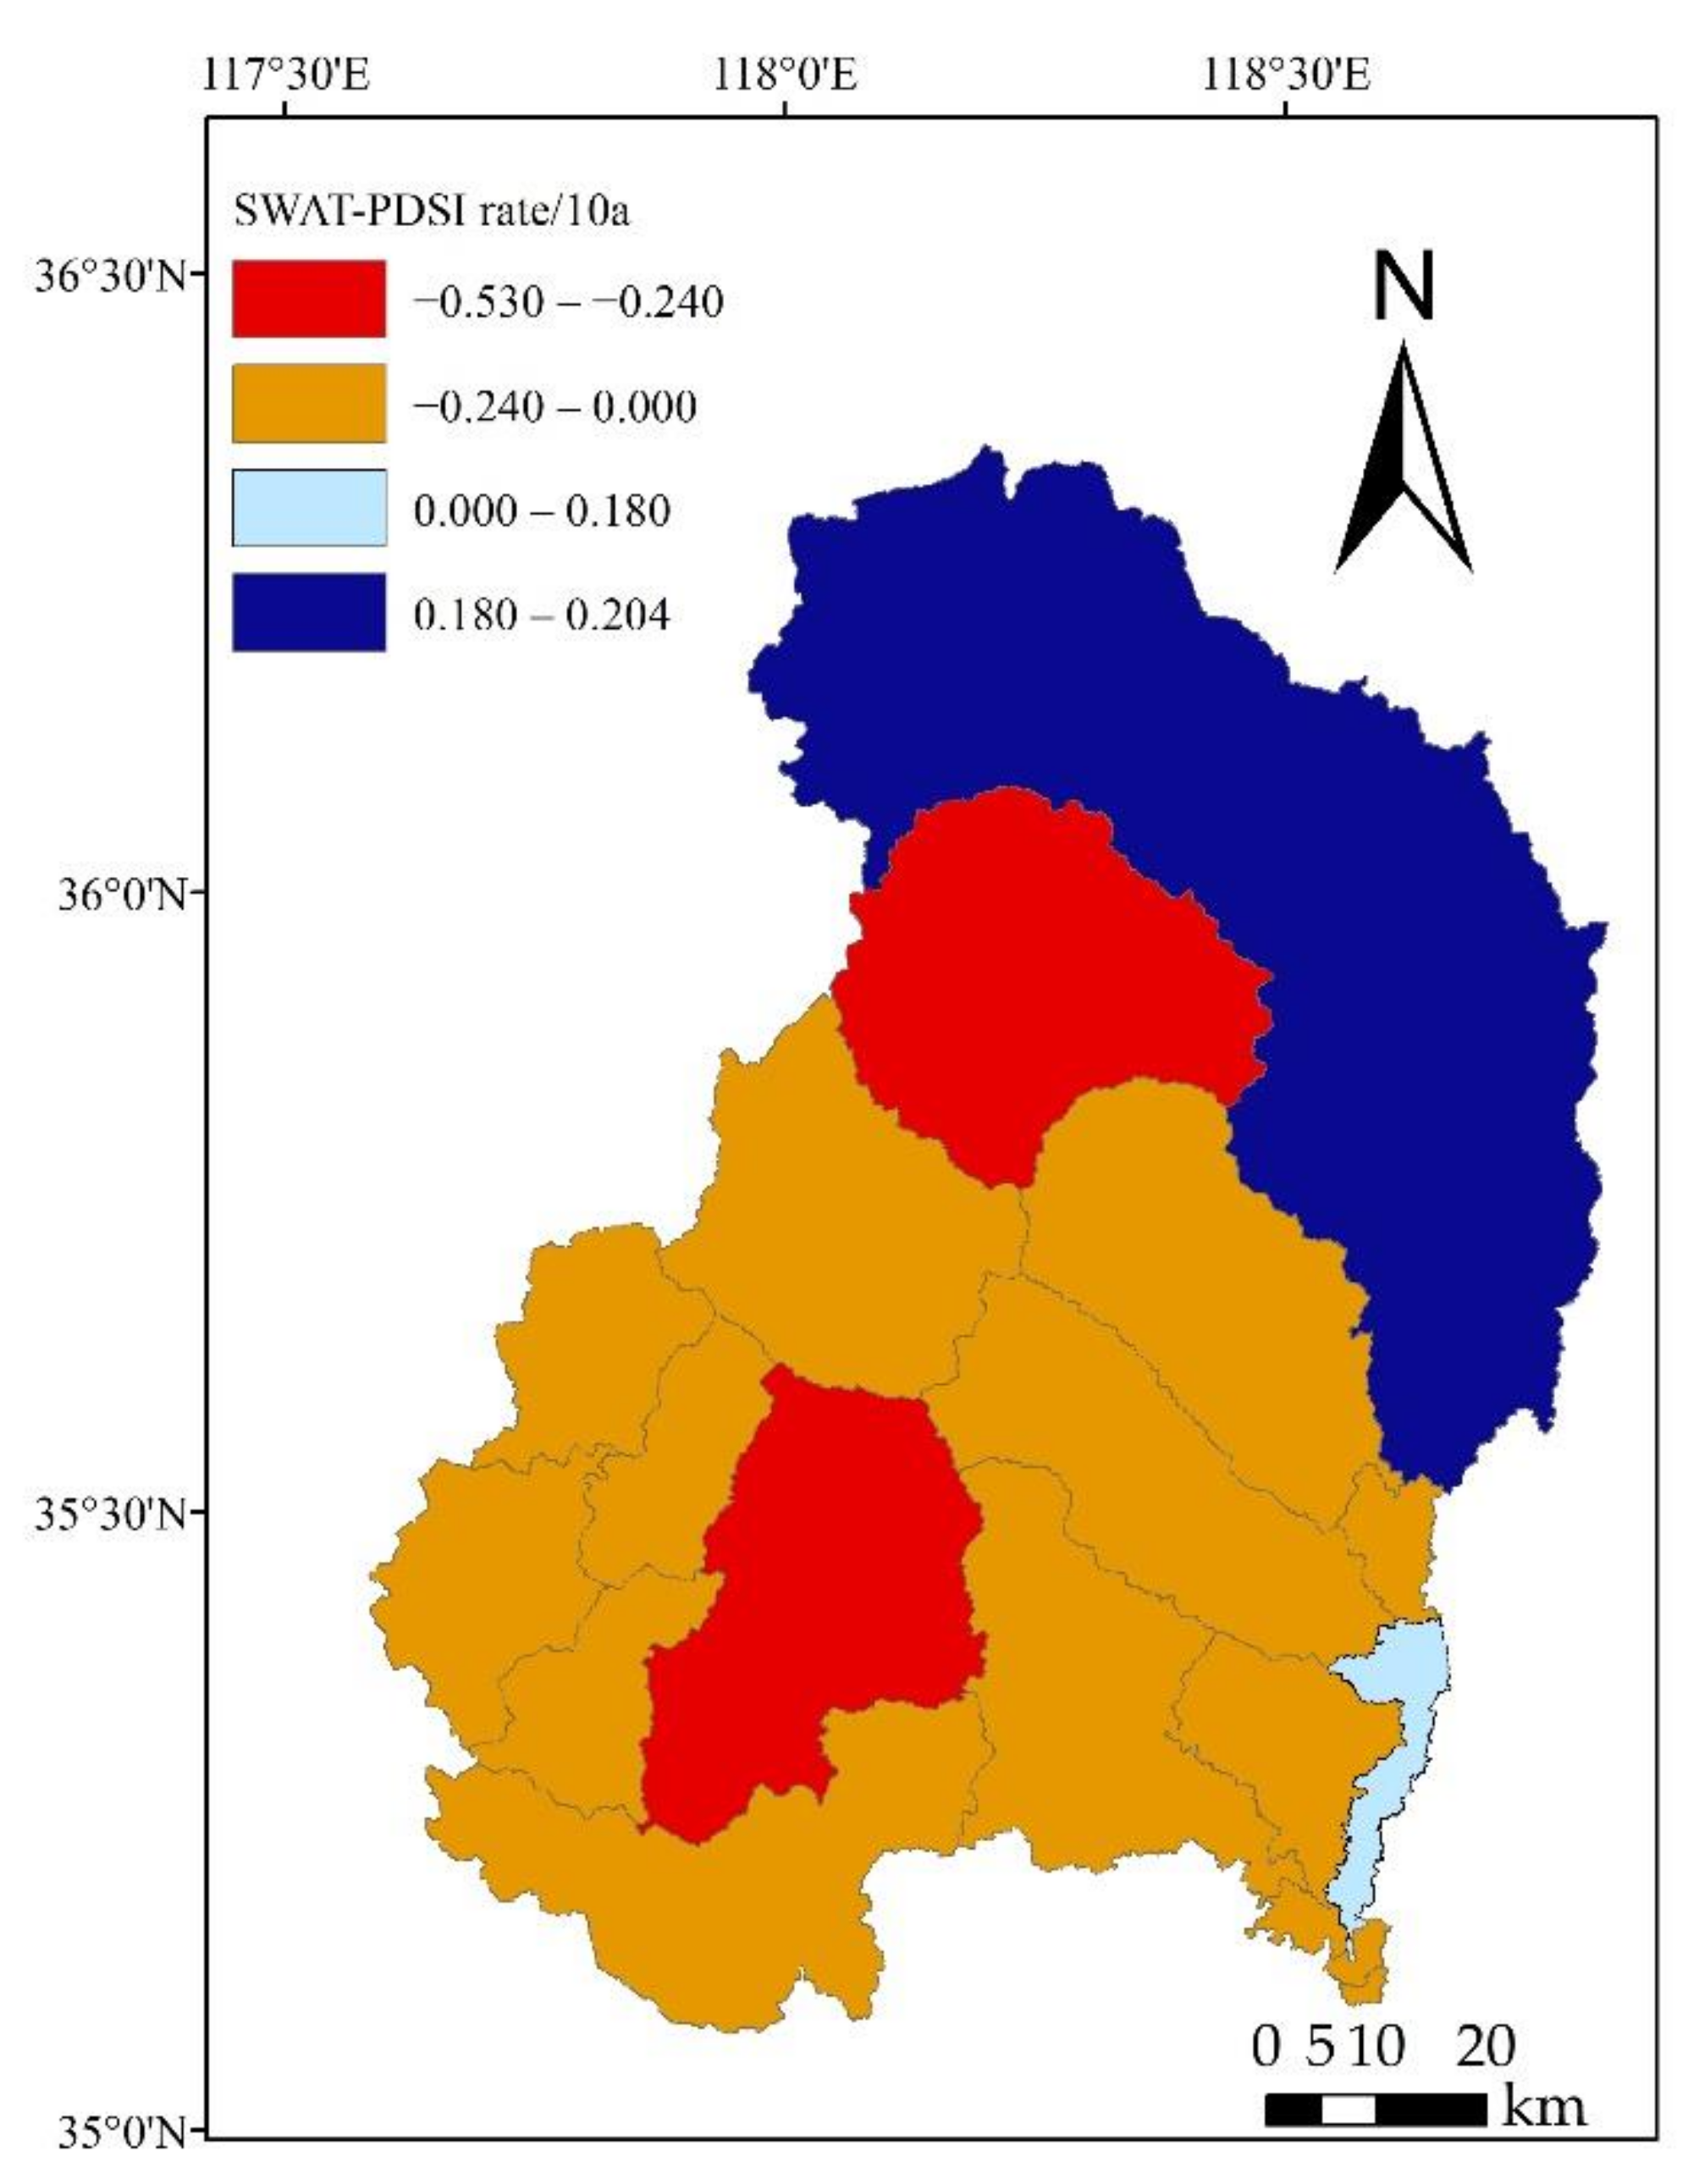
3.1. Temporal and Spatial Variations in Drought Based on the SWAT–PDSI Model
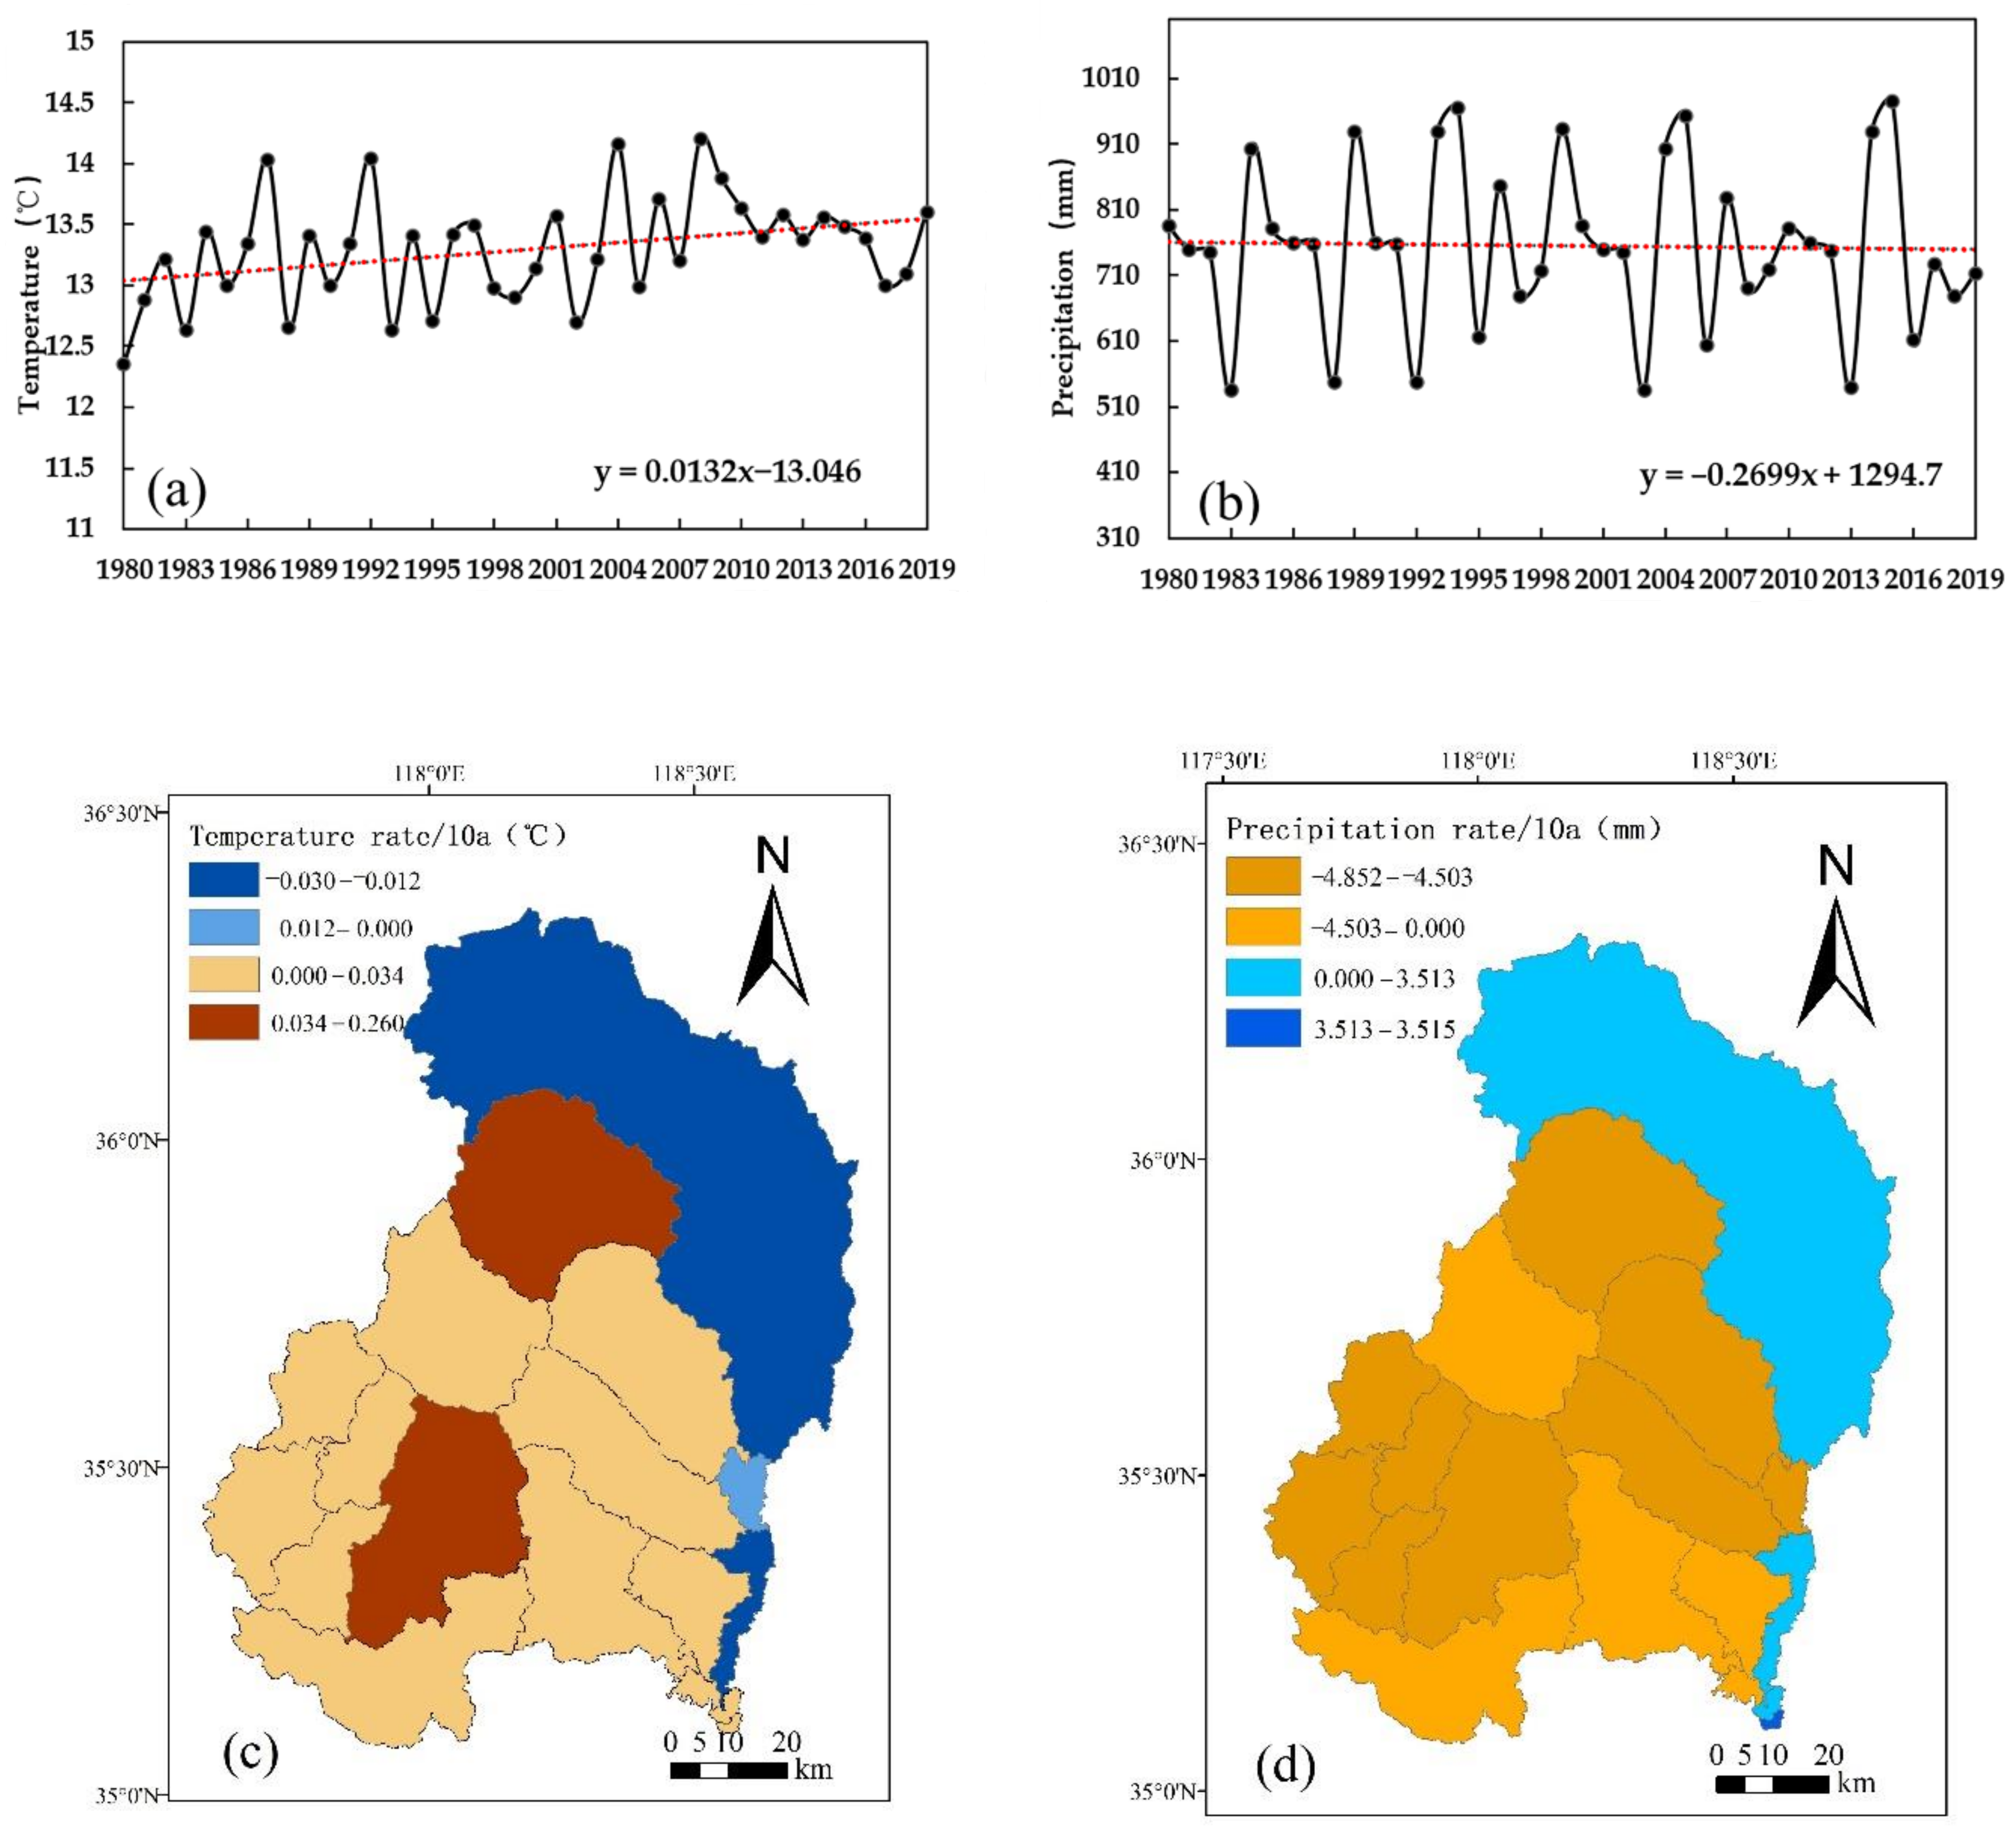
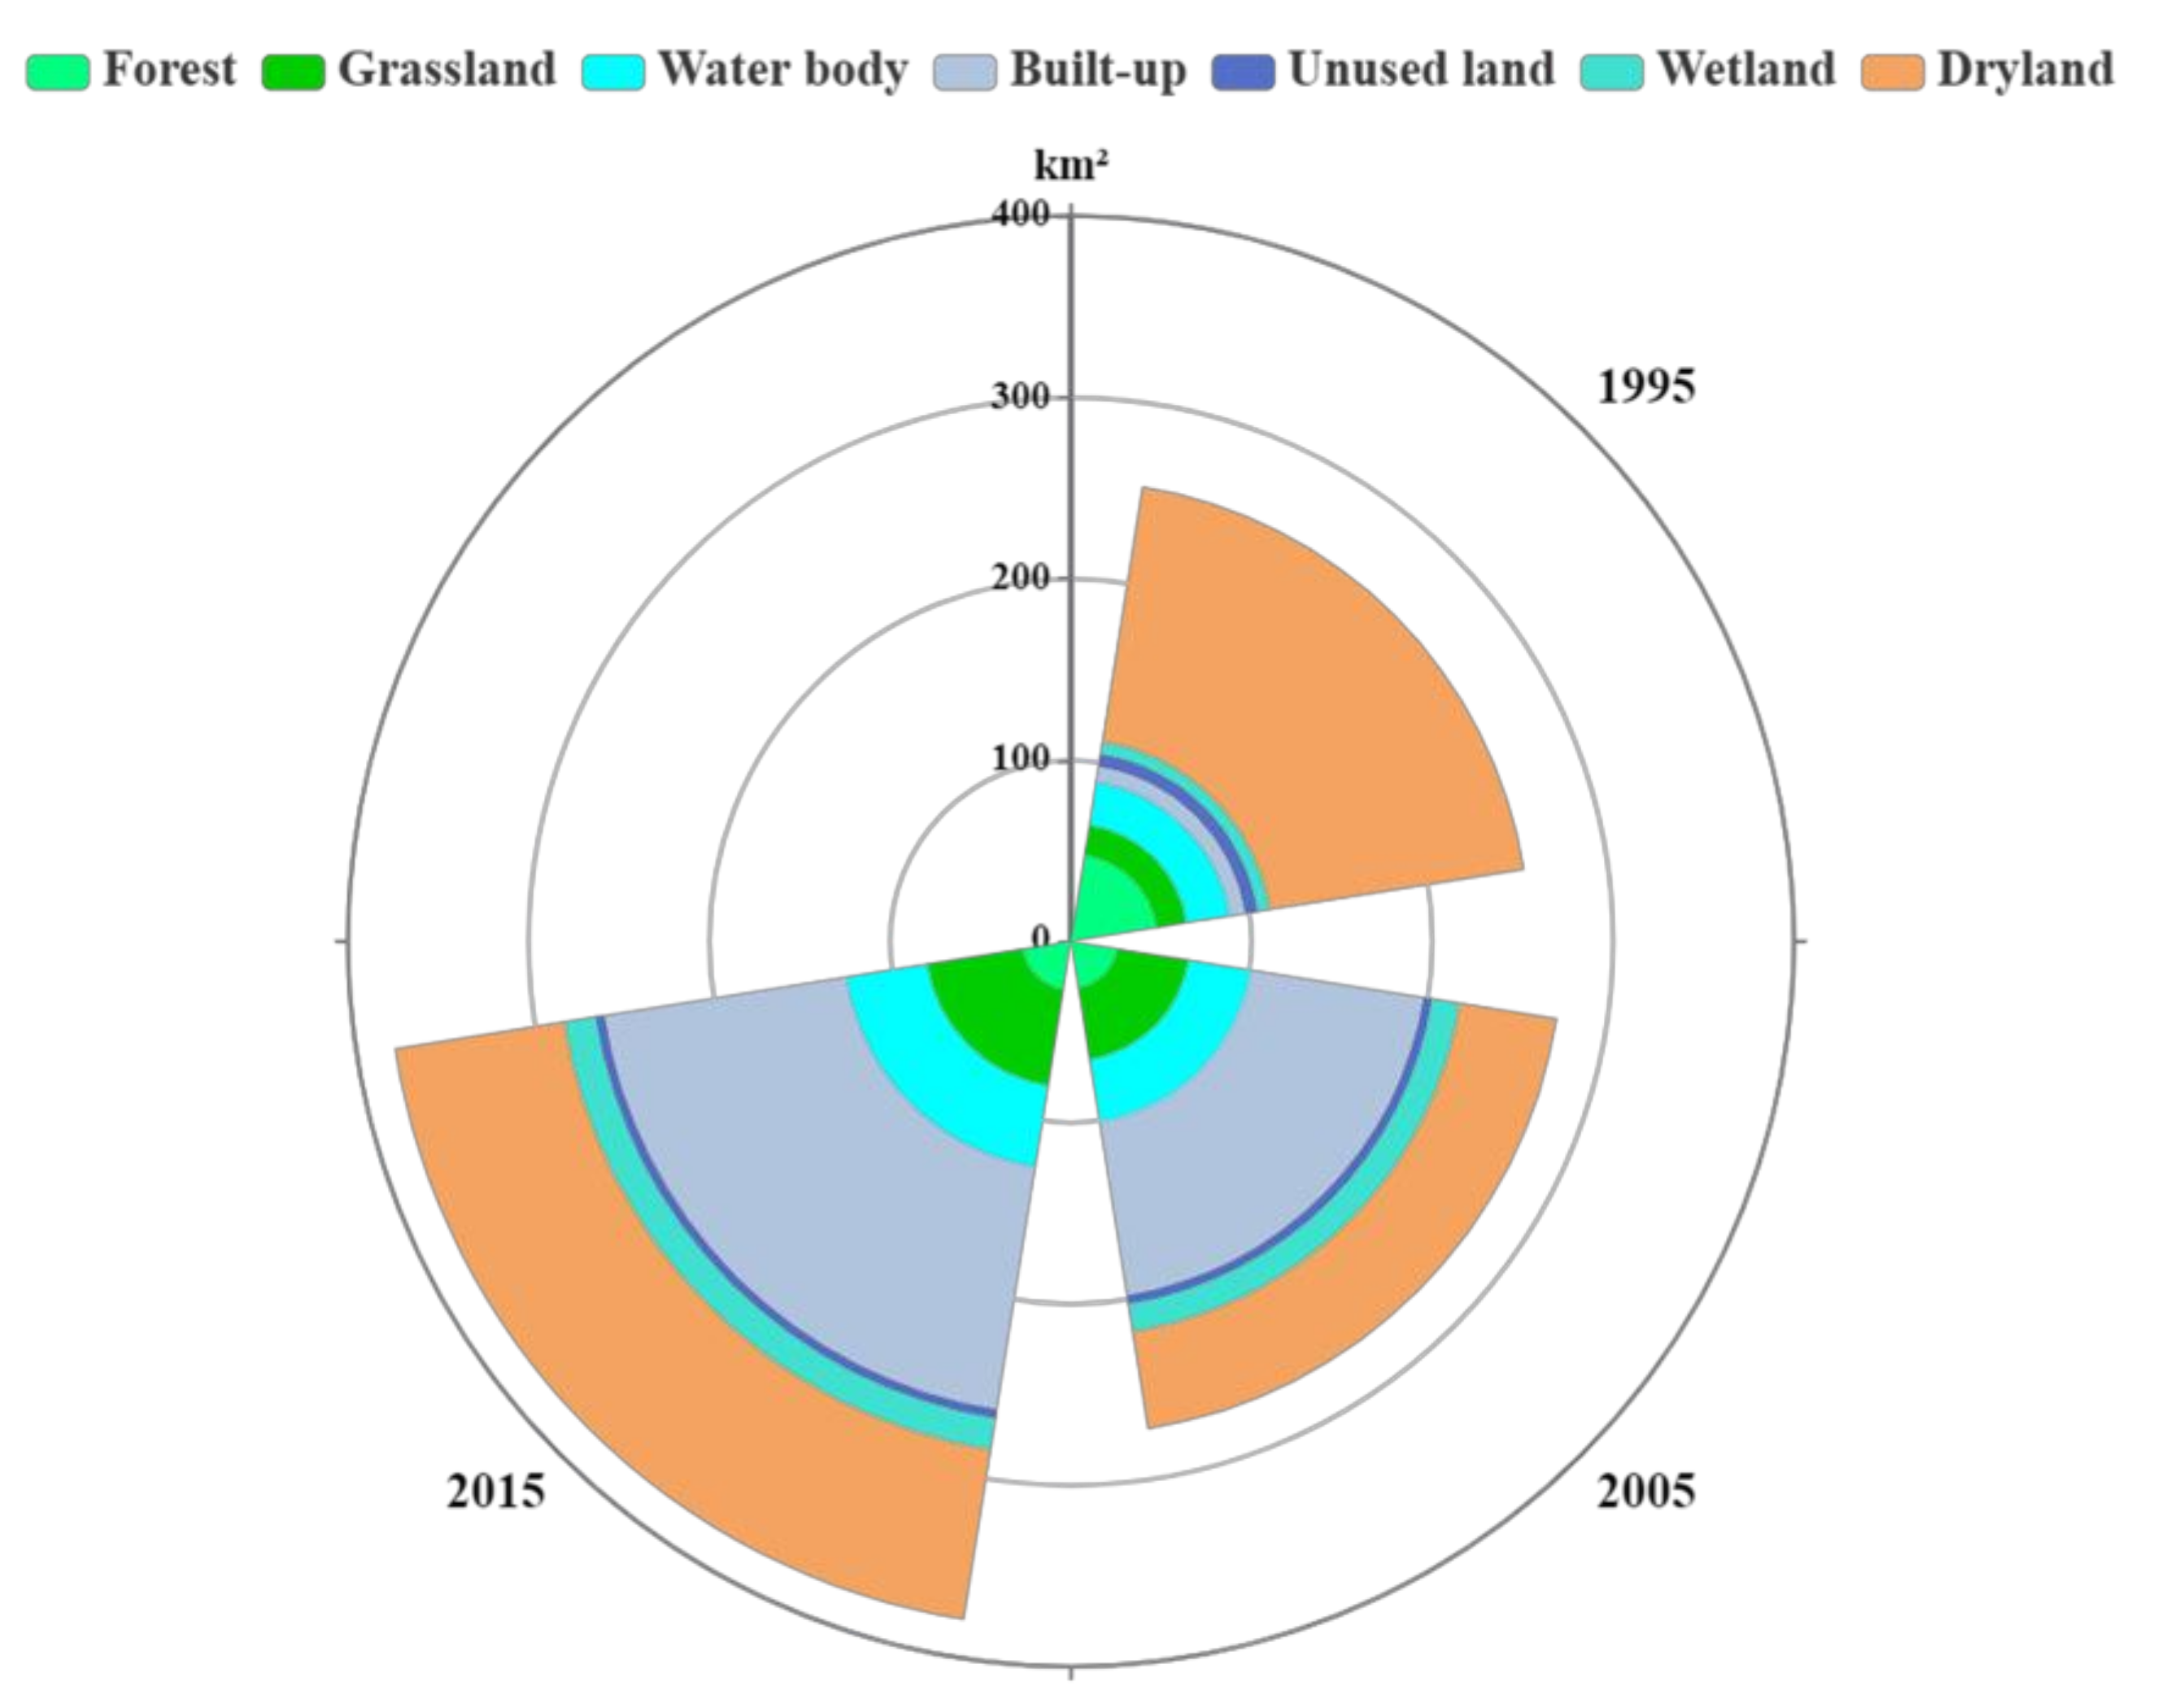
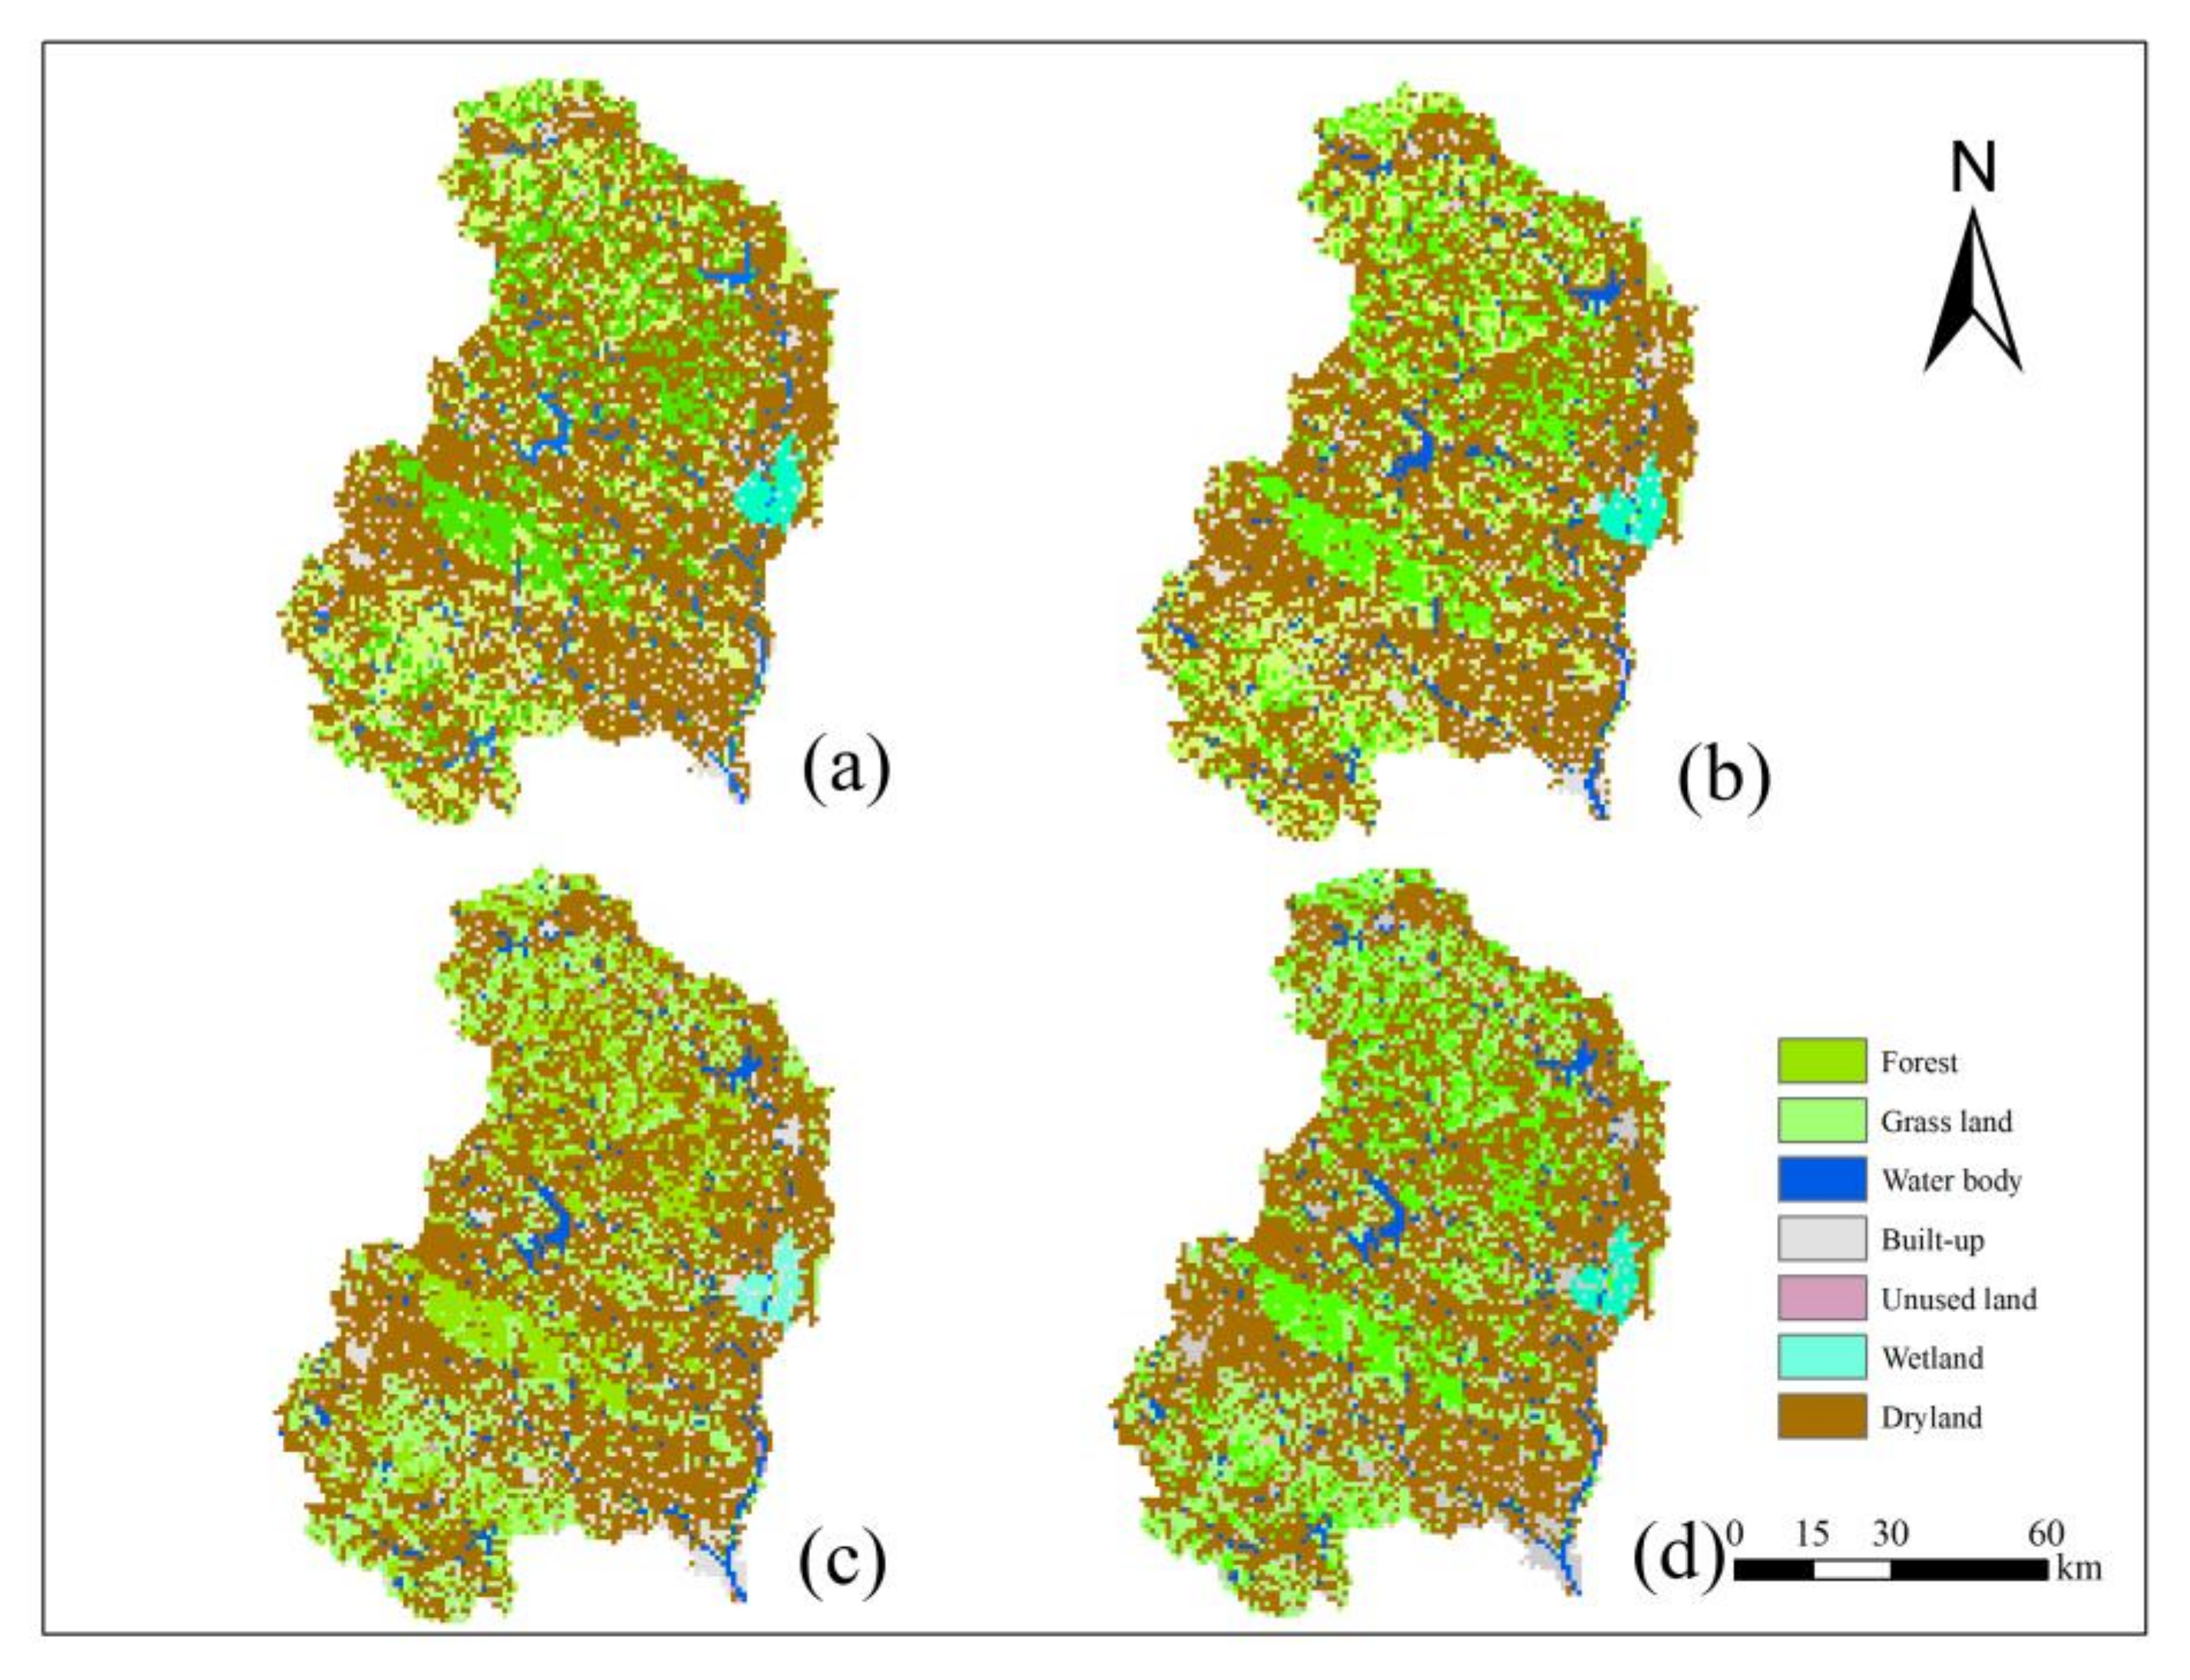
3.2. Climate Fluctuation and LUCC
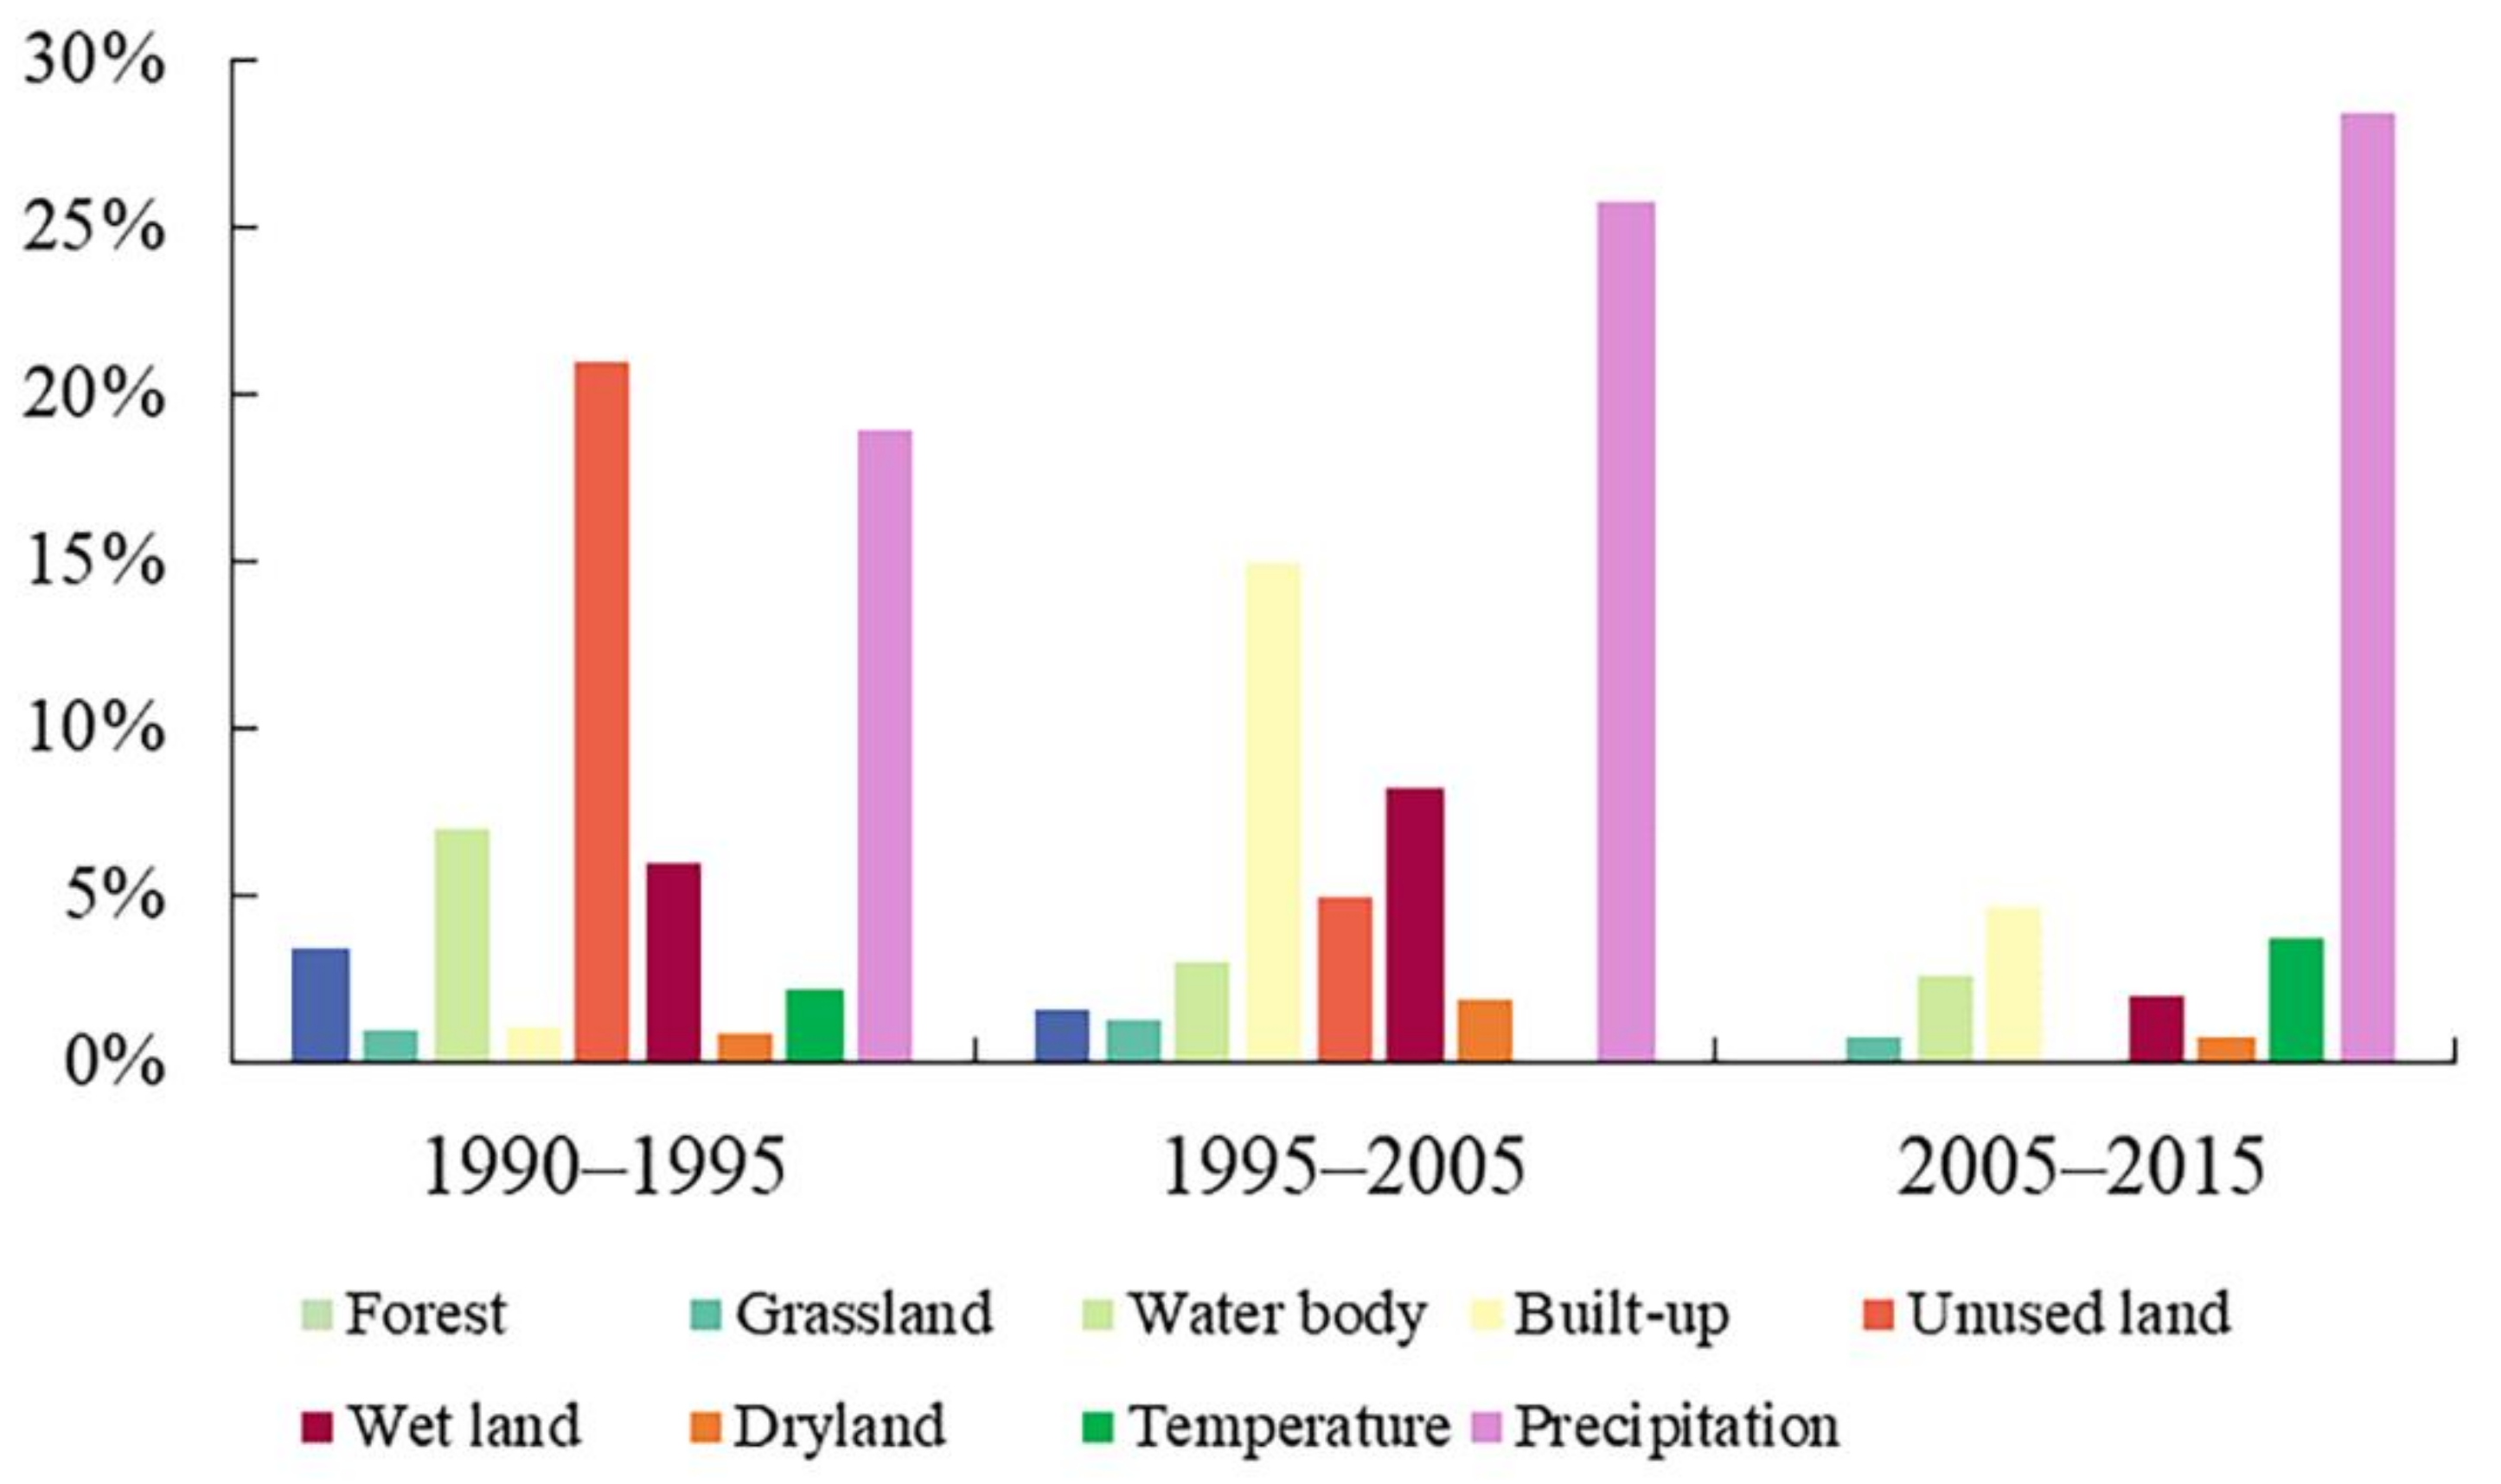
3.3. Quantifying the Effects of the Temperature, Precipitation, LUCC, and Other Human Activities on Drought
4. Discussion
5. Conclusions
Author Contributions
Funding
Data Availability Statement
Conflicts of Interest
References
- Tian, F.; Wu, J.J.; Liu, L.Z.; Yang, J.H. Temporal and spatial transfer characteristics and hot spot area detection of drought in North China Plain from 1901 to 2015. Resour. Environ. Arid. Areas 2020, 34, 87–96. [Google Scholar]
- Lesk, C.; Rowhani, P.; Ramankutty, N. Influence of extreme weather disasters on global crop production. Nature 2016, 529, 84–87. [Google Scholar] [CrossRef] [PubMed]
- FAO. The Impact of Disasters and Crises on Agriculture and Food Security 2017; Food and Agriculture Organization of the United Nations: Rome, Italy, 2018. [Google Scholar]
- Muza, M.N.; Carvalho, L.M.V.; Jones, C.; Liebmann, B. Intraseasonal and Interannual Variability of Extreme Dry and Wet Events over Southeastern South America and the Subtropical Atlantic during Austral Summer. J. Clim. 2009, 22, 1682–1699. [Google Scholar] [CrossRef]
- Jiang, S.; Wang, M.; Ren, L.; Xu, C.-Y.; Yuan, F.; Liu, Y.; Lu, Y.J.; Shen, H. A framework for quantifying the impacts of climate change and human activities on hydrological drought in a semiarid basin of Northern China. Hydrol. Process. 2019, 33, 1075–1088. [Google Scholar] [CrossRef]
- Wu, Y.F.; Bake, B.; Zhang, J.S.; Hamid, R. Spatio-temporal patterns of drought in North Xinjiang, China, 1961–2012 based on meteorological drought index. J. Arid Land 2015, 7, 527–543. [Google Scholar] [CrossRef]
- Karabulut, M. Drought analysis in Antakya-Kahramanmaraş Graben, Turkey. J. Arid Land 2015, 7, 741–754. [Google Scholar] [CrossRef]
- McKee, T.B.; Doesken, N.J.; Kleist, J. The relationship of drought frequency and duration to time scales. In Proceedings of the 8th Conference on Applied Climatology, Anaheim, CA, USA, 17–22 January 1993; pp. 179–183. [Google Scholar]
- Feng, P.; Hu, R.; Li, J.Z. Meteorological drought grade prediction using three-dimensional log-linear models. J. Hydraul. Eng. 2014, 45, 505–512. [Google Scholar]
- Liu, X.; Zhu, X.; Pan, Y.; Bai, J.; Li, S. Performance of different drought indices for agriculture drought in the North China Plain. J. Arid Land 2018, 10, 507–516. [Google Scholar] [CrossRef]
- Vicente-Serrano, S.M.; Gouveia, C.; Camarero, J.J.; Beguería, S.; Trigo, R.; Sanchez-Lorenzo, A. Response of vegetation to drought time-scales across global land biomes. Proc. Natl. Acad. Sci. USA 2013, 110, 52–57. [Google Scholar] [CrossRef]
- Shukla, S.; Wood, A.W. Use of a standardized runoff index for characterizing hydrologic drought. Geophys. Res. Lett. 2008, 35, 226–236. [Google Scholar] [CrossRef]
- Palmer, W.C. Meteorological Drought; US Department of Commerce, Weather Bureau: Silver Spring, MD, USA, 1965. [Google Scholar]
- Sheffield, J.; Wood, E.F.; Roderick, M.L. Little change in global drought over the past 60 years. Nature 2012, 491, 435–438. [Google Scholar] [CrossRef]
- Heim, R.R., Jr. A Review of Twentieth-Century Drought Indices Used in the United States. Bull. Am. Meteorol. Soc. 2002, 83, 1149–1166. [Google Scholar] [CrossRef]
- Philip, J.R. Evaporation, and Moisture and Heat Fields in The Soil. J. Meteorol. 1957, 14, 354–366. [Google Scholar] [CrossRef]
- Shi, X.L.; Yang, Z.Y.; Yan, D.H.; Li, Y.; Yuan, Z. On hydrological response to land-use/cover change in Luanhe River basin. Prog. Water Sci. 2014, 25, 21–27. [Google Scholar]
- Xu, Z.X.; Pang, J.P.; Liu, C.M.; Li, J.Y. Assessment of runoff and sediment yield in the Miyun Reservoir catchment by using SWAT model. Hydrol. Process. 2009, 23, 3619–3630. [Google Scholar] [CrossRef]
- Zhang, X.; Srinivasan, R.; Arnold, J.; Izaurralde, R.C.; Bosch, D. Simultaneous calibration of surface flow and baseflow simulations: A revisit of the Swat model calibration framework. Hydrol. Processes 2011, 25, 2313–2320. [Google Scholar] [CrossRef]
- Gan, R.; Yang, Y.; Ma, Y. Modelling the impacts of the Pacific Ocean Sea surface temperature anomalies on a drought event in southwestern China with a piecewise-integration method. Int. J. Clim. 2018, 39, 799–813. [Google Scholar] [CrossRef]
- Xie, P.; Gu, H.; Sang, Y.-F.; Wu, Z.; Singh, V.P. Comparison of different methods for detecting change points in hydroclimatic time series. J. Hydrol. 2019, 577, 123973. [Google Scholar] [CrossRef]
- Kew, S.F.; Philip, S.Y.; Hauser, M.; Hobbins, M.; Wanders, N.; van Oldenborgh, G.J.; van der Wiel, K.; Veldkamp, T.I.E.; Kimutai, J.; Funk, C.; et al. Impact of precipitation and increasing temperatures on drought trends in eastern Africa. Earth Syst. Dyn. 2021, 12, 17–35. [Google Scholar] [CrossRef]
- Li, W.; Pan, R.; Jiang, Z.; Chen, Y.; Li, L.; Luo, J.-J.; Zhai, P.; Shen, Y.; Yu, J. Future changes in the frequency of extreme droughts over China based on two large ensemble simulations. J. Clim. 2021, 34, 6023–6035. [Google Scholar] [CrossRef]
- Philip, S.Y.; Kew, S.F.; van der Wiel, K.; Wanders, N.; van Oldenborgh, G.J. Regional differentiation in climate change induced drought trends in the Netherlands. Environ. Res. Lett. 2020, 15, 094081. [Google Scholar] [CrossRef]
- Jaeger, W.K.; Amos, A.; Conklin, D.R.; Langpap, C.; Moore, K.; Plantinga, A.J. Scope and limitations of drought management within complex human–natural systems. Nat. Sustain. 2019, 2, 710–717. [Google Scholar] [CrossRef]
- Chiang, F.; Mazdiyasni, O.; Aghakouchak, A. Evidence of anthropogenic impacts on global drought frequency, duration, and intensity. Nat. Commun. 2021, 12, 2754. [Google Scholar] [CrossRef] [PubMed]
- Wang, Y.; Yuan, X. Anthropogenic Speeding Up of South China Flash Droughts as Exemplified by the 2019 Summer-Autumn Transition Season. Geophys. Res. Lett. 2021, 48, e2020GL091901. [Google Scholar] [CrossRef]
- Wanders, N.; Wada, Y. Human and climate impacts on the 21st century hydrological drought. J. Hydrol. 2014, 526, 208–220. [Google Scholar] [CrossRef]
- Li, B.F.; Xiong, H.G.; Lian, L.S.; Sun, X.Y.; Zhou, C.C. Nonlinear variation of runoff and its response to climate change in Yihe river. Bull. Soil Water Conserv. 2016, 36, 169–174+181. [Google Scholar]
- Li, B.F.; Shi, X.; Lian, L.S.; Chen, Y.N.; Sun, X.Y. Quantifying the effects of climate variability, direct and indirect land use change, and human activities on runoff. J. Hydrol. 2020, 584, 124684. [Google Scholar] [CrossRef]
- Dong, X.G.; Gu, W.Z.; Meng, X.X.; Liu, H.B. Change features of precipitation events in Shandong Province from 1961 to 2010. Acta Geogr. Sin. 2014, 69, 661–671. [Google Scholar]
- Li, B.; Chen, Z.; Yuan, X. The nonlinear variation of drought and its relation to atmospheric circulation in Shandong Province, East China. PeerJ 2015, 3, e1289. [Google Scholar] [CrossRef]
- Wen, Q.Z.; Sun, P.; Zhang, Q.; Yao, R. A Multi-Scalar Drought Index for Global Warming: The Non-Stationary Standardized Precipitation Evaporation Index (NSPEI) and Spatio-Temporal Patterns of Future Drought in China. Acta Geogr. Sin. 2020, 75, 1465–1482. [Google Scholar]
- Fuka, D.R.; Walter, M.T.; MacAlister, C.; DeGaetano, A.T.; Steenhuis, T.S.; Easton, Z.M. Using the Climate Forecast System Reanalysis as weather input data for watershed models. Hydrol. Process. 2015, 28, 5613–5623. [Google Scholar] [CrossRef]
- Ma, H.; Yin, Y.; Xiao, J.J.; Xu, Z.Y.; Yang, M.; Gao, D.W. Evaluation of precipitation in multi-generation reanalyses with land observations over Zhejiang province. J. Trop. Meteorol. 2021, 27, 412–423. [Google Scholar]
- Sharp, E.; Dodds, P.; Barrett, M.; Spataru, C. Evaluating the accuracy of CFSR reanalysis hourly wind speed forecasts for the UK, using in situ measurements and geographical information. Renew. Energy 2015, 77, 527–538. [Google Scholar] [CrossRef]
- Jayakrishnan, R.; Srinivasan, R.; Santhi, C.; Arnold, J.G. Advances in the application of the SWAT model for water resources management. Hydrol. Process. 2005, 19, 749–762. [Google Scholar] [CrossRef]
- Gassman, P.W.; Reyes, M.R.; Green, C.H.; Arnold, J.G. Soil and water assessment tool: Historical development, applications, and future research directions. Trans. ASABE (Am. Soc. Agric. Biol. Eng.) 2007, 50, 1211–1250. [Google Scholar] [CrossRef]
- Neitsch, S.; Arnold, J.; Kiniry, J.; Williams, J. Soil and Water Assessment Tool Theoretical Documentation, Version 2009; Texas Water Resources Institute Technical Report No. 406; Texas Water Resources Institute: College Station, TX, USA, 2011. [Google Scholar]
- Jin, X.; Jin, Y.; Yuan, D.; Mao, X. Effects of land-use data resolution on hydrologic modelling, a case study in the upper reach of the Heihe River, Northwest China. Ecol. Model. 2019, 404, 61–68. [Google Scholar] [CrossRef]
- Motovilov, Y.G.; Gottschalk, L.; Engeland, K.; Rodhe, A. Validation of a distributed hydrological model against spatial observations. Agric. For. Meteorol. 1999, 98, 257–277. [Google Scholar] [CrossRef]
- Xu, K.; Wu, C.; Zhang, C.; Hu, B.X. Uncertainty assessment of drought characteristics projections in humid subtropical basins in China based on multiple cmip5 models and different index definitions. J. Hydrol. 2021, 600, 126502. [Google Scholar] [CrossRef]
- Zhang, B.; Wu, P.; Zhao, X.; Gao, X. Spatiotemporal analysis of climate variability (1971–2010) in spring and summer on the Loess Plateau, China. Hydrol. Process. 2013, 28, 1689–1702. [Google Scholar] [CrossRef]
- Yan, D.; Shi, X.; Yang, Z.; Li, Y.; Zhao, K.; Yuan, Y. Modified Palmer Drought Severity Index Based on Distributed Hydrological Simulation. Math. Probl. Eng. 2013, 2013, 327374. [Google Scholar] [CrossRef]
- Yang, Q.; Li, M.X.; Zhang, Z.Y.; Ma, Z.G. Regional applicability of seven meteorological drought indices in China. Sci. China Earth Sci. 2017, 60, 745–760. [Google Scholar] [CrossRef]
- Liu, W.W.; An, S.Q.; Liu, G.S.; Guo, A.H. Further modification of Palmer drought model. J. Appl. Meteorol. 2004, 2, 207–216. [Google Scholar]
- Kossack, C.F.; Kendall, M.G. Rank Correlation Methods. Am. Math. Mon. 1950, 57, 425. [Google Scholar] [CrossRef]
- Mann, H.B. Nonparametric tests against trend. Econometrica 1945, 13, 245–259. [Google Scholar] [CrossRef]
- Wang, C.H.; Li, J.; Li, X.L.; Xu, X.G. Analysis on quasi-periodic characteristics of precipitation in recent 50 years and trend in next 20 years in China. Arid. Zone Res. 2012, 29, 1–10. [Google Scholar]
- Rajah, K.; O’Leary, T.; Turner, A.; Petrakis, G.; Leonard, M.; Westra, S. Changes to the temporal distribution of daily precipitation. Geophys. Res. Lett. 2015, 41, 8887–8894. [Google Scholar] [CrossRef]
- Wu, R.; Liu, Y.; Xing, X. Evaluation of evapotranspiration deficit index for agricultural drought monitoring in North China. J. Hydrol. 2021, 596, 126057. [Google Scholar] [CrossRef]
- Chen, D.; Gao, G.; Xu, C.; Guo, J.; Ren, G. Comparison of the Thornthwaite method and pan data with the standard penman-monteith estimates of reference evapotranspiration in China. Clim. Res. 2005, 28, 123–132. [Google Scholar] [CrossRef]
- Zhang, J.; Sun, F.; Xu, J.; Chen, Y.; Sang, Y.; Liu, C. Dependence of trends in and sensitivity of drought over China (1961–2013) on potential evaporation model. Geophys. Res. Lett. 2016, 43, 206–213. [Google Scholar] [CrossRef]
- Schulze, R.E. Modelling hydrological responses to land use and climate change: A southern African perspective. Ambio 2000, 29, 12–22. [Google Scholar] [CrossRef]
- Bonan, G. Ecological Climatology: Concepts and Applications; Cambridge University Press: Cambridge, UK, 2015; pp. 279–284. [Google Scholar]
- Kato, S.; Yamaguchi, Y. Estimation of storage heat flux in an urban area using ASTER data. Remote Sens. Environ. 2007, 110, 1–17. [Google Scholar] [CrossRef]
- Felicia, C.; Omid, M.; Amir, A.K. Amplified warming of droughts in southern United States in observations and model simulations. Sci. Adv. 2018, 4, eaat2380. [Google Scholar]
- Wang, L.W.; Wang, C.C.; Wang, Y.P.; Xu, J.; Huang, X.L. Mechanism of high temperature heat wave formation in North and East China. In Proceedings of the 33rd Annual Meeting of the Chinese Meteorological Society S6 East Asian Climate Variability and Extreme Events and Their Prediction, Xi’an, China, 2 November 2016; pp. 23–32. [Google Scholar]
- Wang, Z.Y.; Ding, Y.H. Impacts of the long-term change of the summer Asian polar vortex on the circulation system and the water vapor transport in East Asia. Chin. J. Geophys. 2009, 52, 20–29. [Google Scholar]
- Shao, P.; Zeng, X.D. Progress in the Study of the Effects of Land Use and Land Cover Change on the Climate System. Clim. Environ. Res. 2012, 17, 103–111. [Google Scholar]
- Hahmann, A.N.; Dickinson, R.E. RCCM2–BATS Model over Tropical South America: Applications to Tropical Deforestation. J. Clim. 1997, 10, 1944–1964. [Google Scholar] [CrossRef]
- Wang, J.L.; Wu, G.P.; Fan, Q.Y.; Cui, J.T. Change and prediction of the land use in Linyi city, Shandong province, based on CA-Markov model. Res. Soil Water Conserv. 2015, 22, 212–216. [Google Scholar]
- Wang, W.Y. Study on Landscape Patterns and Dynamics in Urbanization Processes at the Main Urban Area in Linyi City; Beijing Forestry University: Beijing, China, 2020; 93p. [Google Scholar] [CrossRef]
- Sun, Y.; Zhang, X.; Zwiers, F.W.; Song, L.; Wan, H.; Hu, T. Rapid Increase in the Risk of Extreme Summer Heat in Eastern China. Nat. Clim. Chang. 2014, 4, 1082–1085. [Google Scholar] [CrossRef]


Publisher’s Note: MDPI stays neutral with regard to jurisdictional claims in published maps and institutional affiliations. |
© 2022 by the authors. Licensee MDPI, Basel, Switzerland. This article is an open access article distributed under the terms and conditions of the Creative Commons Attribution (CC BY) license (https://creativecommons.org/licenses/by/4.0/).
Share and Cite
Zhu, Y.; Li, B.; Lian, L.; Wu, T.; Wang, J.; Dong, F.; Wang, Y. Quantifying the Effects of Climate Variability, Land-Use Changes, and Human Activities on Drought Based on the SWAT–PDSI Model. Remote Sens. 2022, 14, 3895. https://doi.org/10.3390/rs14163895
Zhu Y, Li B, Lian L, Wu T, Wang J, Dong F, Wang Y. Quantifying the Effects of Climate Variability, Land-Use Changes, and Human Activities on Drought Based on the SWAT–PDSI Model. Remote Sensing. 2022; 14(16):3895. https://doi.org/10.3390/rs14163895
Chicago/Turabian StyleZhu, Yanbing, Baofu Li, Lishu Lian, Tianxiao Wu, Junshan Wang, Fangshu Dong, and Yunqian Wang. 2022. "Quantifying the Effects of Climate Variability, Land-Use Changes, and Human Activities on Drought Based on the SWAT–PDSI Model" Remote Sensing 14, no. 16: 3895. https://doi.org/10.3390/rs14163895