A Factor Analysis Backpropagation Neural Network Model for Vegetation Net Primary Productivity Time Series Estimation in Western Sichuan
Abstract
:1. Introduction
2. Materials and Methods
2.1. Materials
2.1.1. Study Area
2.1.2. Data SOURCE and Preprocessing
2.2. Methods
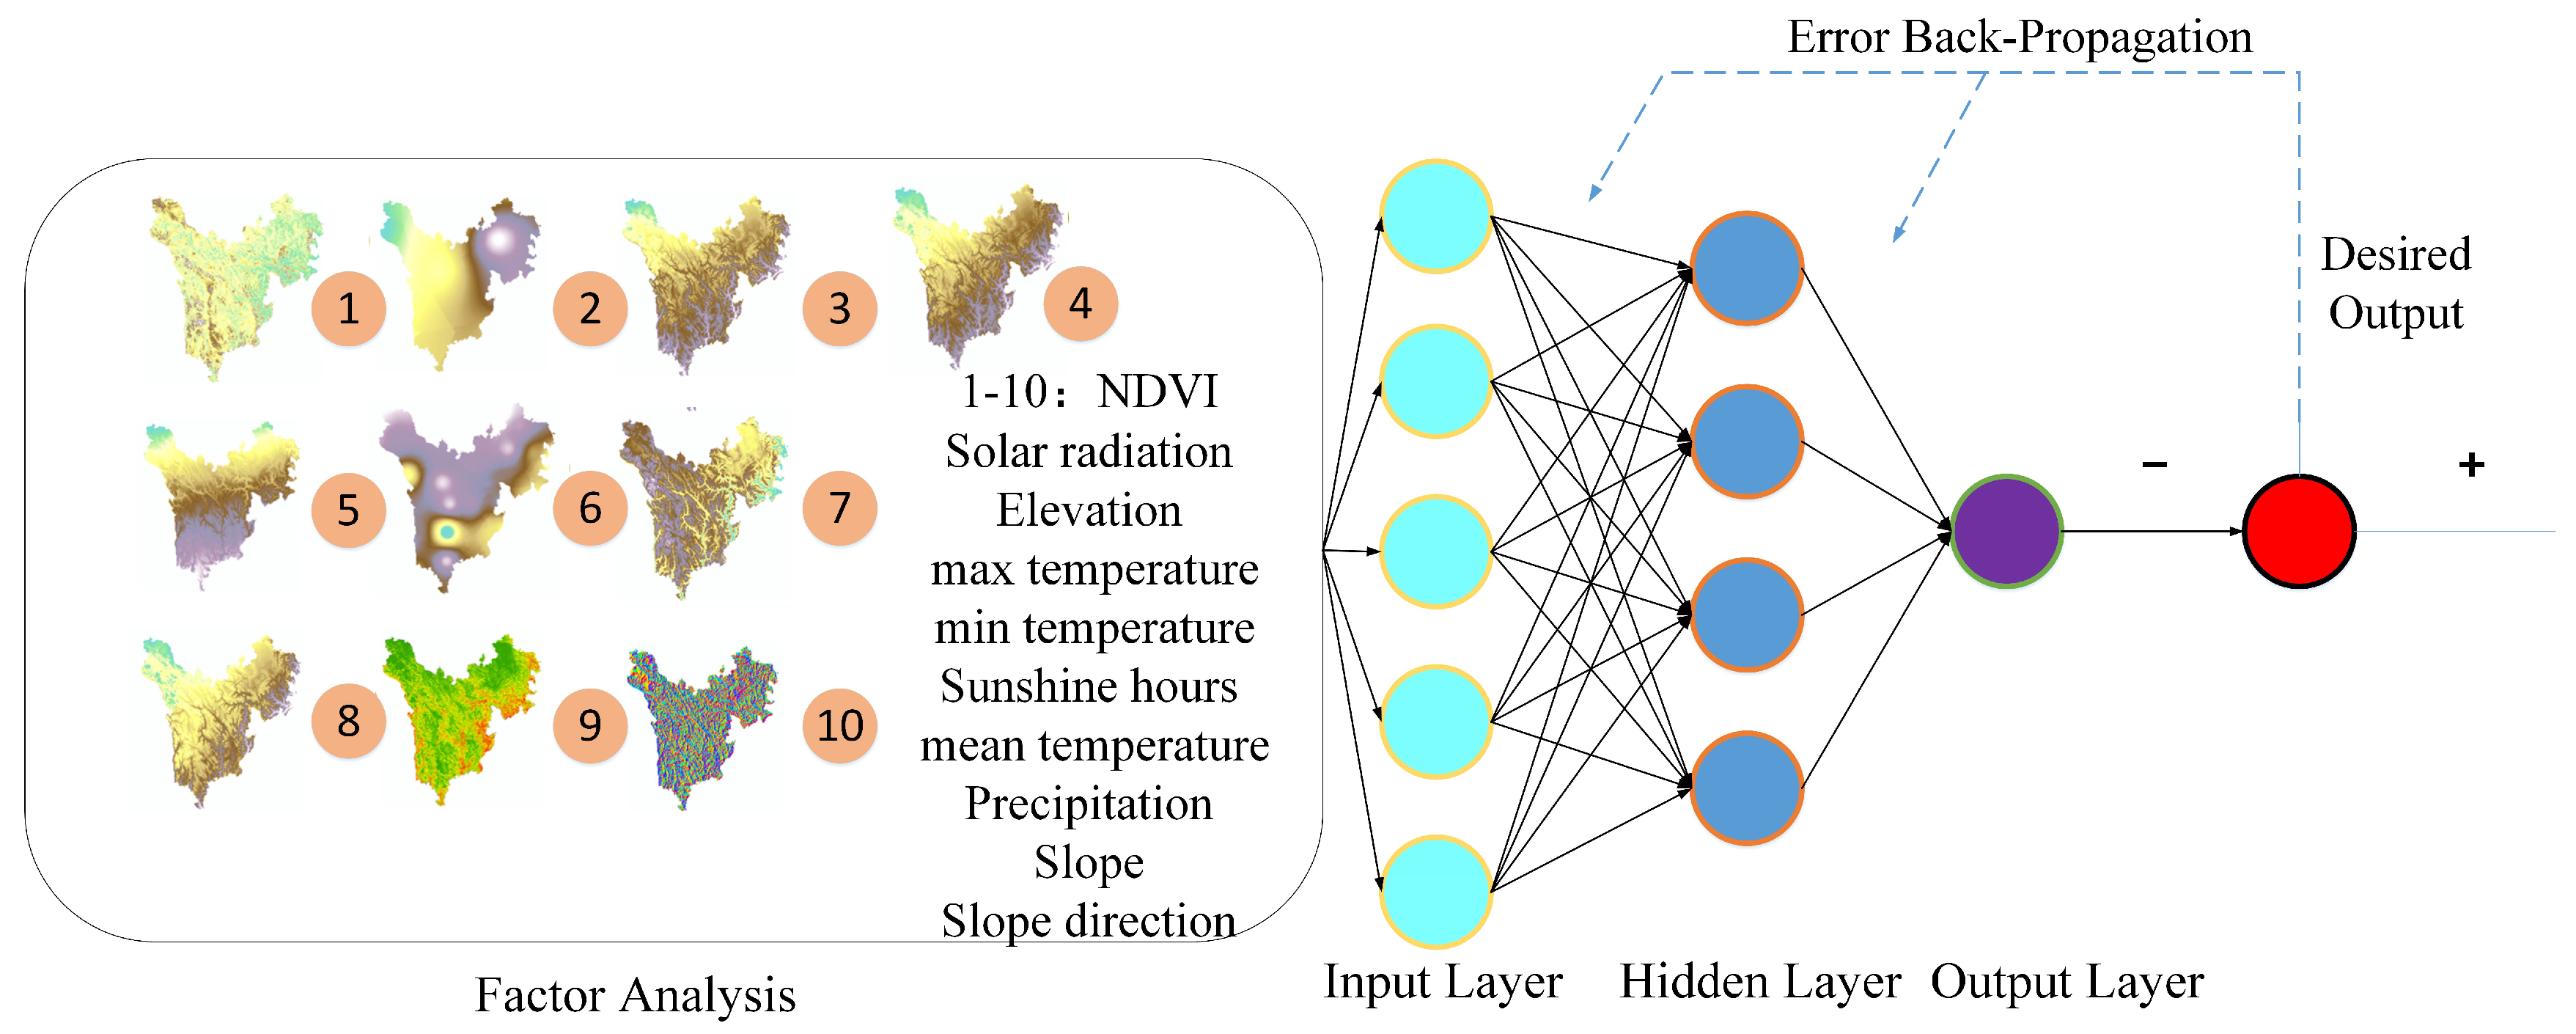
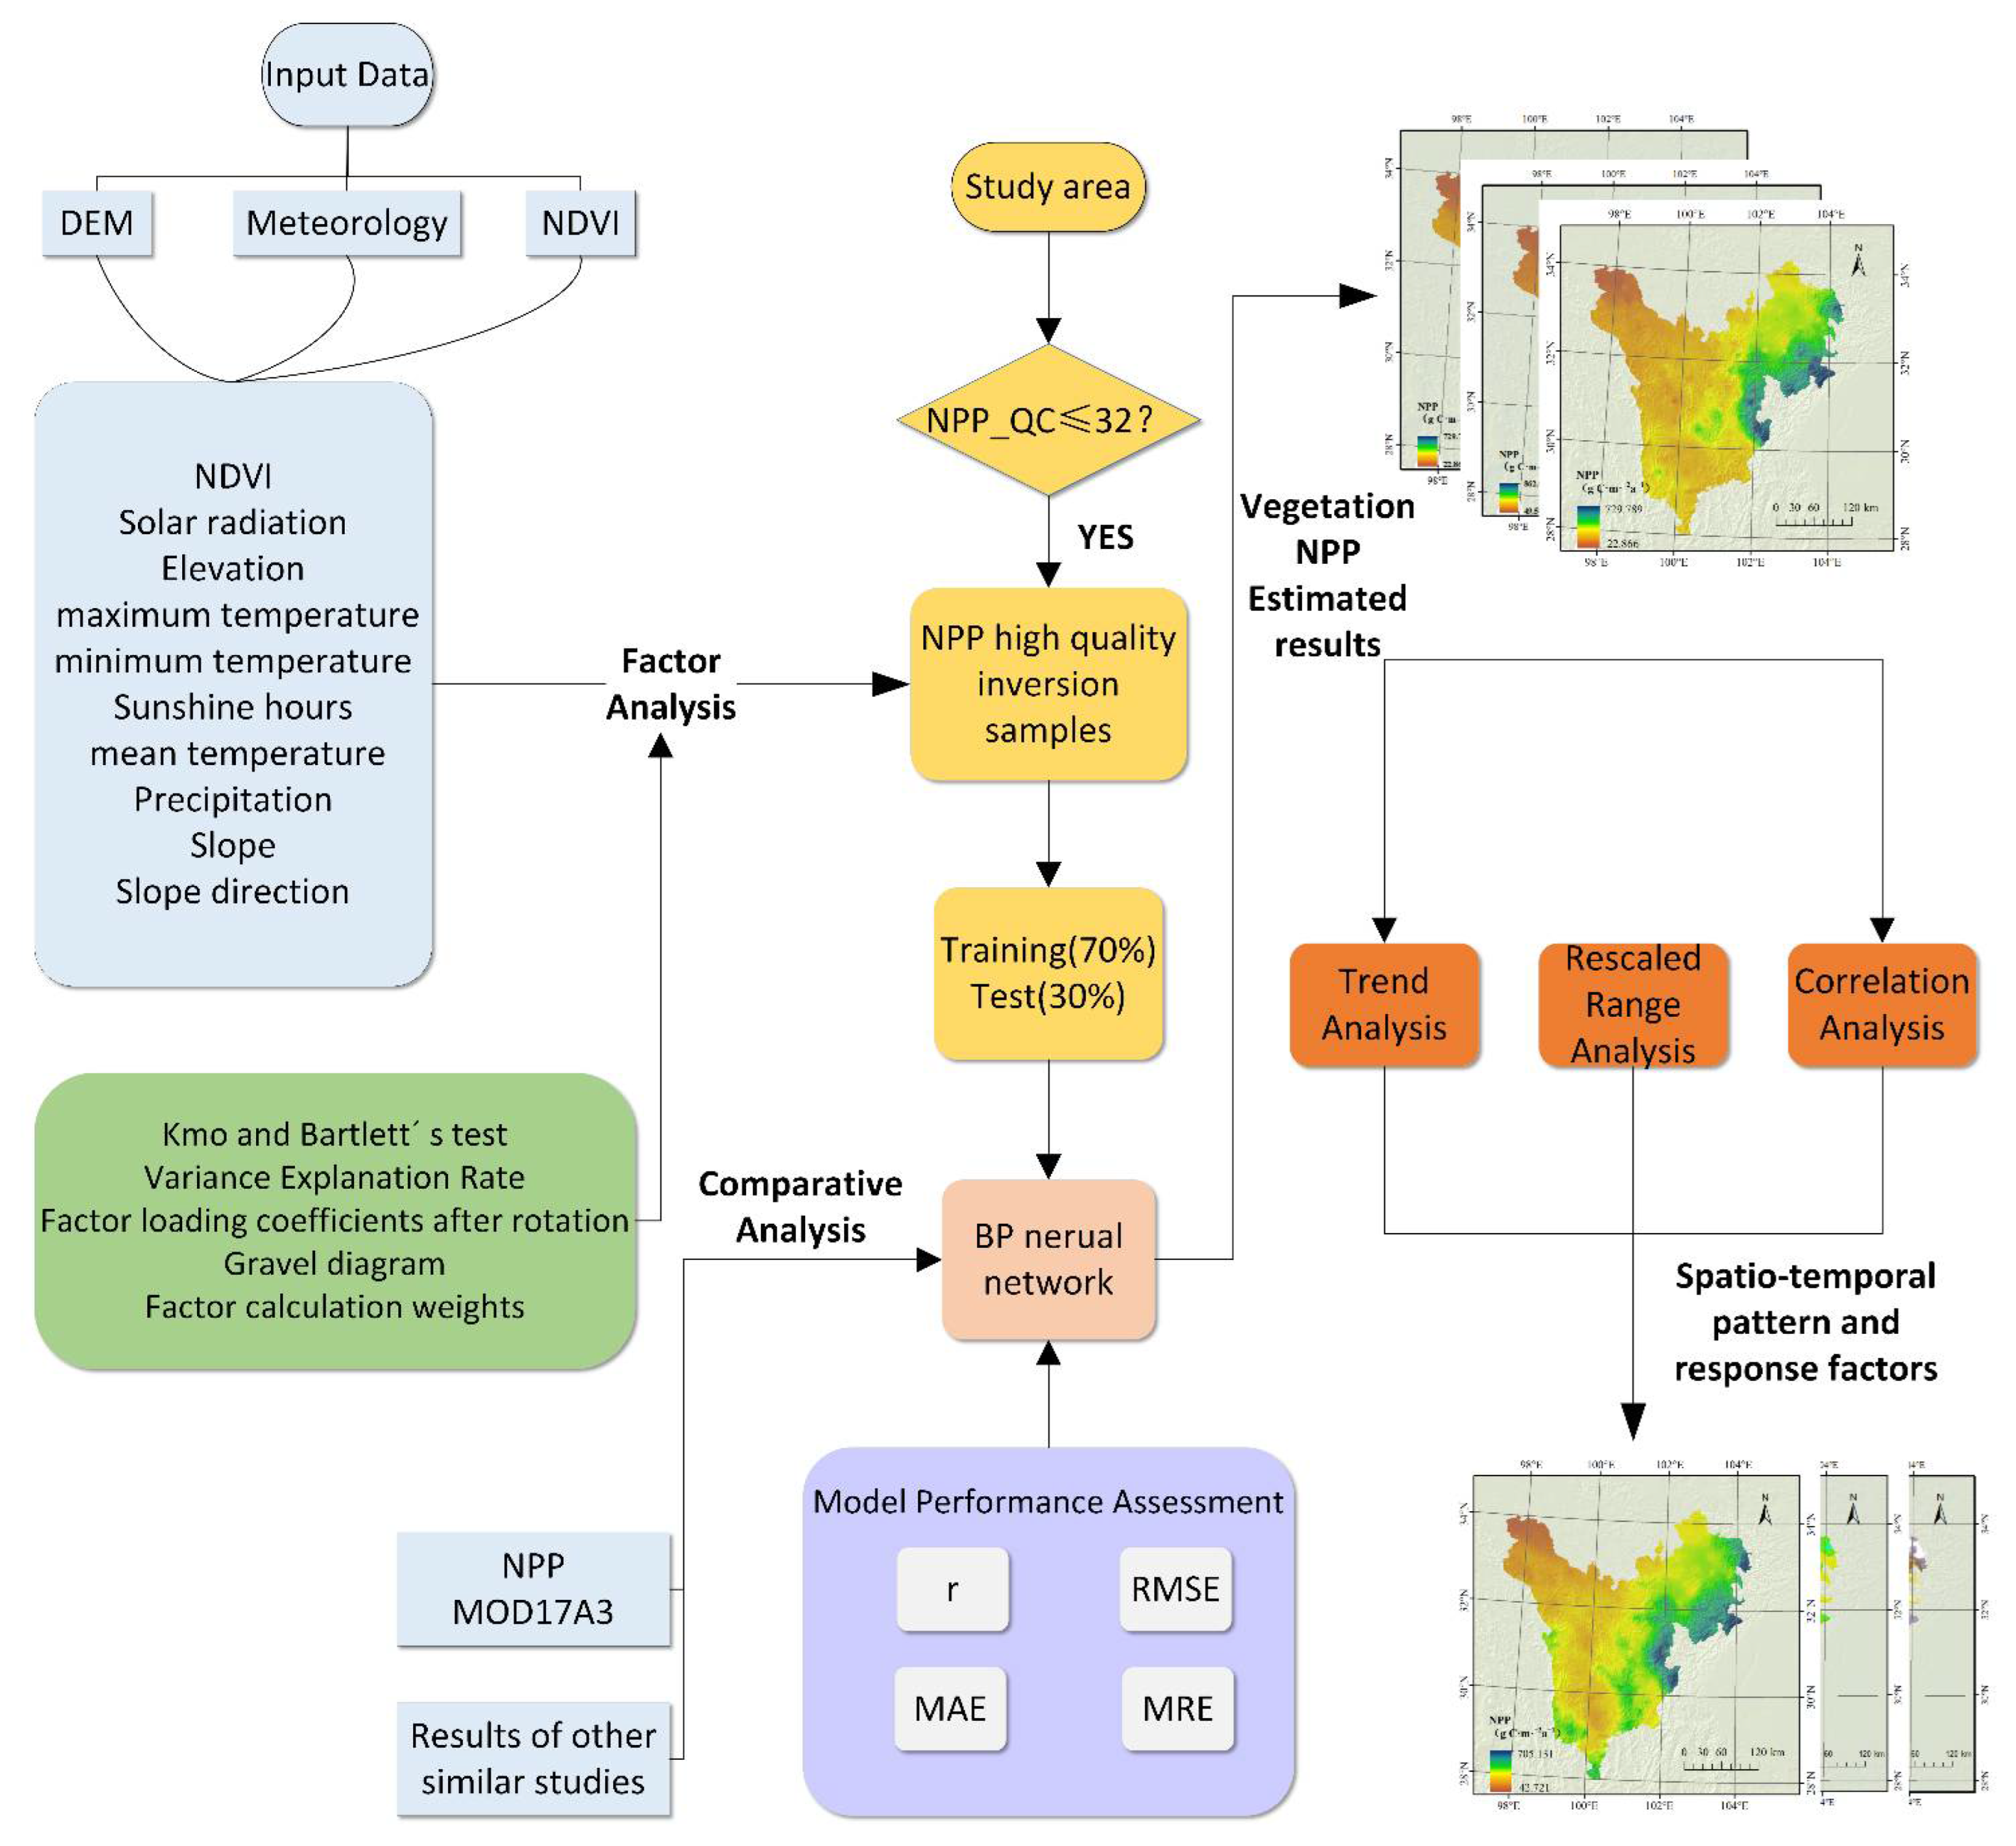
2.2.1. FA-BP Neural Network
2.2.2. NPP Estimation and Analysis Algorithm
- (1)
- Trend Analysis Method
- (2)
- Rescaled Range Analysis Method
- (3)
- Related Analysis
3. Results and Analysis
3.1. Validation of NPP Estimation Results
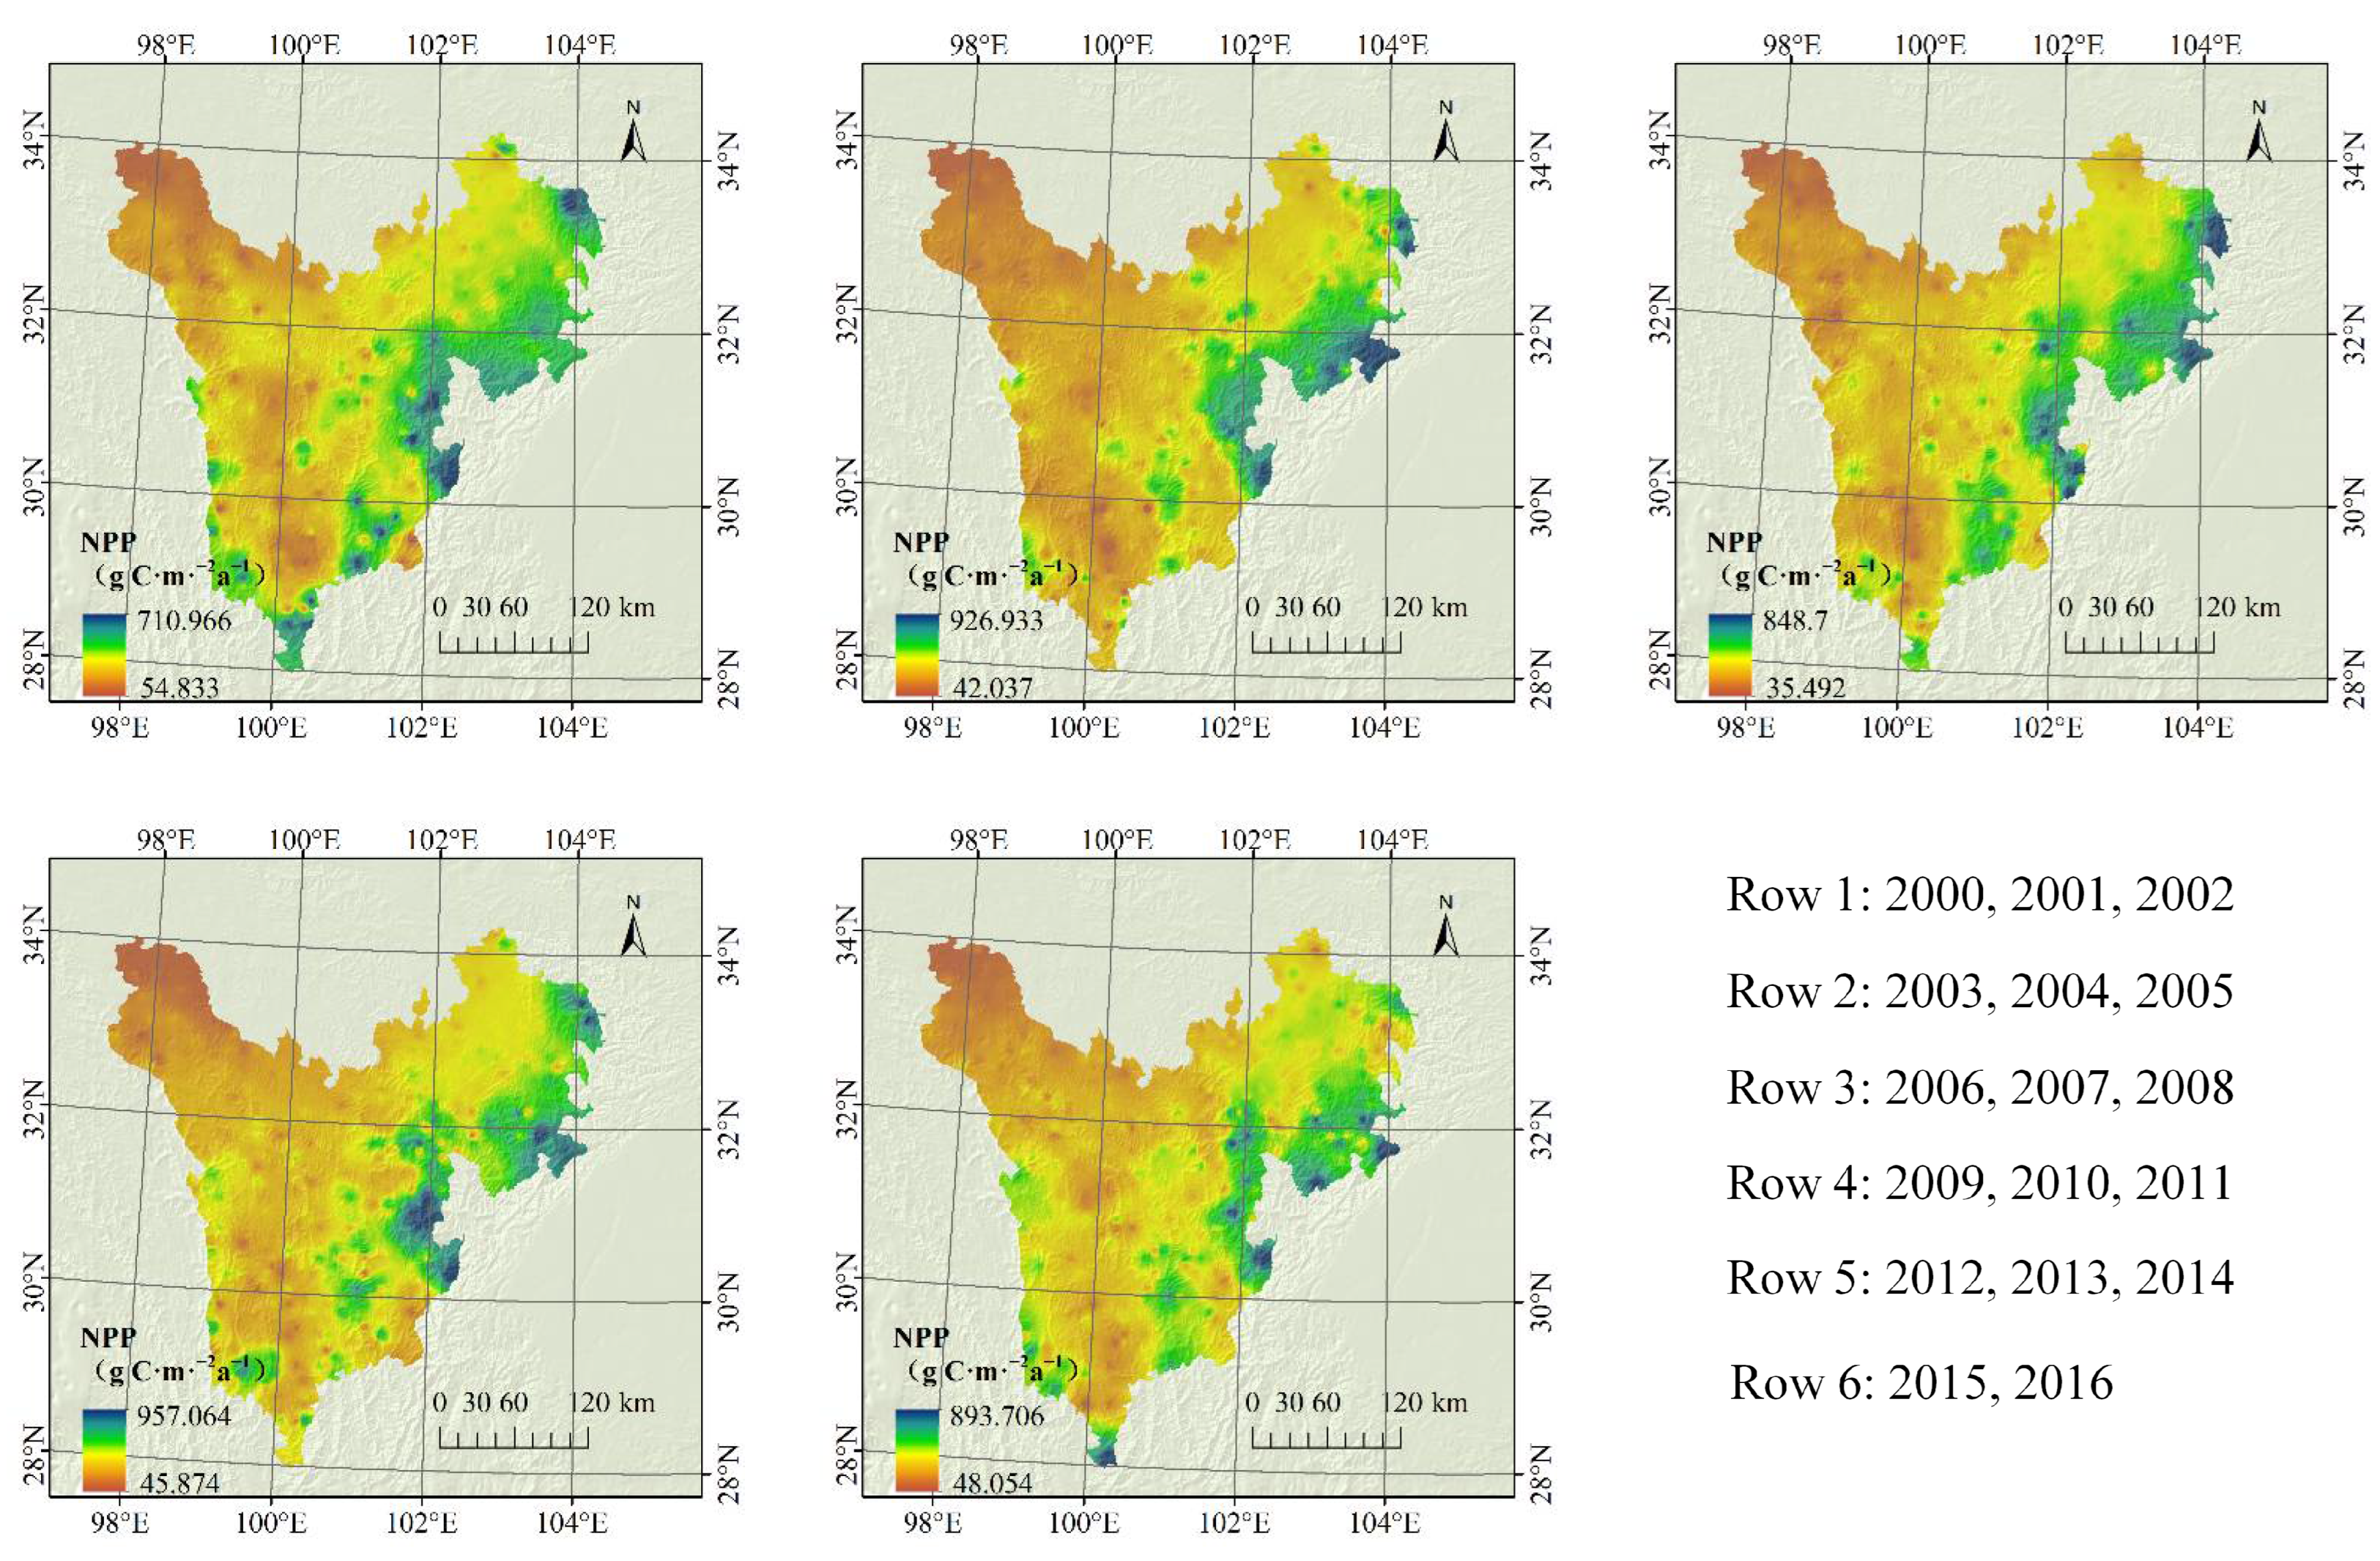
3.2. Spatial Pattern Characteristics of NPP
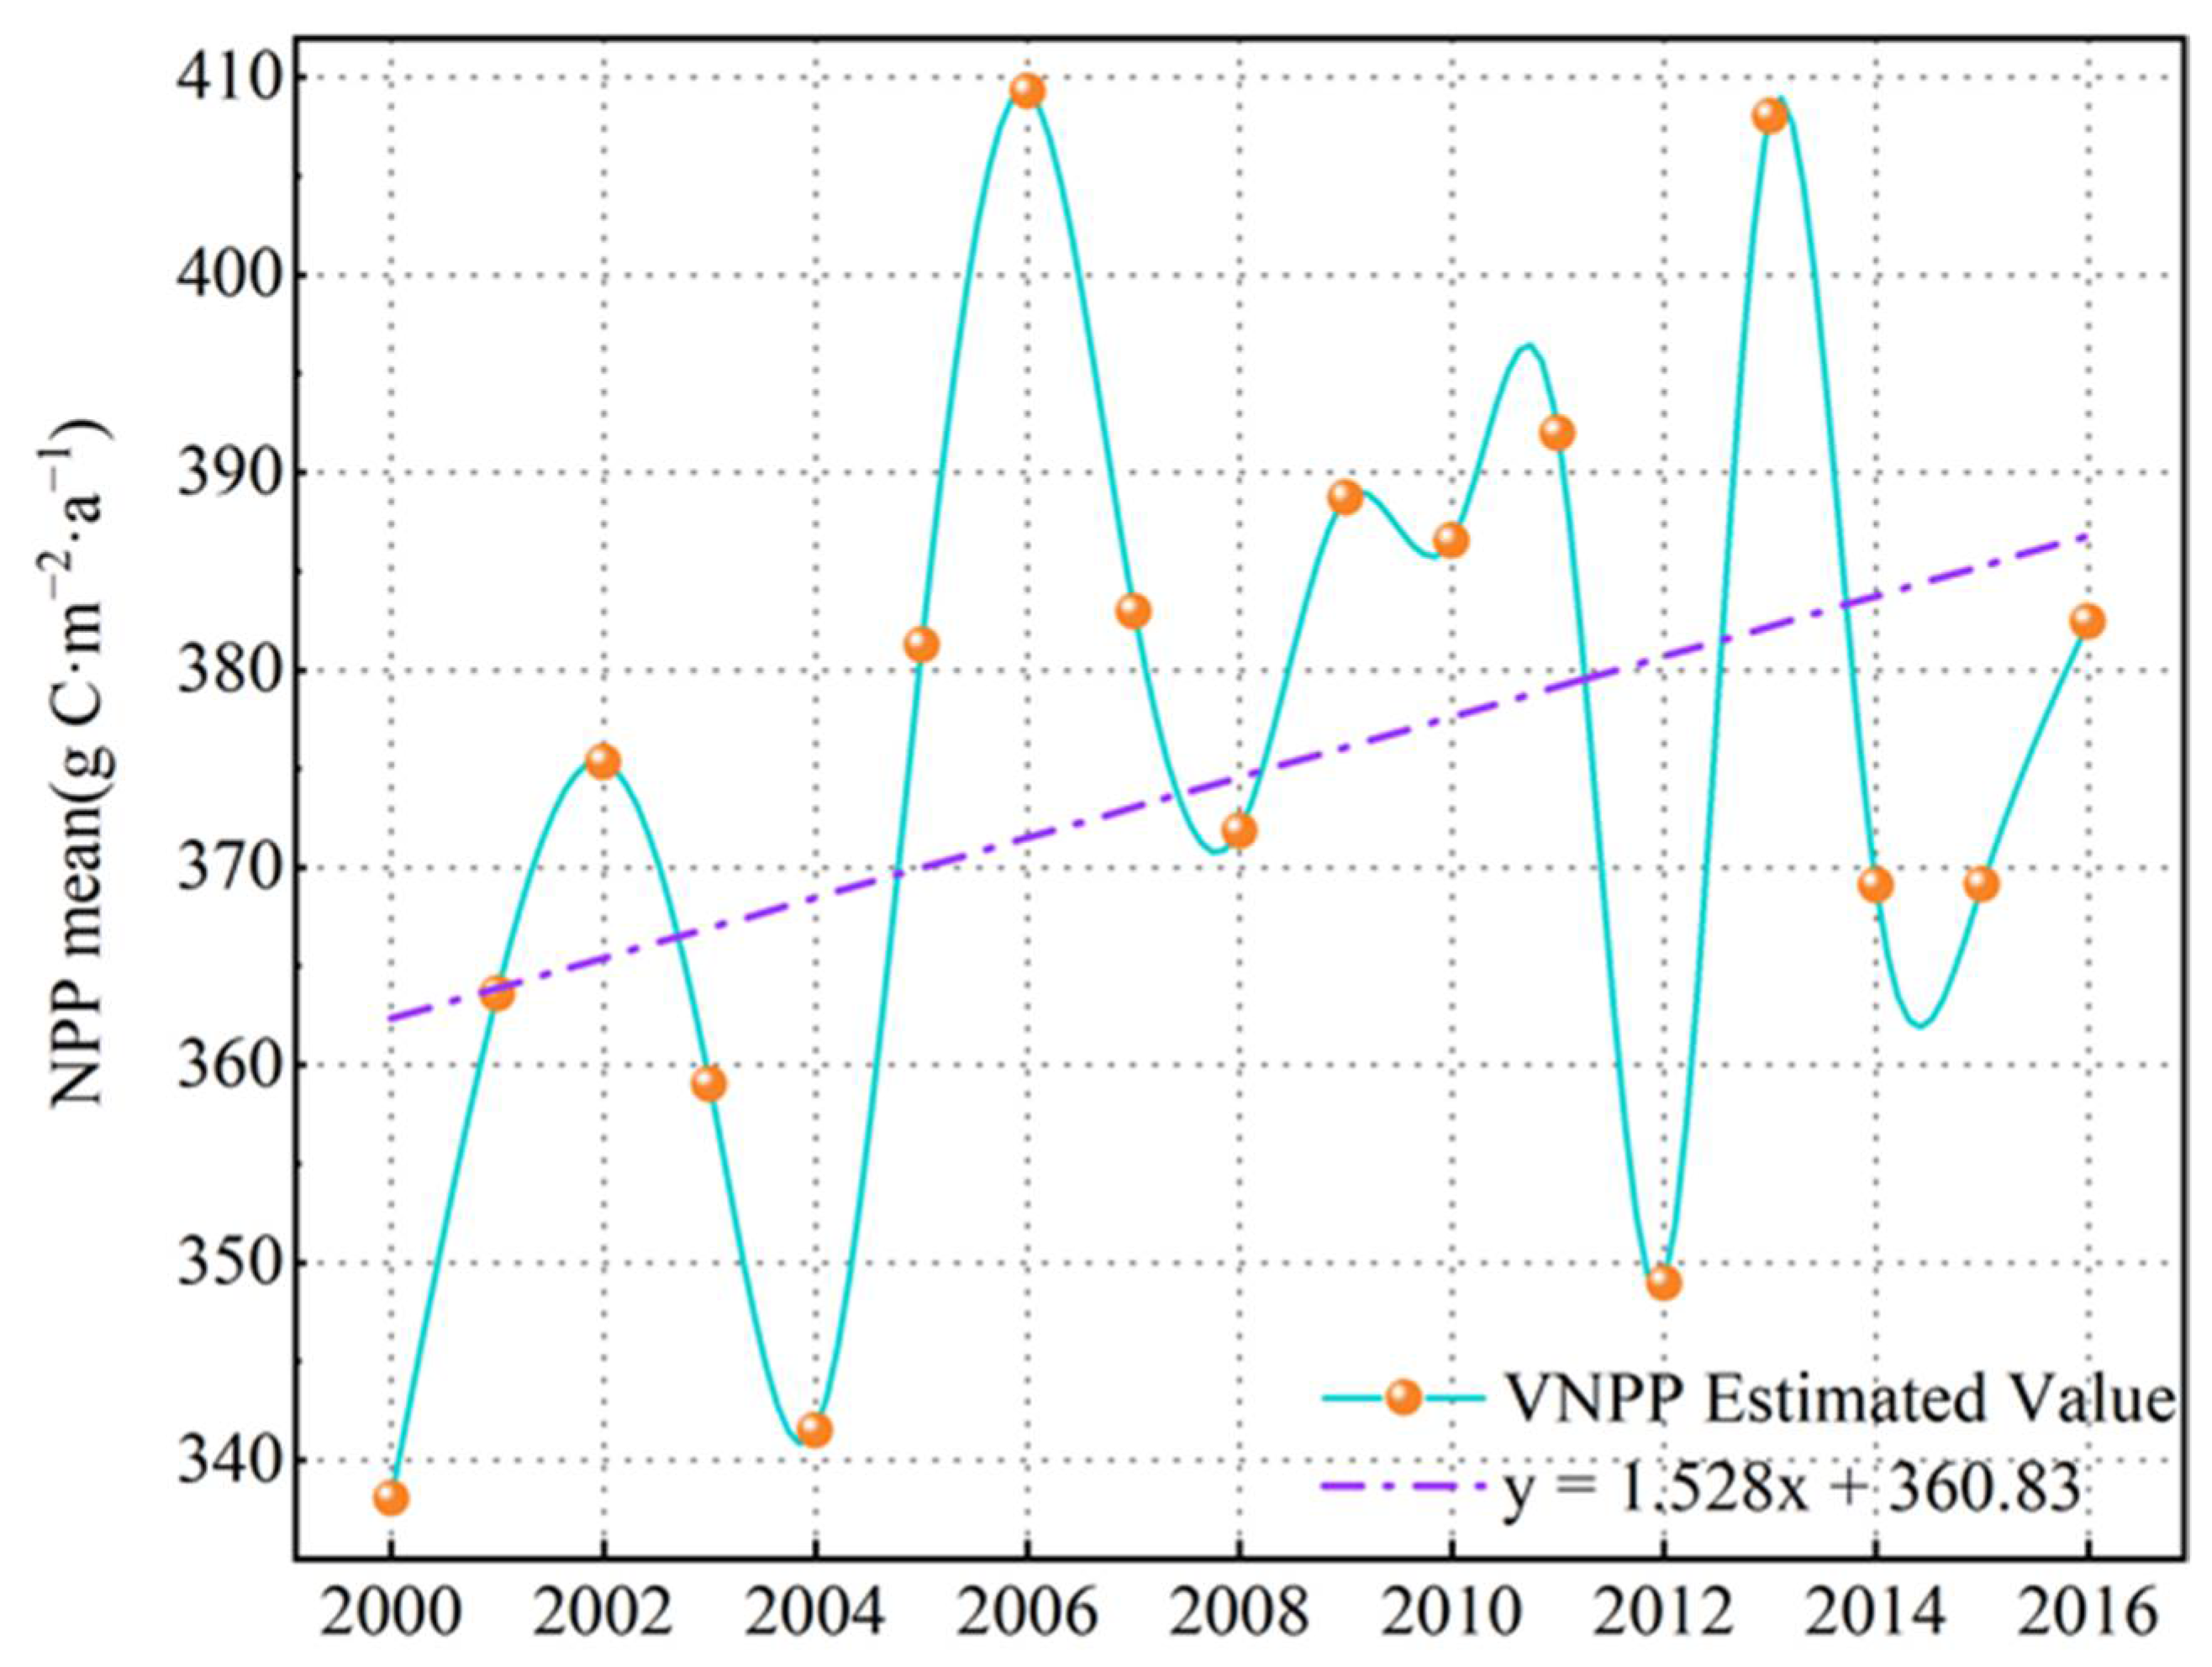
3.3. Characteristics of NPP Changes
3.4. Impact Factor Analysis
4. Discussion
5. Conclusions
Author Contributions
Funding
Data Availability Statement
Acknowledgments
Conflicts of Interest
Abbreviations
| FA-BP | Factor Analysis-Back propagation |
| VNPP | vegetation net primary productivity |
| BFAST | breaks for additive season and trend |
| NDVI | normalized difference vegetation index |
| DEM | digital elevation model |
| MRT | MODIS reprojection tool |
| MVC | maximum value composite |
| SPSS | statistical product service solutions |
| NPP_QC | net primary productivity quality control |
| CASA model | Carnegie-Ames-Stanford approach model |
| BEPS model | boreal ecosystem productivity simulator model |
References
- Field, C.B.; Behrenfeld, M.J.; Randerson, J.T.; Falkowski, P. Primary Production of the Biosphere: Integrating Terrestrial and Oceanic Components. Science 1998, 281, 237–240. [Google Scholar] [CrossRef]
- Caiping, Z.; Yanghua, O.; Qinxue, W.; Masataka, W.; Qingqiang, S. Estimation of Net Primary Productivity in Tibetan Plateau. Acta Geogr. Sin. 2004, 59, 74–79. [Google Scholar]
- Ruimy, A.; Kergoat, L.; Bondeau, A.; Schloss, A.L. Comparing Global Models of Terrestrial Net Primary Productivity (NPP): Analysis of Differences in Light Absorption, Light-Use Efficiency, and Whole Plant Respiration Cost. Glob. Chang. Biol. 1999, 5 (Suppl. 1), 56–64. [Google Scholar] [CrossRef]
- Zhu, W.Q.; Pan, Y.Z.; Zhang, J.S. Estimation of net primary productivity of chinese terrestrial vegetation based on remote sensing. J. Plant Ecol. 2007, 31, 413–424. [Google Scholar]
- Sun, Q.; Li, B.; Zhang, T.; Yuan, Y.; Gao, X.; Ge, J.; Li, F.; Zhang, Z. An Improved Biome-BGC Model for Estimating Net Primary Productivity of Alpine Meadow on the Qinghai-Tibet Plateau. Ecol. Model. 2017, 350, 55–68. [Google Scholar] [CrossRef]
- Verbesselt, J.; Hyndman, R.; Zeileis, A.; Culvenor, D. Phenological Change Detection While Accounting for Abrupt and Gradual Trends in Satellite Image Time Series. Remote Sens. Environ. 2010, 114, 2970–2980. [Google Scholar] [CrossRef]
- Wenjie, F.U.; Jinyi, H.; Mingsen, L.I.N. A Method of Land Use Classification from Remote Sensing Image Based on Support Vector Machines and Spectral Similarity Scale. Remote Sens. Technol. Appl. 2006, 21, 25–30. [Google Scholar]
- Haijun, W.; Xiangdong, K.; Kejun, W.; Bo, Z.; Zhuang, Z.; Qi, R. Using Night-Light Remote Sensing Image for Urbanization Monitoring. Computer Engineering and Applications. Comput. Eng. Appl. 2018, 54, 235–239. [Google Scholar]
- Chuanjian, W.; Qingzhan, Z.; Yongjian, M.; Yuanyuan, R. Crop Identification of Drone Remote Sensing Based on Convolutional Neural Network. Trans. Chin. Soc. Agric. Mach. 2019, 50, 161–168. [Google Scholar]
- Quan, J.; Zhan, W.; Chen, Y.; Wang, M.; Wang, J. Time Series Decomposition of Remotely Sensed Land Surface Temperature and Investigation of Trends and Seasonal Variations in Surface Urban Heat Islands. J. Geophys. Res.-Atmos. 2016, 121, 2638–2657. [Google Scholar] [CrossRef]
- Lee, E.; Kim, D.; Bae, H. Container Volume Prediction Using Time-Series Decomposition with a Long Short-Term Memory Models. Appl. Sci. 2021, 11, 8995. [Google Scholar] [CrossRef]
- Fiorentini, G.; Planas, C. Overcoming Nonadmissibility in ARIMA-Model-Based Signal Extraction. J. Bus. Econ. Stat. 2001, 19, 455–464. [Google Scholar] [CrossRef]
- Ghaderpour, E. Least-Squares Wavelet and Cross-Wavelet Analyses of VLBI Baseline Length and Temperature Time Series: Fortaleza-Hartebeesthoek-Westford-Wettzell. Publ. Astron. Soc. Pac. 2021, 133, 014502. [Google Scholar] [CrossRef]
- Andronis, V.; Karathanassi, V.; Tsalapati, V.; Kolokoussis, P.; Miltiadou, M.; Danezis, C. Time Series Analysis of Landsat Data for Investigating the Relationship between Land Surface Temperature and Forest Changes in Paphos Forest, Cyprus. Remote Sens. 2022, 14, 1010. [Google Scholar] [CrossRef]
- Zhou, Y.; Wang, S.; Wu, T.; Feng, L.; Wu, W.; Luo, J.; Zhang, X.; Yan, N. For-Backward LSTM-Based Missing Data Reconstruction for Time-Series Landsat Images. Giscience Remote Sens. 2022, 59, 410–430. [Google Scholar] [CrossRef]
- Hejie, W.; Yanfang, Z.; Ni, Z.; Xinqiao, L. Temporal-Spatial Changes of Farmland Productivity in Henan Province Using MODIS Data. Sci. Surv. Mapp. 2014, 39, 67–71. [Google Scholar]
- Feng-xia, W.U.; Chun-hou, L.I.; Ming, D.A.I.; Fei-yan, D.U.; Lin, L.I.N.; Hao, W. Study on Forecasting Model of Artificial Neural Networks of Primary Productivity in Daya Bay. Mar. Environ. Sci. 2009, 28, 652–656. [Google Scholar]
- Haijuan, Y.; Xiaojin, W.; Yanxu, L. Utilization Zoning of Cultivated Land Based on Net Primary Productivity in Guanzhong-Tianshui Economic Region. Chin. J. Eco-Agric. 2013, 21, 503–510. [Google Scholar]
- Chuanhua, L.; Tongbin, Z.; Min, Z.; Huanhuan, Y.; Yutao, W.; Hao, S.; Hongjuan, C.; Haiyan, H. Temporal and Spatial Change of Net Primary Productivity of Vegetation and Its Determinants in Hexi Corridor. Acta Ecol. Sin. 2021, 41, 1931–1943. [Google Scholar]
- Jing, G.; Guangshun, H.; Xin, Z. Prediction of Environment Carrying Capacity in Coastal Areas by Integrating Factor Analysis and BP Neural Network. Mar. Environ. Sci. 2011, 30, 707–710. [Google Scholar]
- Wenying, S.; Yingxue, L.; Wei, F.; Haiyan, Z.; Yuanshuai, Z.; Yingxin, X.; Tiancai, G. Inversion Model for Severity of Powdery Mildew in Wheat Leaves Based on Factor Analysis-BP Neural Network. Trans. Chin. Soc. Agric. Eng. 2015, 31, 183–190. [Google Scholar]
- Hong-xia, L.I.; Xin-hua, Z.; Hai-yan, C.H.I.; Jian-jun, Z. Prediction and Analysis of Land Subsidence Based on Improved BP Neural Network Model. J. Tianjin Univ. 2009, 42, 60–64. [Google Scholar]
- Yanli, C.; Buju, L.; Xuebiao, P.A.N.; Shiquan, Z.; Weihua, M.O. Differences between MODIS NDVI and AVHRR NDVI in Monitoring Grasslands Change. J. Remote Sens. 2011, 15, 831–845. [Google Scholar]
- Xiong, K.; Juntao, C.; Cheng, C.; Jie, Y.; Jianxiong, W. Analysis of Long-Term Vegetation Change in Ningxia with Different Trend Methods. Bull. Surv. Mapp. 2020, 11, 23–27. [Google Scholar]
- Hooper, R.M. The Mosaicking of ERTS-1 Imagery on Albers’ Equal-Area Projection. Am. Cartogr. 2013, 1, 29–38. [Google Scholar] [CrossRef]
- Akaike, H. Factor-analysis and aic. Psychometrika 1987, 52, 317–332. [Google Scholar] [CrossRef]
- Tucker, L.R.; Lewis, C. A Reliability Coefficient for Maximum Likelihood Factor Analysis. Psychometrika 1973, 38, 1–10. [Google Scholar] [CrossRef]
- Ma, D.; Zhou, T.; Chen, J.; Qi, S.; Shahzad, M.A.; Xiao, Z. Supercritical Water Heat Transfer Coefficient Prediction Analysis Based on BP Neural Network. Nucl. Eng. Des. 2017, 320, 400–408. [Google Scholar] [CrossRef]
- Rumelhart, D.; Hinton, G.; Williams, R. Learning Representations By Back-Propagating Errors. Nature 1986, 323, 533–536. [Google Scholar] [CrossRef]
- Wang, Y.; Lu, C.; Zuo, C. Coal Mine Safety Production Forewarning Based on Improved BP Neural Network. Int. J. Min. Sci. Technol. 2015, 25, 319–324. [Google Scholar] [CrossRef]
- Dan, Z.; Jingtao, P.A.N.; Jian, L.I.U. Average Wind Speed of Roadway from Measurements of Wind Speed Sensor Based on One-Dimensional Linear Regression. World Sci.-Technol. R D 2011, 33, 229–231,241. [Google Scholar]
- Yuanyao, L.; Kunlong, Y.; Wenming, C. Application of R/S Method in Forecast of Landslide Deformation Trend. Chin. J. Geotech. Eng. 2010, 32, 1291–1296. [Google Scholar]
- Xiaolong, Z.; Lingmei, H.; Quan, Q.; Lei, Z.; Bing, S.; Shuhong, M. Relationship of Vegetation Cover Change with Climate Factors in Source Region of the Yellow River Based on ITPCAS Forcing Data. J. Northwest A F Univ. Nat. Sci. Ed. 2019, 47, 55–68. [Google Scholar]
- Xinqian, H.; Yong, H.; Tao, S. Spatiotemporal Evolution of Vegetation Net Primary Productivity in the Karst Region of Southwest China from 2001 to 2018. Acta Ecol. Sin. 2021, 41, 9836–9846. [Google Scholar]
- Siyao, L.; Tao, L.; Bin, T.; Yan, W.; Ning, W. Spatial-Temporal Variations of Net Primary Productivity of Sichuan Vegetation Based on CASA Model. J. Sichuan Agric. Univ. 2013, 31, 269–276,282. [Google Scholar]
- Chuanhua, L.; Hao, S.; Yutao, W.; Hongjuan, C.; Huanhuan, Y.; Min, Z.; Tongbin, Z. Estimation of Grassland Net Primary Productivity in Permafrost of Qinghai-Tibet Plateau Based on Machine Learning. Chin. J. Ecol. 2020, 39, 1734–1744. [Google Scholar]
- Xingkui, X.; Hong, C.; Guangqing, Z. The Spatiotemporal Distribution of Land Surface Features in the Tibetan Plateau. Clim. Environ. Res. 2005, 10, 409–420. [Google Scholar]
- Zhengyu, L.; Xiao, L.; Peng, H. The Temporal and Spatial Characteristics and the Development Strategies of Ecological Agriculture of Sichuan Tibetan Area. Res. Agric. Mod. 2016, 37, 1091–1099. [Google Scholar]
- Jingwei, L.; Zhifeng, L.; Chunyang, H.; Bin, G. Assessing the Human-Environment System Sustainability in China from 1990 to 2010 Based on Human Sustainable Development Index. J. Nat. Resour. 2015, 30, 1118–1128. [Google Scholar]
- Dengke, L.; Zhao, W. The Characteristics of NPP of Terrestrial Vegetation in China Based on MOD17A3 Data. Ecol. Environ. Sci. 2018, 27, 397–405. [Google Scholar]
- Donghai, Z.; Zhiyuan, R.; Xiaofeng, W.; Jiangtao, B.; Xianfeng, L.; Xueming, F. MODIS Based Analysis of Dynamic Variation of Fractional Vegetation Coverage of the Loess Plateau of Shaanxi and Its Driving Forces. J. Ecol. Rural. Environ. 2013, 29, 29–35. [Google Scholar]
- Mao, F.; Du, H.; Li, X.; Ge, H.; Cui, L.; Zhou, G. Original Spatiotemporal Dynamics of Bamboo Forest Net Primary Productivity with Climate Variations in Southeast China. Ecol. Indic. 2020, 116, 106505. [Google Scholar] [CrossRef]
- Yimin, H.; Xinping, Z. Character Analysis in Variation of Seasonal Precipitation over the Tibetan Plateau. Resour. Environ. Yangtze Basin 2007, 16, 537–542. [Google Scholar]
- Yanlin, X.; Yunjun, Z. Temporal-spatial distribution of ground surface total solar radiation and meteorological influencing factors for sichuan area. Acta Energ. Sol. Sin. 2020, 41, 162–171. [Google Scholar]
- Hongbei, G.; Mingan, S. Heat Storage Fluxes of Spring Wheat during Growth Periods in the Oasis Farmland in Heihe Basin. J. Irrig. Drain. 2015, 34, 33. [Google Scholar]
- Feng, Z.; GuangSheng, Z.; YuHui, W. Dynamics simulation of net primary productivity by a satellite data-driven casa model in inner mongolian typical steppe, china. Acta Phytoecol. Sin. 2008, 32, 786–797. [Google Scholar]
- Yiming, F.; Aidong, Y.; Lina, J. Improving the CASA Model and Applying It to Estimate the Net Primary Productivity of Arid Region Ecology System. J. Arid. Land Resour. Environ. 2014, 28, 39–43. [Google Scholar]
- Fangmin, Z.; Weimin, J.; Jingming, C.; Shaoqiang, W.; Guirui, Y.; Yingnian, L.; Shijie, H.; Asanuma, J. Study on Evapotranspiration in East Asia Using the BEPS Ecological Model. J. Nat. Resour. 2010, 25, 1596–1606. [Google Scholar]
- Peijuan, W.; Rui, S.; Qi; Donghui, X.; Jingming, C. Improvement on the Abilities of BEPS under Accidented Terrain. J. Image Graph. 2006, 11, 1017–1025. [Google Scholar]
- Jun, L.; Ming, R.; Yunqi, Z. Research on Marketing Risk Early-Warning System Based on FA-BP Evaluation Model. Adv. Manag. Technol. Proc. 2007, 148. [Google Scholar]


| Data | Name | Time Resolution | Spatial Resolution | Source |
|---|---|---|---|---|
| NPP | MOD17A3 | 1a | 500 m | NASA |
| NDVI | MOD13A1 | 16d | 500 m | NASA |
| Meteorological | Meteorological | \ | \ | CMSDC |
| DEM | DEM | \ | 90 | RAEDCP |
| Time | KMO | AC |
|---|---|---|
| 2000 | 0.665 | 16,248.5 |
| 2001 | 0.767 | 14,025.1 |
| 2002 | 0.718 | 22,273.4 |
| 2003 | 0.750 | 15,745.3 |
| 2004 | 0.651 | 21,999.7 |
| 2005 | 0.687 | 13,404.2 |
| 2006 | 0.738 | 17,596.8 |
| 2007 | 0.769 | 18,793.5 |
| 2008 | 0.743 | 18,161.1 |
| 2009 | 0.685 | 10,111.9 |
| 2010 | 0.686 | 15,886.2 |
| 2011 | 0.700 | 13,158.3 |
| 2012 | 0.699 | 10,501.4 |
| 2013 | 0.722 | 17,819.9 |
| 2014 | 0.684 | 14,333.8 |
| 2015 | 0.681 | 18,221.0 |
| 2016 | 0.799 | 13,791.2 |
| Time | Training | Validation | Test | All |
|---|---|---|---|---|
| 2000 | 0.86512 | 0.82594 | 0.89347 | 0.86244 |
| 2001 | 0.87986 | 0.89885 | 0.91339 | 0.88679 |
| 2002 | 0.90095 | 0.88478 | 0.90217 | 0.89872 |
| 2003 | 0.88292 | 0.84220 | 0.88838 | 0.87851 |
| 2004 | 0.88652 | 0.88888 | 0.86180 | 0.88086 |
| 2005 | 0.88062 | 0.82577 | 0.85725 | 0.87168 |
| 2006 | 0.87618 | 0.85087 | 0.84339 | 0.86681 |
| 2007 | 0.89335 | 0.86147 | 0.90641 | 0.89092 |
| 2008 | 0.91130 | 0.85679 | 0.90599 | 0.90252 |
| 2009 | 0.83066 | 0.81766 | 0.82209 | 0.82703 |
| 2010 | 0.87184 | 0.81120 | 0.85792 | 0.86246 |
| 2011 | 0.86306 | 0.88205 | 0.86997 | 0.86674 |
| 2012 | 0.85335 | 0.86516 | 0.80543 | 0.84798 |
| 2013 | 0.91872 | 0.85889 | 0.91189 | 0.90904 |
| 2014 | 0.88753 | 0.83188 | 0.84608 | 0.87030 |
| 2015 | 0.88271 | 0.87930 | 0.87950 | 0.88197 |
| 2016 | 0.89166 | 0.86096 | 0.86535 | 0.88385 |
| Time | Fitting Equation | r | p-Value | MAE | RMSE | MRE |
|---|---|---|---|---|---|---|
| 2000 | y = 0.9734x − 0.5042 | 0.882 | 0.008 | 34.4 | 44.6 | 0.12 |
| 2001 | y = 1.0365x + 0.6028 | 0.824 | 0.009 | 32.3 | 41.3 | 0.11 |
| 2002 | y = 0.9801x − 2.9982 | 0.831 | 0.007 | 32.5 | 40.7 | 0.10 |
| 2003 | y = 0.9890x + 1.6989 | 0.887 | 0.007 | 33.1 | 42.1 | 0.12 |
| 2004 | y = 0.9784x + 1.0849 | 0.856 | 0.005 | 29.1 | 37.3 | 0.10 |
| 2005 | y = 0.9729x + 3.6431 | 0.827 | 0.006 | 33.5 | 41.6 | 0.10 |
| 2006 | y = 1.0867x − 35.362 | 0.917 | 0.008 | 38.9 | 51.8 | 0.14 |
| 2007 | y = 1.0046x − 3.8315 | 0.815 | 0.007 | 35.3 | 45.2 | 0.13 |
| 2008 | y = 1.0347x − 23.968 | 0.803 | 0.006 | 35.5 | 44.5 | 0.12 |
| 2009 | y = 0.9928x − 0.8811 | 0.896 | 0.006 | 35.8 | 44.9 | 0.12 |
| 2010 | y = 1.0092x − 4.5111 | 0.842 | 0.007 | 33.6 | 43.8 | 0.11 |
| 2011 | y = 0.9869x + 2.0913 | 0.857 | 0.005 | 34.3 | 44.4 | 0.12 |
| 2012 | y = 0.9757x + 4.4076 | 0.913 | 0.005 | 33.4 | 41.5 | 0.11 |
| 2013 | y = 0.8937x + 1.5209 | 0.824 | 0.007 | 32.1 | 40.3 | 0.11 |
| 2014 | y = 0.9935x − 5.2277 | 0.836 | 0.009 | 34.1 | 43.2 | 0.12 |
| 2015 | y = 1.0509x − 4.4948 | 0.807 | 0.008 | 35.2 | 46.2 | 0.12 |
| 2016 | y = 1.0174x − 4.0790 | 0.876 | 0.008 | 38.4 | 53.8 | 0.14 |
Publisher’s Note: MDPI stays neutral with regard to jurisdictional claims in published maps and institutional affiliations. |
© 2022 by the authors. Licensee MDPI, Basel, Switzerland. This article is an open access article distributed under the terms and conditions of the Creative Commons Attribution (CC BY) license (https://creativecommons.org/licenses/by/4.0/).
Share and Cite
Li, S.; Zhang, R.; Xie, L.; Zhan, J.; Song, Y.; Zhan, R.; Shama, A.; Wang, T. A Factor Analysis Backpropagation Neural Network Model for Vegetation Net Primary Productivity Time Series Estimation in Western Sichuan. Remote Sens. 2022, 14, 3961. https://doi.org/10.3390/rs14163961
Li S, Zhang R, Xie L, Zhan J, Song Y, Zhan R, Shama A, Wang T. A Factor Analysis Backpropagation Neural Network Model for Vegetation Net Primary Productivity Time Series Estimation in Western Sichuan. Remote Sensing. 2022; 14(16):3961. https://doi.org/10.3390/rs14163961
Chicago/Turabian StyleLi, Song, Rui Zhang, Lingxiao Xie, Junyu Zhan, Yunfan Song, Runqing Zhan, Age Shama, and Ting Wang. 2022. "A Factor Analysis Backpropagation Neural Network Model for Vegetation Net Primary Productivity Time Series Estimation in Western Sichuan" Remote Sensing 14, no. 16: 3961. https://doi.org/10.3390/rs14163961
APA StyleLi, S., Zhang, R., Xie, L., Zhan, J., Song, Y., Zhan, R., Shama, A., & Wang, T. (2022). A Factor Analysis Backpropagation Neural Network Model for Vegetation Net Primary Productivity Time Series Estimation in Western Sichuan. Remote Sensing, 14(16), 3961. https://doi.org/10.3390/rs14163961


