
Analysis of Spatial–Temporal Variations and Driving Factors of Typical Tail-Reach Wetlands in the Ili-Balkhash Basin, Central Asia

 , , and
Abstract
:1. Introduction
2. Data and Methods
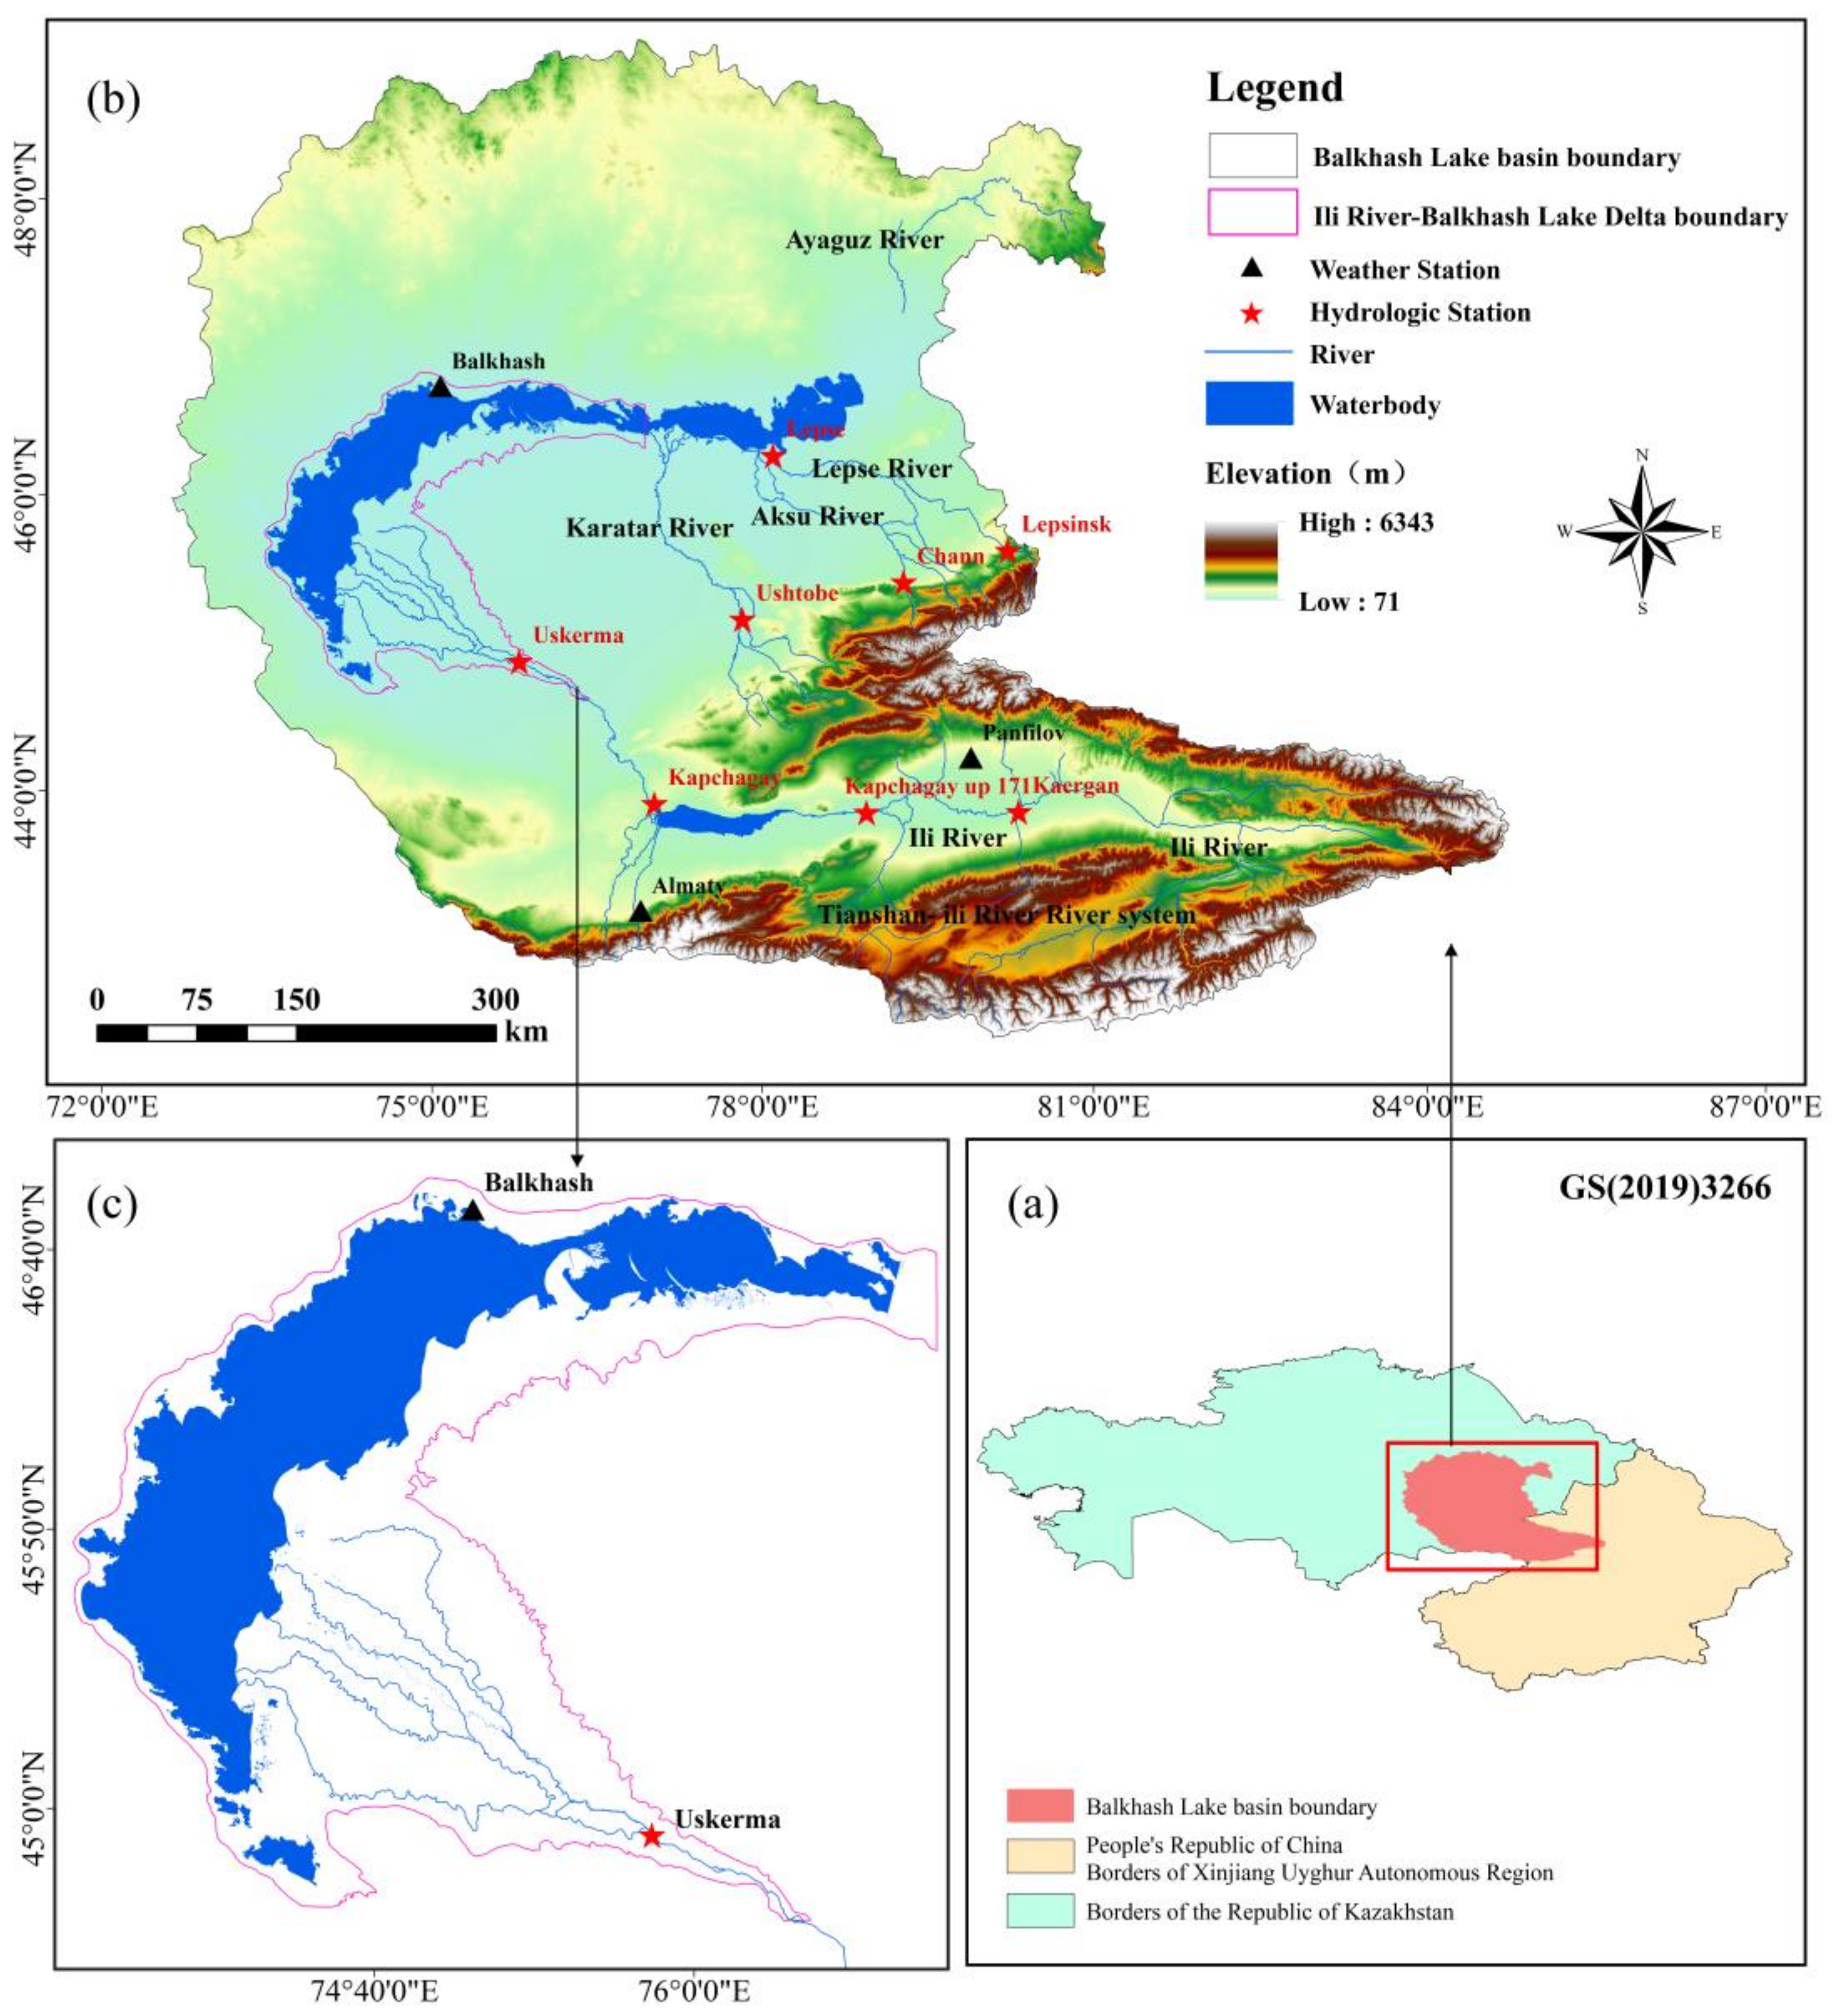
2.1. Study Area
2.2. Datasets
2.3. Methodology
2.3.1. Methods of Wetland Mapping and Accuracy Evaluation
2.3.2. Analysis of Spatiotemporal Variation in Wetlands
2.3.3. Analysis of Driving Factors of Wetland Changes
3. Results
3.1. Temporal and Spatial Variation in Wetlands in the IRD
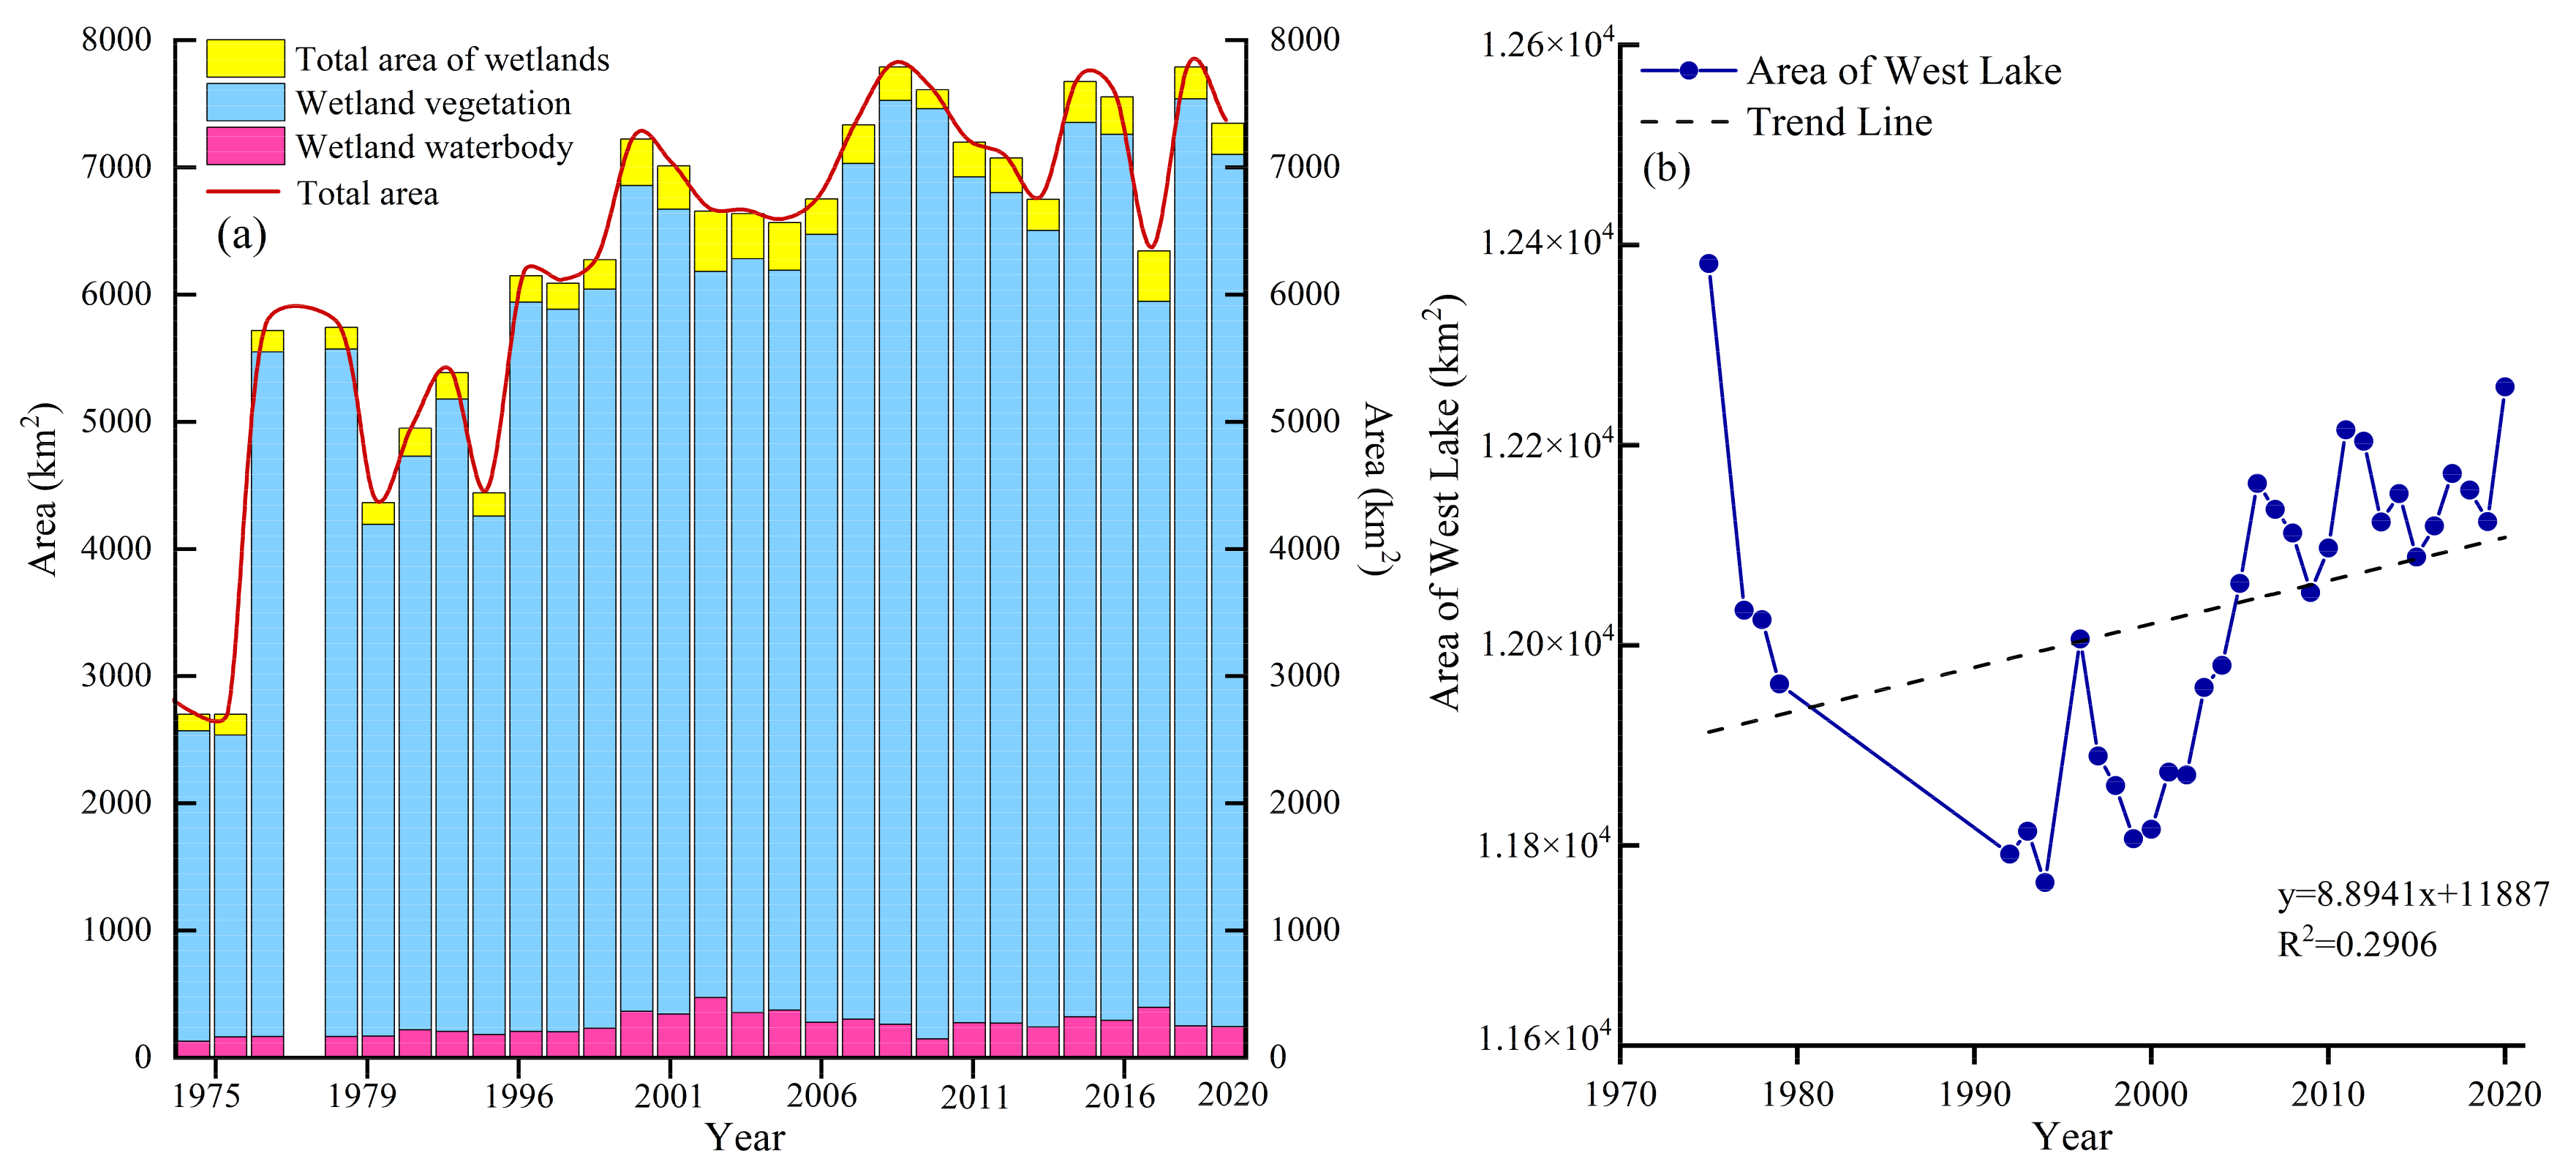
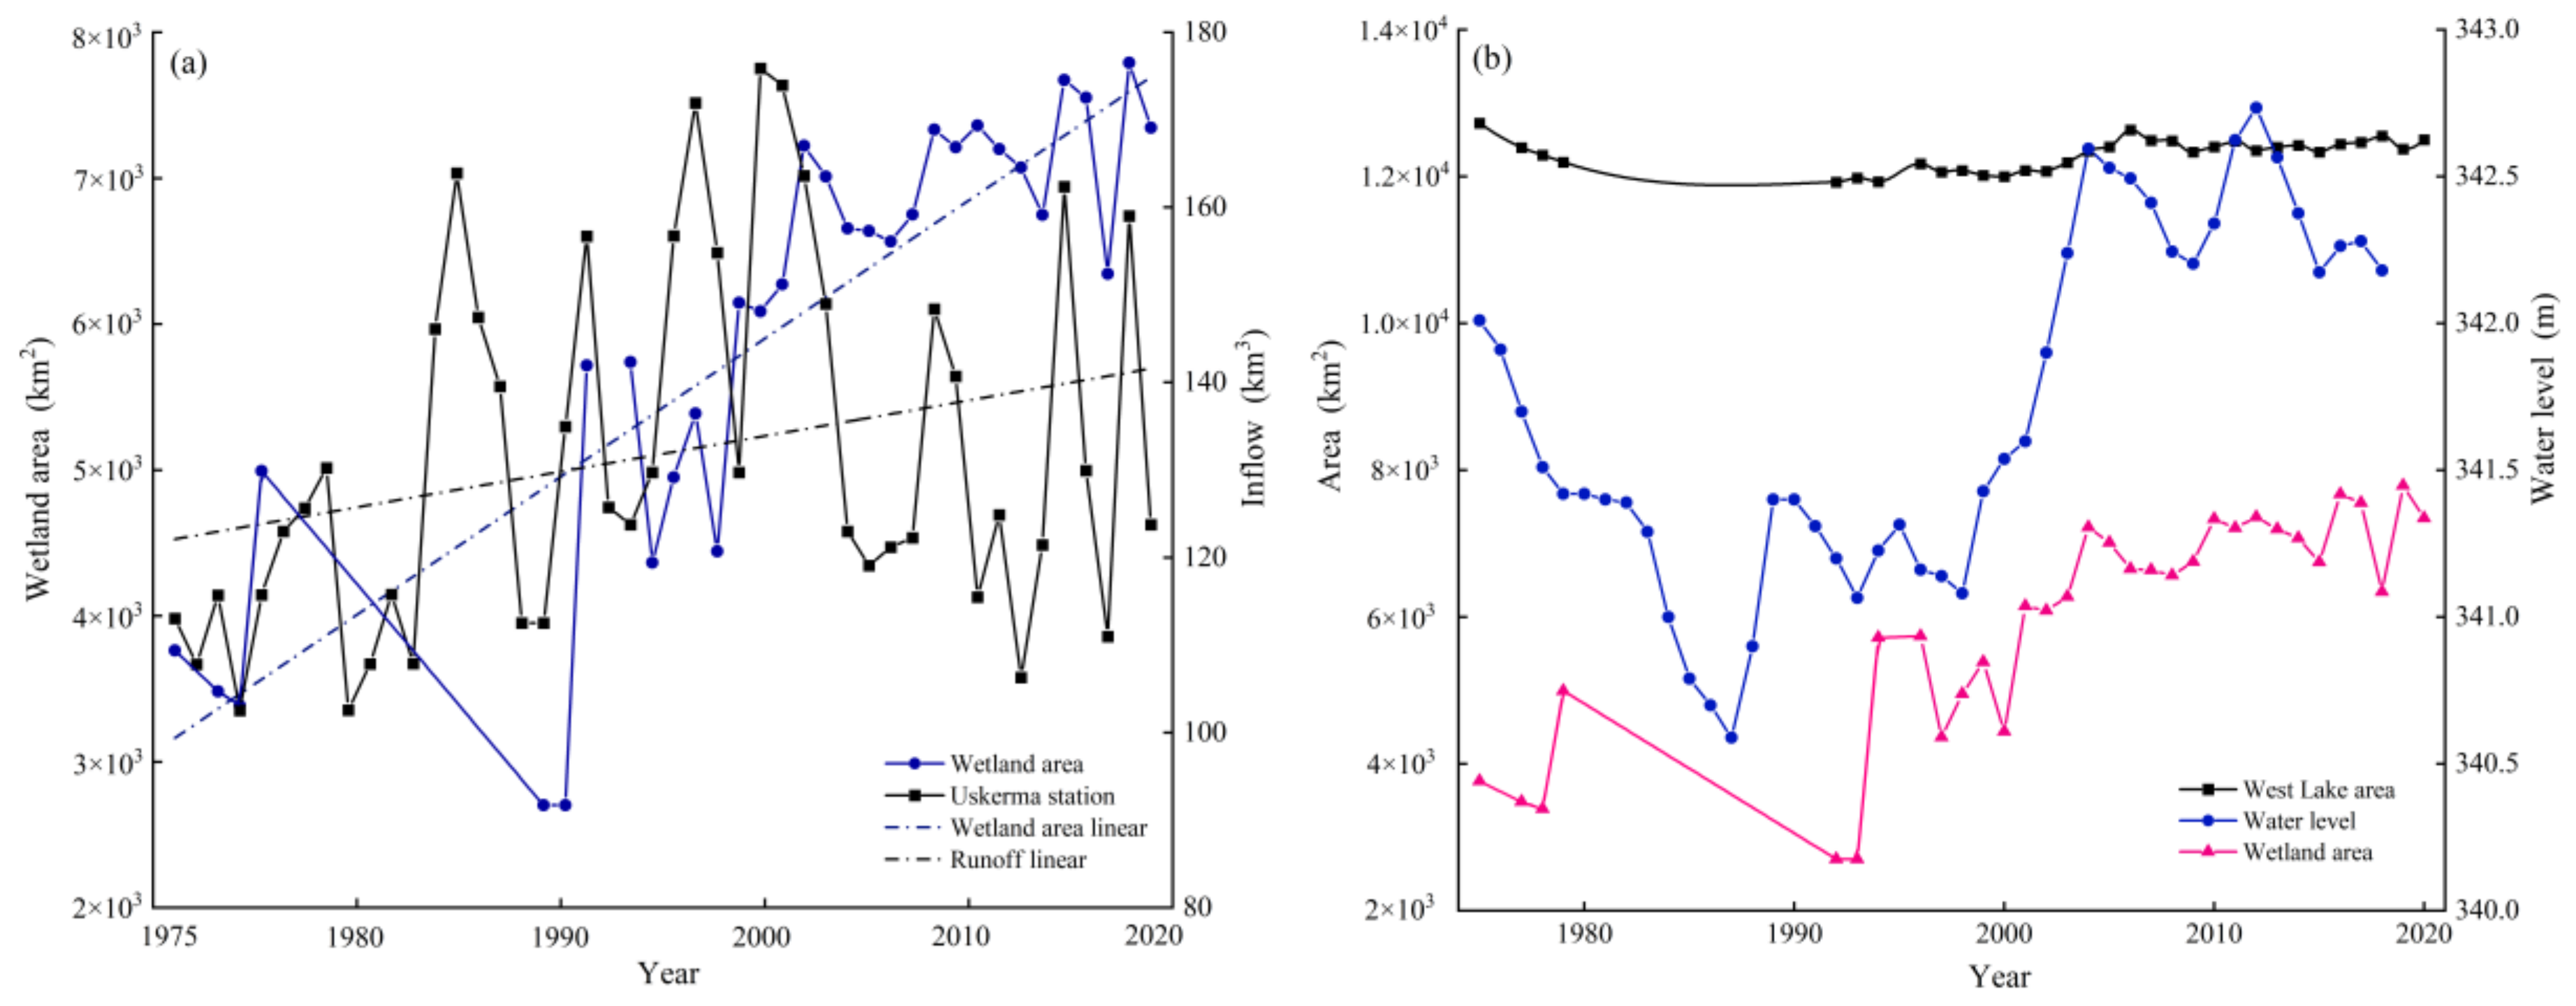
3.1.1. Wetland Area Change
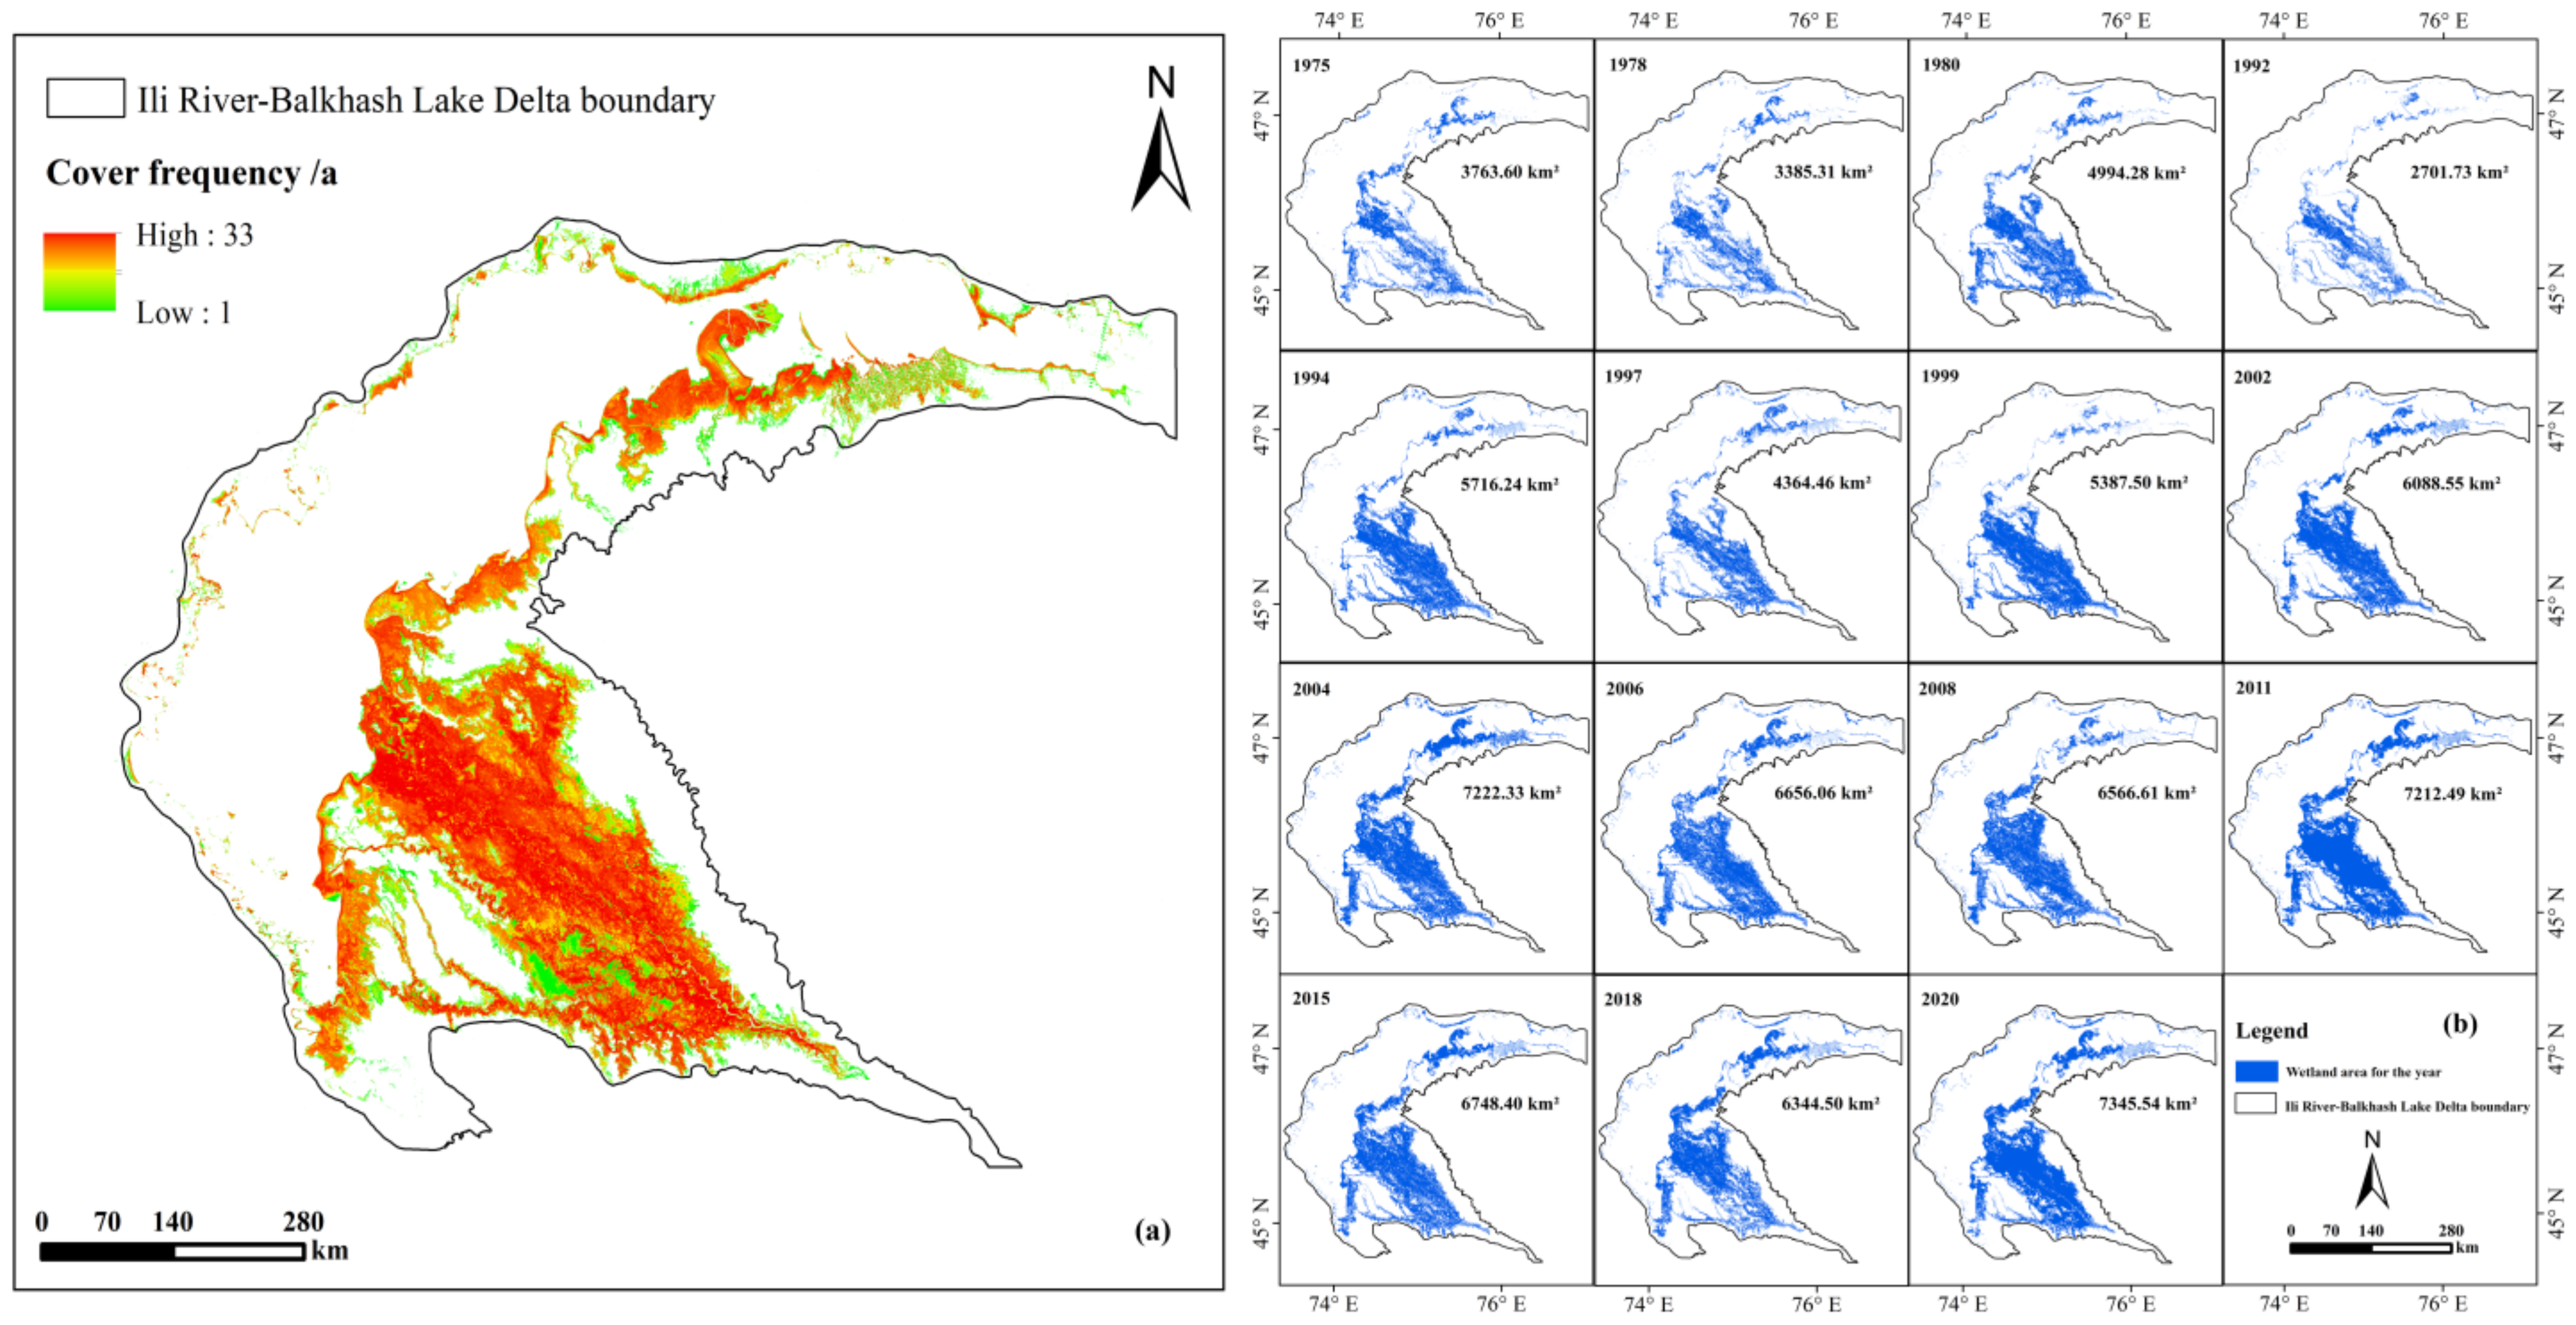
3.1.2. Spatial Variation in Wetlands
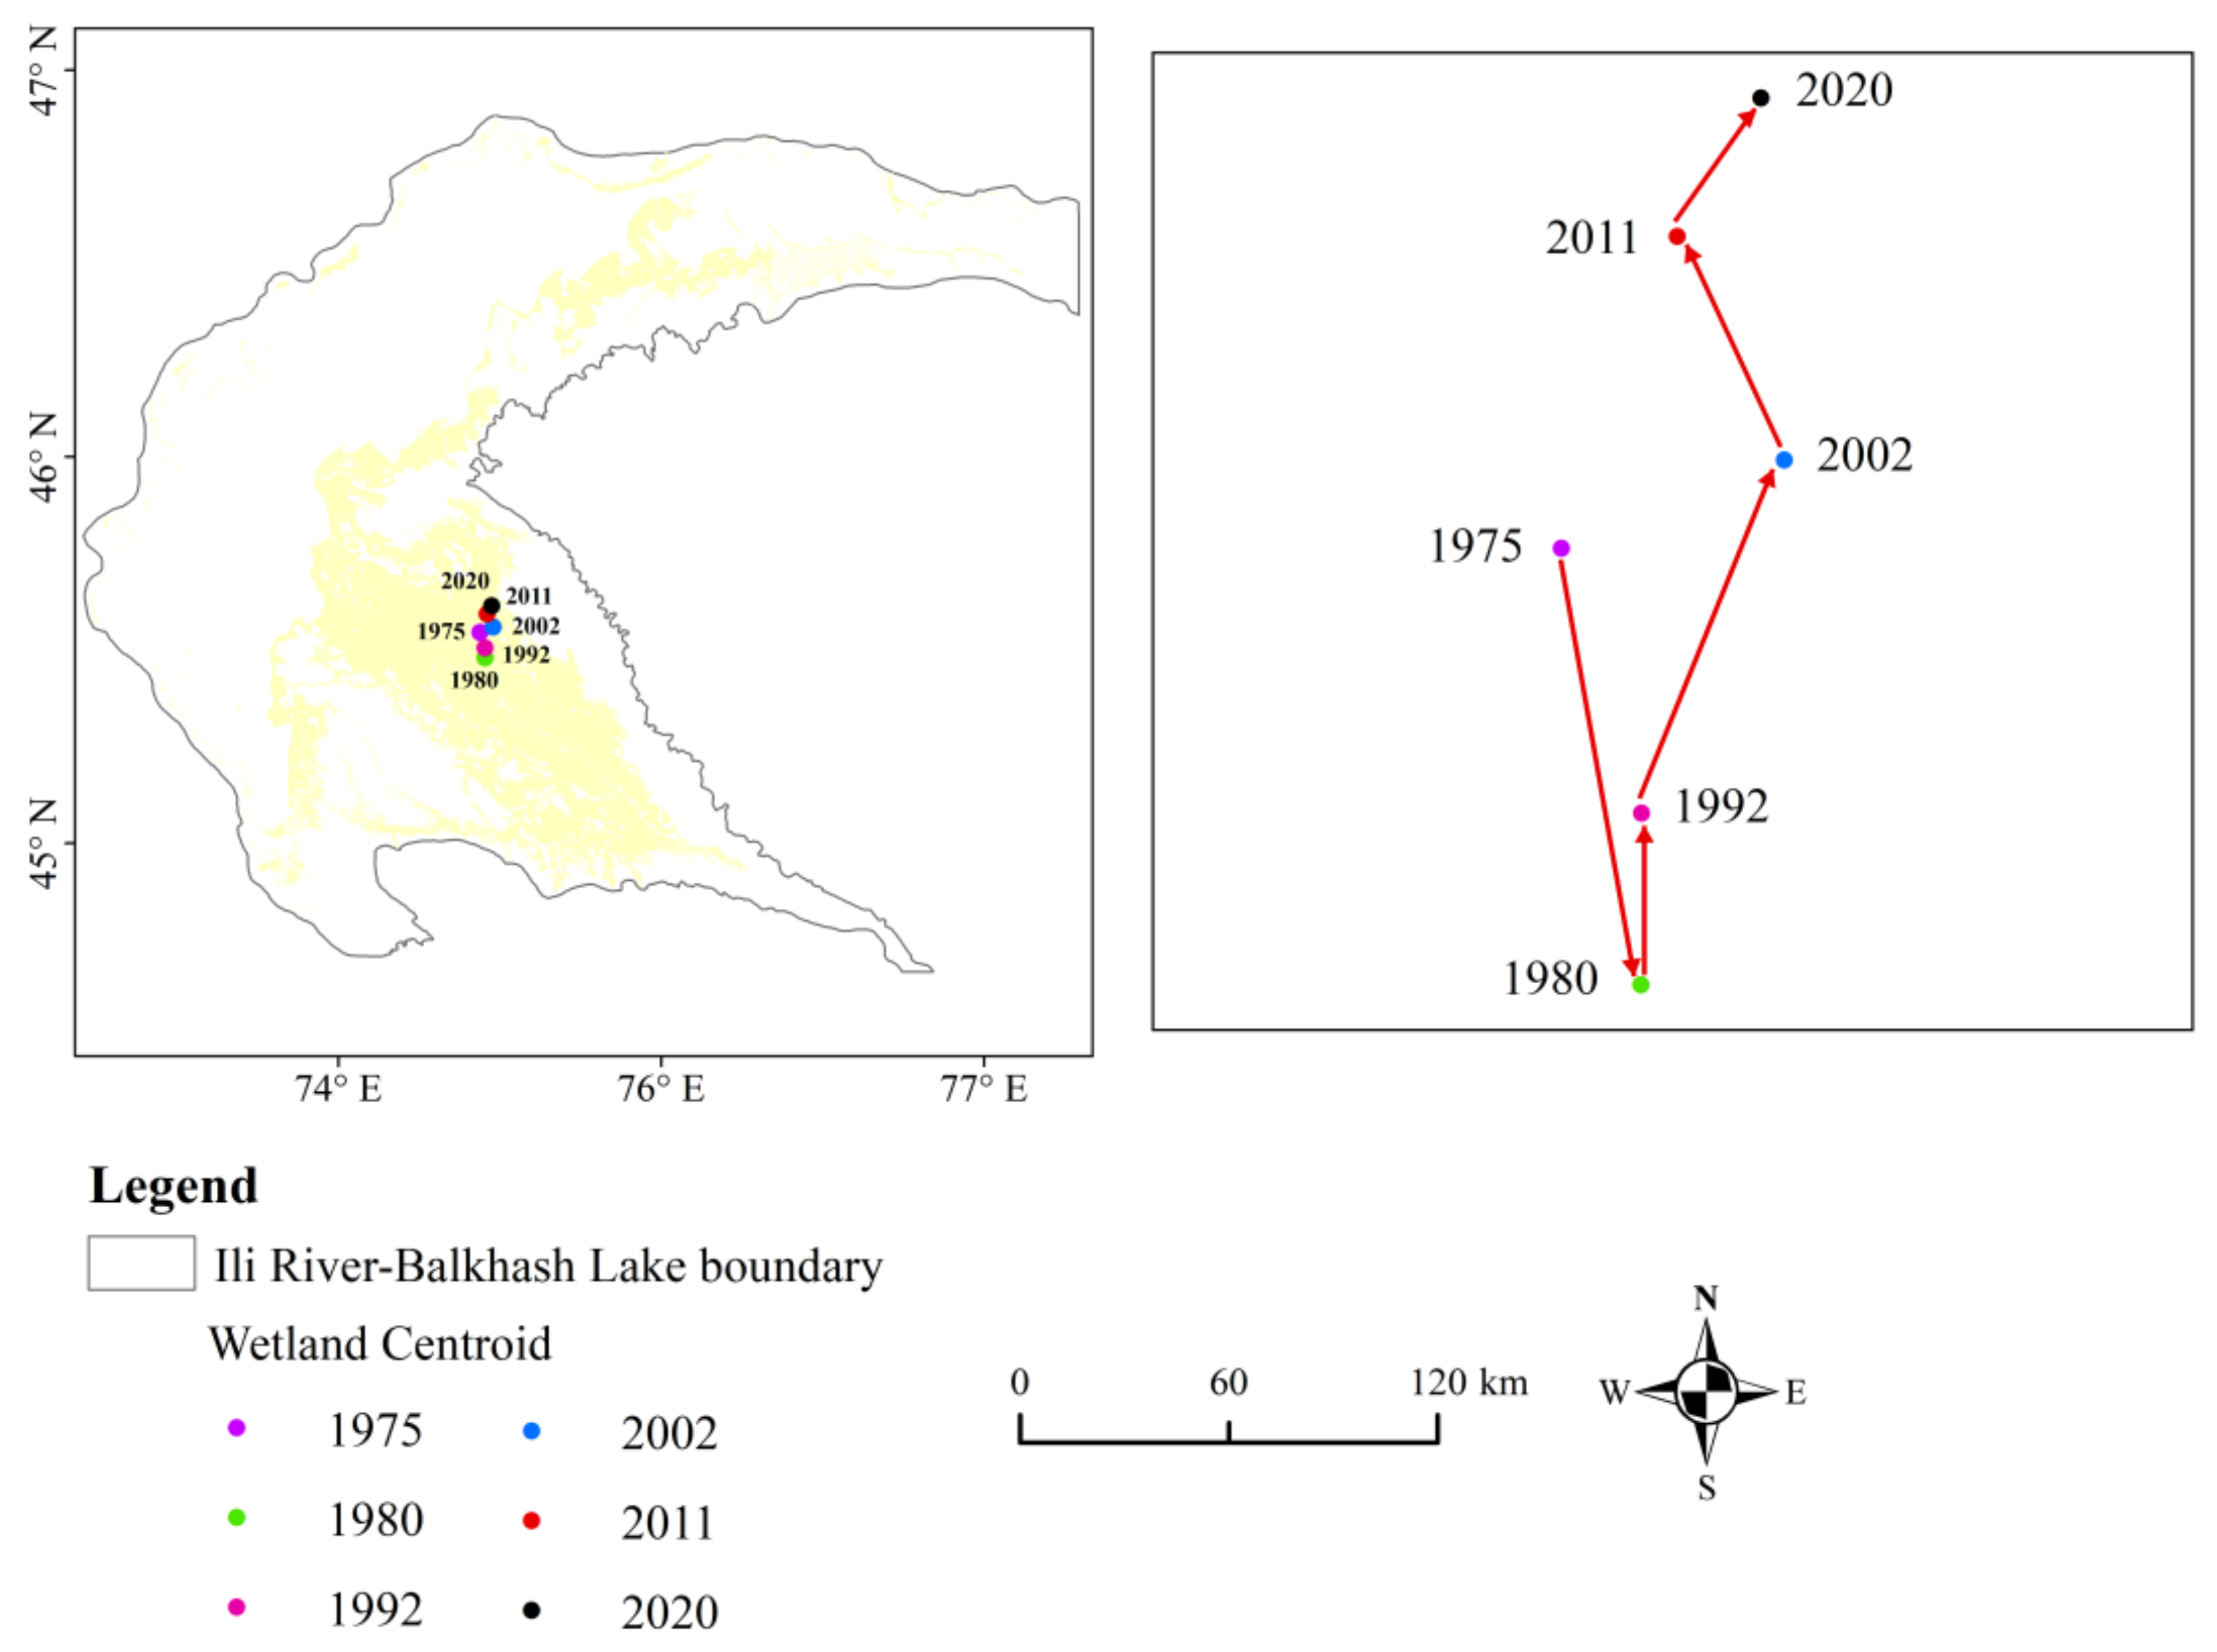
3.1.3. Change in Wetland Centroid
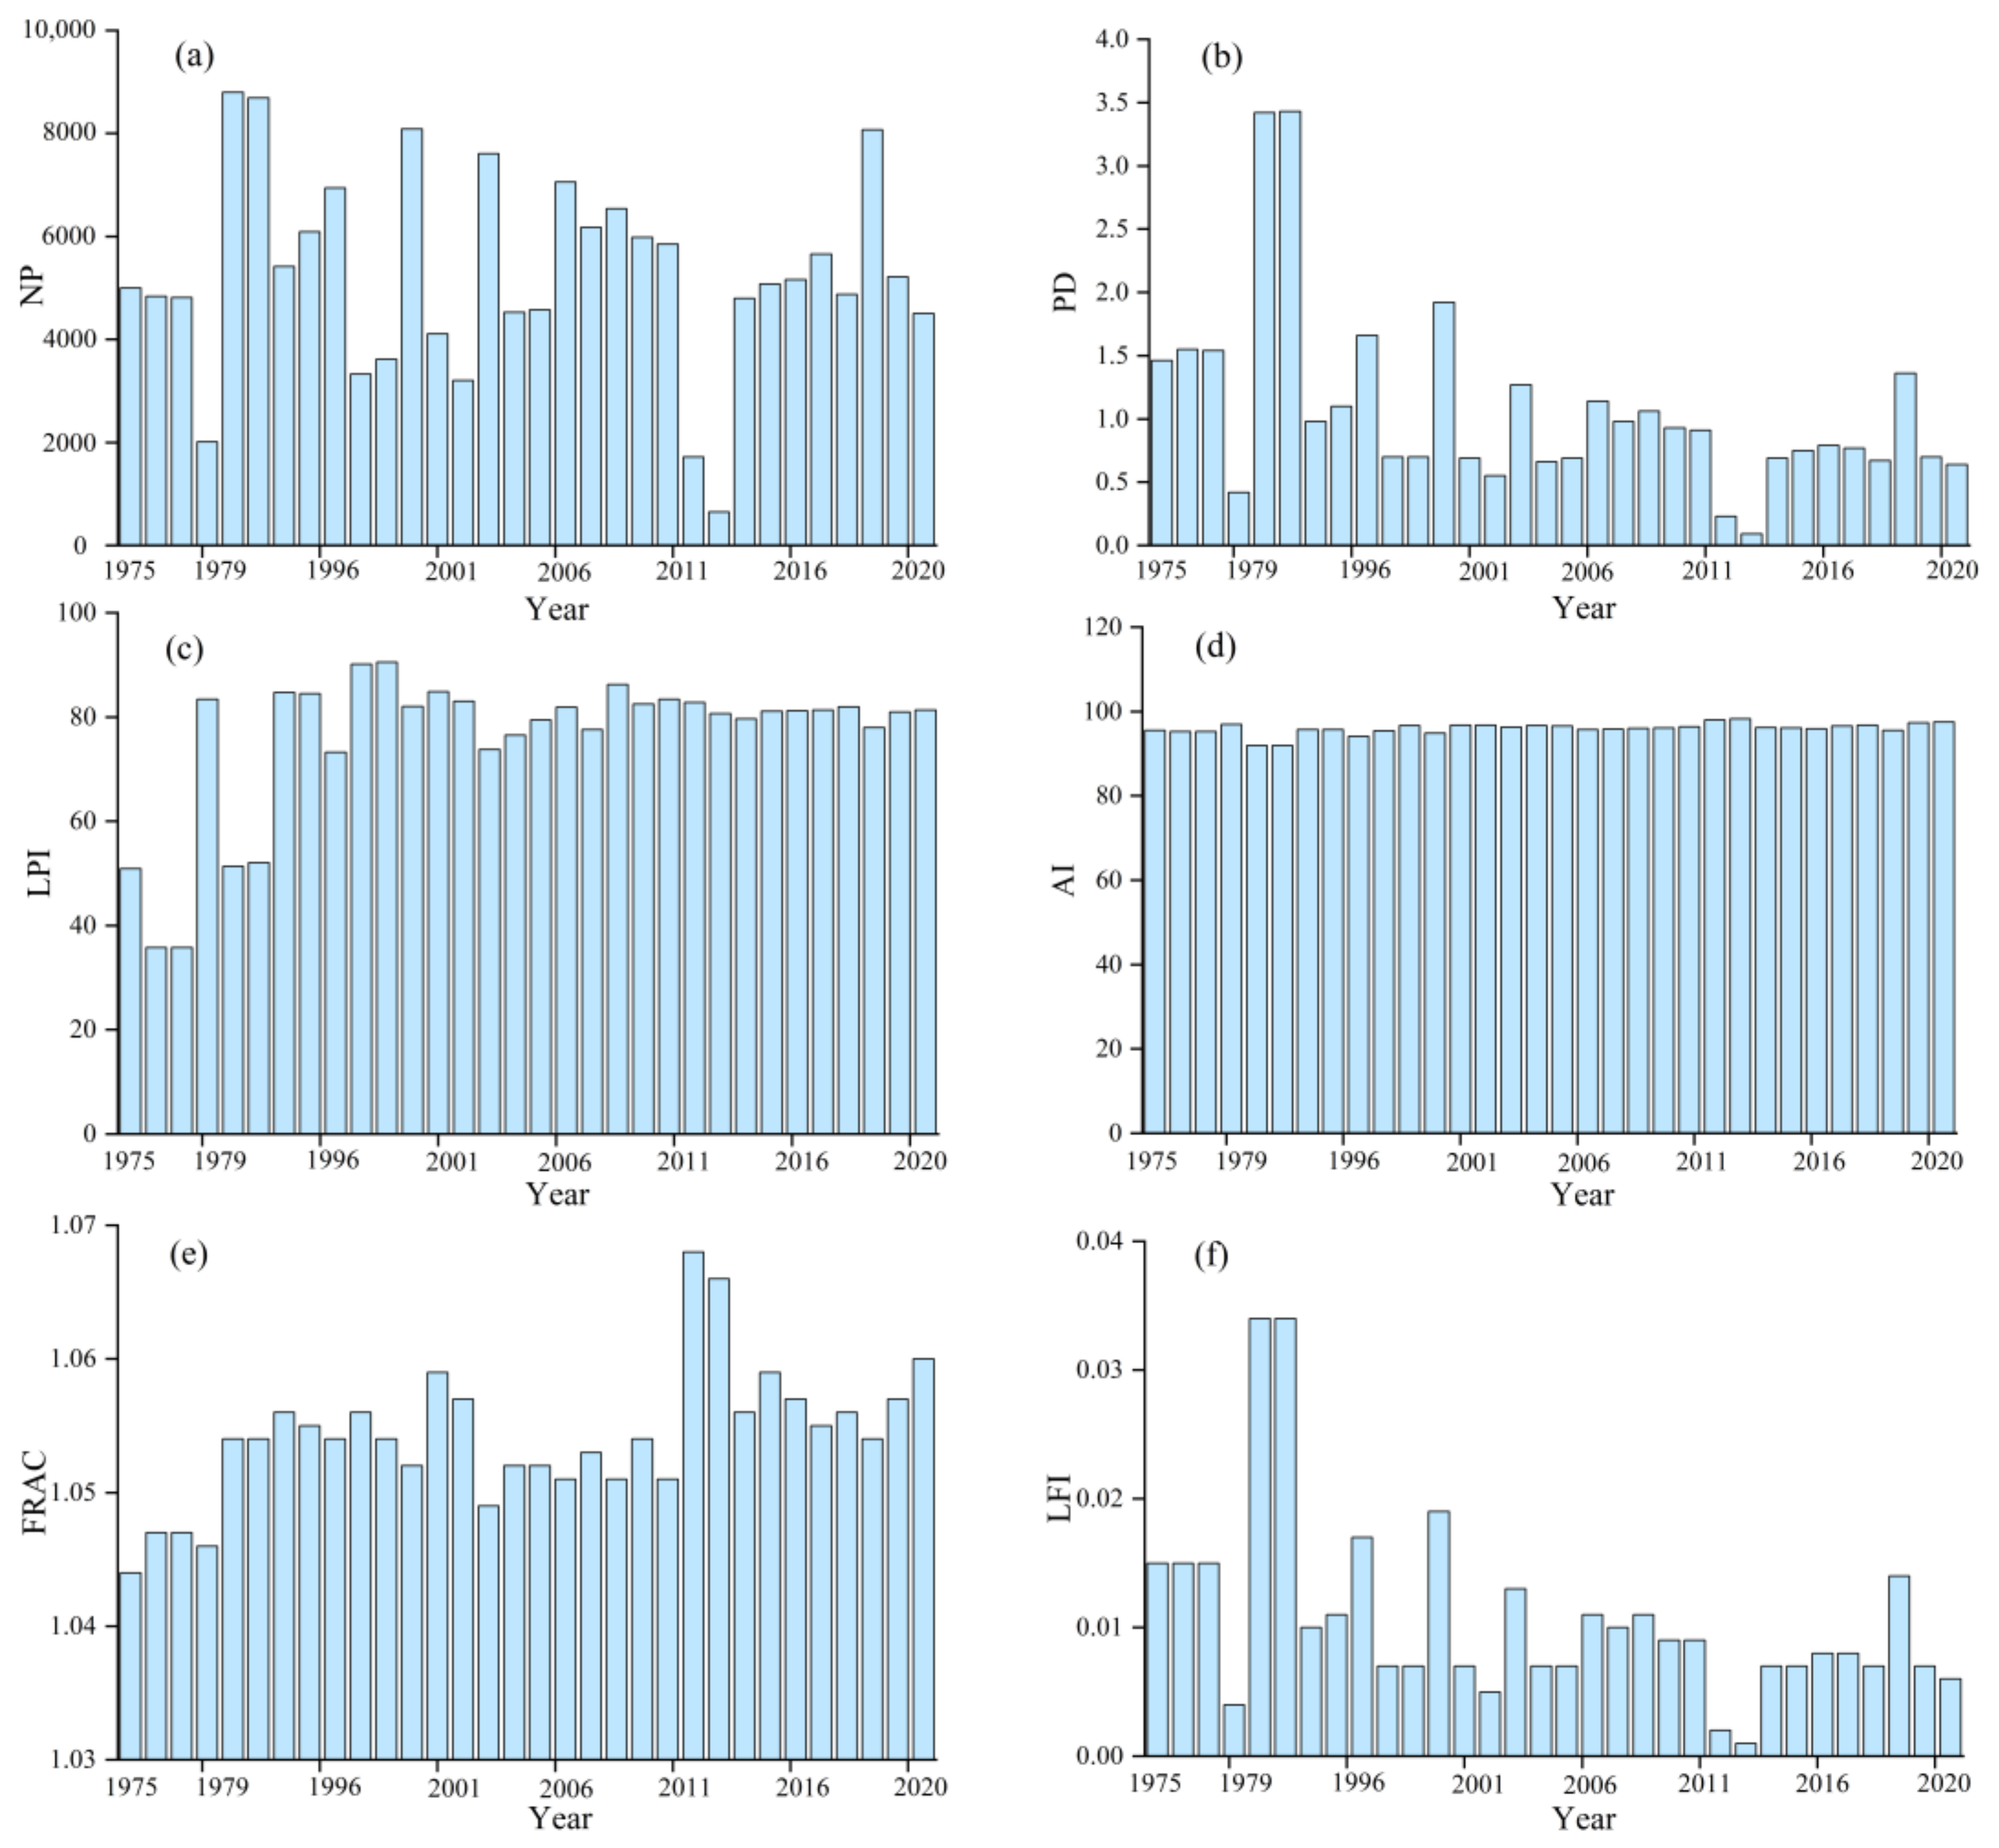
3.1.4. Change in Wetland Landscape Pattern
3.2. Changes of Ecological Function in Wetland Vegetation
3.2.1. Variation in NDVI
3.2.2. Variation in the NPP in the IRD
3.3. Analysis of the Impacts of the Main Driving Factors on Wetland Evolution within the IRD
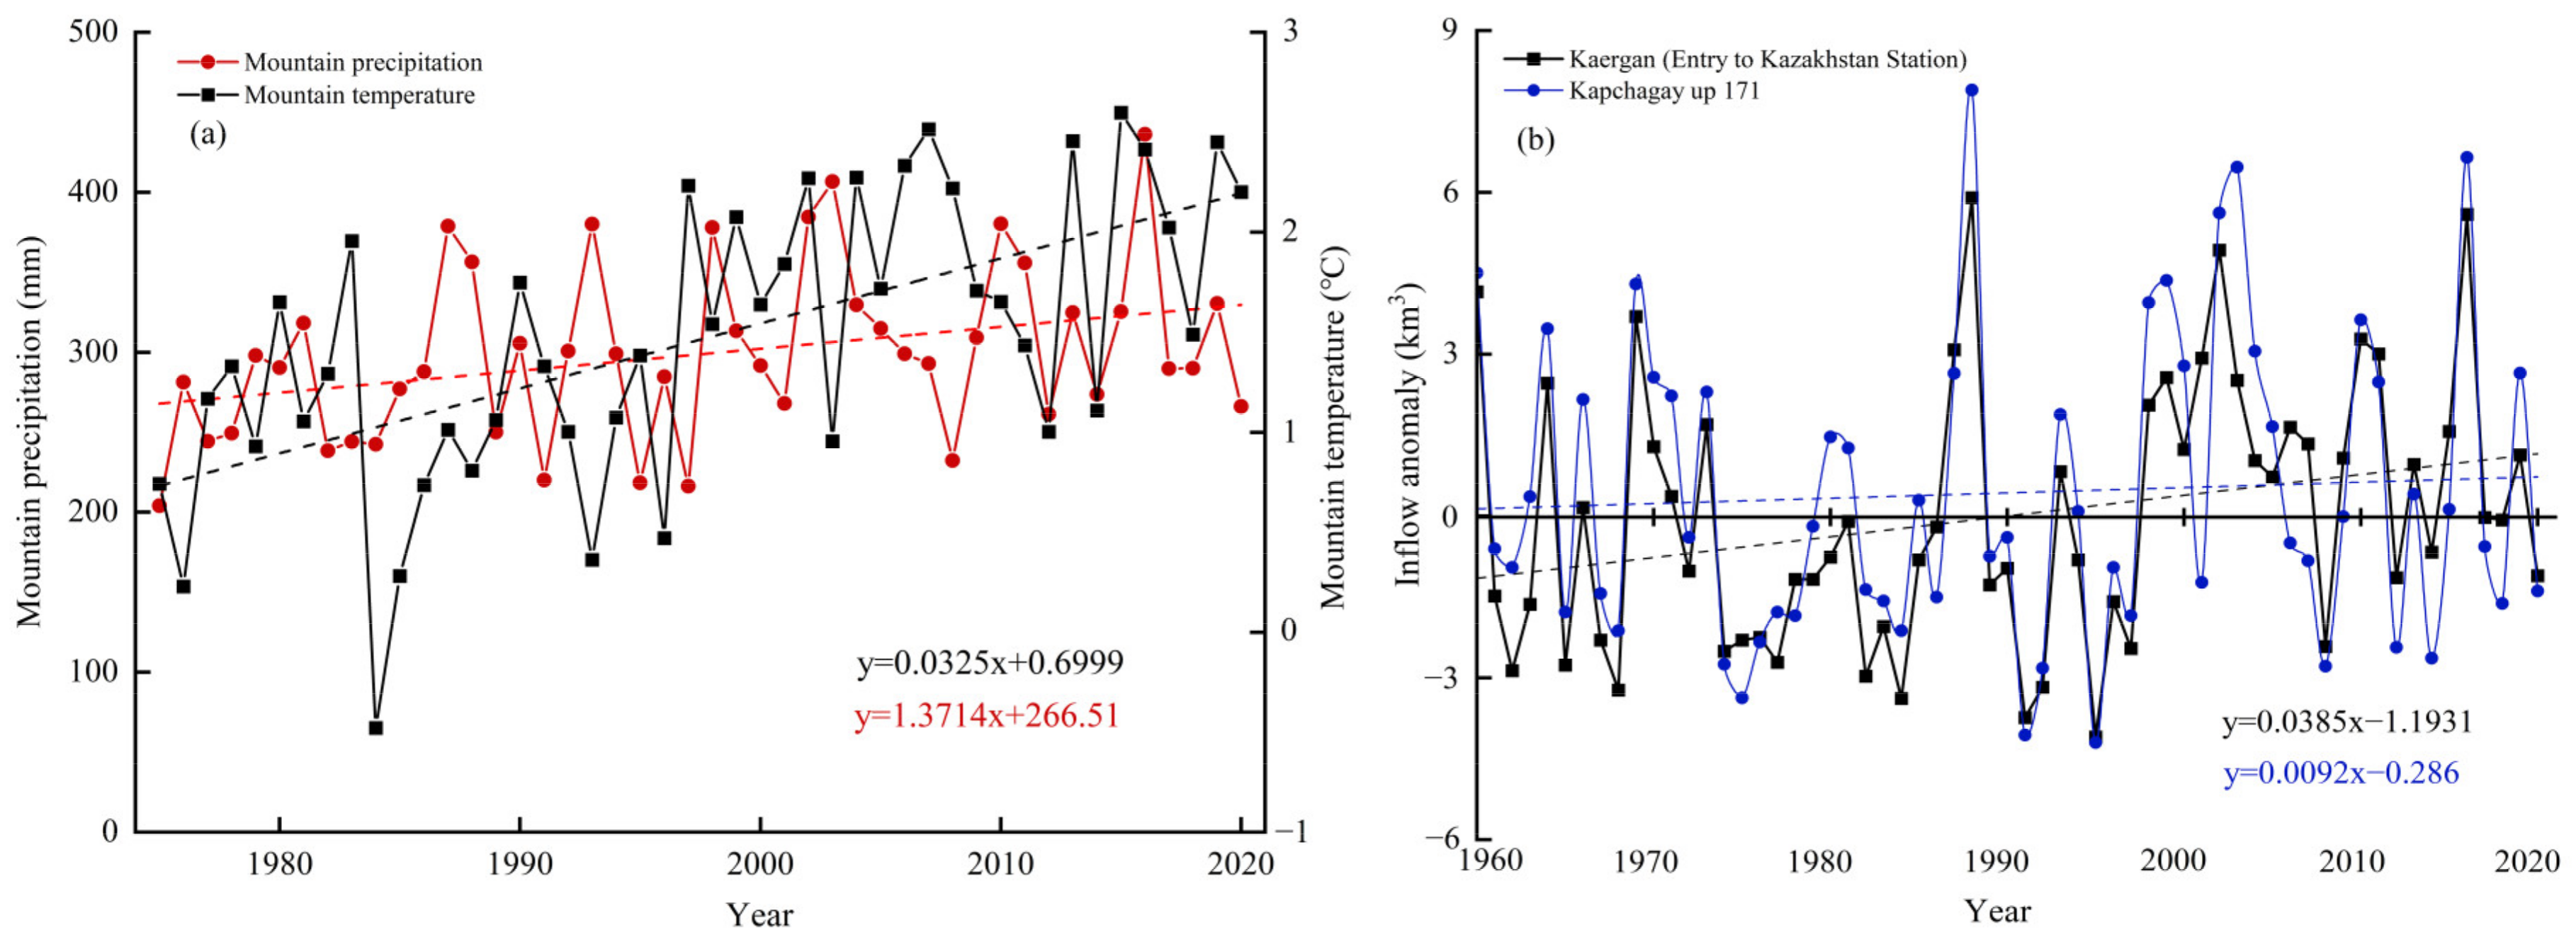
3.3.1. Changes of Main Climate Factors
3.3.2. River Runoff and Lake Hydrology
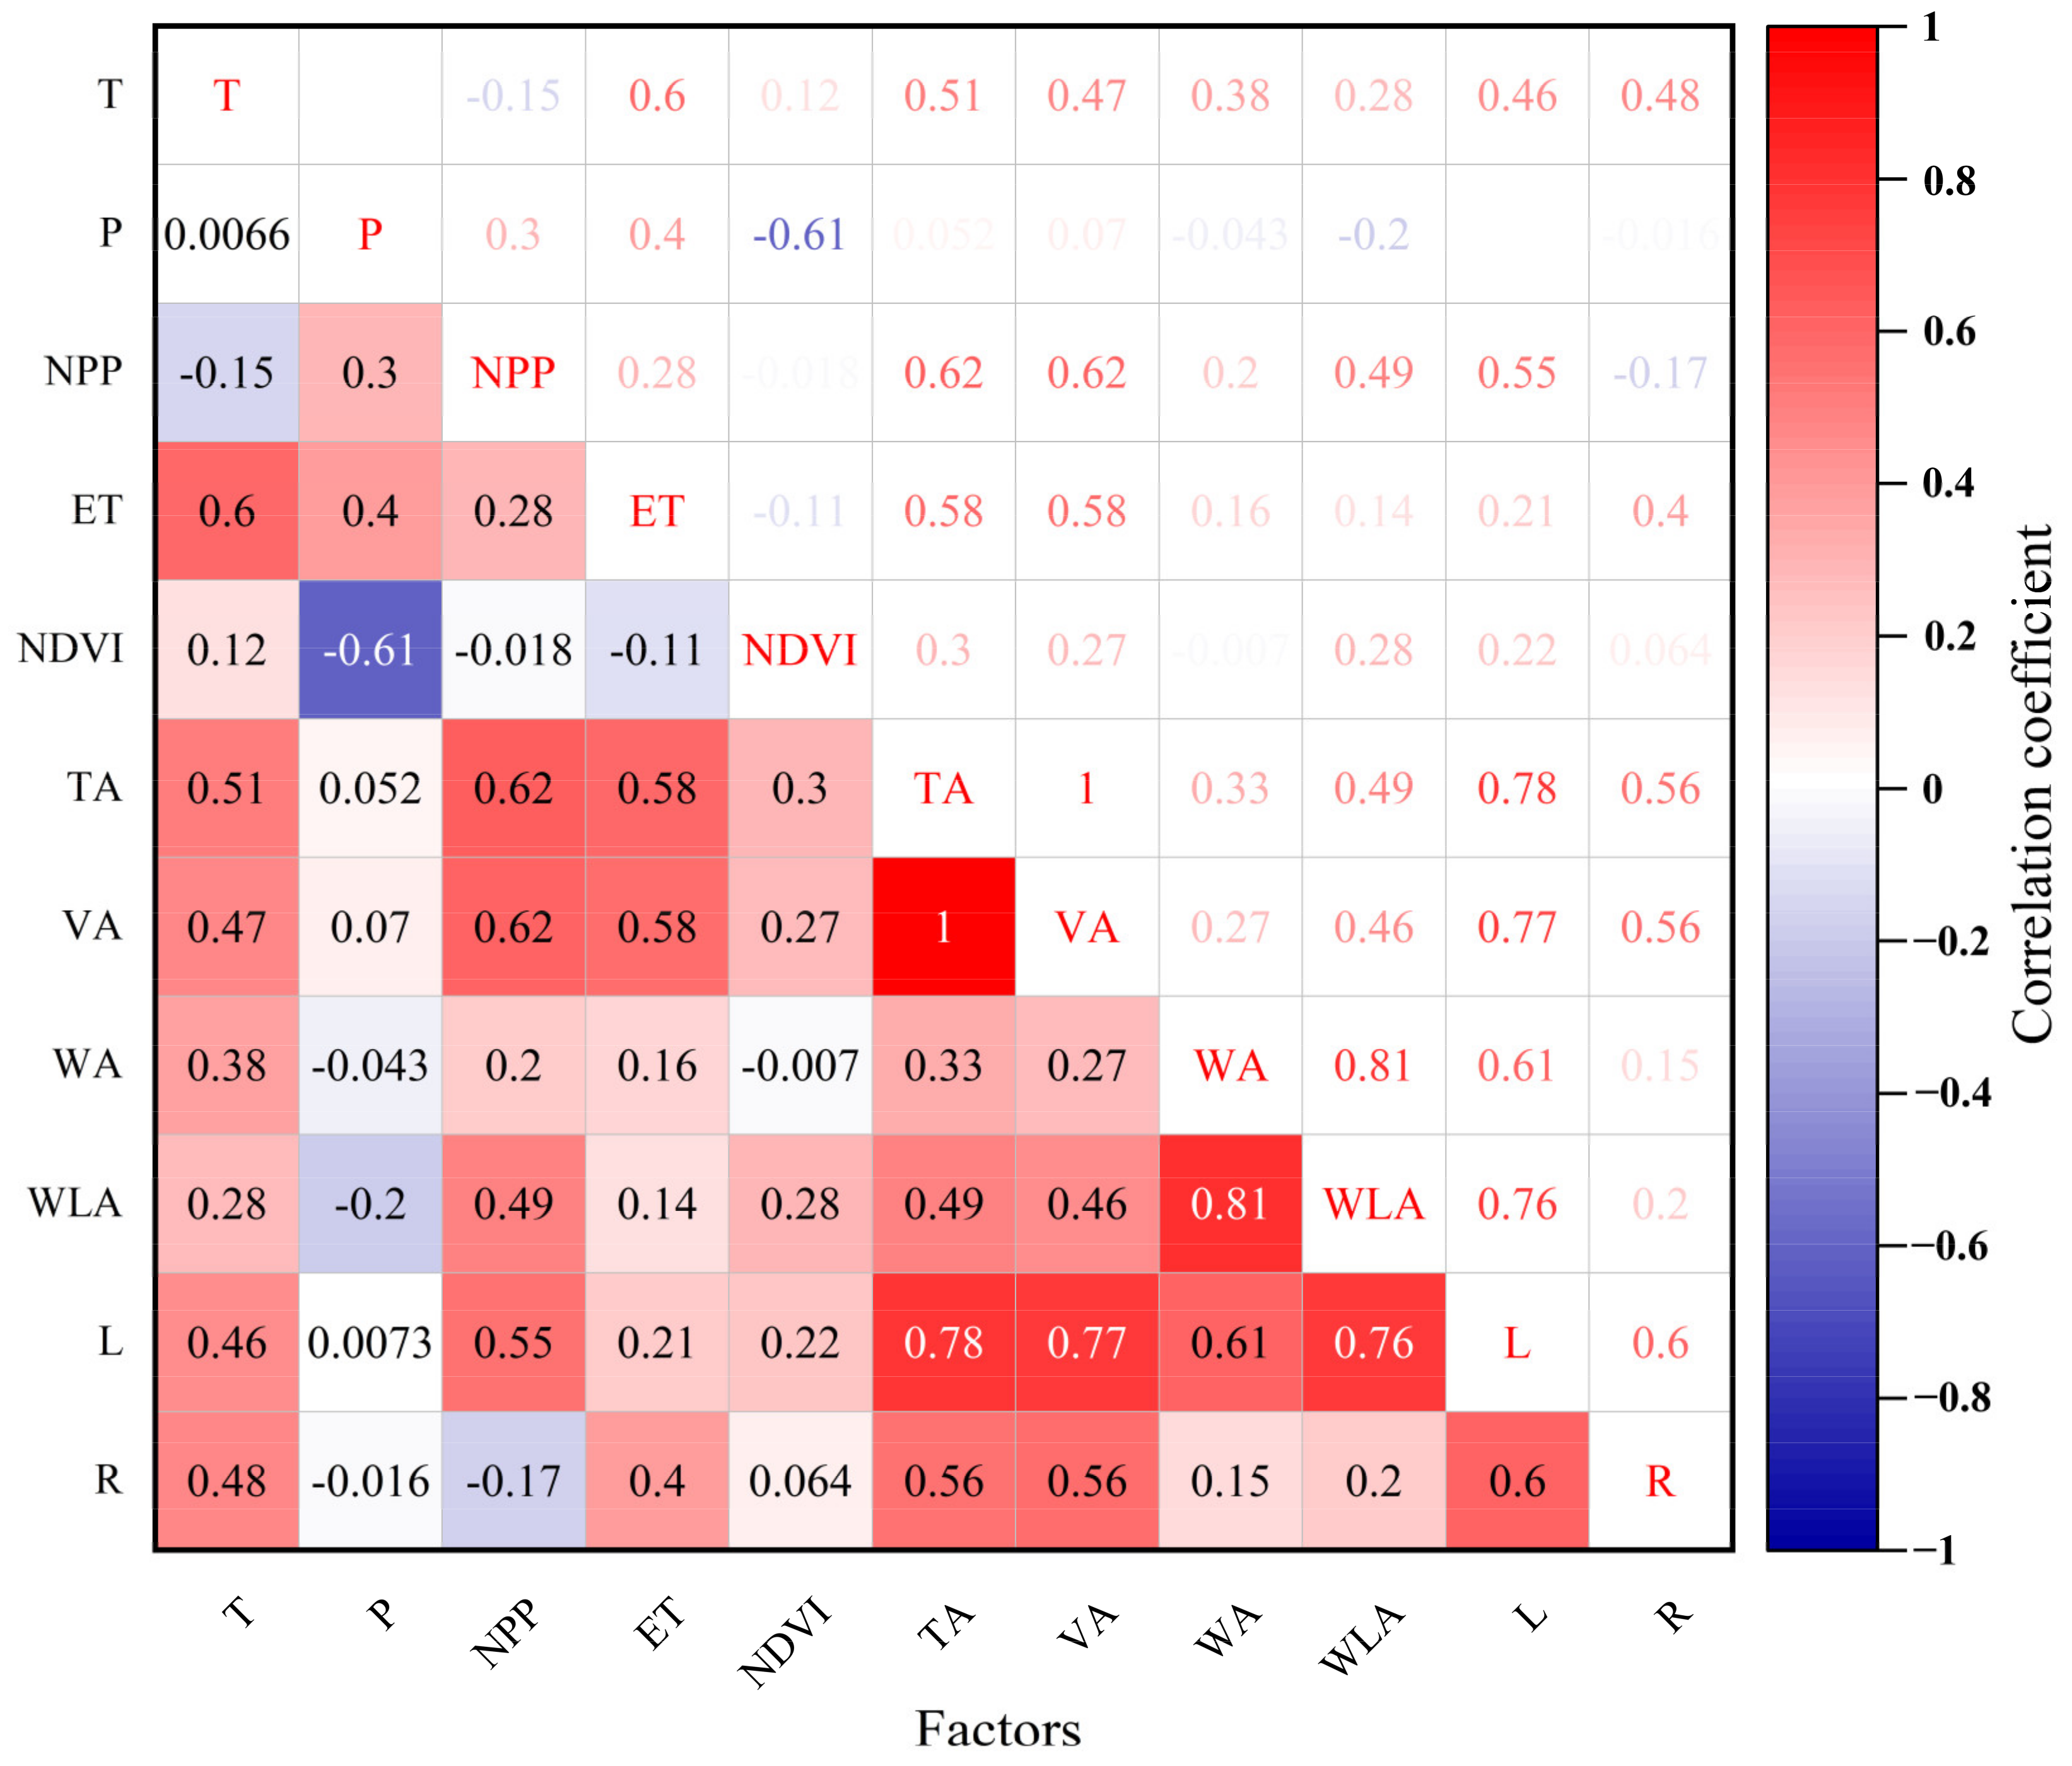
3.3.3. Correlation Coefficients among Multiple Factors
4. Discussion
5. Conclusions
Author Contributions
Funding
Data Availability Statement
Acknowledgments
Conflicts of Interest
References
- Jie, W.H.; Zhag, C.; Wang, B.; Zhang, N.; Niu, H.W.; Li, J.Y.; Dong, S.F. Remote sensing dynamic monitoring and ecological environmental changes of Bashang Plateau wetland from 2000 to 2018. Miner. Explor. 2020, 11, 2720–2728. [Google Scholar]
- Hiraishi, T.; Krug, T.; Tanabe, K.; Srivastava, N.; Baasansuren, J.; Fukuda, M.; Troxler, T.G. 2013 Supplement to the 2006 Ipcc Guidelines for National Greenhouse Gas Inventories: Wetlands; IPCC: Geneva, Switzerland, 2014. [Google Scholar]
- Gao, Y.H.; Wang, H.L.; Zhou, X.; Zhou, C.Y.; Yang, M. Remote Sensing Monitoring and Analyses of the Dynamic Change of Balkhash Lake in the last 30 years. Environ. Sustain. Dev. 2016, 41, 102–106. [Google Scholar]
- Yang, C.D. Changes in the water level of Lake Balkhash and its causes. Arid Land Geogr. 1993, 16, 36–42. [Google Scholar]
- Deng, M.J.; Wang, Z.J.; Wang, J.Y. Analysis of Balkhash Lake ecological water level evolvement and its regulation strategy. J. Hydraul. Eng. 2011, 42, 403–413. [Google Scholar]
- Zang, J.J.; Li, G.Z.; Song, K.S.; Jin, X.L.; Ma, J.H.; Li, B.N. Change of water area of lake Balkhash during 1975–2014. Wetl. Sci. 2016, 14, 368–375. [Google Scholar]
- Kezer, K.; Matsuyama, H. Decrease of river runoff in the Lake Balkhash basin in Central Asia. Hydrol. Process. Int. J. 2006, 20, 1407–1423. [Google Scholar] [CrossRef]
- Long, A.H.; Deng, M.J.; Xie, L.; Wang, J.Y.; Li, X.Q. A Study of the Water Balance of Lake Balkhash. J. Glaciol. Geocryol. 2011, 33, 1341–1352. [Google Scholar]
- Nakayama, Y.; Tanaka, S.; Sugimura, T.; Endo, K. Analysis of hydrological changes in lakes of Asian arid zone by satellite data. Earth Surf. Remote Sens. SPIE 1997, 3222, 201–210. [Google Scholar]
- Kipshakbaev, N.K.; Abdrasilov, S.A. Effect of economic activity on the hydrologic regime an dynamics of the Ili delta. Hydrotech. Constr. 1995, 28, 5–8. [Google Scholar] [CrossRef]
- Xu, T.; Weng, B.S.; Yan, D.H.; Wang, K.; Li, X.N.; Bi, W.X.; Li, M.; Cheng, X.J.; Liu, Y.X. Wetlands of international importance: Status, threats, and future protection. Int. J. Environ. Res. Public Health 2019, 16, 1818. [Google Scholar] [CrossRef]
- Wang, C.; Ma, L.; Zhang, Y.; Chen, N.C.; Wang, W. Spatiotemporal dynamics of wetlands and their driving factors based on PLS-SEM: A case study in Wuhan. Sci. Total Environ. 2022, 806, 151310. [Google Scholar] [CrossRef]
- Munyati, C. Wetland change detection on the Kafue Flats, Zambia, by classification of a multitemporal remote sensing image dataset. Int. J. Remote Sens. 2000, 21, 1787–1806. [Google Scholar] [CrossRef]
- Gxokwe, S.; Dube, T.; Mazvimavi, D. Multispectral Remote Sensing of Wetlands in Semi-Arid and Arid Areas: A Review on Applications, Challenges and Possible Future Research Directions. Remote Sens. 2020, 12, 4190. [Google Scholar] [CrossRef]
- Dronova, I. Object-Based Image Analysis in Wetland Research: A Review. Remote Sens. 2015, 7, 6380–6413. [Google Scholar] [CrossRef]
- Liu, X.Z.; Bu, R.C.; Chang, Y.; Hu, Y.M.; Wen, Q.C.; Wang, X.G.; Xu, C.G.; Li, Y.H.; He, H.S. The response of landscape metrics against pattern scenarios. Acta Ecol. Sin. 2004, 24, 123–134. [Google Scholar]
- Wang, X.F.; Yan, Y.; Li, Y.H.; Zhang, X.; Fu, X.X. Wetland landscape evolution and its driving factors in Yinchuan. Arid Zone Res. 2021, 38, 855–866. [Google Scholar]
- Luo, G.P.; Wang, Y.G.; Zhu, L.; Chen, Y.L. Influence mechanism of landscape structure in Ili River Delta. Arid Land Geogr. 2012, 35, 897–908. [Google Scholar]
- Wang, J.Y.; Long, A.H.; Deng, M.J.; Li, X.Q.; Xie, L. Water Balances of East and West Lakes Balkhash and Their Optimization Management. J. Glaciol. Geocryol. 2011, 33, 1353–1362. [Google Scholar]
- Xie, L.; Long, A.H.; Deng, M.J.; Li, X.Q.; Wang, J.Y. Study on Ecological Water Consumption in Delta of the Lower Reaches of Ili River. J. Glaciol. Geocryol. 2011, 33, 1330–1340. [Google Scholar]
- Wang, J.Y.; Lu, Y.J. Hydrological and ecological impacts of water resources development in the Ili River Basin. J. Nat. Resour. 2009, 24, 1299–1310. [Google Scholar]
- Zhou, W.J.; Xia, Z.Q.; Huang, F.; Chen, Q.C.; Zhao, P. Variation characteristics of precipitation and its annual distribution in Balkhash Lake basin. Water Resour. Power 2013, 31, 10–13. [Google Scholar]
- Guo, L.D.; Xia, Z.Q. Temperature and precipitation long-term trends and variations in the Ili-Balkhash Basin. Theor. Appl. Climatol. 2014, 115, 219–229. [Google Scholar] [CrossRef]
- Zheng, Q.H.; Luo, G.P.; Zhu, L.; Zhou, D.C. Prediction of landscape patterns in Ili River Delta based on CAMarkov Model. Chin. J. Appl. Ecol. 2010, 21, 873–882. [Google Scholar]
- Fu, Y.X.; Yang, S. Commentary on the Development of Kazakhstan Ili-Balkhash Basin During the Soviet Period. J. Lanzhou Univ. Soc. Sci. 2009, 37, 16–24. [Google Scholar]
- Xiao, T.T.; Xia, Z.Q.; Guo, L.D.; Wang, Z.J.; Hu, K.J. Temperature characteristics in the Balkhash Lake Basin from 1936 to 2005. J. Hohai Univ. Nat. Sci. 2011, 39, 391–396. [Google Scholar]
- Peng, J.D.; Ma, Z.G.; Wu, Z.H. Simulation of land use change in oasis of arid areas based on Landsat images from 1990 to 2019. Straits Sci. 2022, 34, 198–209. [Google Scholar]
- Bu, X.; Zhang, Y.F.; Liang, T.T.; Wang, J.G. Analysis of Spatial-temporal Changes and Driving Forces of NDVI from 2001 to 2019 Based on MODIS Data: Taking Aksu as an Example. Chin Agric. Sci. Bull. 2022, 38, 75–83. [Google Scholar]
- Dostay, Z.; Alimkulov, S.; Tursunova, A.; Myrzakhmetov, A. Modern hydrological status estuary of Ili River. Arab. J. Geosci. 2013, 6, 3041–3047. [Google Scholar] [CrossRef]
- Panyushkina, I.P.; Meko, D.M.; Macklin, M.G.; Toonen, W.H.J.; Mukhamadiev, N.S.; Konovalov, V.G.; Ashikbaev, N.Z.; Sagitov, A.O. Runoff variations in Lake Balkhash Basin, Central Asia, 1779–2015, inferred from tree rings. Clim. Dyn. 2018, 51, 3161–3177. [Google Scholar] [CrossRef]
- Duan, W.L.; Zou, S.; Chen, Y.N.; Li, Z.; Fang, G.H. Analysis of Water Level Changes in Lake Balkhash and Its Main Influencing Factors during 1879–2015. Adv. Earth Sci. 2021, 36, 950. [Google Scholar]
- Zhu, C.M.; Li, J.L.; Zhang, X.; Luo, C.J. Wetlands Information Automatic Extraction from High Resolution Remote Sensing Imagery Based on Object-oriented Technology. Bull. Surv. Mapp. 2014, 10, 23–28. [Google Scholar]
- Wang, J.Z.; Ding, J.L.; Li, G.N.; Liang, J.; Yu, D.L.; Aishan, T.; Zhang, F.; Yang, J.M.; Abulimiti, A.; Liu, J. Dynamic detection of water surface area of Ebinur Lake using multi-source satellite data (Landsat and Sentinel-1A) and its responses to changing environment. Catena 2019, 177, 189–201. [Google Scholar] [CrossRef]
- Yang, X.C.; Chen, Y.; Wang, J.Z. Combined use of Sentinel-2 and Landsat 8 to monitor water surface area dynamics using Google Earth Engine. Remote Sens. Lett. 2020, 11, 687–696. [Google Scholar] [CrossRef]
- Mcfeeters, S.K. The use of the Normalized Difference Water Index (NDWI) in the delineation of open water features. Int. J. Remote Sens. 1996, 17, 1425–1432. [Google Scholar] [CrossRef]
- Zan, C.J.; Liu, T.; Huang, Y.; Bao, A.M.; Yan, Y.Y.; Ling, Y.N.; Wang, Z.; Duan, Y.C. Spatial and temporal variation and driving factors of wetland in the Amu Darya River Delta, Central Asia. Ecol. Indic. 2022, 139, 108898. [Google Scholar] [CrossRef]
- Hu, M.; Sheng, Y.W. Study on Variation Characteristics of Precipitation and Water Resources in Qingdao. J. China Hydrol. 2022, 42, 103–108+128. [Google Scholar]
- Ma, Y.G.; Huang, Y. Interannual and seasonal trend analysis of vegetation condition in Xinjiang based on 1982–2013 NDVI data. Clim. Environ. Res. 2018, 23, 26–36. [Google Scholar]
- Shen, G.; Yang, X.C.; Jin, Y.X.; Xu, B.; Zhou, Q.B. Remote sensing and evaluation of the wetland ecological degradation process of the Zoige Plateau Wetland in China. Ecol. Indic. 2019, 104, 48–58. [Google Scholar] [CrossRef]
- Ren, L.L.; Li, Y.Z.; Yu, M.; Yang, J.S.; Zhao, C.; Zhou, D. Evolution of artificial wetlands in the Yellow River Delta and related driving factors during 1984–2015. J. Agric Resour. Environ. 2020, 37, 493–502. [Google Scholar]
- Liu, J.P.; Dong, C.Y.; Liu, J.F.; Zheng, K.J. Analysis of isolated wetland spatial distribution and factors influencing it in the Sanjiang Plain, China. Acta Ecol. Sin. 2016, 36, 3280–3291. [Google Scholar]
- Lee Rodgers, J.; Nicewander, W.A. Thirteen ways to look at the correlation coefficient. Am. Stat. 1988, 42, 59–66. [Google Scholar] [CrossRef]
- Zhang, J.Y.; Ding, J.L.; Wu, P.F.; Tan, J.; Huang, S.; Teng, D.X.; Cao, X.Y.; Wang, J.Z.; Chen, W.Q. Assessing arid inland lake watershed area and vegetation response to multiple temporal scales of drought across the Ebinur Lake Watershed. Sci. Rep. 2020, 10, 1354. [Google Scholar] [CrossRef]
- Wang, H.Y. Study on Remote Sensing Evaluation and Monitoring of Land Degradation Based on NPP and Vegetation Precipitation Efficiency. Ph.D. Thesis, Chinese Academy of Forestry, Beijing, China, 2013. [Google Scholar]
- Wang, Z.; Huang, Y.; Liu, T.; Zhong, R.S.; Zan, C.J.; Wang, X.F. Analyzing the water balance of Lake Balkhash and its influencing factors. Arid Zone Res. 2022, 39, 400–409. [Google Scholar]
- Yuan, Q.X.; Wei, W.S. Annual climate change in the Tianshan mountainous since recent 40 years. Arid Zone Res. 2006, 23, 115–118. [Google Scholar]
- Duan, W.L.; ZOU, S.; Chen, Y.N.; Nover, D.; Fang, G.H.; Wang, Y. Sustainable water management for cross-border resources: The Balkhash Lake Basin of Central Asia, 1931–2015. J. Clean. Prod. 2020, 263, 121614. [Google Scholar] [CrossRef]
- Wang, Z. Analysis of runoff change characteristics in Balkhash Lake basin. Water Resour. Sci. Technol. Econ. 2012, 18, 53–58. [Google Scholar]
- Wu, M.; Zhang, X.Y.; Wang, L.X.; Chen, X.; Ji, L.L. Water resources and their exploitation and utilization in Balkhash-Alakol Lake Basin in Kazakhstan. J. Hohai Univ. Nat. Sci. 2013, 41, 11–20. [Google Scholar]
- Wang, Y.J.; Guo, D.M. Ecological evolution and its driving forces in the Ili River Basin, the border river between China and Kazakhstan. J. Eurasian Econ. 2016, 21, 100–107. [Google Scholar]
- Liu, W.R.; Chen, C.B.; Luo, G.P.; He, H.L. Change processes and trends of land use/cover in the Balkhash Lake basin. Arid Zone Res. 2021, 38, 1452–1463. [Google Scholar]


| Dataset | Source | Source Scale | Spatial Resolution |
|---|---|---|---|
| MSS | USGS website https://earthexplorer.usgs.gov/ (accessed on 4 July 2022) | 18-day | 78 m |
| TM | USGS website https://earthexplorer.usgs.gov/ (accessed on 4 July 2022) | 16-day | 30 m |
| ETM+ | USGS website https://earthexplorer.usgs.gov/ (accessed on 4 July 2022) | 16-day | 30 m |
| OLI | USGS website https://earthexplorer.usgs.gov/ (accessed on 4 July 2022) | 16-day | 30 m |
| MOD13A3 | https://ladsweb.nascom.nasa.gov/search/ (accessed on 4 July 2022) | Monthly | 1000 m |
| MOD17A2H | https://ladsweb.nascom.nasa.gov/search/ (accessed on 4 July 2022) | 8-day | 500 m |
| ERA5 | https://www.ecmwf.int/en/research/climate-reanalysis (accessed on 4 July 2022) | Monthly | 0.1° × 0.1° |
| Meteorological Data | CRU TS4.04 http://data.ceda.ac.uk/badc/cru/data/cru_ts/ (accessed on 4 July 2022) | Annually | 0.5° × 0.5° |
| LULC | http://data.casearth.cn/ (accessed on 4 July 2022) | Annually | - |
| Hydrological data | http://www.ncdc.ac.cn (accessed on 4 July 2022) | Annually | - |
| Indicators | Accuracy |
|---|---|
| Overall accuracy | 89.80% |
| Producer accuracy | 86.78% |
| Omission error | 13.22% |
| User accuracy | 93.56% |
| Factor | Average Temperature | Average Precipitation | Water Consumption in the Middle Reaches | ||
|---|---|---|---|---|---|
| Contribution Rate (%) | |||||
| Time | |||||
| 1961–1969 | 46.38 | 53.06 | 0.55 | ||
| 1970–1985 | 44.93 | 7.60 | 47.47 | ||
| 1986–2020 | 4.91 | 64.89 | 30.18 | ||
| 1961–2020 | 5.00 | 66.67 | 28.33 | ||
Publisher’s Note: MDPI stays neutral with regard to jurisdictional claims in published maps and institutional affiliations. |
© 2022 by the authors. Licensee MDPI, Basel, Switzerland. This article is an open access article distributed under the terms and conditions of the Creative Commons Attribution (CC BY) license (https://creativecommons.org/licenses/by/4.0/).
Share and Cite
Cao, Y.; Ma, Y.; Liu, T.; Li, J.; Zhong, R.; Wang, Z.; Zan, C. Analysis of Spatial–Temporal Variations and Driving Factors of Typical Tail-Reach Wetlands in the Ili-Balkhash Basin, Central Asia. Remote Sens. 2022, 14, 3986. https://doi.org/10.3390/rs14163986
Cao Y, Ma Y, Liu T, Li J, Zhong R, Wang Z, Zan C. Analysis of Spatial–Temporal Variations and Driving Factors of Typical Tail-Reach Wetlands in the Ili-Balkhash Basin, Central Asia. Remote Sensing. 2022; 14(16):3986. https://doi.org/10.3390/rs14163986
Chicago/Turabian StyleCao, Yijie, Yonggang Ma, Tie Liu, Junli Li, Ruisen Zhong, Zheng Wang, and Chanjuan Zan. 2022. "Analysis of Spatial–Temporal Variations and Driving Factors of Typical Tail-Reach Wetlands in the Ili-Balkhash Basin, Central Asia" Remote Sensing 14, no. 16: 3986. https://doi.org/10.3390/rs14163986
APA StyleCao, Y., Ma, Y., Liu, T., Li, J., Zhong, R., Wang, Z., & Zan, C. (2022). Analysis of Spatial–Temporal Variations and Driving Factors of Typical Tail-Reach Wetlands in the Ili-Balkhash Basin, Central Asia. Remote Sensing, 14(16), 3986. https://doi.org/10.3390/rs14163986