Technical Note

Direct Assimilation of Radar Reflectivity Data Using Ensemble Kalman Filter Based on a Two-Moment Microphysics Scheme for the Analysis and Forecast of Typhoon Lekima (2019)

1
Key Laboratory of Mesoscale Severe Weather, Ministry of Education, School of Atmospheric Sciences, Nanjing University, Nanjing 210093, China
2
Shanghai Typhoon Institute, China Meteorological Administration, Shanghai 200030, China
3
Key Laboratory of Numerical Modeling for Tropical Cyclones, China Meteorological Administration, Shanghai 200030, China
4
Fujian Key Laboratory of Severe Weather, Fuzhou 350008, China
5
Center for Analysis and Prediction of Storms, School of Meteorology, University of Oklahoma, Norman, OK 73072, USA
*
Author to whom correspondence should be addressed.
Remote Sens. 2022, 14(16), 3987; https://doi.org/10.3390/rs14163987
Submission received: 19 June 2022 / Revised: 7 August 2022 / Accepted: 14 August 2022 / Published: 16 August 2022
(This article belongs to the Section Atmospheric Remote Sensing)

Abstract

:
We investigate the impact of directly assimilating radar reflectivity data using an ensemble Kalman filter (EnKF) based on a double-moment (DM) microphysics parameterization (MP) scheme in GSI-EnKF data assimilation (DA) framework and WRF model for a landfall typhoon Lekima (2019). Observations from a single operational coastal Doppler are quality-controlled and assimilated. Compared with the baseline experiment initialized by GFS analysis, the reflectivity data assimilation experiment (Z-DA) resulted in an obvious improvement in both structural analysis and typhoon forecast skills in terms of intensity, precipitation, and track. Sensitivity experiments were conducted to evaluate the ability of EnKF to update certain state variables considering that the degree of freedom of analytical variables increased with a DM MP scheme. When either the total number concentration or other large-scale state variables that are not directly linked to reflectivity observations via the observation operator are not updated, the tendency of RMSIs and PS to be imbalanced is significantly increased during DA cycles compared to those of Z-DA with updating a full set of state variables, resulting in increased intensity and track forecast errors. These results indicate that the reliable ensemble covariance could handle the underconstraint issue associated with the DM scheme, and helps in obtaining more physically balanced analytical fields.

1. Introduction

Tropical cyclones (TC) can cause heavy losses of property and casualties through damaging winds and extreme precipitation. China has an average annual landfall of 7–9 TCs, rendering it one of the countries with the most severe TC disasters. Although the forecast accuracy of TC track has been improved in recent decades due to the continuous development of numerical weather prediction (NWP) models, the improvement in TC intensity and precipitation forecasting remains limited.
There are few observation platforms in the TC inner-core region. Radar is capable of observing TC inner-core structures and circulations at high spatial and temporal resolutions. Radar radial velocity and reflectivity could provide effective information on the wind structure and microphysical process at the TC vortex and convective scale [1,2,3]. The assimilation of radar data would help in improving the initialization of the TCs. Many studies have attempted to define convective structures in TC initializations using a three-dimensional variational (3DVAR) method to assimilate radar radial velocity, leading to improved TC forecasts [4,5,6,7,8]. However, using static background error covariance, 3DVAR is less able to describe the evolution of TCs and obtain correlations among cross-variables. Compared to 3DVAR, the ensemble Kalman filter (EnKF) has shown encouraging success in radar radial velocity with flow-dependent ensemble covariance. The EnKF method for assimilating radar velocity data is useful in TC vortex initialization, and contributes to improving TC forecast skill in intensity, structure, and rainfall prediction [3,9,10,11].
Unlike radar radial velocity, a measure of wind field, reflectivity has knowledge about hydrometers that depends on scatter concentration, phase, size, and other properties. The assimilation of radar reflectivity is more complex and much more challenging than the assimilation of radial velocity [12,13]. Cloud analysis is an early approach to assimilating reflectivity data into an NWP model, to adjust some of the hydrometer variables and in-cloud temperatures. Many studies showed the positive impact of using cloud analysis to initialize convective scale NWP and to mitigate the spin-up problem in short-range forecasts [14,15,16,17]. Cloud analysis is a promising tool for TC track and intensity forecasts [7]. However, a number of empirical relationships between the hydrometer variables and the reflectivity are included in the cloud analysis method, introducing many additional uncertainties.
The VAR method to directly assimilate reflectivity has two common difficulties. One is associated with the tangent linear and adjoint of the strong nonlinear observation operator. Sun and Crook [18] found that, in their 4DVAR scheme, a large gradient of reflectivity cost function term associated with a small rainwater mixing ratio prevents effective convergence. To reduce this negative effect of nonlinearity, they retrieved a rainwater mixing ratio from reflectivity and then assimilated the rainwater mixing ratio into their 4DVAR scheme. Only warm-rain microphysics was used, and only rainwater mixing ratios were considered in their framework. Due to the neglect of many other hydrometers, especially ice-related hydrometers, this method would degrade the quality of analysis and forecast, especially in strong convective areas. Wang et al. [19] also encountered a similar problem, so they had to use reflectivity data of less than 55 dBZ. As other ways to mitigate the nonlinear problem, some kinds of the transformation of the hydrometer (rainwater) mixing ratio were introduced [20,21,22,23]. Another difficulty of direct reflectivity assimilation in variational schemes is related to static background covariance, which is not only limited in describing correlations among cross-variables, but also likely to produce unphysical analyses of hydrometeors due to its static and homogeneous background variances [13]. One potential solution is to employ a hybrid ensemble-variational (EnVAR) method [21,24] to consider the model constraints in the form of ensemble covariance. Although the hybrid method is able to include flow-dependent background covariance, it still faces the nonlinearity challenge since it obtains the analysis in a variational framework.
In contrast with VAR or hybrid methods, the ensemble Kalman filter (EnKF) is a powerful approach for directly assimilating radar reflectivity [25,26,27]. It is easy for EnKF to use a highly nonlinear observation operator (e.g., radar reflectivity) and models with complex ice microphysics because the adjoint model is no longer required. Moreover, it is straightforward for EnKF to utilize covariances between reflectivity and unobserved model variables. Several encouraging results for direct radar reflectivity assimilation using EnKF were reported [28]. However, EnKF is vulnerable to model errors [29]. The microphysics parameterization (MP) process is one of the most important sources of model errors. In recent years, studies indicated that prediction errors can be reduced by adopting the double-moment (DM) MP scheme [30,31,32]. If a DM scheme is adopted in a model, it would be better to use the same MP scheme in the data assimilation stage. That is, the reflectivity observation operator is also based on the same DM MP scheme, and the number concentration of hydrometers is updated in the process of assimilation. Though using DM MP scheme in EnKF reflectivity DA is theoretically promising, it has a potential challenge since it increases the number of analytical variables to be estimated, which might further aggravate the underconstraint problem because only reflectivity observations are assimilated to update the number of analytical variables. The studies of EnKF to assimilate reflectivity based on the DM MP scheme are very limited [33,34,35]. So far, reflectivity has not been assimilated by using EnKF based on DM MP scheme for TC simulation. Therefore, more studies are needed in order to better use EnKF to directly assimilate reflectivity to improve TC forecasts.
This study investigates for the first time the performance of EnKF reflectivity DA based on a partial DM MP scheme for a real TC case. We selected supertyphoon Lekima that occurred on August 2019 in the Northwest Pacific. The impact of the EnKF assimilation of radar reflectivity on analyses and TC forecasts is examined. Additional sensitivity experiments were conducted to evaluate the impact of updating the number concentration of hydrometers and other large-scale cross variables not directly related to the reflectivity observation operator.
The rest of this paper Is organized as follows: in Section 2, the TC Lekima case, the forecast model, radar observations, EnKF assimilation system, and experimental setup are described. Section 3 discusses the impact of reflectivity data on analyses, forecasts of intensity, track, and precipitation. Sensitivity to the impacts of the analytical variables is presented in Section 4. The conclusions are given in Section 5.

2. Description of the Data Assimilation Experiments
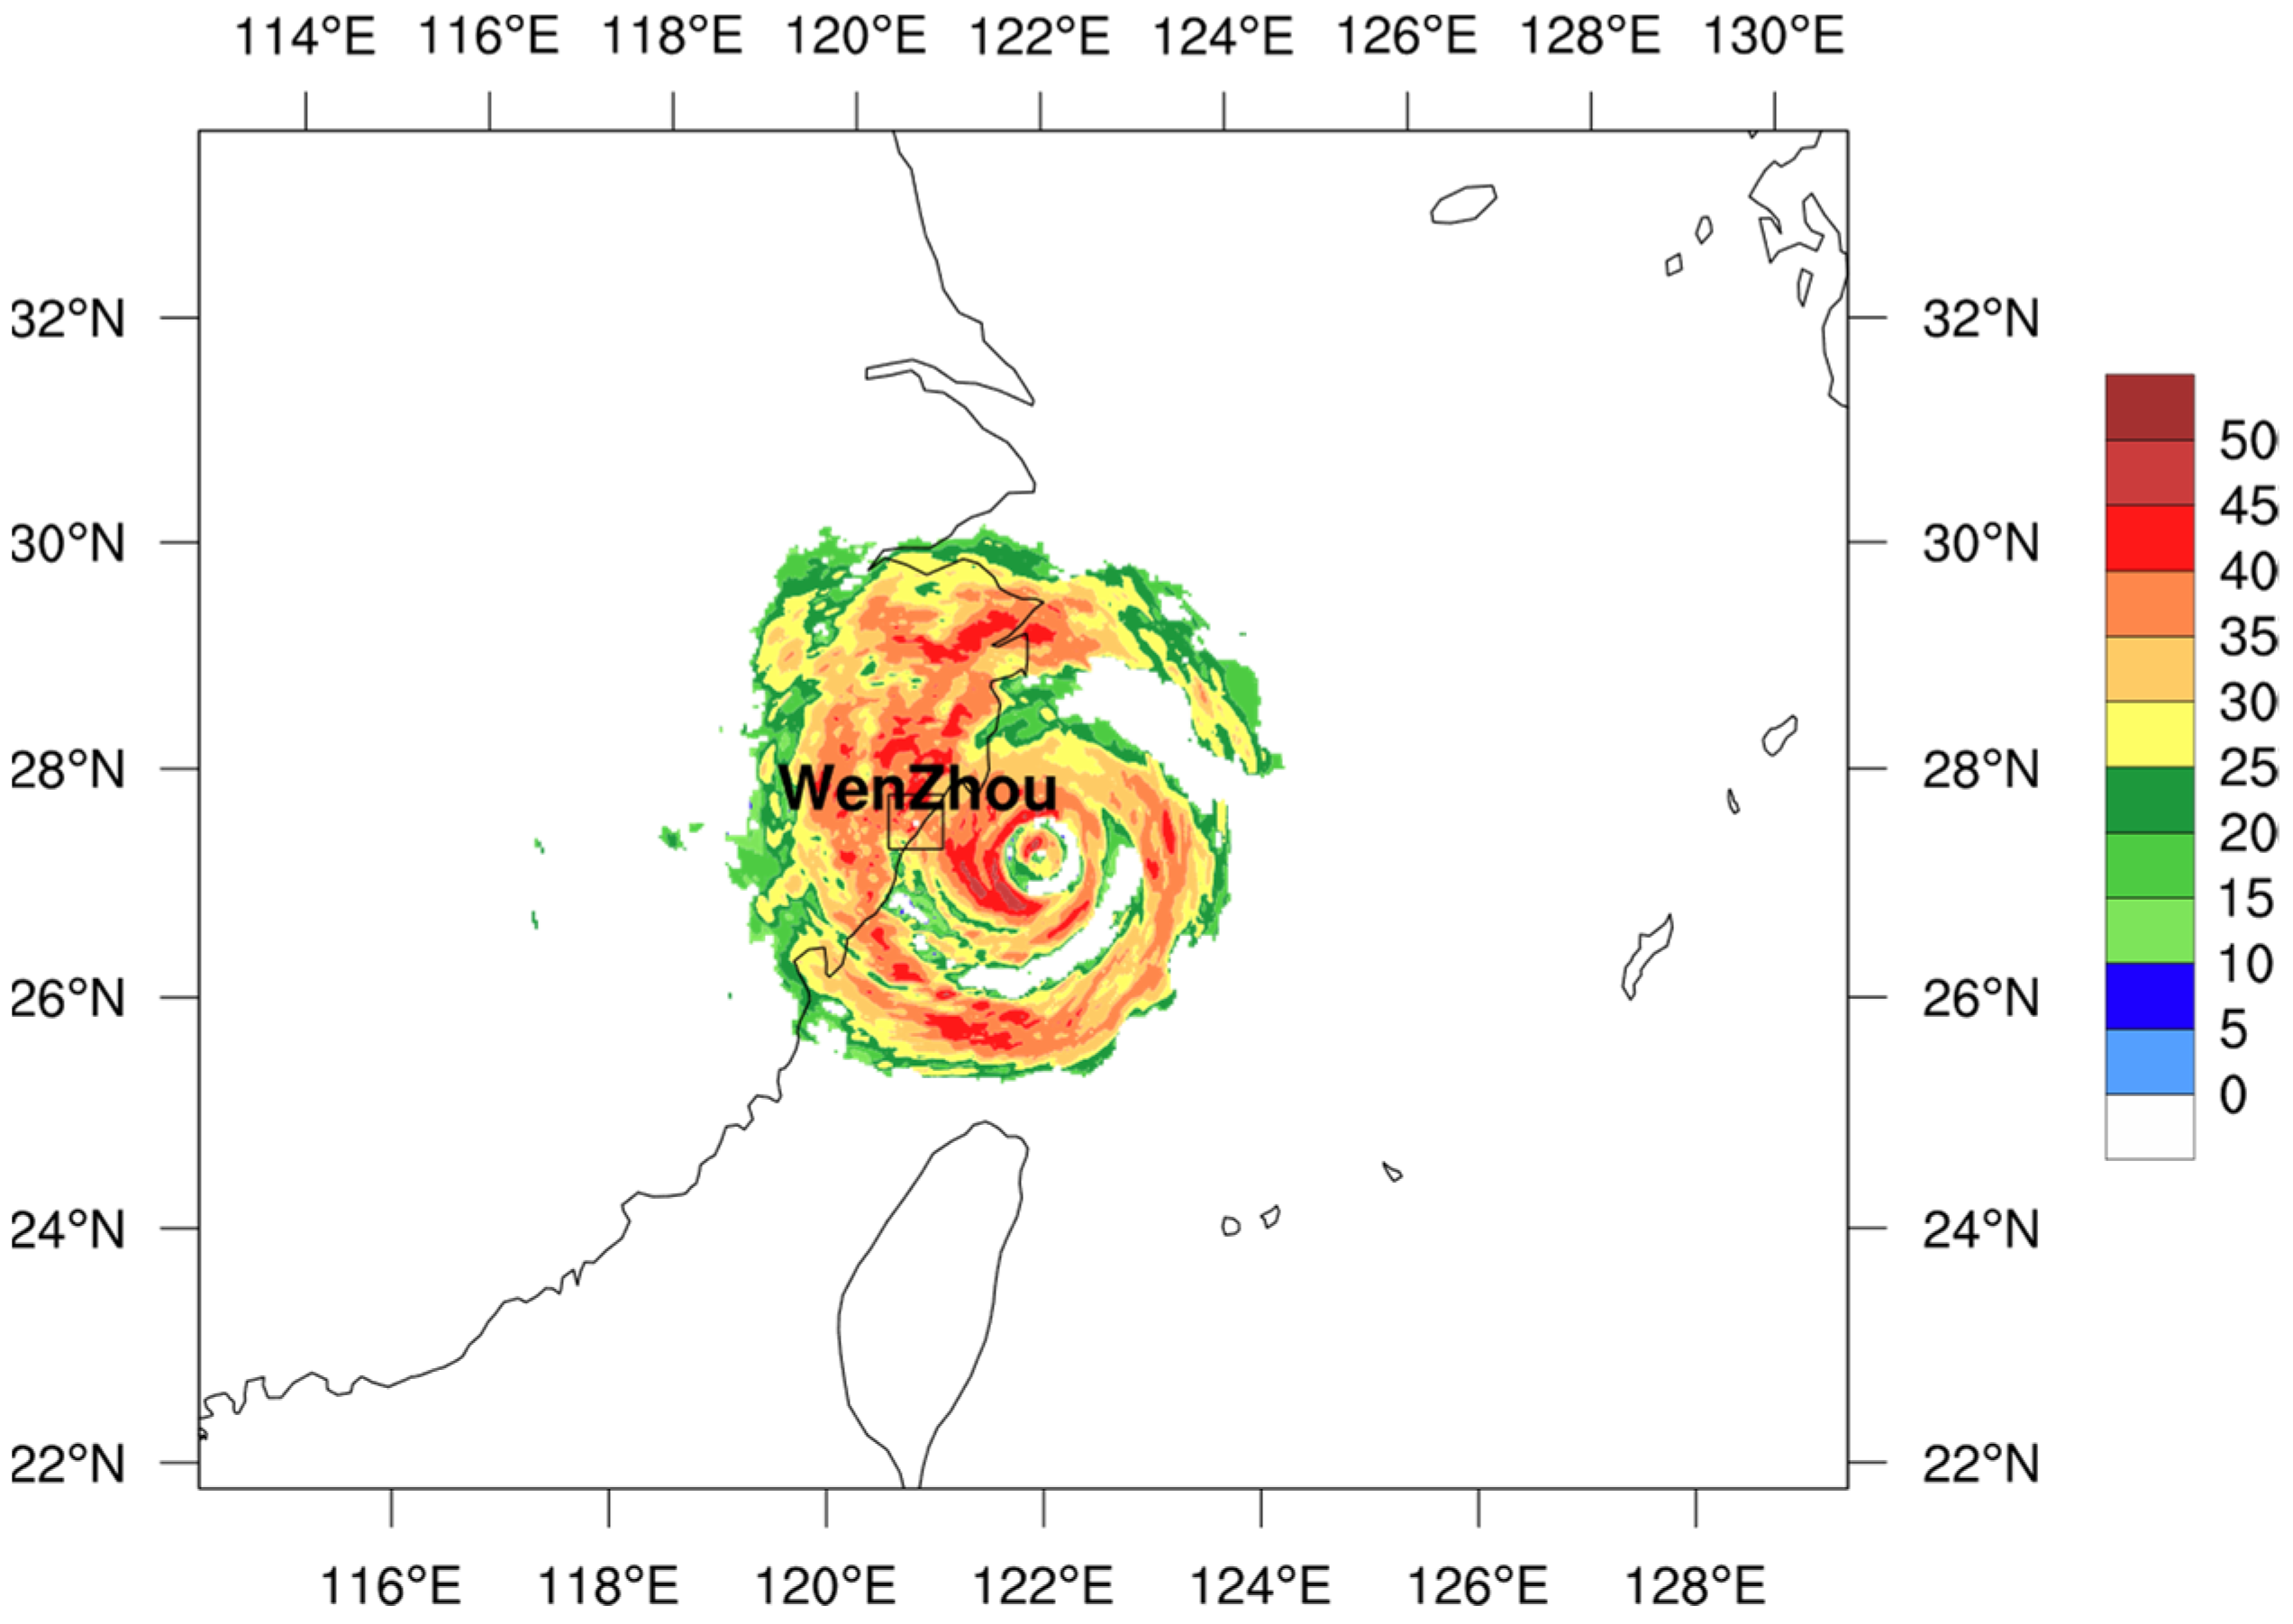
2.1. Case Overview

Supertyphoon Lekima (2019) was the most intense TC during the 2019 Northwest Pacific TC season. It made landfall in Wenling, Zhejiang province, reaching 16 force (52 m/s), at 1745 UTC, 9 August. After the first landfall in Zhejiang, Lekima passed over Jiangsu, Shandong and made its second landfall in Qingdao at 1250 UTC, 10 August, with maximal force 9 (23 m/s). Over its inland path, Lekima brought heavy precipitation and damage to 11 Chinese provinces, rendering it the second costliest TC in China since 2000, only after TC Fitow (2013). This study investigates the impact of directly assimilating radar reflectivity using EnKF.

2.2. Numerical Model

Predictions during EnKF cycles are performed using the Advanced Research Weather Research and Forecast (WRF-ARW) model [36] version 3.9.1. Prognostic state variables include velocity components (u, v and w), perturbation potential temperature (θ), perturbation dry air mass in column (MU), and water vapor mixing ratio (qv), and microphysical state variables. In this study, the DM MP scheme of Thompson [37] is used. Microphysical variables were the mixing ratios of cloud water, rainwater, ice, snow, and graupel, and the total number concentrations of rain. The forecast domain had 548 × 452 grid points with a horizontal resolution of 3 km and 51 vertical levels from the surface to 20 hPa (Figure 1). Other physical parametrizations included the Yonsei University (YSU) planetary boundary layer scheme [38], the unified Noah land surface model [39], and the rapid radiative transfer model for global circulation model (RRTMG) shortwave and longwave schemes [40].

2.3. Assimilation Data and Algorithms

Data assimilated in this study were radar reflectivity factor (Z) from a single coastal WSR-88D radar at Wenzhou station in Zhejiang province. The radar data coverage is shown in Figure 1. For quality control, the original raw data were processed to remove ground clutter, speckles, and other artefacts, and converted into a mosaic of observations on a three-dimensional grid with a horizontal resolution of 3 km and 33 vertical levels. Only reflectivity data in precipitation regions (≥5 dBZ) were assimilated.
In this study, reflectivity observations were directly assimilated with a GSI EnKF system using 41 ensemble members. The EnKF scheme used here is commonly called an ensemble square root filter (EnSRF) [41]. The length scale for horizontal covariance localization is 12 km, and the scale height (unit of −log (P/Pref) for vertical localization is 0.1. The relaxation to a prior spread (RTPS) multiplicative inflation scheme [42] was applied to account for the deficiency of the ensemble spread in the EnKF:
x i a x i a α σ b σ a σ a + 1 ,
where x i a is the posterior (analysis) perturbation for the i-th ensemble member; σ b , σ a are the prior (background) and posterior (analysis) standard deviation (spread) at each grid point; and α is the inflation parameter, which is 0.95 in this study.
For radar reflectivity assimilation, the gross check in the GSI EnKF system was applied. The observation error’s standard deviation for reflectivity was specified as 5 dBZ. If the difference of observation and background reflectivity is greater than 7 times of the standard deviation of observation error, this observation fails the gross check and is not assimilated.
Unlike most previous research on direct reflectivity assimilation where reflectivity operators were based on a relatively simple formula that used Rayleigh scattering approximation and a single-moment (SM) MP scheme [13,21,43], this study adopted a more advanced and complex observation operator that was initially developed by Jung et al. [27], who used a fitted approximation to the T-matrix [44] for rain, and the Rayleigh approximation for ice species. This reflectivity operator takes into account nonspherical shapes for large precipitation species, and the non-Rayleigh scattering effect for raindrops. This operator was updated by Xue et al. [33] to add the total number of the concentrations of hydrometers as input variables, which is consistent with a DM MP scheme.
Using a fitted approximation to the T-matrix for the scattering amplitude calculation, the formula of rain reflectivity at the horizontal polarization is as follows:
Z h , r = 4 λ 4 α r a 2 N 0 r π 4 K w 2 Λ r 2 β r a + 1 Γ 2 β r a + 1 ,
where λ is the radar wavelength, which is approximately 10.7 cm for the S-band radars. K w = 0.93 is the dielectric factor for water. Subscript r is the rain, a r a = 4.28 × 10 4 , and β r a = 3.04 are fitting values of the T-matrix calculation for rain. N 0 r is the intercept parameter for rain, which is consistent with Thompson DM MP. Slope parameter Λ r for rain is established from the intercept parameter and mixing ratio of rain. Γ is the complete gamma function of particle size distribution (PSD).
For other hydrometer species, the forms of radar reflectivity at the horizontal polarization are listed below:
Z h , x = 2880 λ 4 N 0 x π 4 K w 2 Λ x 7 A α x a 2 + B α x b 2 + 2 C α x a α x b ,
where
A = 1 8 3 + 4 cos 2 ϕ ¯ e 2 σ 2 + cos 4 ϕ ¯ e 8 σ 2 ,
Β = 1 8 3 4 cos 2 ϕ ¯ e 2 σ 2 + cos 4 ϕ ¯ e 8 σ 2 ,
C = 1 8 1 cos 4 ϕ ¯ e 8 σ 2 .
where ϕ ¯ is the mean canting angle, and σ is the standard deviation of the canting angle. ϕ ¯ = 0 was assumed for all species, and σ = 20 ° , 60 ° for snow and graupel, respectively.
Subscript x can be dry snow (ds), dry graupel (dg), rain-snow mixture (rs), or rain-graupel mixture (rg). α x a , α x b are the fitting results for calculating scattering amplitudes from Rayleigh scattering approximation. α d s a = 0.194 × 10 4 , and α d s b = 0.191 × 10 4 for dry snow, α d g a = 0.191 × 10 3 , and α d g b = 0.165 × 10 3 for dry graupel. For melting species, including rain-snow mixture (rs) and rain-graupel mixture (rg), the fitting results are:
α r s a = 0.194 + 7.094 f w + 2.135 f w 2 5.22 f w 3 × 10 4 ,
α r s b = 0.191 + 6.916 f w 2.841 f w 2 1.160 f w 3 × 10 4 ,
α r g a = 0.191 + 2.39 f w 12.57 f w 2 + 38.71 f w 3 65.53 f w 4 + 56.16 f w 5 18.98 f w 6 × 10 3 ,
a r g b = 0.165 + 1.72 f w 9.92 f w 2 + 32.15 f w 3 56.04 f w 4 + 48.83 f w 5 16.69 f w 6 × 10 3 .
where f w = q r / q r + q s / g is a rain fraction calculated from the mixing ratio of rain, snow, or graupel.
Once the radar reflectivity factors of all hydrometeor species had been calculated with Equations (2) and (3), the horizontal logarithmic reflectivity was computed as follows:
Z H = 10 log 10 Z h , r + Z h , r s + Z h , d s + Z h , r g + Z h , d g d B Z .
For more details on the radar observation operators, the readers are referred to Jung et al. [27].

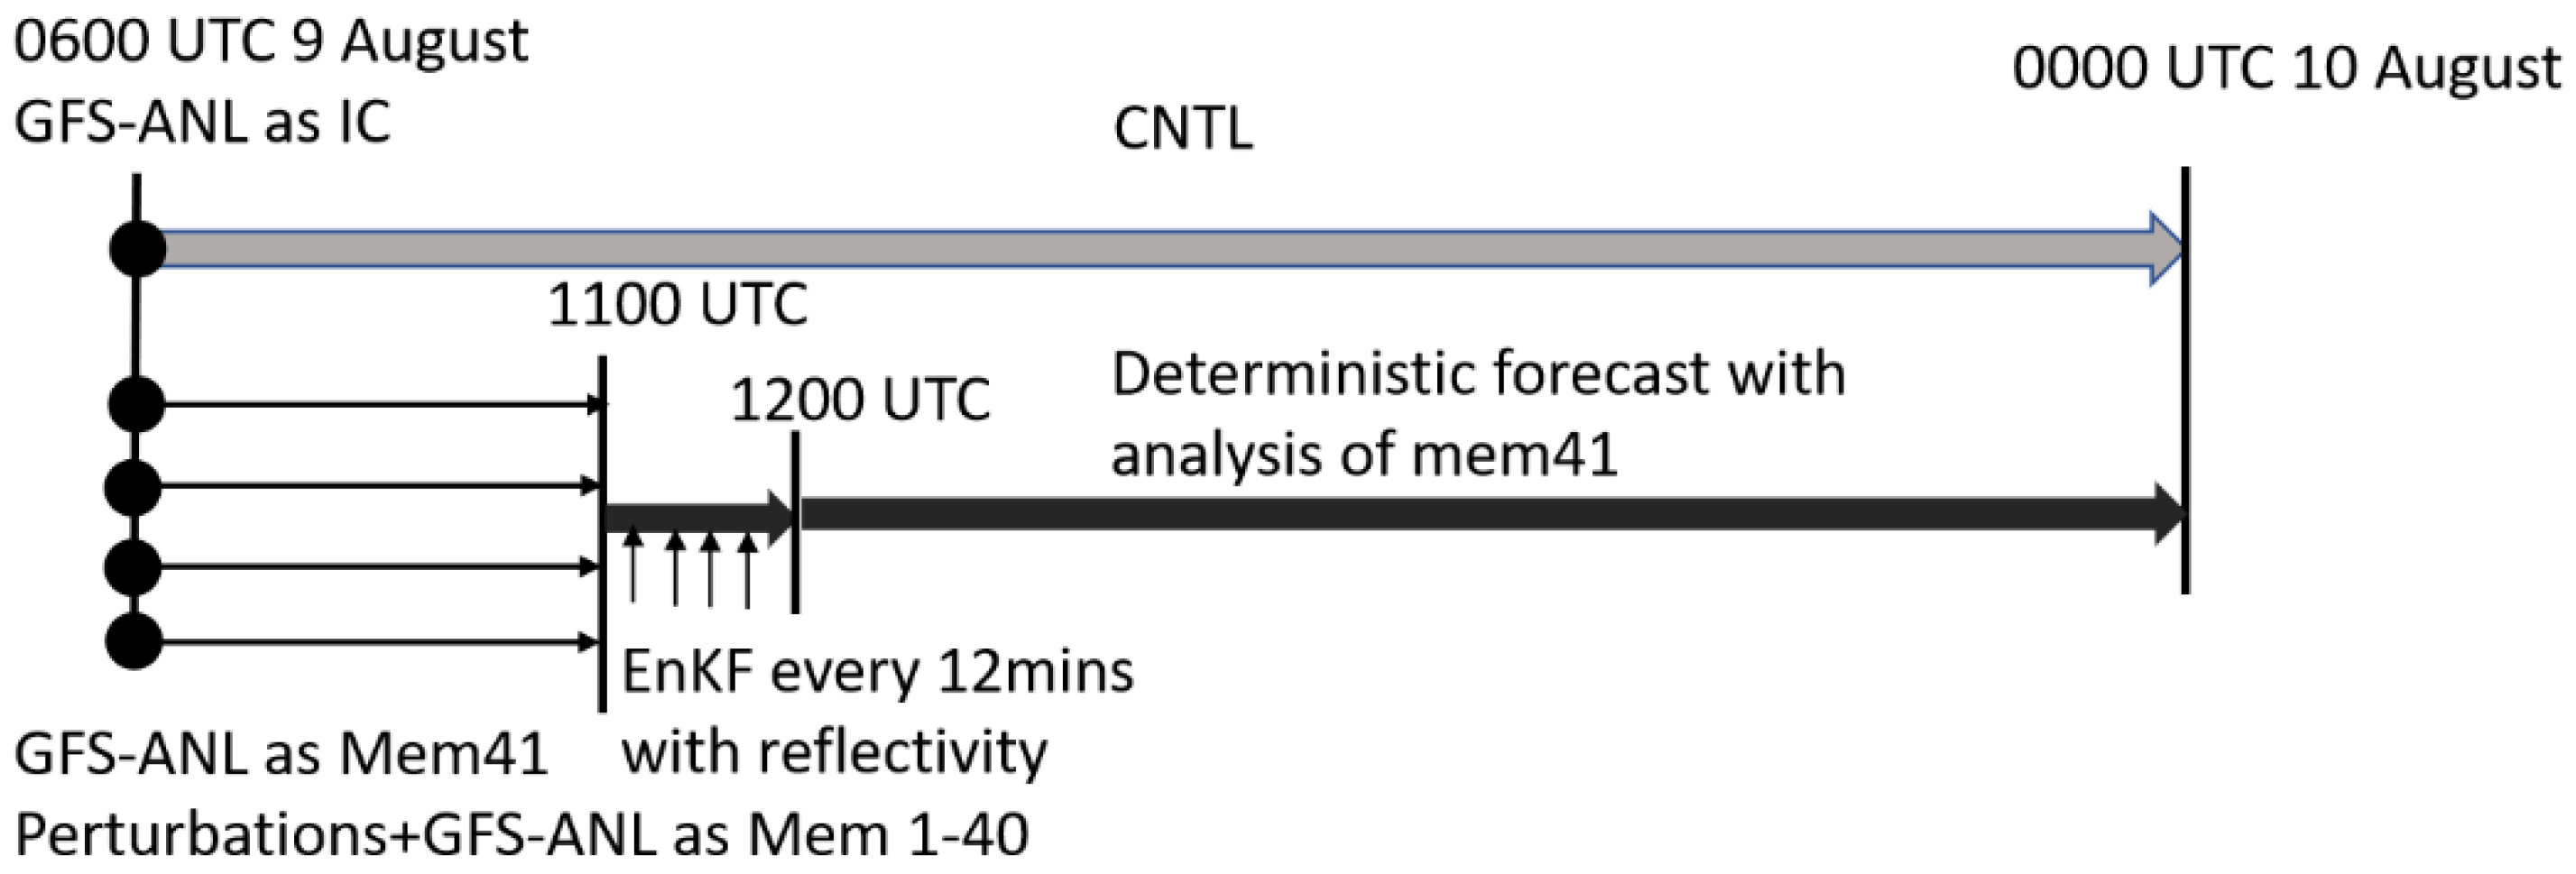
2.4. Experimental Design

Figure 2 illustrates the workflow of all the experiments. A control forecast (CNTL) serving as the baseline was initiated with NCEP GFS analysis at 0600 UTC, 09 August, and no radar data were assimilated. In all DA experiments, a 41-member ensemble was first generated at 0600 UTC. The initial fields for Member 41 were taken directly from GFS analysis, same with that in CNTL, and the initial fields for Members 1–40 were created by adding random perturbations generated from WRFDA 3DVAR with the cv3 background error covariance option [45] to the GFS analysis. Then, a 5 h ensemble forecast was launched for spin-up that would hopefully sample the mesoscale uncertainties of models. The lateral boundary conditions were generated from the GFS forecasts. To evaluate the impact of radar reflectivity data on the TC analyses and forecasts, in each DA experiment, radar reflectivity data were assimilated every 12 min for 5 cycles. The DA cycles started at UTC 1100 and ended at 1200, 9 August, about 5 h before Lekima’s first landfall. The background fields for each cycle were provided by the 12 min ensemble forecast from the previous cycle. At the end of DA cycles, a 12 h deterministic forecast was launched from the analysis of Member 41 rather than from the ensemble mean in order to exclude the influence of ensemble forecasting to conduct a fair comparison with CNTL. To examine the impact of updating different variables, a set of sensitivity experiments were performed. Table 1 lists all experiments presented in this paper. Experiment Z-DA updated a full set of state variables, namely, u, v, w, MU, θ, qv, hydrometeor mixing ratios (qc, qi, qr, qs, qg), and the total number concentrations of rain water (Nr), consistent with the Thompson MP scheme in the WRF model. Experiment Z_NoNr excluded the update of Nr compared to experiment Z-DA. Increasing the analytical variables (i.e., Nr) in DM MP schemes may aggravate the underconstraint problem, since only reflectivity observations are assimilated, and the model error in a real case may lead to filter divergence with unreliable multivariate covariance. Experiment Z_NoNr was designed to examine the ability of EnKF to simultaneously estimate all possible state variables associated with the DM MP scheme. Two additional experiments, Z_NoUV and Z_NoCross (Table 1), were the same as experiment Z-DA but excluded the update of either horizontal wind components or all large-scale variables (u, v, w, θ, qv), respectively. These two experiments were designed to investigate the impact of updated large-scale variables that were not directly linked to reflectivity observations via the observation operator.
To verify the simulation results, the best track data from the China Meteorological Administration (CMA) [46,47] were used as the truth. The precipitation observations were the multisource merged hourly analysis product with a resolution of 0.1 ° × 0.1 ° from CMA [48].

3. Impact of Radar Reflectivity Assimilation

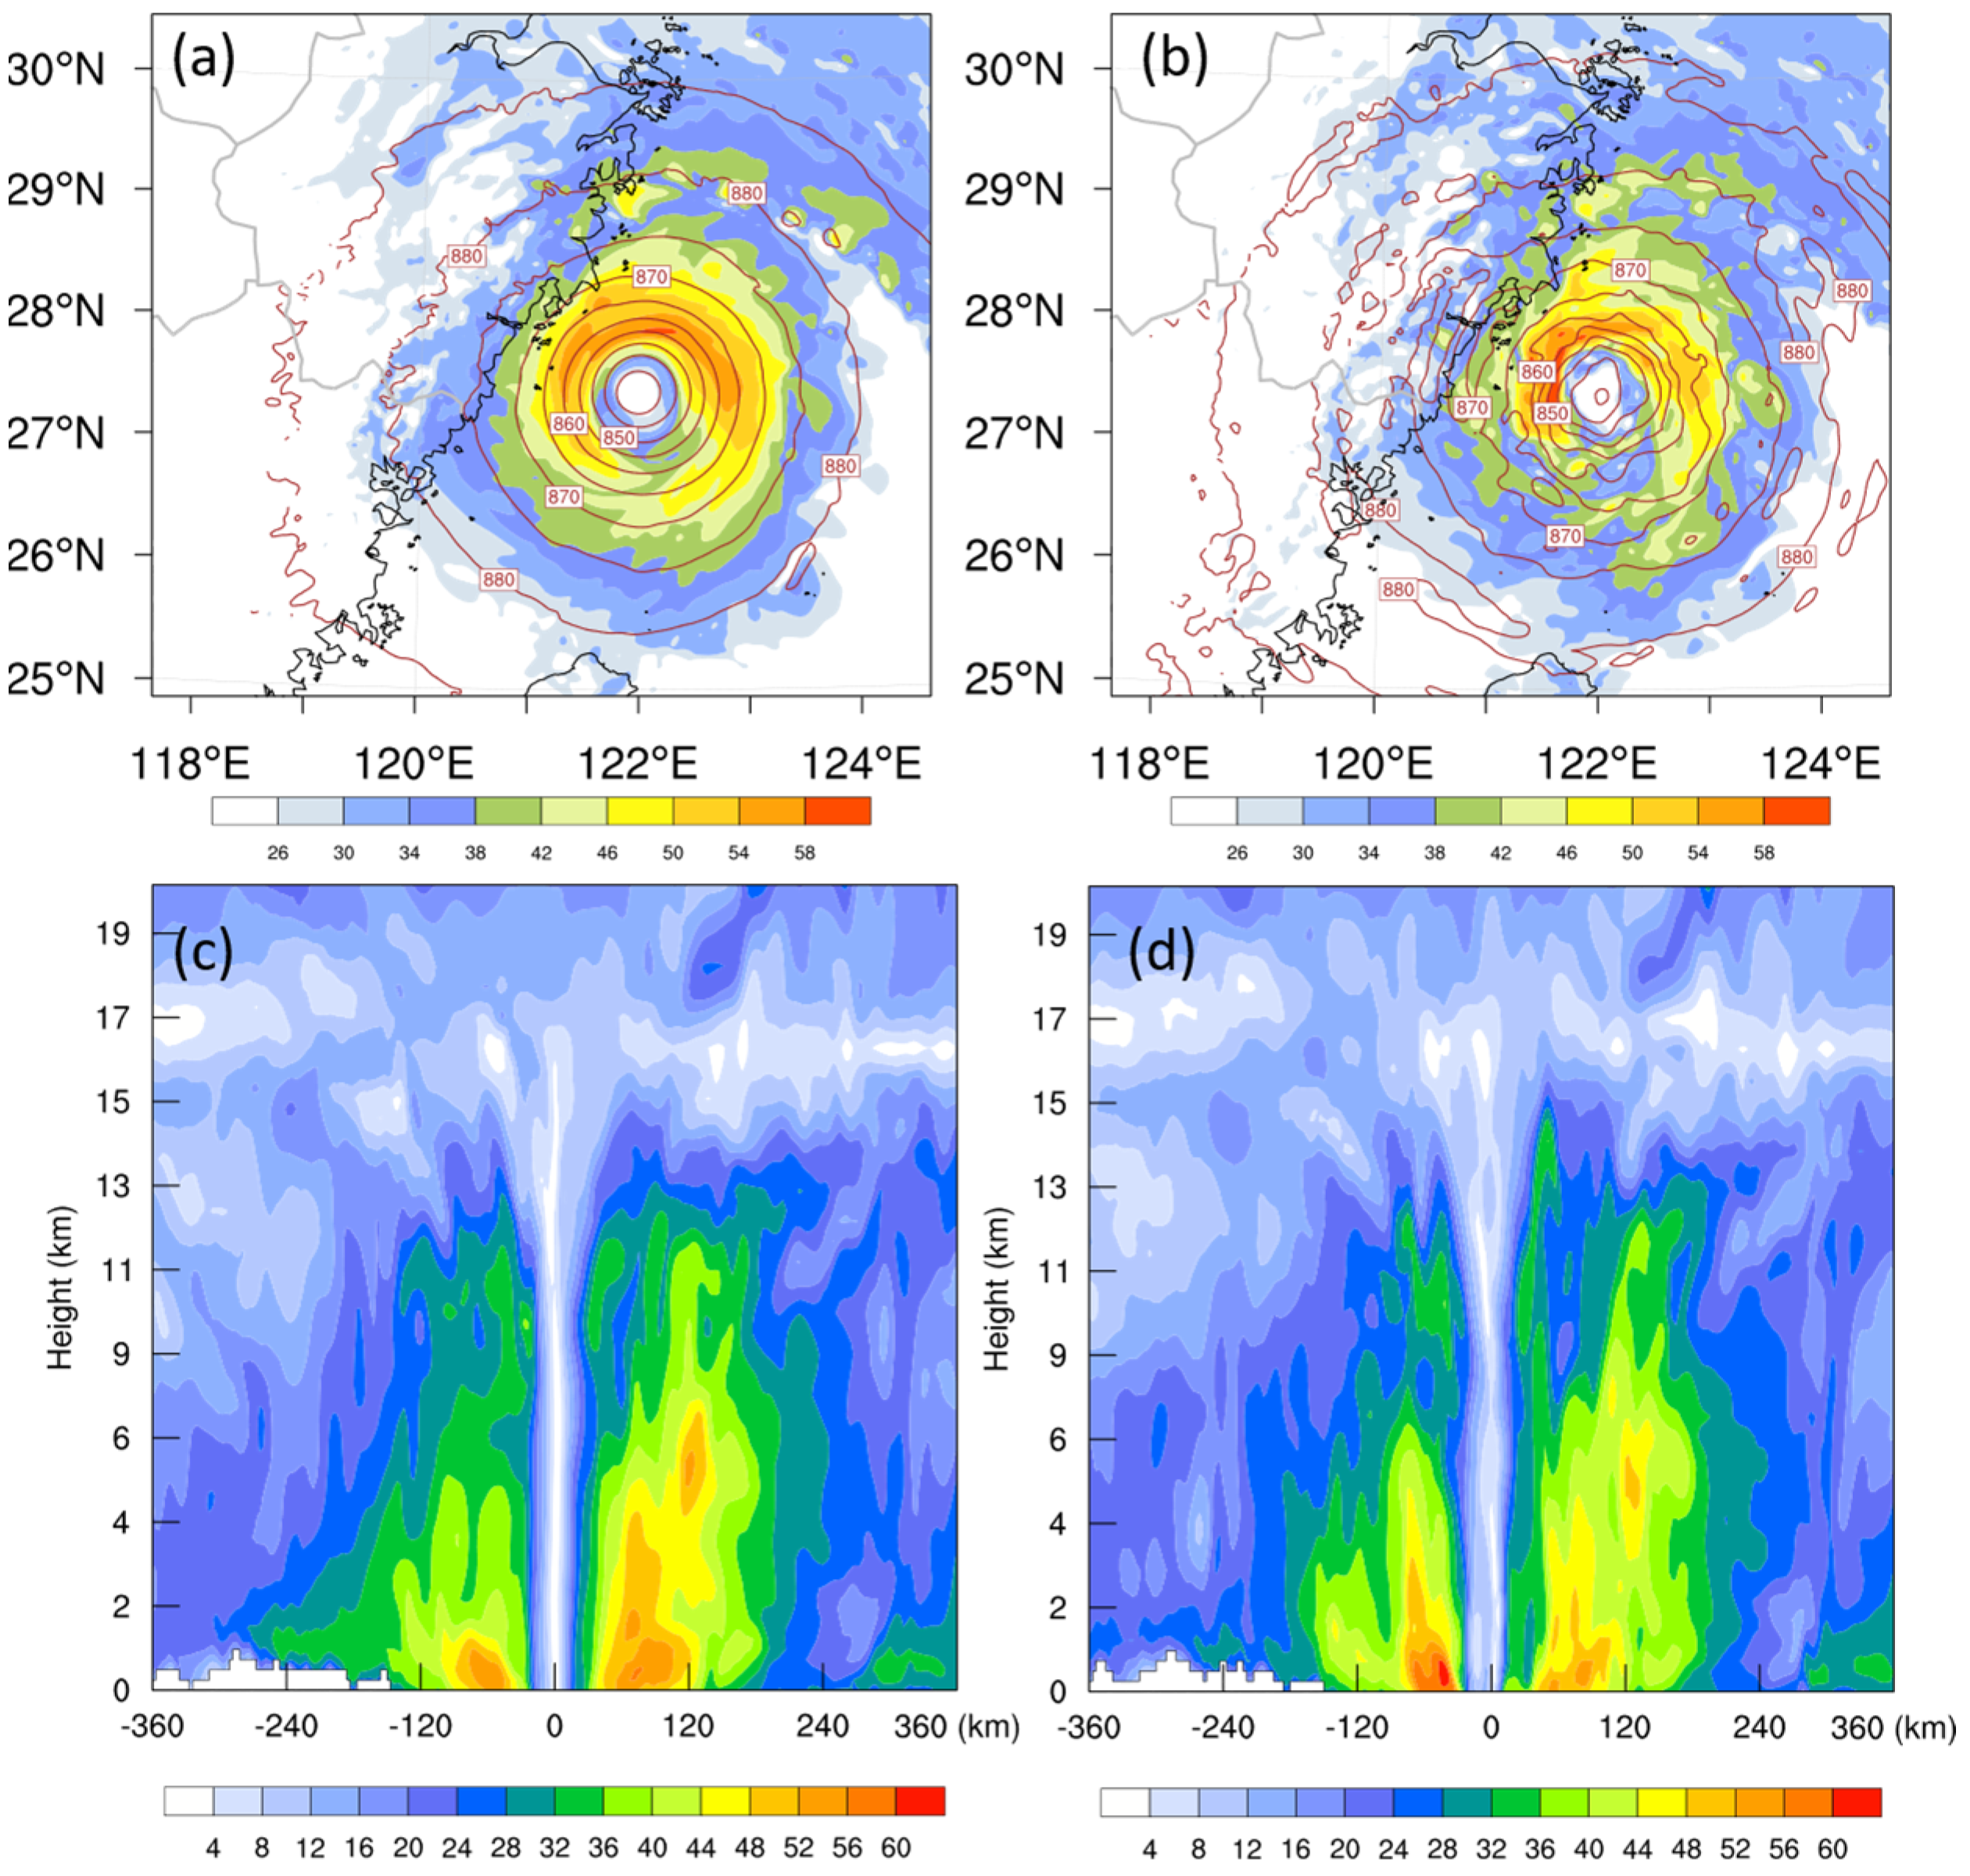
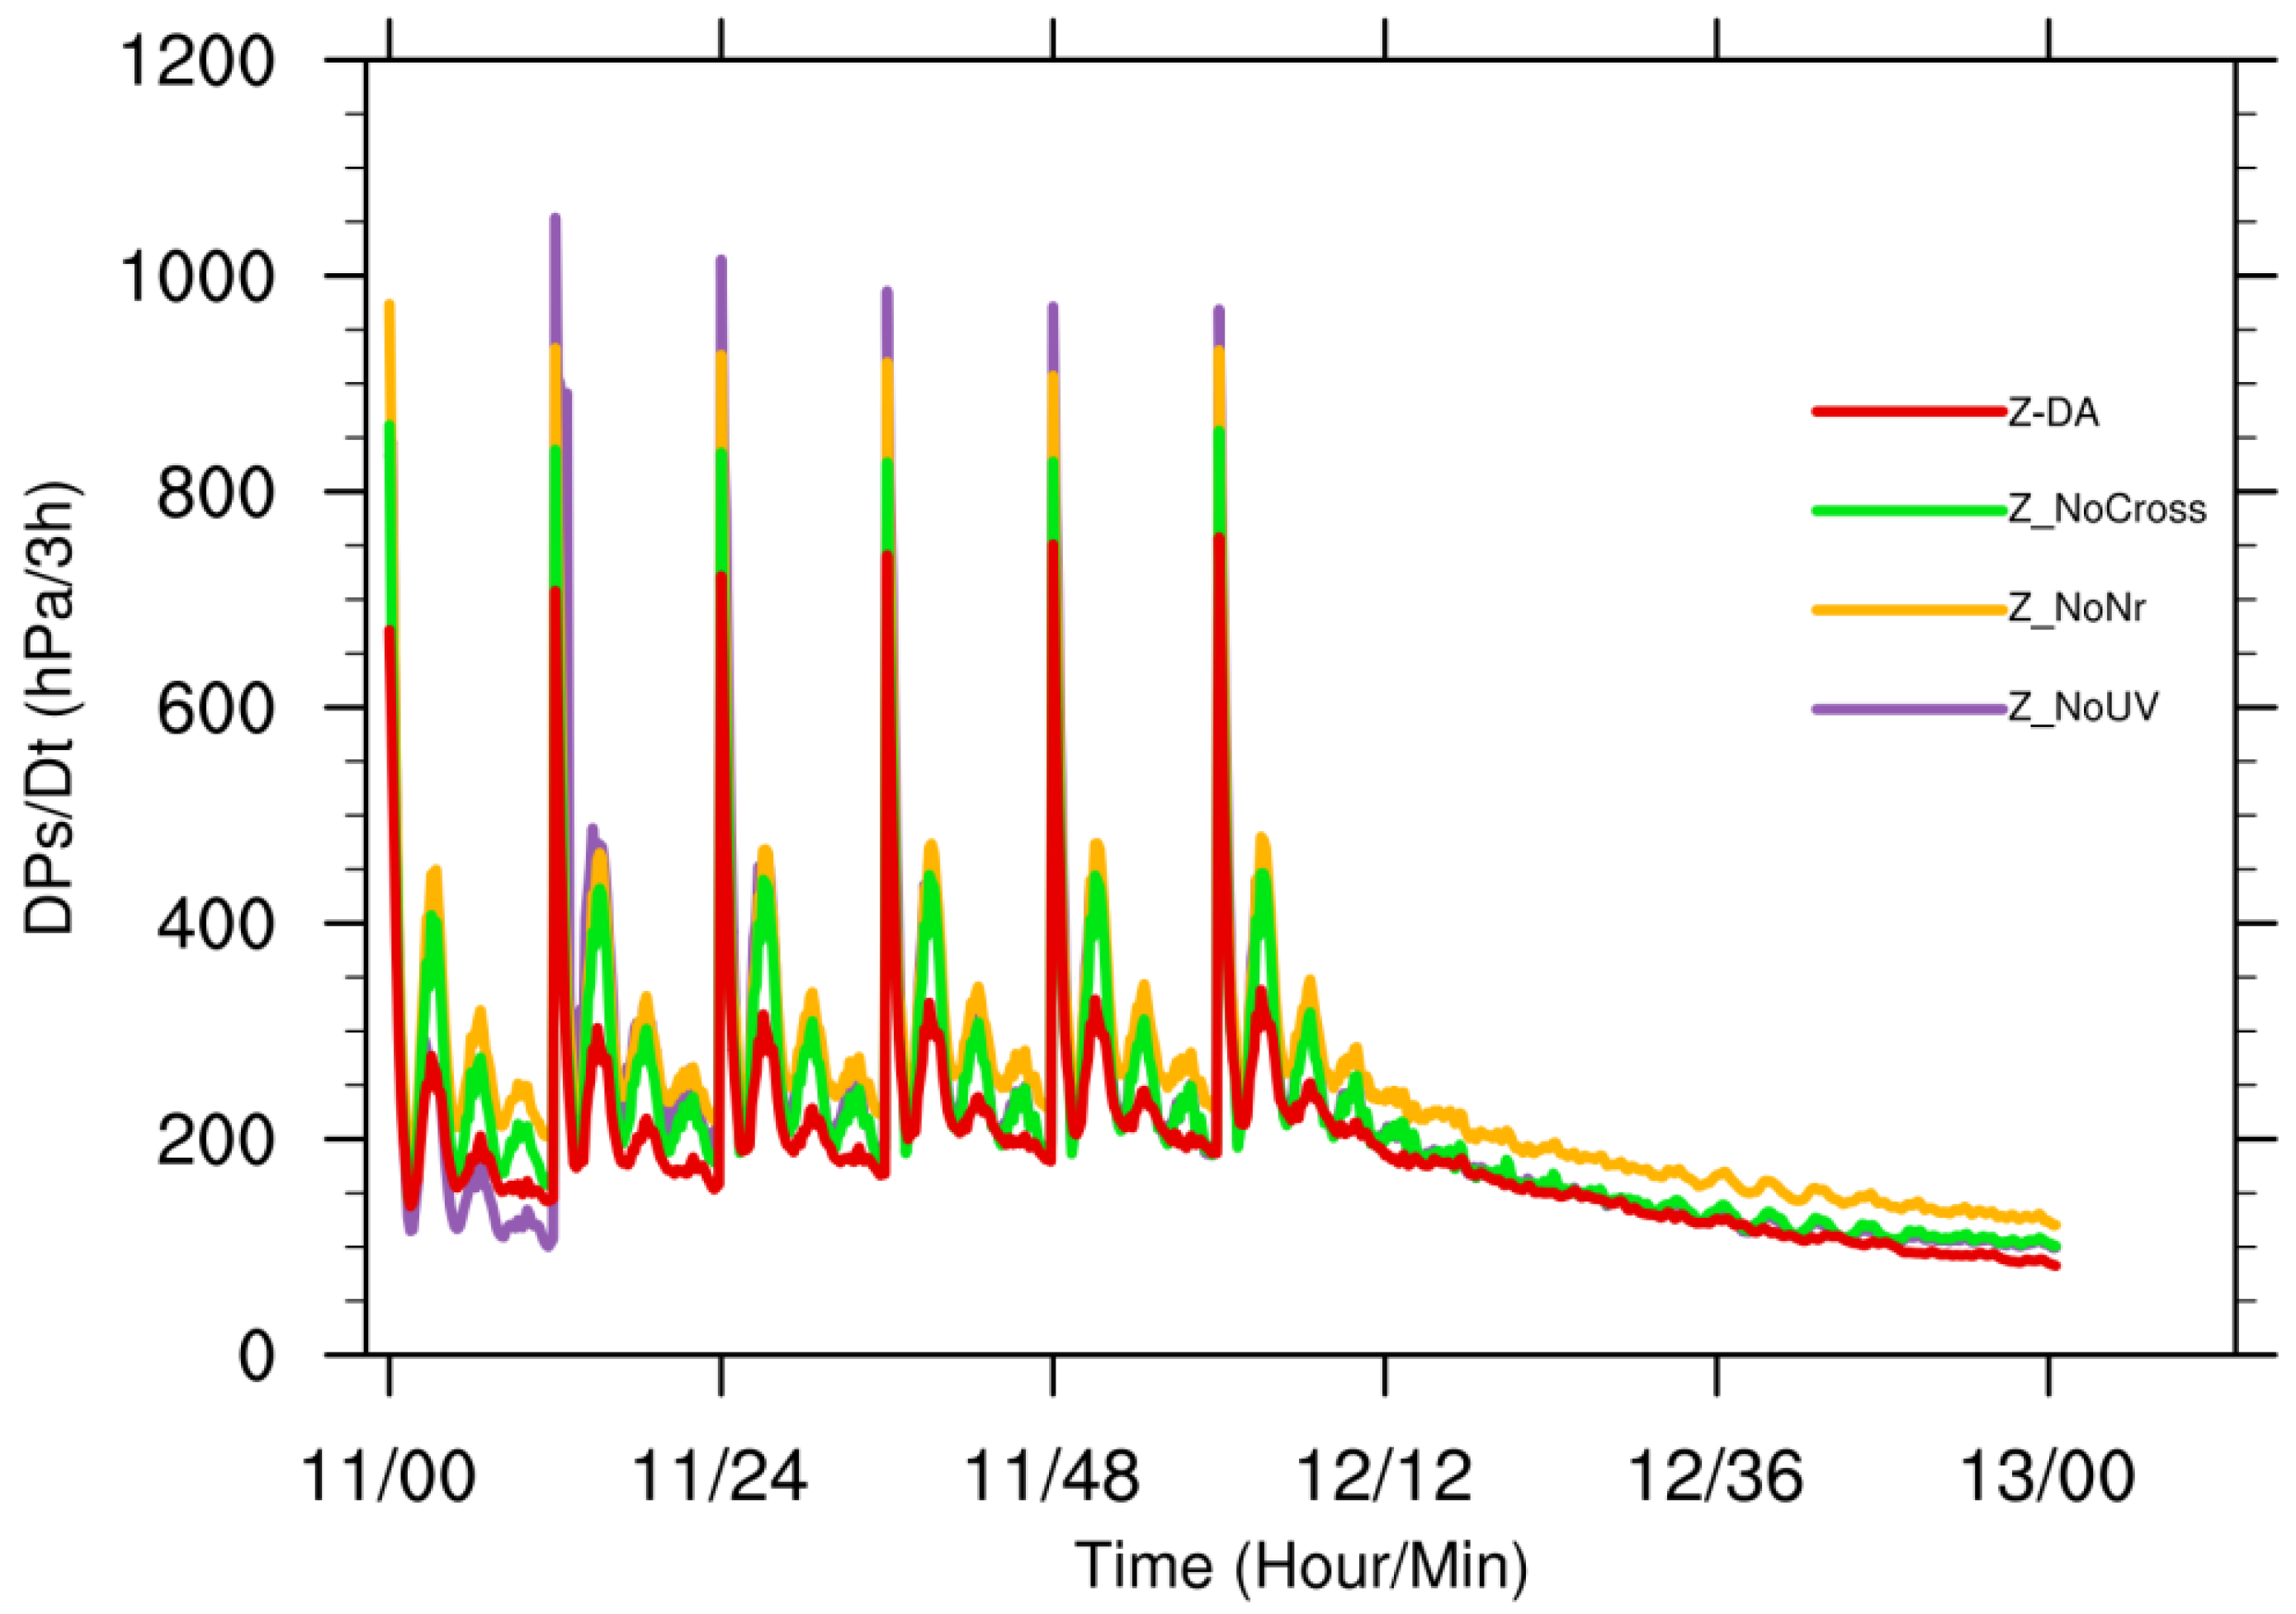
3.1. Impact on TC Analysis and Forecast

At the end of assimilation cycles (12,000 UTC), the forecasted and analyzed composite reflectivity of experiments CNTL and Z-DA are presented in Figure 3b,c. There was an obvious asymmetrical double eye-wall structure with the strongest reflectivity in the northwestern quadrant in the observed truth (Figure 3a). This feature was missing in the CNTL, but well-captured in experiment Z-DA. Furthermore, CNTL showed stronger and wider inner-core circulations, especially an overestimated precipitation area that occurred in the northern quadrant. In experiment Z-DA, a weaker and tighter inner core appeared compared to that in CNTL, the overestimated bias was corrected, and the rainband structures were much closer to the truth.
The positive impact of radar assimilation on the analysis extended to the following forecasts (Figure 3d–l). For the 12 min forecast after DA (Figure 3d–f), CNTL still exhibited wilder and more asymmetric inner rain bands, and was missing a double eye-wall. In contrast, the forecast initiated from Z-DA analysis was closer to radar observations in bith the inner core and the region of outer spiral rain bands with weaker and more evenly distributed precipitation on the eastern coastal area in Zhejiang province. These improvements in precipitation lasted in the following forecast times (Figure 3g–i).
Figure 4 shows the horizontal wind speed and pressure of the analyses in the final cycle (1200 UTC, 9 August 2019) for experiments CNTL and Z-DA at a height of 1 km above the ground and in the vertical west–east cross-section through the individual vortex center of each experiment. Compared with CNTL, the wind speed was significantly greater, and the central pressure was lower in experiment Z-DA (Figure 4a,b). For experiment CNTL, the vortex was asymmetric with the strongest wind speed on the eastern side of the TC center (Figure 4c,d). With radar data assimilation, experiment Z-DA had a maximal wind of over 60 m/s, compared with 56 m/s in the CNTL. The height of the wind speed exceeding 44 m/s was over 3 km in the western side in experiment Z-DA, whereas it reached only 1 km in CNTL. Wind speeds exceeding 36 m/s extended to 6 km on both sides of the vortex in experiment Z-DA. These indicate that a deeper and more symmetrical vortex is obtained when reflectivity data are assimilated.

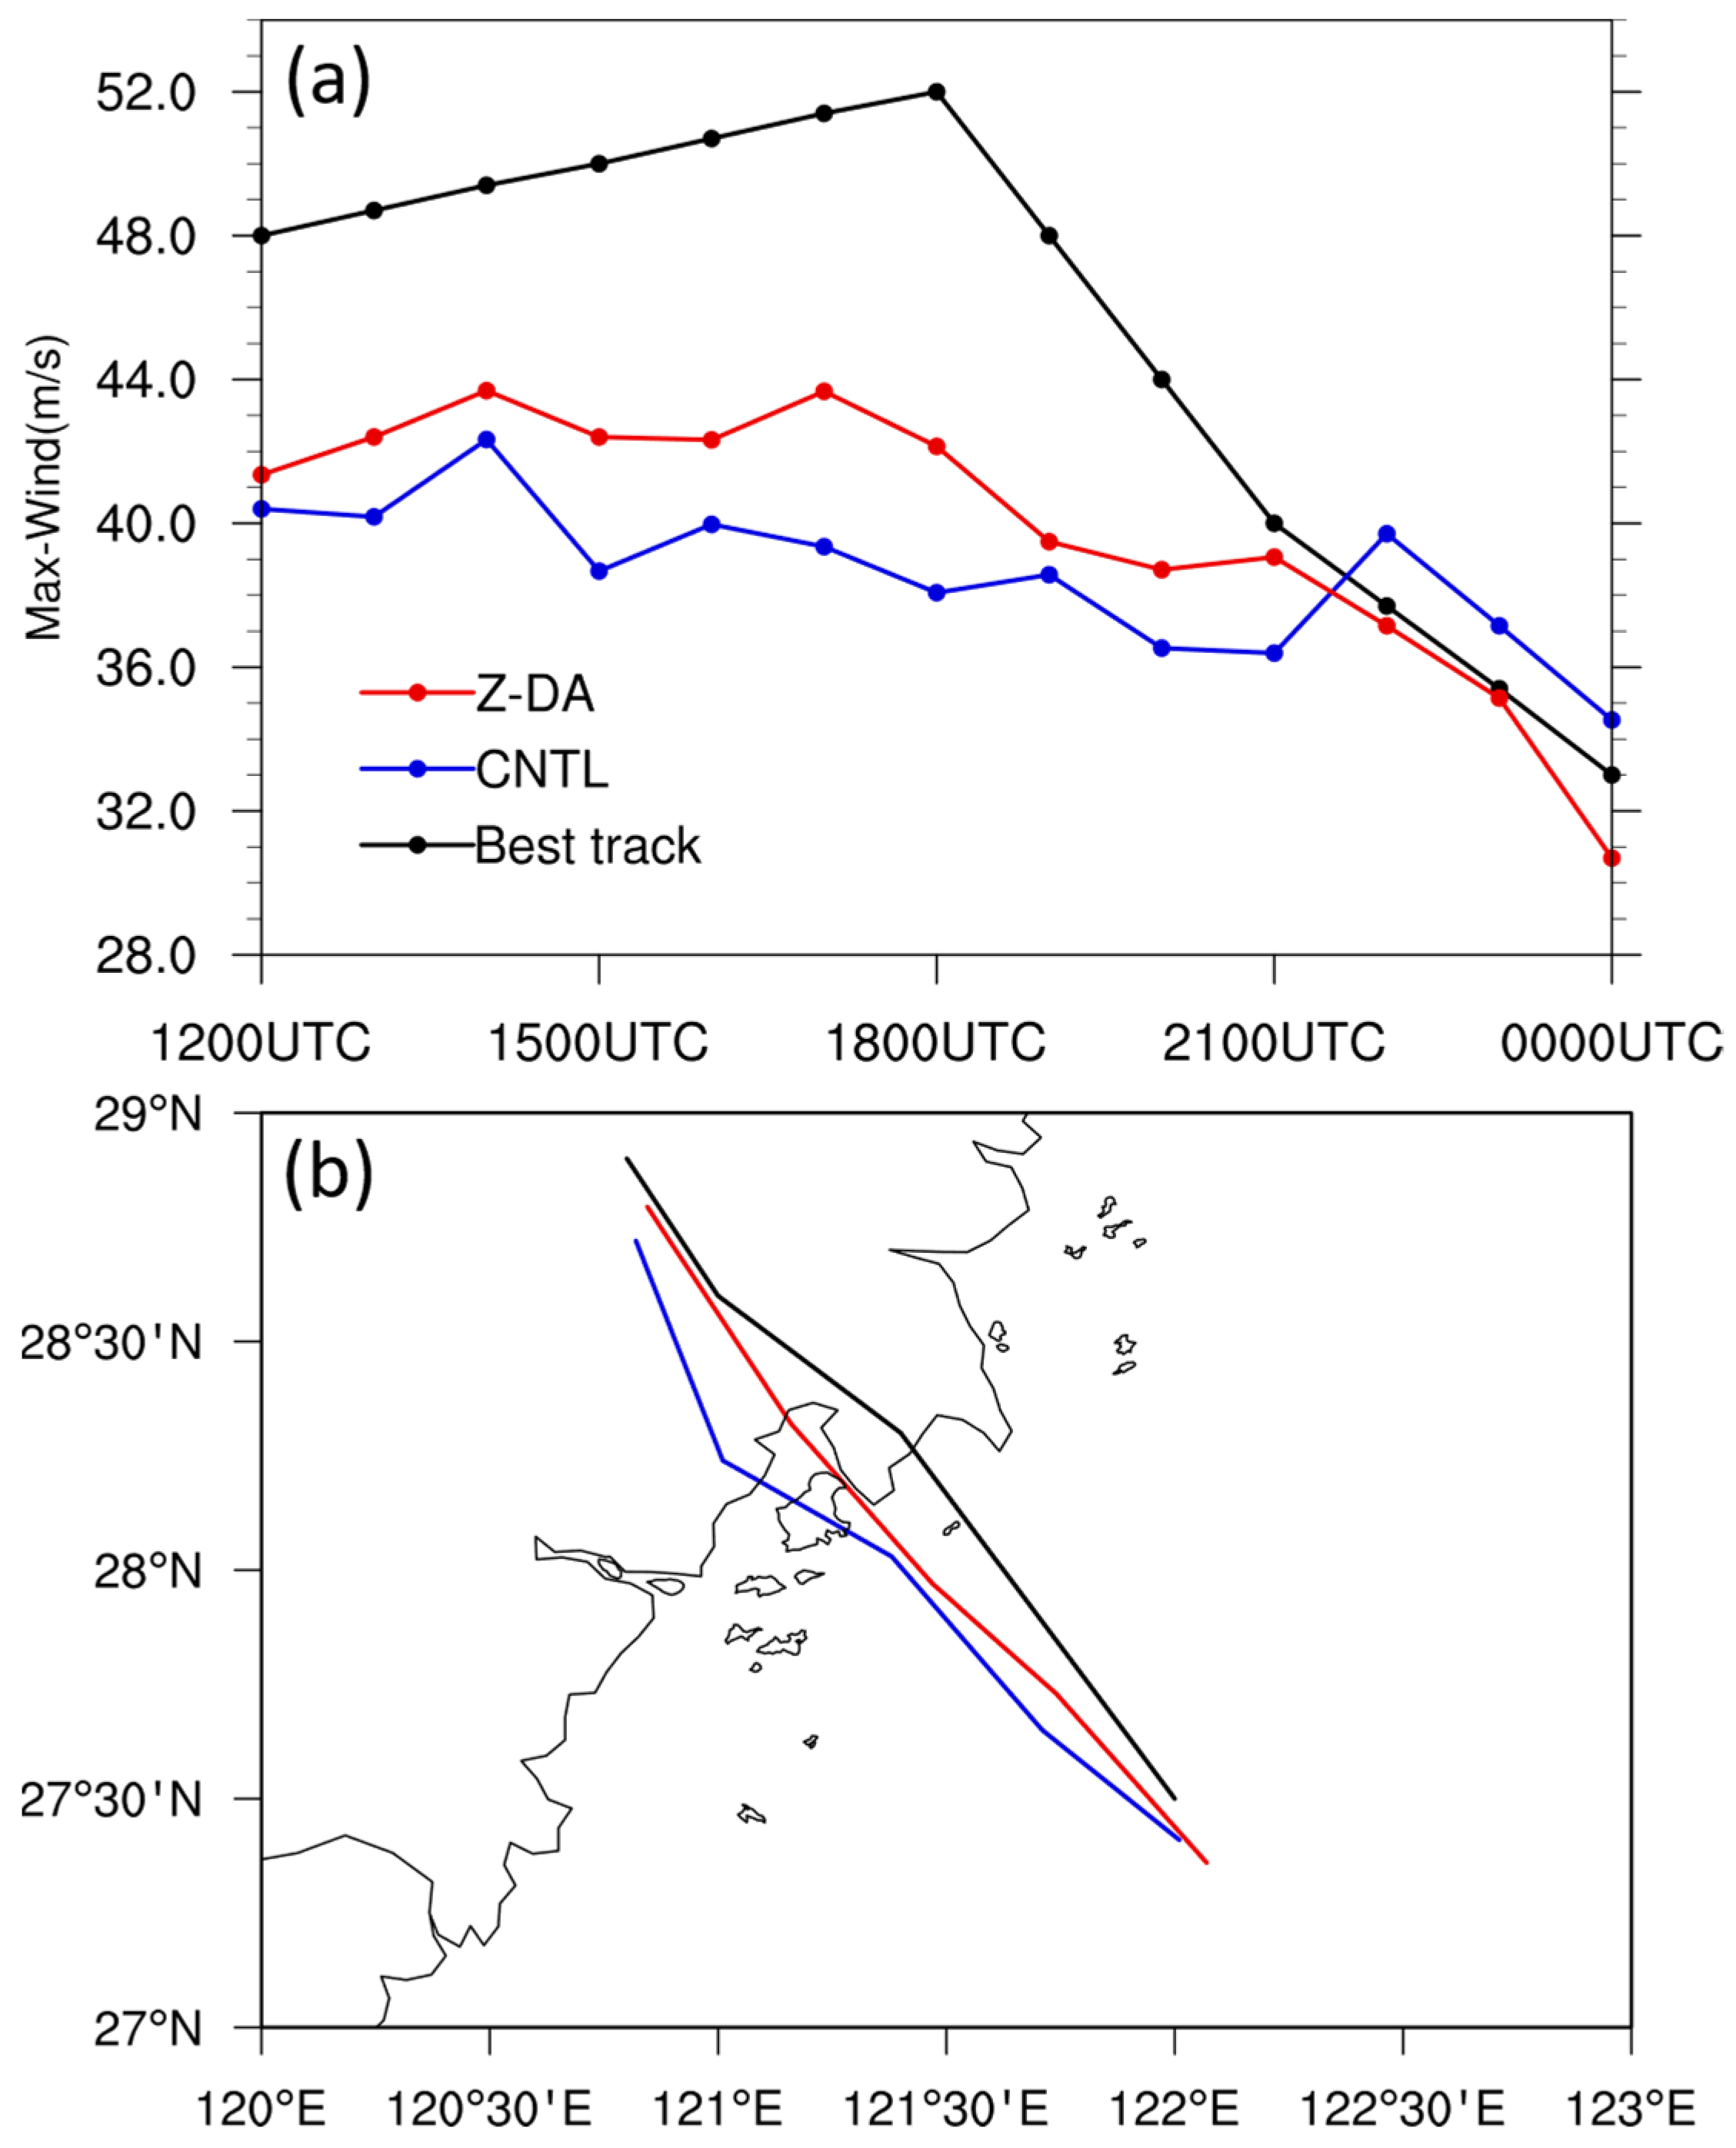
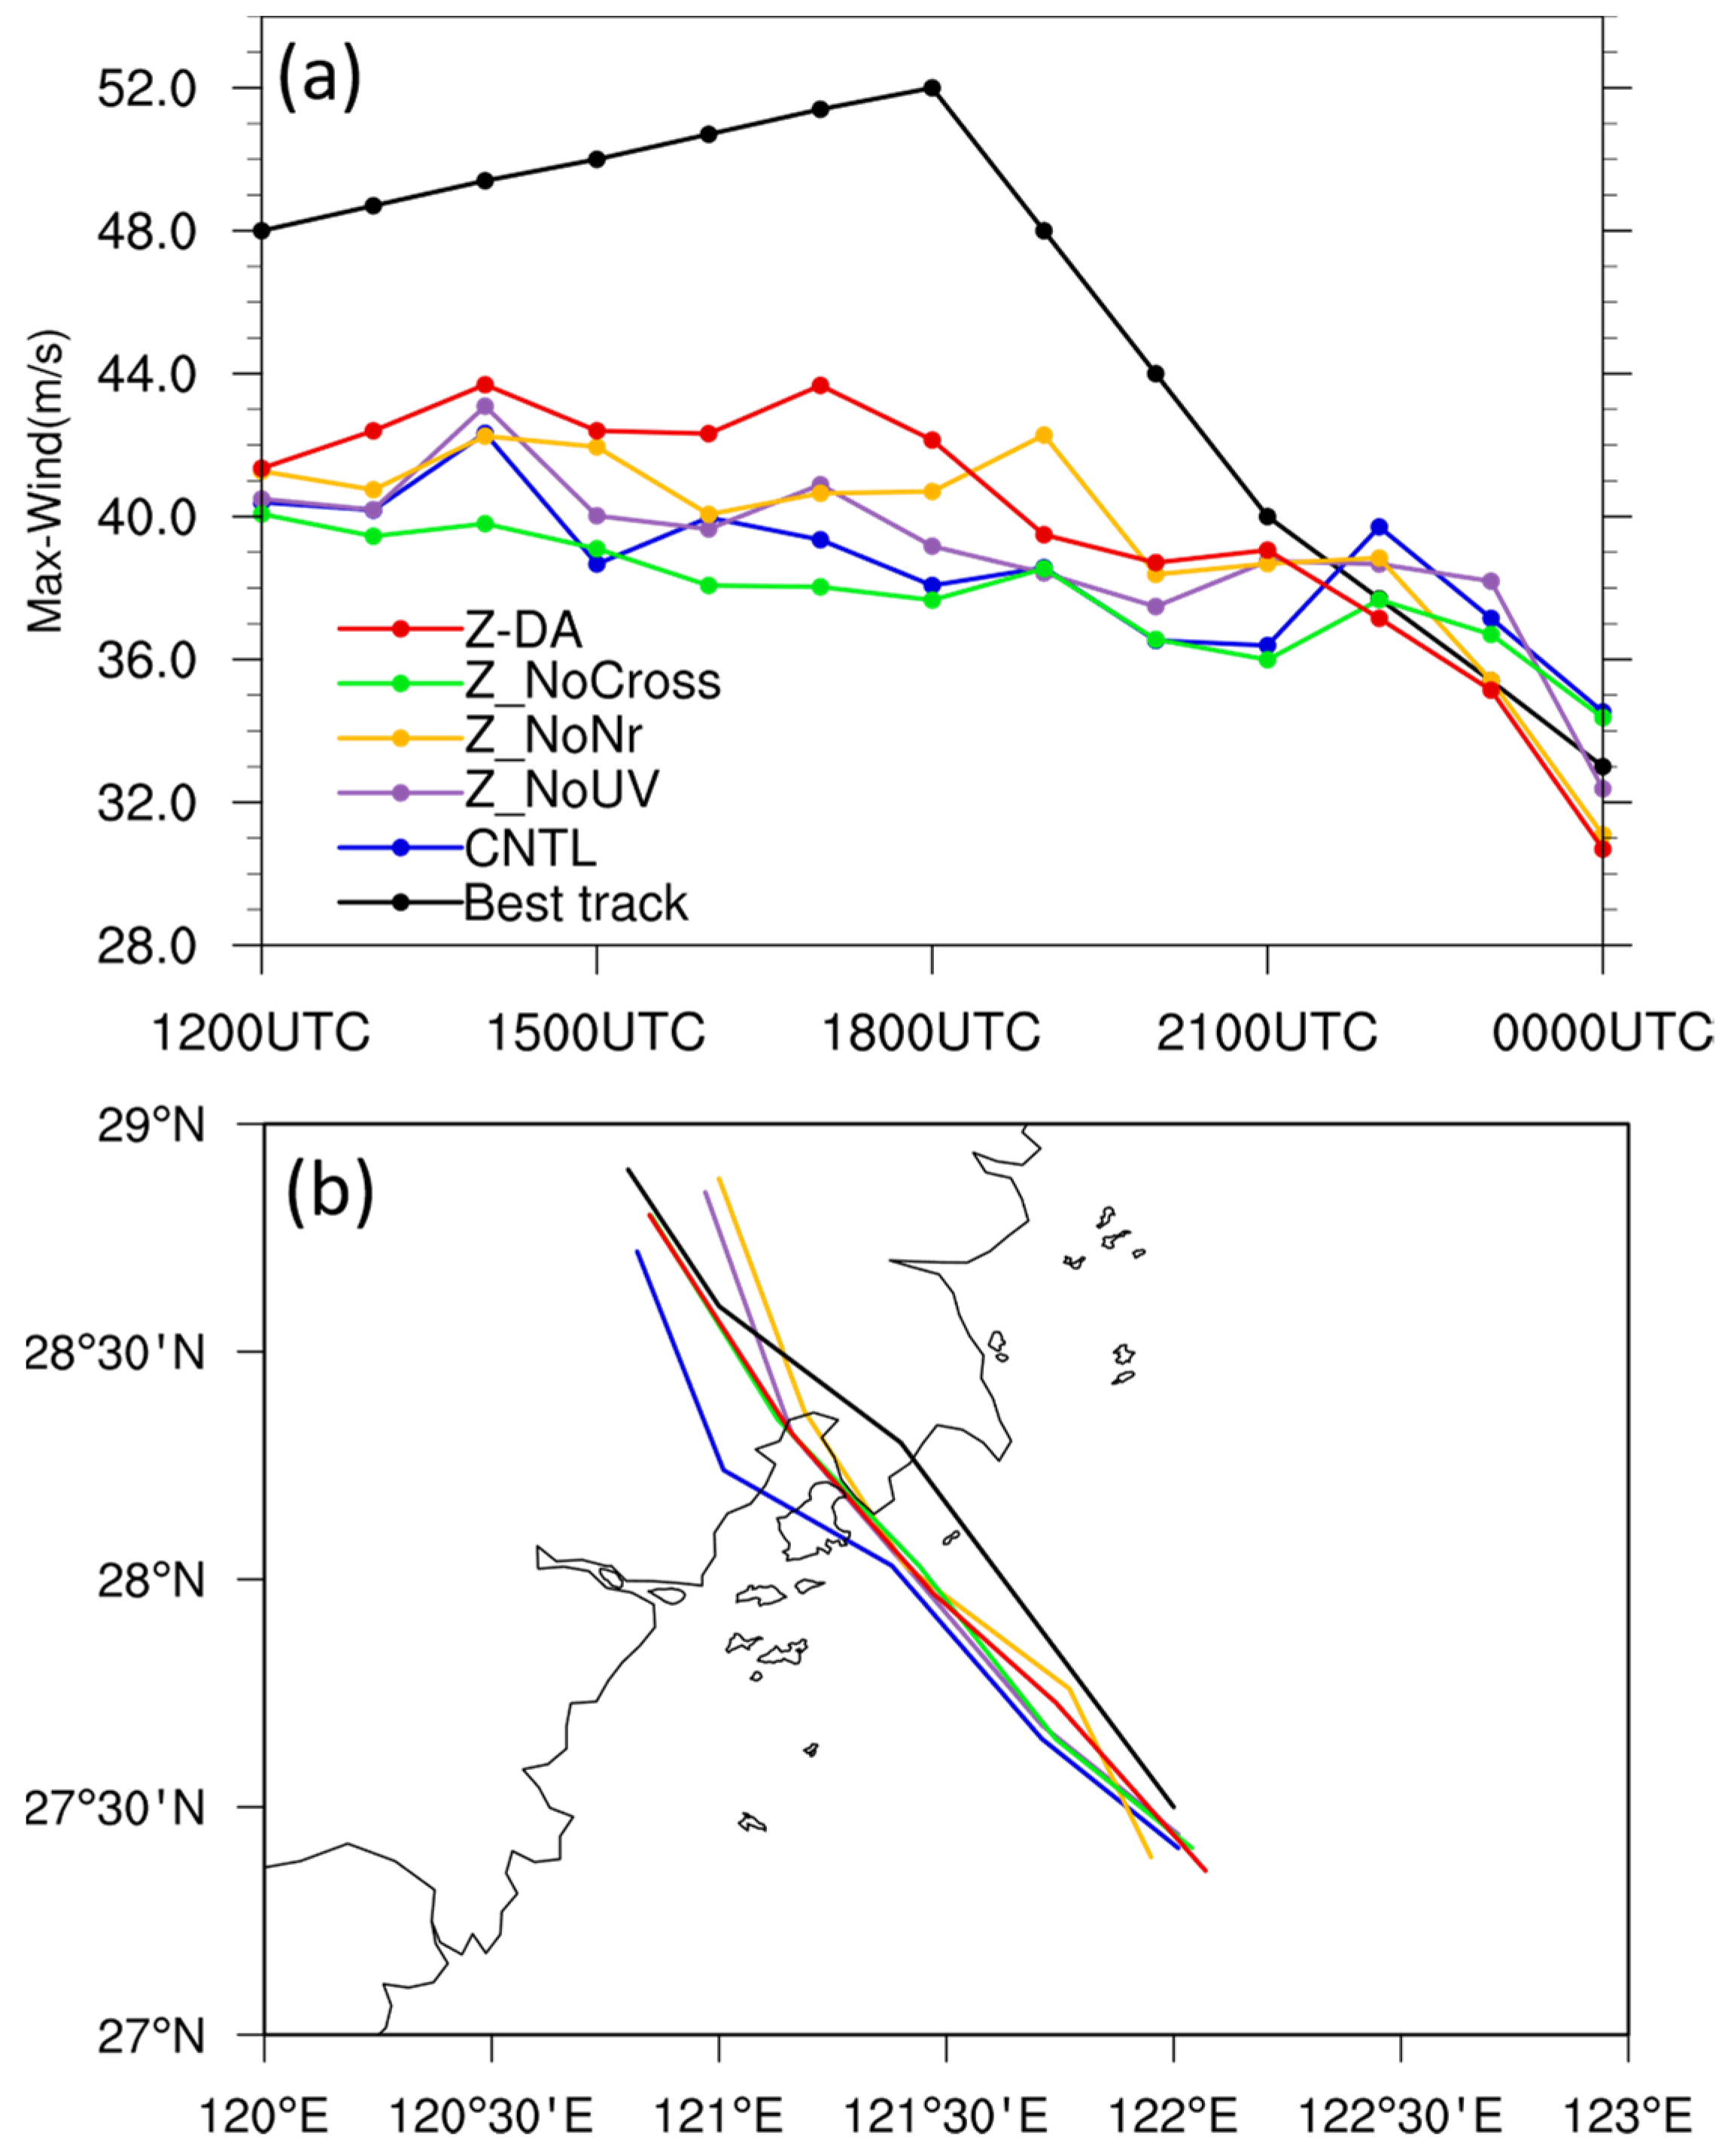
3.2. Intensity and Track Forecast

Figure 5 shows a comparison of the track and intensity between experiments CNTL and Z-DA for a 12 h forecast from 1200 UTC to 0000 UTC, 10 August, together with the observed best CMA track. Although the maximal wind speeds were underestimated, a clear improvement was found with reflectivity data assimilation compared to CNTL. Starting from slightly stronger maximal surface winds, experiment Z-DA had a persistent smaller intensity error throughout the forecast period (Figure 5a), indicating that radar reflectivity significantly impacted both the analysis and forecast. Regarding the track, CNTL showed an obvious westward bias compared to the best track. With radar data assimilation, experiment Z-DA reduced the westward displacement error and yielded better track results. Reflectivity data covered only the vortex circulation in the examined case, and the environmental field (a dominant factor for TC track) was actually not updated due to the relatively short localization length. With more radar data in the environmental field, the track forecast might be further improved.

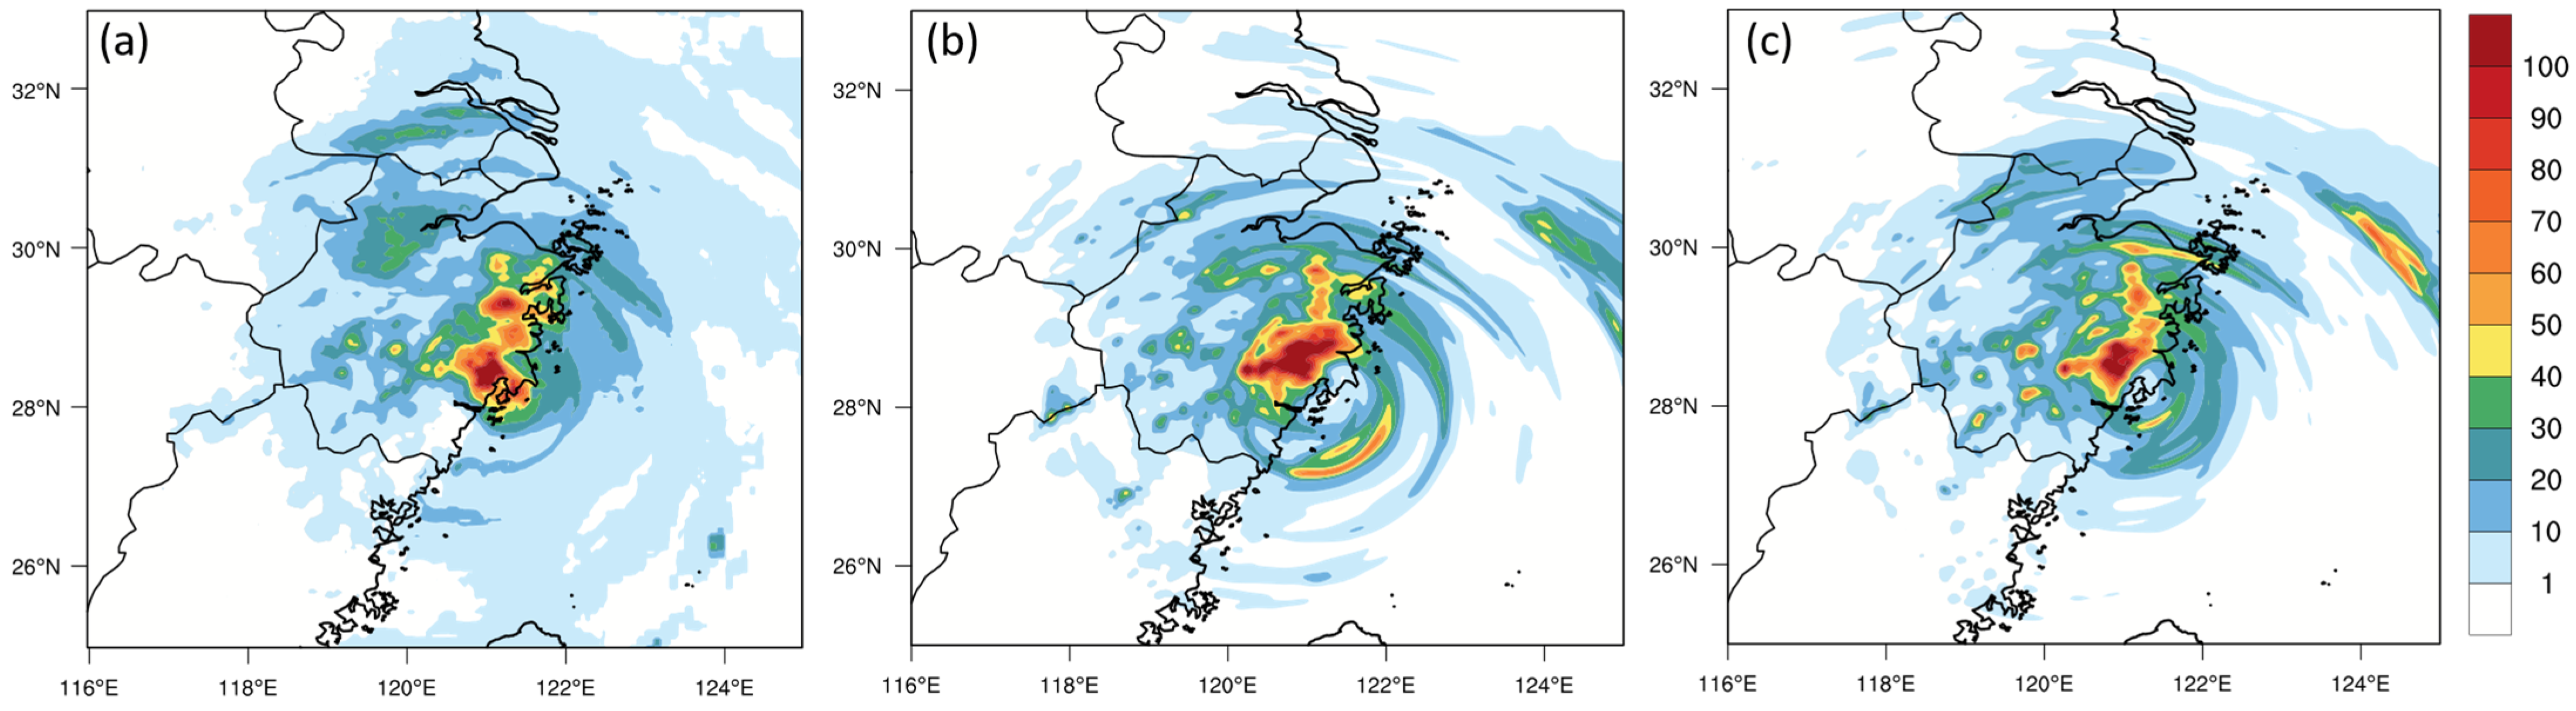
3.3. Precipitation Forecast

Figure 6 presents the 3 h accumulated precipitation from 1800 UTC to 2100 UTC, 9 August, for both CNTL and Z-DA along with CMA precipitation observations. As verified against the observations, CNTL had a broader maximal rain band with a westward displacement around the inner core, and underestimated the precipitation north of the vortex, especially in the area between the city of Shanghai and Jiangsu province. The assimilation of reflectivity in Z-DA helped in decreasing both the overestimation in the inner core and underestimation in the north, adjusting the rainfall pattern closer to observations.

4. Sensitivity Experiments

The ability of EnKF to update certain state variables needs to be further examined, considering that the degree of freedom of analytical variables increased with a DM MP scheme. The analysis and forecast root-mean-square innovations (RMSIs) of sensitivity tests without updating certain state variables are displayed in Figure 7, along with the Z-DA and CNTL experiments as a benchmark or reference. All the experiments with radar data assimilation were obviously better than CNTL. Among them, the RMSIs of Z_NoCross without updating all large-scale cross-variables, including horizontal and vertical wind components, potential temperature, and water vapor, were obviously the largest for all five assimilation cycles. If only excluding the horizontal wind, the result of Z_noUV was between those of Z-DA and Z_NoCross, indicating that our assimilation could better update all the large-scale variables through ensemble background error covariance. Furthermore, the RMSIs of Z_NoNr without updating the number concentrations of rain were also clearly larger than those of Z-DA at all analytical cycles, suggesting that an imbalance between mixing ratios and the corresponding total number concentrations may exist when only mixing ratios are updated. Considering that Z-DA had the lowest RMSIs, it is suggested to update both microphysical and large-scale variables in the current EnKF system.
The impacts of not updating certain state variables on the imbalance introduced by analysis were further investigated. In Figure 8, the domain-averaged absolute surface pressure tendency, an important criterion for evaluating imbalance, was calculated during assimilation cycles and the first hour of forecast [49]. The larger the pressure tendencies were, the less the balance was. Among all the sensitivity experiments without updating certain variables, pressure tendencies had higher values and more dramatic oscillation than those in Z-DA. These indicate that updated state variables missing in sensitivity tests could introduce more noise and provoke greater imbalance into analyses. Experiment Z-DA showed the smallest pressure tendencies, suggesting that updating all state variables leads to much more physically consistent analyses in the current reflectivity assimilation.
We also examined the track and intensity forecast for all sensitivity experiments (Figure 9). Overall, experiment Z-DA with all variables updated had the relatively smallest errors for both intensity and track forecast, probably because the Z-DA experiment was not only less unbalanced, but was also able to properly update all state variables. When only hydrometer variables were updated, most of the benefits of assimilating reflectivity data were lost, and the intensity forecast was even worse than that in CNTL without assimilating radar reflectivity.

5. Conclusions and Discussion

Using the WRF model and GSI-EnKF system with radar DA capabilities, the impacts of direct radar reflectivity assimilation associated with a DM MP on analysis and forecast for typhoon Lekima (2019) were investigated. The same Thompson MP scheme was employed in both the WRF simulation and the observational operator for EnKF DA. As the first attempt to directly assimilate radar reflectivity by EnKF using a DM MP scheme for a real TC case, the reflectivity observations from one coastal WSR-88Ds radar were assimilated every 12 min over a 1 h DA window. Experiments with and without assimilating reflectivity data were conducted. Results show that the direct assimilation of reflectivity significantly reduced the RMSEIs of both analyses and forecasts. Compared to those in experiment CNTL without assimilation, analyses in the Z-DA experiment at the final cycle were much more accurate, with the circulations and structures much closer to the observations with double eye-wall structures and stronger wind speeds. With the better analyses, experiment Z-DA was able to improve Lekima’s forecast skills in terms of track, intensity, and precipitation.
Additional sensitivity experiments were conducted to investigate the underconstraint issue due to the increased degree of freedom associated with the DM MP scheme. The results show that experiment Z-DA with all analytical variables updated produced the best analytical fit to the reflectivity observations and the smallest forecast error growth rate. The three sensitivity experiments (Z_NoCross, Z_NoUV, and Z_NoNr) without updating certain analytical variables produced worse results than those of experiment Z-DA for both analyses and forecasts, while differences among the three sensitivity experiments were relatively significant. The worst results in Z_NoCross were likely due to the lack of dynamic consistency in the analyzed fields. To understand the impact of updating different state variables, the mean absolute values of surface pressure tendency were examined. Experiment Z-DA, updating both hydrometers and other large-scale variables not directly involved in observation operator of reflectivity, had the smallest imbalance, resulting in the largest improvement in the forecast skill of intensity and track. This result indicates that our EnKF framework could handle the increased degree of freedom issue associated with the DM MP scheme, which is inconsistent with that in Dong and Xue [28], who used reflectivity to update only pressure and hydrometers due to the negative impact found when updating other large-scale variables. One possible reason is that more reliable ensemble covariance was obtained in the current simulation; further investigation and research are needed in the future.
As the first attempt to directly assimilate radar reflectivity based on a DM MP for TC application, this study is meaningful for exploring the potential of radar data in TC forecast. However, only one case of typhoon was studied, so more experiments with more TC cases are essential to obtain robust conclusions. Further improvement may also be possible by investigating many other DA factors, such as the observation errors associated with radar operator and adaptive vertical localization.

Author Contributions

Conceptualization, J.L. and H.L.; Data curation, J.L. and Y.Z.; Methodology, J.L. and M.X.; Project administration, J.L. and H.L.; Software, Y.Z.; Supervision, H.L. and M.X.; Writing—original draft, J.L.; Writing—review & editing, H.L. and M.X. All authors have read and agreed to the published version of the manuscript.

Funding

This work was primarily sponsored by the Program of Shanghai Academic/Technology Research Leader (21XD1404500), S&T Development Fund of STI (2020KJFZ10), and Shanghai Sailing Program (19YF1458700), supported in part by the Research Program from Science and Technology Committee of Shanghai (no. 19dz1200101), the National Natural Sciences Foundation of China (41575107), the Fujian Key Laboratory of Severe Weather Open Foundation (2021TFS01), and the Typhoon Scientific and Technological Innovation Group of Shanghai Meteorological Service.

Data Availability Statement

Not applicable.

Acknowledgments

Thanks are given to Youngsun Jung from the NOAA for observation operator development of radar reflectivity and technical supports.

Conflicts of Interest

The authors declare no conflict of interest.

References

  1. Marks, F.D., Jr. State of the science: Radar view of tropical cyclones. In Radar and Atmospheric Science; Meteorological Monograph No. 30; American Meteorological Society: Boston, MA, USA, 2003; pp. 33–73. [Google Scholar]
  2. Weng, Y.; Zhang, M.; Zhang, F. Advanced data assimilation for cloud-resolving hurricane initialization and prediction. Comput. Sci. Eng. 2011, 13, 40–49. [Google Scholar] [CrossRef]
  3. Zhang, F.; Weng, Y.; Gamache, J.F.; Marks, F.D. Performance of convection-permitting hurricane initialization and prediction during 2008–2010 with ensemble data assimilation of inner-core airborne Doppler radar observations. Geophys. Res. Lett. 2011, 38, L15810. [Google Scholar] [CrossRef]
  4. Zhao, Q.; Jin, Y. High-Resolution Radar Data Assimilation For Hurricane Isabel (2003) At Landfall. Bull. Am. Meteorol. Soc. 2008, 89, 1355–1372. [Google Scholar] [CrossRef]
  5. Pu, Z.; Li, X.; Sun, J. Impact of airborne Doppler radar data assimilation on the numerical simulation of intensity changes of hurricane Dennis near a landfall. J. Atmos. Sci. 2009, 66, 3351–3365. [Google Scholar] [CrossRef]
  6. Xiao, Q.; Zhang, X.; Davis, C.; Tuttle, J.; Holland, G.; Fitzpatrick, P.J. Experiments of hurricane initialization with airborne Doppler radar data for the advanced research hurricane WRF (AHW) model. Mon. Weather Rev. 2009, 137, 2758–2777. [Google Scholar] [CrossRef]
  7. Zhao, K.; Xue, M. Assimilation of coastal Doppler radar data with the ARPS 3DVAR and cloud analysis for the prediction of Hurricane Ike (2008). Geophys. Res. Lett. 2009, 36, L12803. [Google Scholar] [CrossRef]
  8. Zhao, K.; Xue, M.; Lee, W.-C. Assimilation of GBVTD-retrieved winds from single-Doppler radar for short-term forecasting of Super Typhoon Saomai (0608) at landfall. Q. J. R. Meteorol. Soc. 2012, 138, 1055–1071. [Google Scholar] [CrossRef]
  9. Wang, M.; Xue, M.; Zhao, K.; Dong, J. Assimilation of T-TREC-Retrieved Winds from Single-Doppler Radar with an Ensemble Kalman Filter for the Forecast of Typhoon Jangmi (2008). Mon. Weather Rev. 2014, 142, 1892–1907. [Google Scholar] [CrossRef]
  10. Zhu, L.; Wan, Q.; Shen, X.; Meng, Z.; Zhang, F.; Weng, Y.; Sippel, J.; Gao, Y.; Zhang, Y.; Yue, J. Prediction and Predictability of High-Impact Western Pacific Landfalling Tropical Cyclone Vicente (2012) through Convection-Permitting Ensemble Assimilation of Doppler Radar Velocity. Mon. Weather Rev. 2016, 144, 21–43. [Google Scholar] [CrossRef]
  11. Yue, J.; Meng, Z.; Yu, C.-K.; Cheng, L.-W. Impact of coastal radar observability on the forecast of the track and rainfall of Typhoon Morakot (2009) using WRF-based ensemble Kalman filter data assimilation. Adv. Atmos. Sci. 2017, 34, 66–78. [Google Scholar] [CrossRef]
  12. Dowell, D.C.; Wicker, L.J.; Snyder, C. Ensemble Kalman filter assimilation of radar observations of the 8 May 2003 Oklahoma City supercell: Influence of reflectivity observations on storm-scale analysis. Mon. Weather Rev. 2011, 139, 272–294. [Google Scholar] [CrossRef]
  13. Gao, J.; Stensrud, D.J. Assimilation of reflectivity data in a convective-scale, cycled 3DVAR framework with hydrometeor classification. J. Atmos. Sci. 2012, 69, 1054–1065. [Google Scholar] [CrossRef]
  14. Hu, M.; Xue, M.; Brewster, K. 3DVAR and cloud analysis with WSR-88D level-II data for the prediction of the Fort Worth, Texas, tornadic thunderstorms. Part I: Cloud analysis and its impact. Mon. Weather Rev. 2006, 134, 675–698. [Google Scholar] [CrossRef]
  15. Dawson, D.T.; Xue, M. Numerical Forecasts of the 15–16 June 2002 Southern Plains Mesoscale Convective System: Impact of Mesoscale Data and Cloud Analysis. Mon. Weather Rev. 2006, 134, 1607–1629. [Google Scholar] [CrossRef]
  16. Weygandt, S.; Benjamin, S. Radar reflectivity–based initialization of precipitation systems using a diabatic digital filter within the Rapid Update Cycle. In Proceedings of the 22nd Conference on Weather Analysis and Forecasting/18th Conference on Numerical Weather Prediction, Park City, UT, USA, 25 June 2007; Meteor. Soc., 1B.7.. Available online: https://ams.confex.com/ams/22WAF18NWP/techprogram/paper_124540.htm (accessed on 25 June 2007).
  17. Gao, J.; Ge, G.; Stensrud, D.J.; Xue, X. The relative importance of assimilating radial velocity and reflectivity data. In Proceedings of the 23nd Conference on Weather Analysis and Forecasting/19th Conference on Numerical Weather Prediction, Omaha, NB, USA, 1–5 June 2009; Meteor. Soc., 8A.1. 2009. Available online: http://ams.confex.com/ams/23WAF19NWP/techprogram/paper_154286.htm (accessed on 3 June 2009).
  18. Sun, J.; Crook, N.A. Dynamical and microphysical retrieval from Doppler radar observations using a cloud model and its adjoint. Part I: Model development and simulated data experiments. J. Atmos. Sci. 1997, 54, 1642–1661. [Google Scholar] [CrossRef]
  19. Wang, H.; Sun, J.; Fan, S.; Huang, X.-Y. Indirect assimilation of radar reflectivity with WRF 3D-Var and its impact on prediction of four summertime convective events. J. Appl. Meteor. Climatol. 2013, 52, 889–902. [Google Scholar] [CrossRef]
  20. Carley, J.R. Hybrid Ensemble-3DVar Radar Data Assimilation for the Short-Term Prediction of Convective Storms. Ph.D. Dissertation, Department of Earth, Atmospheric, and Planetary Sciences, Purdue University, West Lafayette, IN, USA, 2012; p. 205. [Google Scholar]
  21. Wang, Y.; Wang, X. Direct Assimilation of Radar Reflectivity without Tangent Linear and Adjoint of the Nonlinear Observation Operator in the GSI-Based EnVar System: Methodology and Experiment with the 8 May 2003 Oklahoma City Tornadic Supercell. Mon. Weather Rev. 2017, 145, 1447–1471. [Google Scholar] [CrossRef]
  22. Liu, C.; Xue, M.; Kong, R. Direct Assimilation of Radar Reflectivity Data Using 3DVAR: Treatment of Hydrometeor Background Errors and OSSE Tests. Mon. Weather Rev. 2019, 147, 17–29. [Google Scholar] [CrossRef]
  23. Chen, L.; Liu, C.; Xue, M.; Zhao, G.; Kong, R.; Jung, Y. Use of Power Transform Mixing Ratios as Hydrometeor Control Variables for Direct Assimilation of Radar Reflectivity in GSI En3DVar and Tests with Five Convective Storm Cases. Mon. Weather Rev. 2021, 149, 645–659. [Google Scholar] [CrossRef]
  24. Kong, R.; Xue, M.; Liu, C. Development of a Hybrid En3DVar Data Assimilation System and Comparisons with 3DVar and EnKF for Radar Data Assimilation with Observing System Simulation Experiments. Mon. Weather Rev. 2018, 146, 175–198. [Google Scholar] [CrossRef]
  25. Dowell, D.C.; Zhang, F.; Wicker, L.J.; Snyder, C.; Crook, N.A. Wind and temperature retrievals in the 17 May 1981 Arcadia, Oklahoma supercell: Ensemble Kalman filter experiments. Mon. Weather Rev. 2004, 132, 1982–2005. [Google Scholar] [CrossRef]
  26. Tong, M.; Xue, M. Ensemble Kalman filter assimilation of Doppler radar data with a compressible nonhydrostatic model: OSS experiments. Mon. Weather Rev. 2005, 133, 1789–1807. [Google Scholar] [CrossRef]
  27. Jung, Y.; Zhang, G.; Xue, M. Assimilation of simulated polarimetric radar data for a convective storm using ensemble Kalman fifilter. Part I: Observation operators for reflflectivity and polarimetric variables. Mon. Weather Rev. 2008, 136, 2228–2245. [Google Scholar] [CrossRef]
  28. Dong, J.; Xue, M. Assimilation of radial velocity and reflectivity data from coastal WSR-88D radars using an ensemble Kalman filter for the analysis and forecast of landfalling hurricane Ike (2008). Q. J. R. Meteorol. Soc. 2013, 139, 467–487. [Google Scholar] [CrossRef]
  29. Li, H.; Kalnay, E.; Miyoshi, T.; Danforth, C.M. Accounting for model errors in ensemble data assimilation. Mon. Weather Rev. 2009, 137, 3407–3419. [Google Scholar] [CrossRef]
  30. Seifert, A.; Beheng, K.D. A double-moment parameterization for simulating autoconversion, accretion and selfcollection. Atmos. Res. 2001, 59–60, 265–281. [Google Scholar] [CrossRef]
  31. Milbrandt, J.A.; Yau, M.K. A Multimoment Bulk Microphysics Parameterization. Part II: A Proposed Three-Moment Closure and Scheme Description. J. Atmos. Sci. 2005, 62, 3065–3081. [Google Scholar] [CrossRef]
  32. Morrison, H.; Grabowski, W.W. A Novel Approach for Representing Ice Microphysics in Models: Description and Tests Using a Kinematic Framework. J. Atmos. Sci. 2008, 65, 1528–1548. [Google Scholar] [CrossRef]
  33. Xue, M.; Jung, Y.; Zhang, G. State estimation of convective storms with a two-moment microphysics scheme and an ensemble Kalman filter: Experiments with simulated radar data. Q. J. R. Meteorol. Soc. 2010, 136, 685–700. [Google Scholar] [CrossRef]
  34. Jung, Y.; Xue, M.; Tong, M. Ensemble Kalman Filter Analyses of the 29–30 May 2004 Oklahoma Tornadic Thunderstorm Using One- and Two-Moment Bulk Microphysics Schemes, with Verification against Polarimetric Radar Data. Mon. Weather Rev. 2012, 140, 1457–1475. [Google Scholar] [CrossRef]
  35. Putnam, B.J.; Xue, M.; Jung, Y.; Snook, N.A.; Zhang, G. Ensemble Probabilistic Prediction of a Mesoscale Convective System and Associated Polarimetric Radar Variables Using Single-Moment and Double-Moment Microphysics Schemes and EnKF Radar Data Assimilation. Mon. Weather Rev. 2017, 145, 2257–2279. [Google Scholar] [CrossRef]
  36. Skamarock, W.C.; Klemp, J.B.; Dudhia, J.; Gill, D.O.; Barker, D.M.; Wang, W.; Powers, J.D. A Description of the Advanced Research WRF Version 2; (No. NCAR/TN-468+STR); University Corporation for Atmospheric Research: Boulder, CO, USA, 2005. [Google Scholar] [CrossRef]
  37. Thompson, G.; Field, P.R.; Rasmussen, R.M.; Hall, W.D. Explicit Forecasts of Winter Precipitation Using an Improved Bulk Microphysics Scheme. Part II: Implementation of a New Snow Parameterization. Mon. Weather Rev. 2008, 136, 5095–5115. [Google Scholar] [CrossRef]
  38. Hong, S.Y.; Noh, Y.; Dudhia, J. A new vertical diffusion package with an explicit treatment of entrainment processes. Mon. Weather Rev. 2006, 134, 2318–2341. [Google Scholar] [CrossRef]
  39. Chen, F.; Dudhia, J. Coupling an Advanced Land Surface–Hydrology Model with the Penn State–NCAR MM5 Modeling System. Part II: Preliminary Model Validation. Mon. Weather Rev. 2001, 129, 587–604. [Google Scholar] [CrossRef]
  40. Iacono, M.J.; Delamere, J.S.; Mlawer, E.J.; Shephard, M.W.; Clough, S.A.; Collins, W.D. Radiative forcing by long-lived greenhouse gases: Calculations with the AER radiative transfer models. J. Geophys. Res. 2008, 113, D13103. [Google Scholar] [CrossRef]
  41. Whitaker, J.S.; Hamill, T.M. Ensemble data assimilation without perturbed observations. Mon. Weather Rev. 2002, 130, 1913–1924. [Google Scholar] [CrossRef]
  42. Whitaker, J.S.; Hamill, T.M. Evaluating Methods to Account for System Errors in Ensemble Data Assimilation. Mon. Weather Rev. 2012, 140, 3078–3089. [Google Scholar] [CrossRef]
  43. Carlin, J.T.; Ryzhkov, A.V.; Snyder, J.C.; Khain, A. Hydrometeor mixing ratio retrievals for storm-scale radar data assimilation: Utility of current relations and potential benefits of polarimetry. Mon. Weather Rev. 2016, 144, 2981–3001. [Google Scholar] [CrossRef]
  44. Vivekanandan, J.; Raghavan, R.; Bringi, V.N. Polarimetric radar modeling of mixtures of precipitation particles. IEEE Trans. Geosci. Remote Sens. 1993, 31, 1017–1030. [Google Scholar] [CrossRef]
  45. Barker, D.M.; Huang, W.; Guo, Y.-R.; Bourgeois, A.; Xiao, Q. A three-dimensional variational data assimilation system for MM5: Implementation and initial results. Mon. Weather Rev. 2004, 132, 897–914. [Google Scholar] [CrossRef]
  46. Ying, M.; Zhang, W.; Yu, H.; Lu, X.; Feng, J.; Fan, Y.; Zhu, Y.; Chen, D. An overview of the China Meteorological Administration tropical cyclone database. J. Atmos. Ocean.Technol. 2014, 31, 287–301. [Google Scholar] [CrossRef]
  47. Lu, X.; Yu, H.; Ying, M.; Zhao, B.; Zhang, S.; Lin, L.; Bai, L.; Wan, R. Western North Pacific tropical cyclone database created by the China Meteorological Administration. Adv. Atmos. Sci. 2021, 38, 690–699. [Google Scholar] [CrossRef]
  48. Shen, Y.; Zhao, P.; Pan, Y.; Yu, J. A high spatiotemporal gauge-satellite merged precipitation analysis over China. J. Geophys. Res. 2014, 119, 3063–3075. [Google Scholar] [CrossRef]
  49. Lynch, P.; Huang, X.-Y. Initialization of the HIRLAM model using a digital filter. Mon. Weather Rev. 1992, 120, 1019–1034. [Google Scholar] [CrossRef]
Figure 1. Domain of the WRF model at 3 km horizontal resolution with radar reflectivity observations (shaded; units: dBZ) at 1200 UTC, 9 August; the rectangle indicates the location of the Wenzhou radar station.
Remotesensing 14 03987 g001
Figure 2. Workflow of the CNTL and the reflectivity DA experiments.
Remotesensing 14 03987 g002
Figure 3. Composite reflectivity (unit: dBZ) for the (left) observation, (middle) CNTL, and (right) Z-DA experiments during the analysis and forecast times (from top to bottom) at (ac) UTC 1200, (df) 1212 UTC, (gi) 1224 UTC, and (jl) 1300 UTC, 9 August 2019.
Remotesensing 14 03987 g003
Figure 4. (a,b) Horizontal wind speed (shaded, units: m/s) and pressure (contours, at 5 hPa intervals) at 1 km height at 1200 UTC, 9 August in experiments. (a) CNTL, (b) Z-DA. (c,d) East−west vertical cross−section of horizontal wind speed (shaded, units: m/s) through vortex center in experiments. (c) CNTL; (d) Z-DA.
Remotesensing 14 03987 g004
Figure 5. Predicted (a) maximal wind speed and (b) track for 12 h forecasts from 1200 UTC, 9 August, to 0000 UTC, 10 August 2019, for CNTL (blue lines), and Z-DA (red lines). The best CMA track is shown in black lines.
Remotesensing 14 03987 g005
Figure 6. The 3 h accumulated precipitation from 1800 UTC 2100 UTC on 9 August for (a) observations, (b) CNTL, (c) Z-DA.
Remotesensing 14 03987 g006
Figure 7. RMSIs of simulated reflectivity in experiments Z-DA (red line), Z_NoUV (purple line), Z_NoNr (orange line), and Z_NoCross (green line). The RMSI for experiment CNTL is shown in black line as a reference.
Remotesensing 14 03987 g007
Figure 8. Mean absolute pressure tendency during the five DA cycles and the first 1 h forecast for the four DA sensitivity experiments.
Remotesensing 14 03987 g008
Figure 9. As in Figure 5, but for experiments Z-DA (red lines), Z_NoCross (green lines), Z_NoNr (orange lines), Z_NoUV (purple lines), and CNTL (blue lines). Predicted (a) maximal wind speed and (b) track for 12 h forecasts from 1200 UTC, 9 August, to 0000 UTC, 10 August 2019.
Remotesensing 14 03987 g009
Table 1. List of experiments.
Experiment NameAssimilated DataAnalysis Variables Updated by EnKF
Z-DARadar reflectivityu, v, w, MU, θ, qv, qc, qi, qr, qs, qg and Nr
Z_NoNrRadar reflectivityAs in Z-DA, but Nr was not updated
Z_NoUVRadar reflectivityAs in Z-DA, but u and v were not updated
Z_NoCrossRadar reflectivityAs in Z-DA, but u, v, w, MU, θ and qv were not updated
CNTLNoneNone
Publisher’s Note: MDPI stays neutral with regard to jurisdictional claims in published maps and institutional affiliations.

