Article

The Change in Net Ecosystem Productivity and its Driving Mechanism in a Mountain Ecosystem of Arid Regions, Northwest China

1
Linze Inland River Basin Research Station, Key Laboratory of Ecohydrology of Inland River Basin, Northwest Institute of Eco-Environment and Resources, Chinese Academy of Sciences, Lanzhou 730000, China
2
University of Chinese Academy of Sciences, Beijing 100049, China
*
Author to whom correspondence should be addressed.
These authors contributed equally to this work.
Remote Sens. 2022, 14(16), 4046; https://doi.org/10.3390/rs14164046
Submission received: 18 July 2022 / Revised: 16 August 2022 / Accepted: 17 August 2022 / Published: 19 August 2022

Abstract

:
During the past several decades, the carbon budget in the dryland ecosystem has experienced great variation under the joint impact of climate change and anthropogenic interference. How the net ecosystem productivity (NEP) responds to climate change and human interference in the Qilian Mountains (QLM), Northwest China, remains unclear. To fill these gaps, we first estimated the NEP in the QLM and then quantified the independent and interactive influences of natural environment factors, climatic factors, and human activity intensity on the NEP change from 2000 to 2020 by linking the Geodetector and structural equation models. The NEP of the QLM showed a significant increase during the recent 20 years, and 78.93% of the QLM experienced a significant increase in NEP; while only 4.83% of the area in the QLM experienced a decreasing trend, which is dominantly located on the southeast edge, surrounding the Qinghai Lake, and the midland of the QLM. The area percentage of the carbon sink region increased from 47% in 2000 to 62% in 2020. The natural environment factors (e.g., altitude and soil type) and climate factors (e.g., temperature and precipitation) were the dominant factors that determine the spatial distribution of NEP. Compared with a single factor, the interaction of pairs of factors enhanced the influence strength on NEP. The natural environment factors indirectly affected NEP change through influencing human activities intensity and climatic factors. Human activities intensity played a medium indirectly negative effect on NEP, while climatic factors exerted strong direct and indirect positive influences on NEP. The contributions of human activity intensity, climatic factors, and natural environment on NEP change in the QLM were 33.5%, 62.3%, and 38.3%, respectively. Overall, warming and wetting shifts in meteorological conditions offset the negative impact of human activities on NEP in the QLM, and the QLM has acted as a growing carbon sink in the past 20 years.

1. Introduction

Continuously intensifying climate change and human activity during the past few decades have exerted a profound impact on ecosystem structures, functions, and services [1,2]. Climate change can drive the vegetation dynamics and regulate soil respiration, and therefore influence the carbon cycle and budget of the terrestrial ecosystem [3]. The net carbon exchange between terrestrial ecosystems and the atmosphere indicates net ecosystem productivity (NEP). It is an important indicator for the quantitative evaluation of terrestrial ecosystems’ carbon sources and sinks [4,5,6]. In the context of climate change and anthropogenic interference, it is crucial to monitor the spatiotemporal variation in terrestrial carbon sink/source. Moreover, revealing the spatiotemporal variation in NEP and its driving mechanism is necessary for regional sustainable development and global carbon emissions reduction.
The carbon budget has long been the focus of global change research, and the NEP estimation plays an important role in carbon budget research. Numerous studies have confirmed that human activity and climate change will lead to fluctuation in NEP of the terrestrial ecosystems and alter carbon source and carbon sink patterns in local regions or the global extent [3,6,7]. Traditionally, the NEP estimation was concentrated on the local scale based on in situ experiments [8,9]. In recent years, owing to the development of remote sensing technology, estimating NEP on large scale has become possible due to its low cost and high efficiency [6,10,11,12]. Many previous works addressed the spatiotemporal change in NEP and its response to climatic factors and human activity by coupling remote sensing models and empirical statistical methods. For instance, Dai et al. [10] revealed the response of the NEP to temperature and precipitation in Inner Mongolia by coupling the empirical model and correlation analysis. Li et al. [12] indicated that drought and increased human activity weakened the carbon sink capacity in Central Asia. Zhang et al. [6] found that climate change reduced the NEP in the drylands of Central Asia by combining the Carnegie–Ames–Stanford (CASA) and empirical models. Liang et al. [13] indicated that the NEP in most regions of China experienced a non-significant increasing trend by coupling the modified CASA model and empirical model. Generally, the changes in NEP are triggered by natural and anthropogenic factors. However, given the complicated interactions between natural and anthropogenic factors, quantifying the contributions of climate change and human activity on NEP in dryland alpine ecosystems is currently challenging.
Partial derivative analysis [14], regression analysis [6], residual analysis [15], and machine learning [16] were the primary methods used to reveal the effects of climate change and human activity on the terrestrial ecosystem in previous research. However, these methods/models have shortcomings in addressing the interactions between different driving factors. Ignoring the interactions between driving factors, the result is probably imprecise [17]. Fortunately, by considering the interactions between independent variables, the structural equation model (SEM) is a robust method to quantify the direct and indirect effects and the effect paths of multiple influencing factors on target variables [18]. Moreover, the Geodetector model (GDM) can reveal the internal mechanism between different influencing factors and response variables [19,20,21]. It is a vigorous method to investigate the interactions between driving factors [22]. Linking the GDM and SEM can help us to deepen the understanding of the driving mechanism behind the NEP change.
Mountain ecosystems play a vital role in providing a wealth of ecosystem services and ecological goods, (e.g., water conservation, biodiversity maintenance, climate regulation, and carbon cycling). However, alpine ecosystems in arid/semiarid regions are especially sensitive to human activities and climate change [14,23]. In the past few decades, climate change and expanding human activities have profoundly affected the ecosystem’s carbon source/sink pattern in northwest China [24,25]. Previous studies revealed that grassland, forest, and shrubland respond to climate change to various degrees, and the grassland ecosystem is the most sensitive ecosystem in Qinghai-Tibetan Plateau [26]. The Qilian Mountains (QLM) are widely regarded as an irreplaceable ecological security barrier in the northeastern Qinghai-Tibetan Plateau [27,28]. However, given the complex topography and climatic conditions, the QLM is also one of the most fragile ecological zones in China [29,30,31]. The vegetation in the QLM has undergone marked variation under the combined influence of climate change and human activities in the past several decades, which altered the terrestrial carbon cycle and budget [14,32,33]. Previous studies primarily concentrated on the changes in Normalized Difference Vegetation Index (NDVI) and Net Primary Productivity (NPP), and mainly focused on the individual effect of the driving factors [14,30]. However, the magnitude of the NEP in the QLM and the interaction of different factors (e.g., climatic factors and human interference) behind the NEP change remains unclear. Therefore, it is necessary to estimate the NEP and distinguish the impacts of human activity and climatic factors on NEP in the QLM.
The targets of this study are to (1) estimate the NEP and its spatiotemporal change in the QLM from 2000 to 2020, (2) identify the key factors that influence the spatial distribution of NEP, and (3) disentangle the contributions of the natural environment, climatic factors, and human activity intensity to NEP change.

2. Materials and Methods
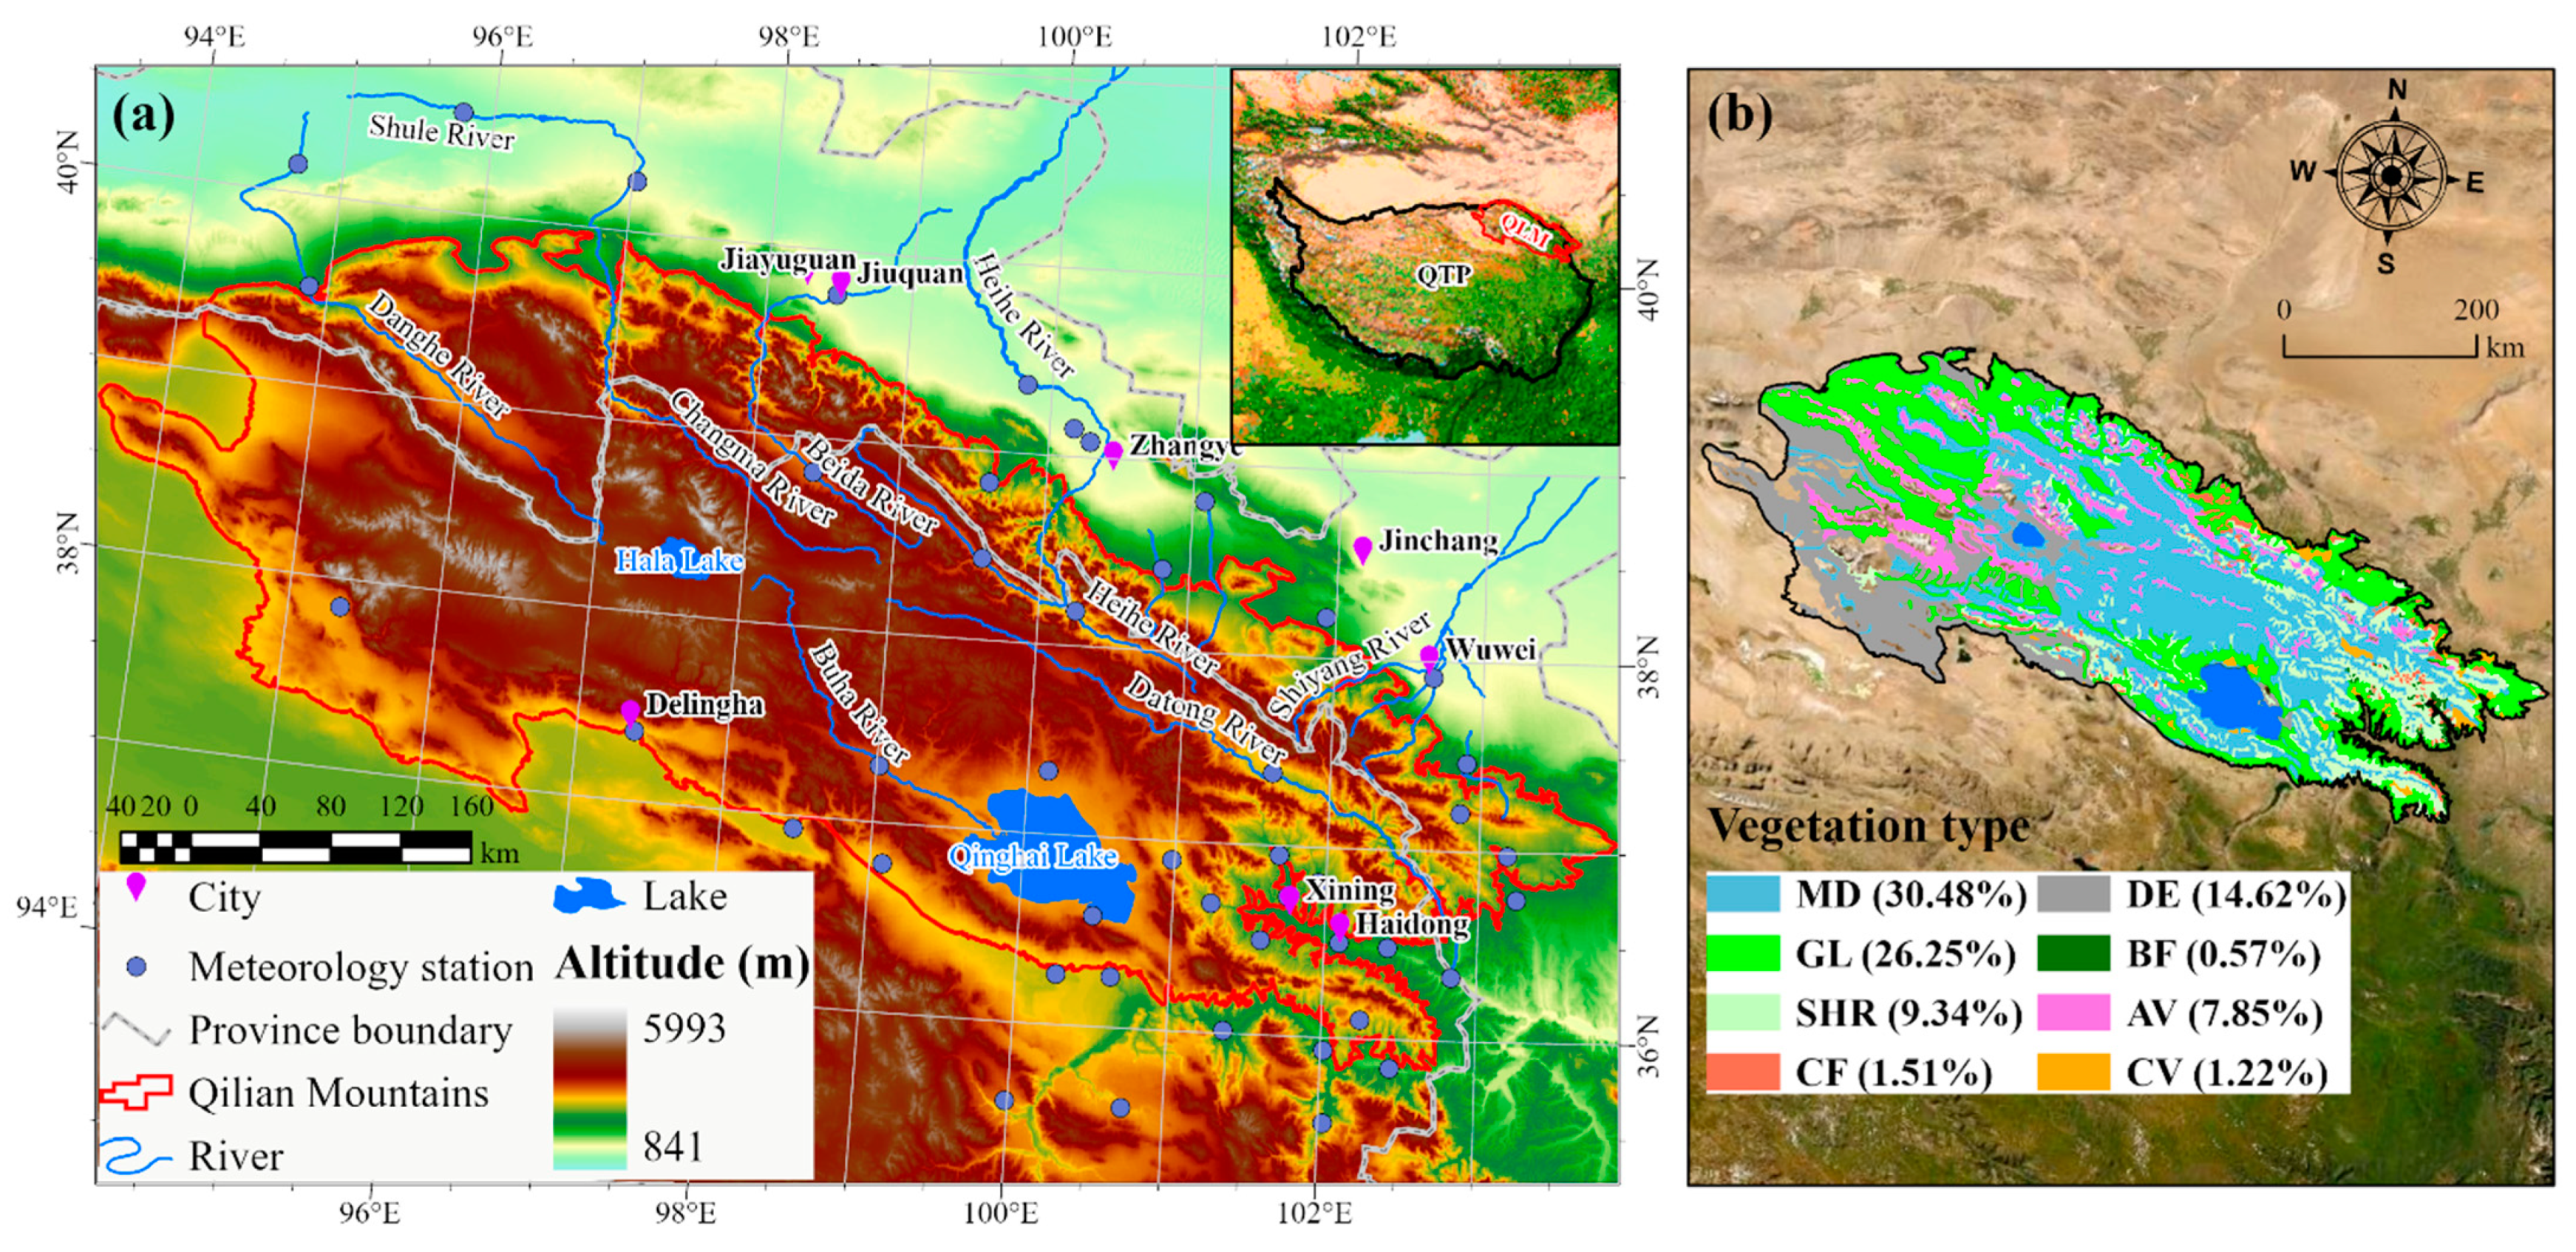
2.1. Study Area

The QLM is situated on the northeastern Qinghai-Tibet Plateau and straddles Gansu and Qinghai provinces. It covers a total area of ~190,000 km2 from 35.8° to 40.0°N and 93.5° to 104.0°E, with altitudes from 1937 to 5792 m (Figure 1a). The average elevation is over 3000 m. The QLM has a continental alpine semiarid climate with annual precipitation of ~370 mm and the annual mean temperature is below 1 °C. The natural vegetation type presents marked horizontal and vertical zonation features, mainly including seven types: meadows, grassland, desert, shrub, alpine vegetation, coniferous forest, and broadleaf forest in order of decreasing area (Figure 1b). Moreover, the farmland (cultivated vegetation) accounts for ~1.22% in the QLM. The QLM is widely regarded as the priority area for biodiversity protection in China [28]. Moreover, its important duties include preserving the Qinghai-Tibet Plateau’s ecological barrier, preventing the three deserts of Tengger, Badain Jaran, and Kumtag from encroaching southward, and ensuring the survival and development of the oases in the Hexi Corridor [34].

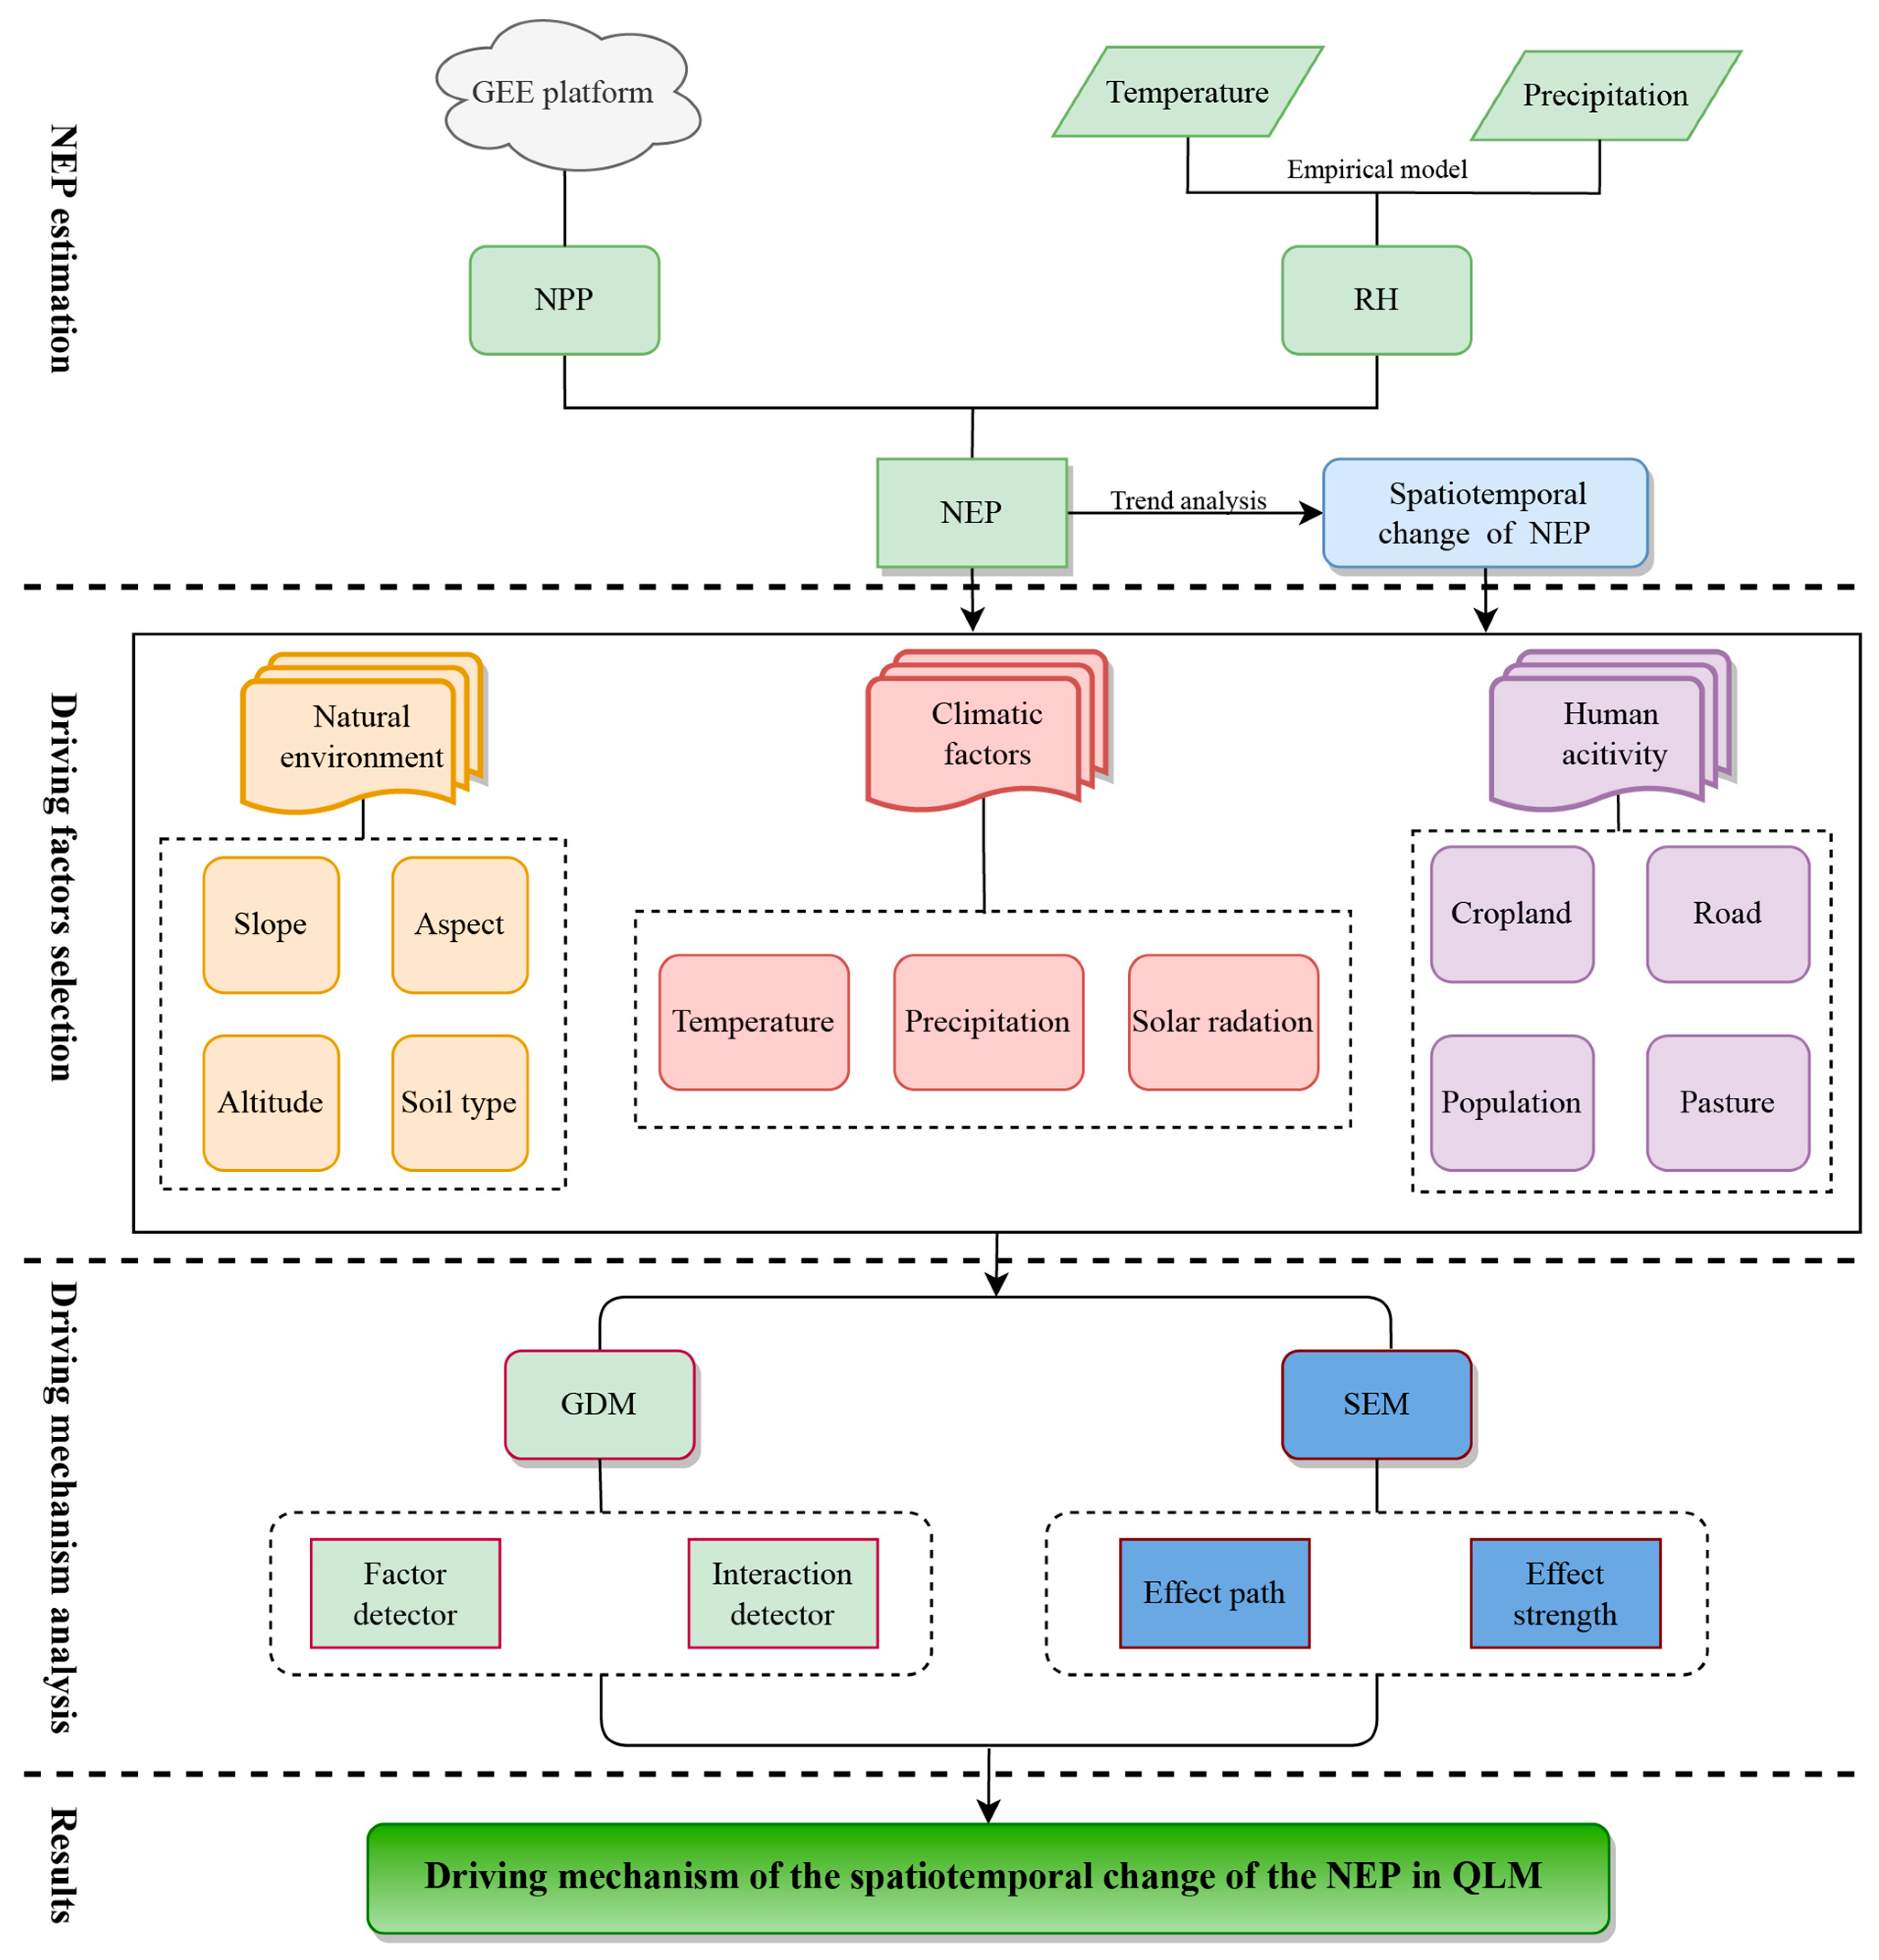
2.2. Data Collection and Analytical Framework

This study collected data on NPP and the potential influencing factors from multiple sources (Table 1). Time-series NPP product (MOD17A3) and land cover product (MCD12Q1) from 2000 to 2020 were filtered and downloaded based on the Google Earth Engine (GEE) cloud platform. These data are of high quality and extensively applied to estimate carbon consequences [1,14,35]. The vegetation type and soil type were attained from the Resource and Environment Data Cloud Platform, Chinese Academy of Sciences (https://www.resdc.cn/ (accessed on 13 May 2022)). Topographic factors (i.e., elevation, aspect, and slope) were extracted from digital elevation model (DEM) data collected from the United States Geological Survey (USGS, https://earthexplorer.usgs.gov/ (accessed on 15 May 2022)). Meteorological data (temperature and precipitation) from 39 stations in the QLM and its surrounding region were collected from the China meteorological data service center (http://data.cma.cn/ (accessed on 23 May 2022)). The ANUSPLIN 4.2 software was employed to interpolate the station data of temperature and precipitation into a spatial grid based on the covariate of altitude. The solar radiation data were downloaded from Terra Climatology Lab (https://climate.northwestknowledge.net/TERRACLIMATE/index (accessed on 17 May 2022)). Data on human activity intensity were collected from Mu et al. [36], this data employed eight categories of human pressures following the concept of human footprint to represent the human activities intensity (i.e., cropland, road impact (road and railway distribution), population density, night-time light, pasture, and so on), which can comprehensively represent the human activity intensity. Statistic data were collected from the statistic yearbooks of Qinghai Province and Gansu Province. The spatial reference of the spatial data was set to the WGS_1984_Albers projection and the resolutions were resampled to 1 km in the ArcGIS Pro 2.8 platform (ESRI, Redlands, CA, USA).
The main steps of this study include three parts, namely the NEP estimation, driving factor selection, and driving mechanism analysis. The primary analytical framework is shown in Figure 2.

2.3. Methods

2.3.1. Estimate the NEP in the QLM

The NEP is defined as the difference value between the net primary productivity (NPP) and the soil heterotrophic respiration (RH):
N E P = N P P R H  
If the NEP is greater than zero, the carbon fixed by vegetation is bigger than the carbon released by soil respiration (i.e., a carbon sink). Otherwise, it is a carbon source.
According to previous studies [8,37], the RH estimation model for the alpine steppe ecosystem in the QLM can be written as follows:
R H ( x , t ) = 0.22 × ( e 0.0913 T ( x , t ) + ln ( 0.3145 P ( x , t ) + 1 ) ) × 30 × 46.5 %
where T(x,t) and P(x,t) are the mean temperature and total precipitation of cell x in the month t, respectively.
The RH estimation model for other ecosystems in the QLM can be written as [38]:
an R H = e ( 1.22 + 0.73 ln ( an R S ) )
mo R S = F × e ( a T b T 2 ) × α P + ( 1 α ) P m 1 K + α P + ( 1 α ) P m 1
where anRH is the yearly soil heterotrophic respiration; anRS is the yearly soil respiration; moRS is the monthly soil respiration; T is the monthly mean temperature; P is the monthly total precipitation (cm); Pm−1 is the total precipitation of the former month (cm); F and K are the parameters; a and b are parameters for temperature; α is the parameter for precipitation.

2.3.2. Trends Analysis of the NEP Change

The Theil-Sen Median trend analysis was introduced to explore the change trend of NEP in the QLM. It is a robust trend analysis method, which is suitable for the short series. This method has been widely used in previous studies [6,39]. The expression can be written as follows:
β = M e d i a n ( N E P j N E P i j i )    
where β denotes the change trend of NEP; NEPi and NEPj represent the times series NEP values of years i and j, (2000 ≤ i < j ≤ 2020 in this study), and n is the length of the study period. If β > 0 denotes the NEP shows an increasing trend and if β < 0 means a decreasing trend of the NEP change during the study period.
The significance of the changing trend of NEP was examined using the Mann–Kendall (M–K) test. It offers the advantages of not requiring samples to follow a normalized distribution and being free from outlier interference. The Theil-Sen Median trend analysis and M–K test were conducted in the MATLAB 2018a platform (The MathWorks Inc., Natick, MA, USA).

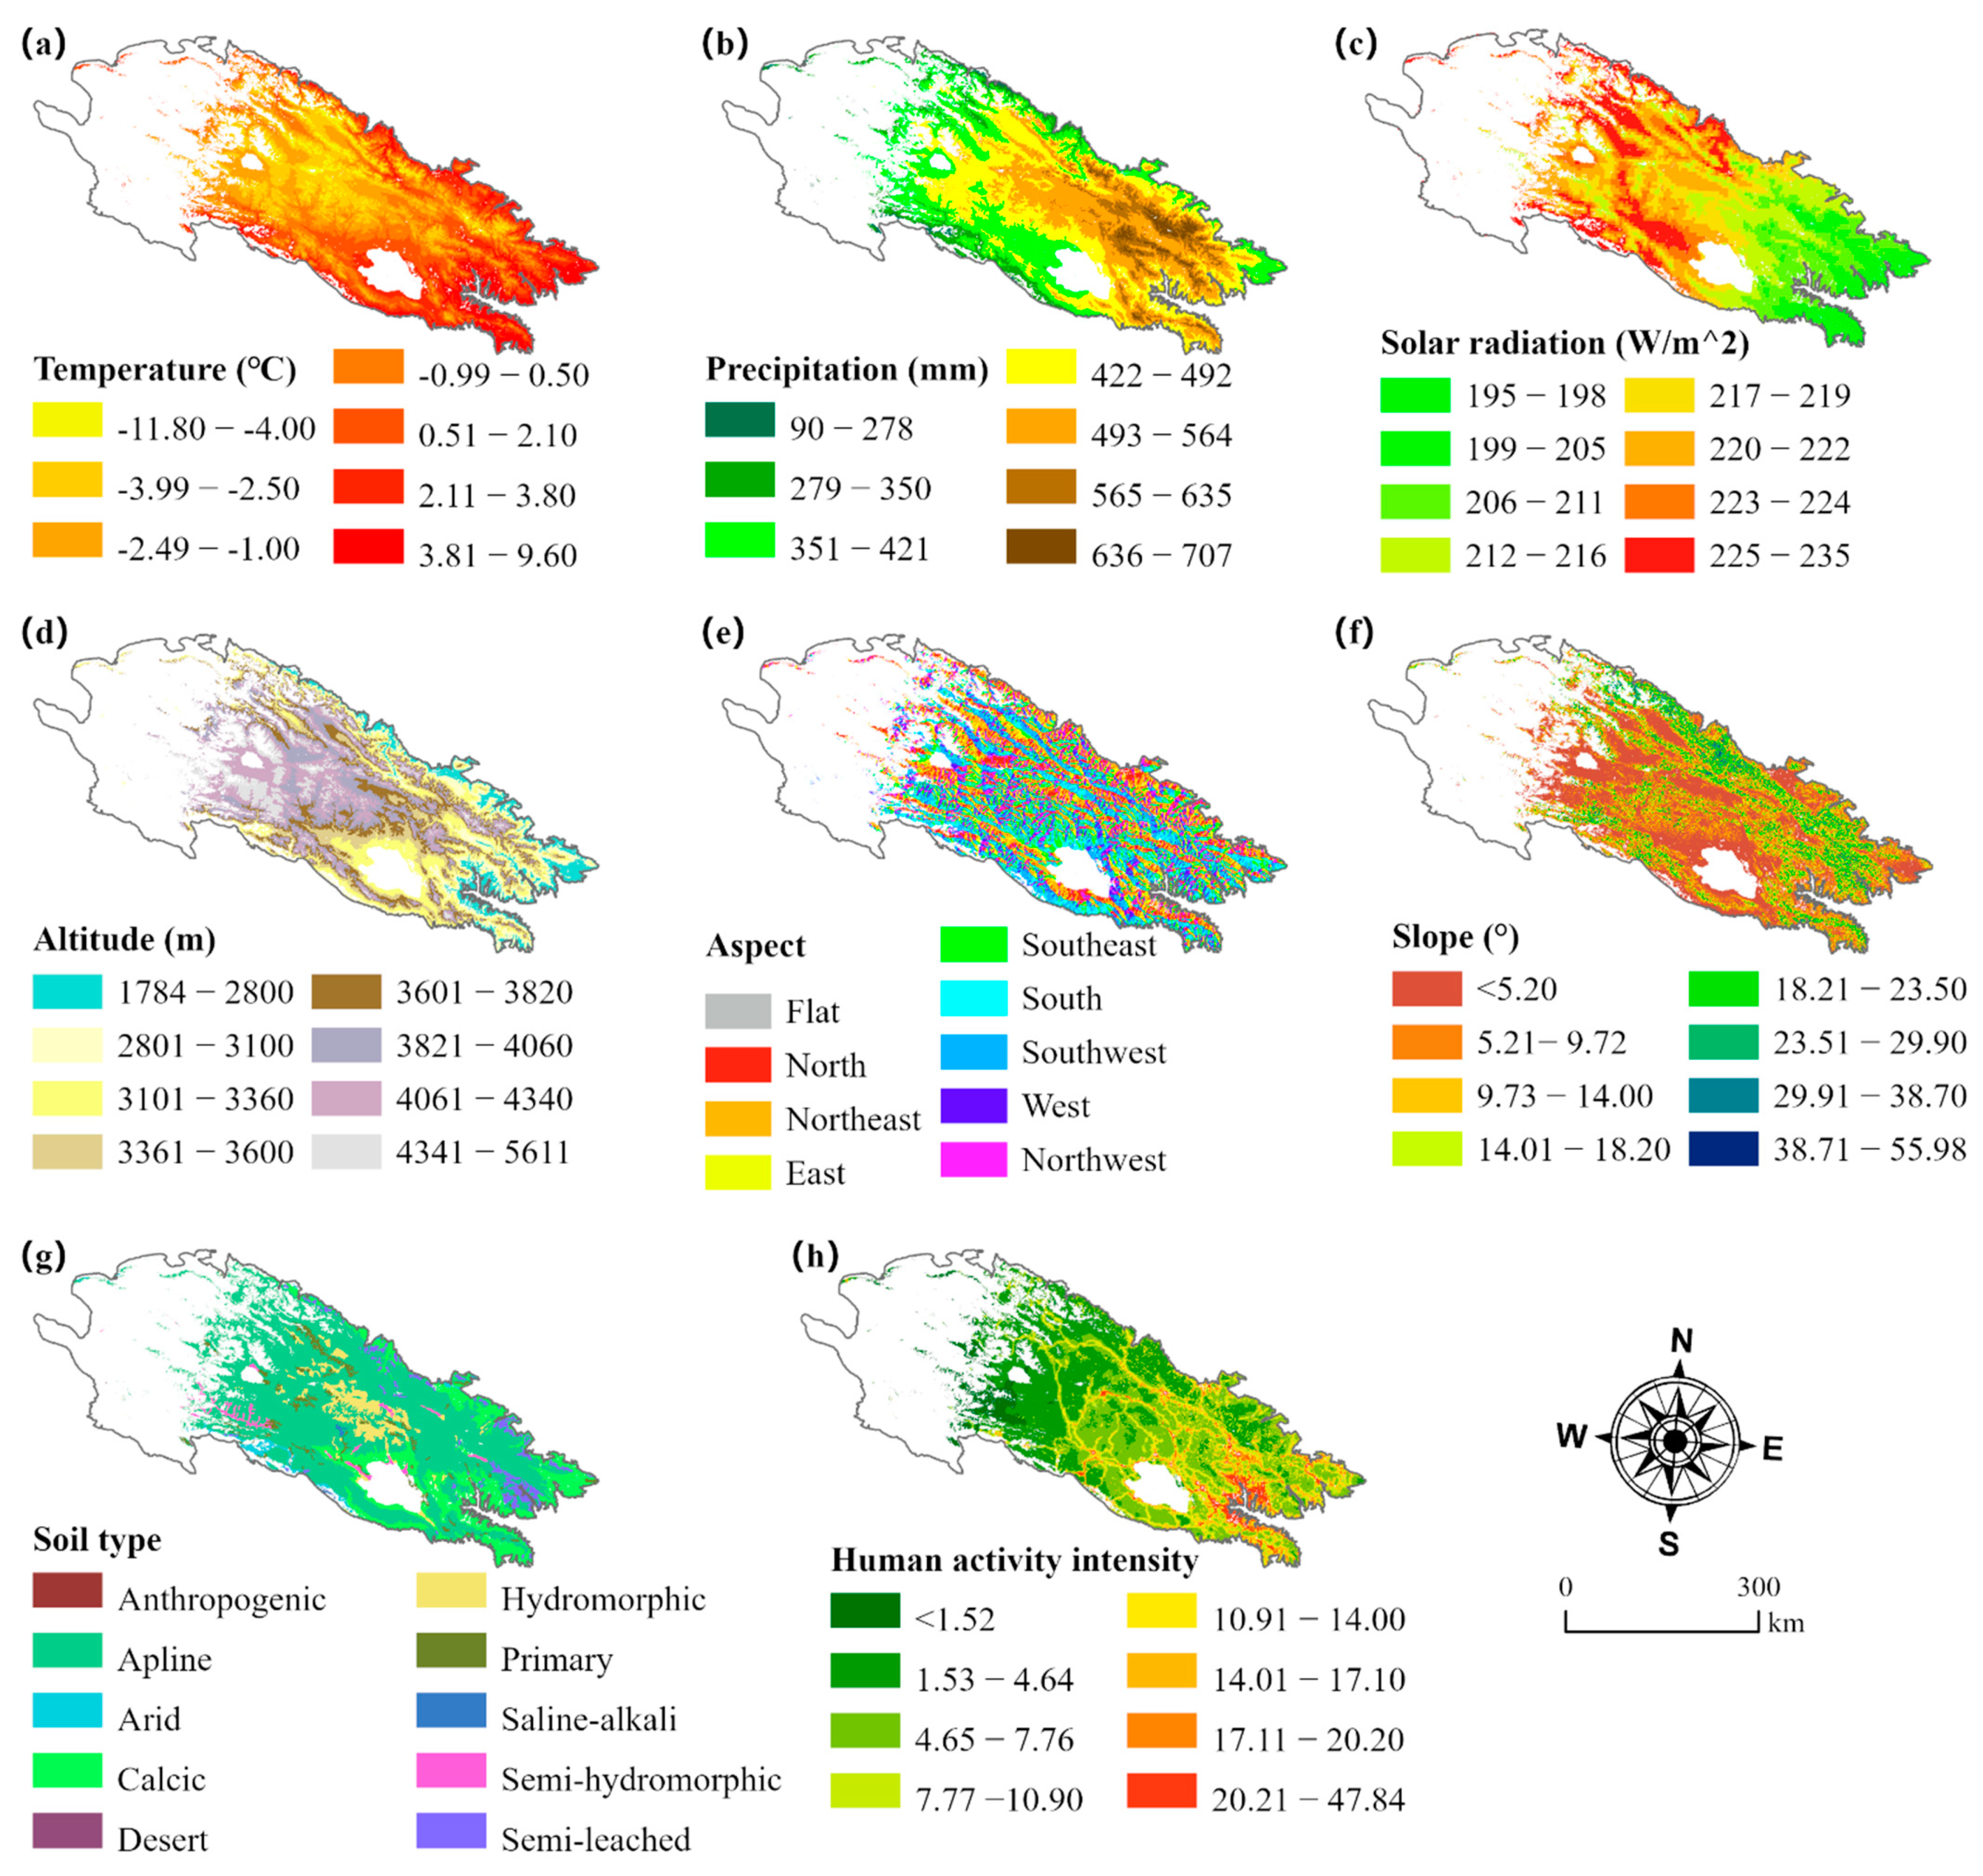
2.3.3. Driving Factors Determination

Various natural factors and human activity can influence the dynamics of the NEP [3,6]. In light of earlier research [3,21,40], considering the specific QLM data availability, we determined the explanatory variables for NEP change. Finally, eight potential driving factors were selected as explanatory variables for the NEP change (the NEP change values between 2000 and 2020), including climatic factors (temperature change, precipitation change, and solar radiation change), topography (altitude, aspect, and slope), soil (soil type), and human interference (change in human activity intensity). We generated 10,000 random sampling points based on the ‘create random points’ tool in the ArcGIS Pro platform. Then, the values of the response variable (NEP change) and the eight driving factors were extracted to each sampling point using the ‘extract multi-values to points’ tool in the ArcGIS Pro platform. Finally, a table containing the values of the response variable and the corresponding explanatory variables was generated that is available for subsequent analysis.

2.3.4. Geodetector Model (GDM)

The GDM is a spatial statistics method to reveal spatial heterogeneity and quantify the influence of driving factors on the response variable based on four modules [22]. In this study, we employed the factor detector and interaction detector to disentangle the driving mechanism of the spatial difference of the NEP in the QLM. We conducted the GDM based on the ‘GD’ package in the RStudio software (version 1.4, RStudio, PBC. Boston, MA, USA).
(1) The explanatory powers of the driving factors for the response variable can be measured by the q-statistics value of the factor detector, which can be written as:
q = 1 S S W S S T = 1 h = 1 L N h N h 2 N δ 2
where SSW and SST represent the Within Sum of Squares and Total Sum of Squares; h = 1, 2, 3, …, L denotes the strata of the dependent or independent factors; Nh and N are the number of units in strata h and the whole region, respectively; δ h 2 and   δ 2 are the variance of the Y value for the units in strata h and the whole region, respectively, 0 ≤ q ≤ 1. The significance level of the q-statistics was tested by the noncentral F test [22].
(2) Interaction detector can be used to determine whether the explanatory powers of two driving factors are enhanced, weakened, or independent of each other by comparing the q-statistics values of two independent factors X1 (q(X1)), X2 (q(X2)), and the interaction of X1 and X2 (q(X1X2)). The details of the interaction types can be found in Table 2.
Given that the GDM requests the discrete independent variables, the continuous independent variables (i.e., precipitation, temperature, solar radiation, altitude, slope, and human activity intensity) were reclassified by using the optimal discrete method (e.g., equal intervals, quantile, natural breaks, geometric, and standard deviation) according to the principle of the maximum value of the q-statistics, which can reflect more information between explanatory variables and response variables [22]. The classification was conducted based on the ‘GD’ package in the RStudio software. The details of the classification and the spatial distribution of these factors are shown in Figure 3. The discrete method for each driving factor was as follows: temperature (natural breaks); precipitation (equal intervals); solar radiation (natural breaks); altitude (natural breaks); aspect (geometric), slope (natural breaks), and human activity intensity (standard deviation).

2.3.5. Structural Equation Model (SEM)

The SEM was employed to quantify the effect paths and effect strengths of the driving factors on NEP change in the QLM. In this study, the target variable is the change value of the NEP in the QLM from 2000 to 2020, the explanatory variables include human activity intensity change, climatic factor changes, and the natural environment factors. Based on the literature review [3,17], the main hypothesis of this study was as follows: First, the natural environment variables (i.e., altitude, aspect, slope, and soil type) can cause changes in climate and human activity. Second, human activity can directly impact the NEP change or indirectly affect NEP by influencing the NPP. Similarly, shifts in meteorological conditions (e.g., temperature change, precipitation change, and solar radiation change) can directly impact the NEP change, or indirectly change the NEP by impacting the NPP. The direct effect was the path coefficient between the two factors, while the indirect effect was measured by the product of the path coefficients of the related effect paths. If there is more than one indirect effect path, the sum of these indirect effects is the total indirect effect. The SEM was conducted in the AMOS 22.0 software based on the above assumptions, and variables and paths were added or deleted through stepwise regression analysis to debug the model. The goodness-of-fit of the SEM was measured using three parameters, including Comparative Fit Index (CFI), Root Squared Mean Error of Approximation (RMSEA), and the ratio of chi-square and degree of freedom (CMIN/DF). When the CFI is greater than 0.9, RMSEA is lower than 0.08, and CMIN/DF is lower than 3 indicating the model fitted well [41].

3. Results

3.1. Spatiotemporal Pattern of NEP Change

The spatial distribution of NEP exhibited obvious heterogeneity, which presented a gradually increasing trend from northwest to southeast (Figure 4a,b). The high values were dominantly situated in the eastern region and northern edge of the QLM, while the low values were mainly situated in the northwest region. From 2000 to 2020, the medium-high level (80–150 g C m−2) and high level (>150 g C m−2) of NEP increased by 8.35% and 11.42%, respectively. They were primarily located in the southeast and north edge of the QLM. The low level (<50 g C m−2) decreased by 13.95%, which were dominantly situated in the midland of the QLM (Figure 3b). The slight increase in NEP (NEP increase <85 g C m−2) was dominant, which occupied 64.64% of the total area. The medium-high and high increase in NEP accounted for 19.10% and 10.71%, respectively, and they were primarily located on the north edge and east edge of the QLM. The decreased region of NEP occupied 5.55%, which was primarily located in the central area in the QLM (Figure 4c).
A trend analysis indicated that 95.17% of the pixels experienced a growing trend of the NEP, among which 78.93% experienced a significant increase (p < 0.05); while only 4.83% went through a decreasing trend, among which 1.82% passed the significance test (p < 0.05), which dominantly lies on the southeast edge, the northwest edge, surrounding Qinghai Lake, and the interior region of the QLM. The significantly decreased region of the NEP was dominantly distributed in the central region (e.g., Muli colliery in Tianjun County), the northwest edge and east of Qinghai Lake, and the regions adjacent to Xining City and Haidong City in the southeastern region of the QLM (Figure 4d).
During the study period, the annual average NEP in the QLM lay between 0.93 and 51.04 g C m−2 with an average value of 27.13 g C m−2, the minimum value occurred in 2000, while the maximum value was shown in 2019. From 2000 to 2020, the NEP showed a significant growing trend with a slope of 2.57 g C m−2 a−1, indicating the QLM experienced an increasing trend of carbon sequestration (Figure 5a). Furthermore, along with the increase in the NEP, the area percentage of the carbon sink region (NEP > 0) increased by 15%, and reached 62% in 2020 compared with 2000 (Figure 5b).

3.2. Independent and Interactive Effects of Driving Factors on NEP Change

As for the independent effects, most of the selected independent factors exerted a significant effect on the spatial change in NEP (p < 0.01), except the slope and aspect (Figure 6a). Among these factors, altitude has the strongest effect (q-statistics value = 0.49), followed by temperature (q-statistics value = 0.47), and soil type (q-statistics value = 0.45). Precipitation had a medium effect on NEP (q-statistics value > 0.30). Human activity intensity and solar radiation showed a relatively weak impact on the NEP (q-statistics value < 0.3); while the slope and aspect exerted a weak influence on the distribution of NEP in the QLM (q-statistics value < 0.1).
The results of the interaction detector manifested that the q-statistics values of the pairwise factors were larger than that of the individual q-statistics value or their sum (Figure 6b). According to Table 2, this demonstrates the interaction of two factors that enhanced the effect on the NEP change. Among all the 28 interaction pairs, 5 pairs are nonlinear enhanced (e.g., the interactions between slope, aspect and soil type, temperature, solar radiation, and human activity intensity), while others are bivariable enhanced. The q-statistics value of the interaction between precipitation and temperature was the highest (q-statistics = 0.741). Additionally, relatively high interaction q-statistics values were detected between altitude, soil type, solar radiation, and precipitation (q-statistics > 0.6). This further demonstrated that these factors were the dominant factors affecting the NEP change in the QLM. It is worth noting that the interaction of human activity intensity with soil type, temperature, and altitude significantly enhanced the effect of human activity on the NEP in the QLM. The q-statistics values of these pairs of interactions were over 0.55, which was higher than the solitary effect of HA (q-statistics = 0.29). Overall, any pair of driving factors interact for NEP change, either mutually enhancing or enhancing nonlinearly, rather than acting independently.

3.3. The Effect Paths and Effect Strengths of the driving Factors on the NEP Change

The SEM results show that the interactions among factors were well-supported by the model (Figure 7a). The parameters of goodness-of-fit (i.e., CMIN/DF = 2.611, CFI = 0.954, RMSEA = 0.076) indicated the constructed model was well-fitted. Overall, 67% of the NEP change can be explained by the final model (Figure 7a). Altitude is the primary factor for the latent variable of the natural environment, followed by soil type and aspect; while temperature is the dominant factor of the latent variable of climatic factors, followed by precipitation. This indicated that the NEP change in the QLM was impacted by the natural environment, climatic factors, and human activity intensity change in various ways. The natural environment only had an indirect effect on NEP change, while climatic factors and human activity intensity change both had direct and indirect effects on NEP change in the QLM. The direct effect of human activity and climatic factors on NEP change were −0.14 and 0.27 (p < 0.05), respectively. The indirect effect of human activity change on NEP change was −0.195 (p < 0.05), while climatic factors exerted a positive indirect effect of 0.352 by affecting the NPP (Figure 7a). As for the total effects of different latent variables, the natural environment and climatic factors had a positive effect on NEP change with an influential coefficient of 0.383 and 0.623, respectively (p < 0.05); while human activity intensity change exerted a negative effect on the NEP change in the QLM with an influential coefficient of −0.335 (p < 0.05) (Figure 7b). Overall, the positive effects of climatic factors on NEP change outpaced the negative effects of human activity.

4. Discussion

4.1. The Effects of the Natural Environment Factors on NEP Change

Our results manifested that the natural environment variables (e.g., altitude, aspect, slope, and soil type) indirectly affect NEP by altering the climatic factors, and human activity intensity with a contribution of 38.3% (Figure 7b). Topography factors (e.g., altitude, slope, and aspect) control the redistribution of water, and heat conditions, which exert certain effects on vegetation growth and soil respiration [42]. Generally, the elevation variation triggered the changes in temperature, precipitation, and soil properties, and these changes had an effect on the spatial distribution and development of plants as well as soil respiration [21,43]. The correlation analysis manifested that the altitude has significant correlation with temperature, precipitation, and NEP change (Table 3). Moreover, altitude can impact a series of important biological activities such as vegetation material metabolism, photosynthesis, and stomatal density, especially in the alpine regions [3,23]. Liu et al. [44] found that vegetation growth significantly decreases when the altitude is over 3500 m in the Qinghai-Tibetan Plateau. Soil type exerted a relatively strong effect on the NEP (q-statistics value = 0.42). Slope and aspect can influence the retention of water, heat, and soil nutrients, and further impact the uptake of carbon by vegetation and soil respiration. Different soil type means various soil structure, moisture, and nutrient contents, which can control vegetation growth. The soil properties of semi-leached soil, hydromorphic soil, and calcic soil were more suitable for the growth of vegetation [40], while the arid soil, saline-alkali, and desert soil were inconducive for the survival and growing of vegetation, thus exerting an impact on the NEP. These findings are in line with a previous work in the Gannan prefecture, Northeast Tibetan Plateau [21].

4.2. The Effects of Climatic Factors on NEP Change

Climate change can drive changes in vegetation and soil, therefore it alters the global carbon budget and cycle [45,46]. The alpine environment coupled with the arid/semi-arid climate makes the ecosystems in the QLM sensitive to climate change [29,30]. Owing to the warming and wetting shifts in meteorological conditions in the QLM region during the recent 20 years (Figure 8a,b), an increasing trend in NEP covered most regions of the QLM, especially in mountainous areas (Figure 4). Our study indicated that the temperature had a relatively high influence (q-statistics value > 0.40) on NEP changes among the selected climatic factors. Temperature is essential for the photosynthesis and respiration of plants, especially in the alpine regions [47]. Previous studies showed that the rising temperature significantly extended the growing season and promoted the increase in vegetation productivity in the Qinghai-Tibet Plateau [48]. Precipitation showed a relatively strong effect to NEP (q-statistics value = 0.31). The significant increase in precipitation promoted the development of the shallow root vegetation, and further led to the rise of NEP in the midland of the QLM (Figure 8) [23]. Li et al. [49] found that the Qilian Mountains have experienced a substantial warming and wetting trend as a result of favorable climatic conditions, which have created ideal natural circumstances for vegetation restoration and development. Climate warming and humidification reduced the low-temperature and water stress in alpine regions and simultaneously improved the water supply in the lower arid land, which promoted vegetation growth [50]. Moreover, in the energy-limited region, warming can enhance the mineralization and availability of soil nitrogen and promote vegetation productivity [51]. Temperature had a strong explanatory power on NEP change, this is probably due to the restraint of vegetation growth by climate factors which has altered from water limitation to energy constraints in the alpine region [52]. However, solar radiation change exerted a slight negative effect on NEP change in the QLM (the standardized regression coefficient is −0.23, Figure 7a). The solar radiation in the QLM experienced a decreasing trend during the past 20 years, and it covered most regions of the QLM (Figure 8c,e). Although the trend is insignificant, the decreasing trend has exerted a negative effect on photosynthesis, and further inhibits the carbon uptake and dry matter accumulation of vegetation [2]. The correlation analysis also indicated that the NEP change showed a significant negative relationship with solar radiation change (Table 3). Analogous results were found in the Tibetan Plateau, China [26]. Moreover, shifts in meteorological conditions can alter soil respiration, for instance, Zhang et al. [6] found that the warming promoted the increase in soil heterotrophic respiration in Central Asia from 2000 to 2019. Wei et al. [3] indicated with the rising of temperature and precipitation, the ecosystem respiration showed a marked increasing trend in the Qinghai-Tibet Plateau. Overall, this study found climatic factors contributed 62.3% to the NEP change in the QLM (Figure 7b), and it was the primary driving force behind the increase in NEP.

4.3. The Effect of Human Activity on NEP Change

Apart from the natural environment and climatic factors, human activity is another important driving force behind the NEP change in the QLM. Our study found that the human-induced decrease in NEP predominately occurred in the southeast edge and the central region of the QLM. The southeast edge of the QLM is adjacent to Xining city (capital city of Qinghai Province) and Haidong city (Figure 1). With the rapid development of these cities, the increase in anthropogenic interference is inevitable, which exerts a negative effect on vegetation growth, thus reducing the regional NEP. In the central region of the QLM, the coal mining and reservoir construction were the primary human interference in decreasing the NEP (e.g., the Muli mining site caused a significant decrease in NEP with an area of ~100 km2. The reservoir construction formed a decreased region of NEP with an area of ~210 km2) (Figure 4c). Moreover, the development of tourism is another driving factor for the reduction in NEP in local regions [49]. As for husbandry, the livestock quantity in the QLM showed a rising trend during the past two decades (Figure 9a). Which can be ascribed to animal husbandry as the main industry of the QLM region. A previous study indicated that overgrazing was the primary cause of grassland deterioration [12]. Long-term overgrazing weakens the grassland’s resistance and reduces the carbon sequestration capacity of the grassland ecosystem [53]. However, due to the implementation of the Grain for Green Program and Natural Forest Protect Project, the farmland area in the QLM showed a marked decrease in the last 20 years (Figure 9a) [13]. Meanwhile, owing to the China Western Development and the Belt and Road Initiative, both the population and Gross Domestic Product (GDP) of the QLM region experienced a significant increase during the study period (Figure 9b). Generally, the growing human activity intensity inevitably posed a negative impact on the NEP, and thus the NEP change showed a significant negative relationship with the human activity intensity change (Table 3; Figure 10). In total, human activity contributed 33.5% to the NEP change in the QLM with a negative effect (Figure 7b). Although human activity led to the decrease in NEP to some extent, the overall increase in NEP in the QLM was dominant. Therefore, the adverse consequences of growing human-induced disturbances (e.g., grazing, mining, land cover changes, and tourism) on NEP may be mitigated by the warming and wetting shifts in meteorological conditions of the QLM region in the recent 20 years.

4.4. Interactive Effects of Different Factors on NEP Change

Our study showed that the NEP had a nonlinear response (bivariable enhanced and nonlinear enhanced) to the interaction of the driving factors (Figure 6b). The interaction of temperature and precipitation had the highest q-statistics value, indicating climatic factors exerted a crucial effect on NEP change in the QLM. The vegetation in the QLM region is sensitive to temperature and precipitation due to its high altitude and arid environment [30]. Moreover, the interaction between altitude, temperature, and soil types had a relatively high influence on NEP (Figure 6b). This is presumably because the elevation change generated the difference in temperature and soil type, which impacted the spatial distribution and development of plants [21]. Although slope, aspect, and solar radiation exerted a weak effect on NEP, when they interact with temperature, altitude and soil type, their power obviously improved (Figure 6b). This result is in line with previous studies [21,40]. Additionally, the interaction of human activity with climatic factors significantly improved the strength of the effects on NEP, for instance, the q-statistics of the interaction between human activity with temperature was 0.568, which is higher than that of the individual factor (Figure 6b). Similarly, Chen et al. [23] found that human activity (e.g., grazing, land cover changes) sometimes amplified the impacts of climate change on the biogeochemical cycles in the Qinghai-Tibetan Plateau. Overall, the results of the GDM manifested that the pairwise factors often have a greater impact on NEP than individual factors or their aggregate, indicating that the effects of the interacting factors did not simply accumulate in a linear fashion but rather were nonlinear enhanced.

5. Conclusions

This paper provides a preliminary assessment of the net ecosystem productivity (NEP) in the Qilian Mountains (QLM), Northwestern China, by coupling an empirical model and remote sensing data. Additionally, by linking the Geodetector and structural equation models, we present a fresh method to highlight the interaction and relative contributions of human activity intensity, natural environment, and climatic factors on the alteration of the NEP in the QLM. The main conclusions are as follows: (1) Most regions (78.93%) of the QLM have experienced a significant increasing trend of NEP during the recent 20 years; while only 1.82% experienced a significant decrease in NEP, which are primarily located in the southeastern edge and central regions of the QLM. (2) The area percentage of the carbon sink increased by 15%, from 47% in 2000 to 62% in 2020. (3) The natural environment and climatic variables, such as altitude, soil type, temperature, and precipitation were the dominant driving factors for the spatial change in NEP in the QLM. (4) Compared with individual factors, the interaction of pairs of driving factors (e.g., temperature and precipitation, soil type and temperature, altitude, and human activity) enhanced the influence strength on NEP change. (5) The natural environment factors (e.g., altitude and soil type) indirectly affected NEP change by influencing human activities and climatic factors, while human activity and climatic factors both exerted direct and indirect effects on NEP change. (6) The climatic factor was the highest contributor (62.3%) to NEP change, followed by the natural environment factor (38.3%) and human activity intensity (33.5%). The positive effects of climatic factors on NEP change outpaced the negative effects of human activity; therefore, there was an overall increase in NEP. These findings can improve understanding of the complicated interrelationships of different driving factors behind the spatiotemporal change in NEP in alpine ecosystems of arid/semi-arid regions.

Author Contributions

Conceptualization, C.W., W.Z. and Y.Z.; Data curation, C.W.; Formal analysis, C.W.; Funding acquisition, W.Z. and Y.Z.; Investigation, Y.Z.; Methodology, C.W. and Y.Z.; Resources, W.Z.; Software, C.W.; Visualization, C.W.; Writing–original draft, C.W.; Writing–review and editing, W.Z. and Y.Z. All authors have read and agreed to the published version of the manuscript.

Funding

This research was jointly supported by the National Key Research and Development Program of China (No. 2019YFC0509405), the National Natural Science Foundation of China (No. 42071044), the Youth Innovation Promotion Association CAS (No. 2020420), and the Strategic Priority Research Program of the Chinese Academy of Sciences (CAS) (No. XDA23060304).

Data Availability Statement

The data presented in this study are available on request from the corresponding author. The data are not publicly available due to privacy.

Acknowledgments

We sincerely thank the editor and anonymous reviewers for their valuable comments and suggestions to improve the quality of this paper.

Conflicts of Interest

The authors declare no conflict of interest.

References

  1. Ge, W.; Deng, L.; Wang, F.; Han, J. Quantifying the contributions of human activities and climate change to vegetation net primary productivity dynamics in China from 2001 to 2016. Sci. Total. Environ. 2021, 773, 145648. [Google Scholar] [CrossRef] [PubMed]
  2. Gottfried, M.; Pauli, H.; Futschik, A.; Akhalkatsi, M.; Barančok, P.; Benito Alonso, J.L.; Coldea, G.; Dick, J.; Erschbamer, B.; Calzado, F.; et al. Continent-wide response of mountain vegetation to climate change. Nat. Clim. Chang. 2012, 2, 111–115. [Google Scholar] [CrossRef]
  3. Wei, D.; Qi, Y.; Ma, Y.; Wang, X.; Ma, W.; Gao, T.; Huang, L.; Zhao, H.; Zhang, J.; Wang, X. Plant uptake of CO2 outpaces losses from permafrost and plant respiration on the Tibetan Plateau. Proc. Natl. Acad. Sci. USA 2021, 118, e2015283118. [Google Scholar] [CrossRef]
  4. Bloom, A.A.; Exbrayat, J.-F.; van der Velde, I.R.; Feng, L.; Williams, M. The decadal state of the terrestrial carbon cycle: Global retrievals of terrestrial carbon allocation, pools, and residence times. Proc. Natl. Acad. Sci. USA 2016, 113, 1285–1290. [Google Scholar] [CrossRef]
  5. Erb, K.-H.; Kastner, T.; Plutzar, C.; Bais, A.L.S.; Carvalhais, N.; Fetzel, T.; Gingrich, S.; Haberl, H.; Lauk, C.; Niedertscheider, M.; et al. Unexpectedly large impact of forest management and grazing on global vegetation biomass. Nature 2018, 553, 73–76. [Google Scholar] [CrossRef] [PubMed]
  6. Zhang, J.; Hao, X.; Hao, H.; Fan, X.; Li, Y. Climate Change Decreased Net Ecosystem Productivity in the Arid Region of Central Asia. Remote Sens. 2021, 13, 4449. [Google Scholar] [CrossRef]
  7. Keenan, T.F.; Prentice, I.C.; Canadell, J.G.; Williams, C.A.; Wang, H.; Raupach, M.; Collatz, G.J. Recent pause in the growth rate of atmospheric CO2 due to enhanced terrestrial carbon uptake. Nat. Commun. 2016, 7, 13428. [Google Scholar] [CrossRef]
  8. Pei, Z.Y.; Ouyang, H.; Zhou, C.P.; Xu, X.L. Carbon balance in an alpine steppe in the Qinghai-Tibet plateau. J. Integr. Plant Biol. 2009, 51, 521–526. [Google Scholar] [CrossRef]
  9. Parton, W.; Morgan, J.; Smith, D.; Del Grosso, S.; Prihodko, L.; LeCain, D.; Kelly, R.; Lutz, S. Impact of precipitation dynamics on net ecosystem productivity. Glob. Chang. Biol. 2012, 18, 915–927. [Google Scholar] [CrossRef]
  10. Dai, E.; Huang, Y.; Wu, Z.; Zhao, D. Analysis of spatio-temporal features of a carbon source/sink and its relationship to climatic factors in the Inner Mongolia grassland ecosystem. J. Geogr. Sci. 2016, 26, 297–312. [Google Scholar] [CrossRef]
  11. Yao, Y.; Li, Z.; Wang, T.; Chen, A.; Wang, X.; Du, M.; Jia, G.; Li, Y.; Li, H.; Luo, W.; et al. A new estimation of China’s net ecosystem productivity based on eddy covariance measurements and a model tree ensemble approach. Agric. For. Meteorol. 2018, 253–254, 84–93. [Google Scholar] [CrossRef]
  12. Li, Z.; Chen, Y.; Zhang, Q.; Li, Y. Spatial patterns of vegetation carbon sinks and sources under water constraint in Central Asia. J. Hydrol. 2020, 590, 125355. [Google Scholar] [CrossRef]
  13. Liang, L.; Geng, D.; Yan, J.; Qiu, S.; Shi, Y.; Wang, S.; Wang, L.; Zhang, L.; Kang, J. Remote Sensing Estimation and Spatiotemporal Pattern Analysis of Terrestrial Net Ecosystem Productivity in China. Remote Sens. 2022, 14, 1902. [Google Scholar] [CrossRef]
  14. Peng, Q.; Wang, R.; Jiang, Y.; Li, C. Contributions of climate change and human activities to vegetation dynamics in Qilian Mountain National Park, northwest China. Glob. Ecol. Conserv. 2021, 32, e01947. [Google Scholar] [CrossRef]
  15. Teng, M.; Zeng, L.; Hu, W.; Wang, P.; Yan, Z.; He, W.; Zhang, Y.; Huang, Z.; Xiao, W. The impacts of climate changes and human activities on net primary productivity vary across an ecotone zone in Northwest China. Sci. Total. Environ. 2020, 714, 136691. [Google Scholar] [CrossRef]
  16. Leroux, L.; Bégué, A.; Lo Seen, D.; Jolivot, A.; Kayitakire, F. Driving forces of recent vegetation changes in the Sahel: Lessons learned from regional and local level analyses. Remote Sens. Environ. 2017, 191, 38–54. [Google Scholar] [CrossRef]
  17. Yang, L.; Shen, F.; Zhang, L.; Cai, Y.; Yi, F.; Zhou, C. Quantifying influences of natural and anthropogenic factors on vegetation changes using structural equation modeling: A case study in Jiangsu Province, China. J. Clean. Prod. 2021, 280, 124330. [Google Scholar] [CrossRef]
  18. Grace, J.B.; Bollen, K.A. Interpreting the Results from Multiple Regression and Structural Equation Models. Bull. Ecol. Soc. Am. 2005, 86, 283–295. [Google Scholar] [CrossRef]
  19. Nie, T.; Dong, G.; Jiang, X.; Lei, Y. Spatio-Temporal Changes and Driving Forces of Vegetation Coverage on the Loess Plateau of Northern Shaanxi. Remote Sens. 2021, 13, 613. [Google Scholar] [CrossRef]
  20. Wang, Y.; Zhang, Z.; Chen, X. Quantifying Influences of Natural and Anthropogenic Factors on Vegetation Changes Based on Geodetector: A Case Study in the Poyang Lake Basin, China. Remote Sens. 2021, 13, 5081. [Google Scholar] [CrossRef]
  21. Liu, C.; Li, W.; Wang, W.; Zhou, H.; Liang, T.; Hou, F.; Xu, J.; Xue, P. Quantitative spatial analysis of vegetation dynamics and potential driving factors in a typical alpine region on the northeastern Tibetan Plateau using the Google Earth Engine. Catena 2021, 206, 105500. [Google Scholar] [CrossRef]
  22. Wang, J.-F.; Zhang, T.-L.; Fu, B.-J. A measure of spatial stratified heterogeneity. Ecol. Indic. 2016, 67, 250–256. [Google Scholar] [CrossRef]
  23. Chen, H.; Zhu, Q.; Peng, C.; Wu, N.; Wang, Y.; Fang, X.; Gao, Y.; Zhu, D.; Yang, G.; Tian, J.; et al. The impacts of climate change and human activities on biogeochemical cycles on the Qinghai-Tibetan Plateau. Glob. Chang. Biol. 2013, 19, 2940–2955. [Google Scholar] [CrossRef] [PubMed]
  24. Chen, B.; Zhang, X.; Tao, J.; Wu, J.; Wang, J.; Shi, P.; Zhang, Y.; Yu, C. The impact of climate change and anthropogenic activities on alpine grassland over the Qinghai-Tibet Plateau. Agric. For. Meteorol. 2014, 189–190, 11–18. [Google Scholar] [CrossRef]
  25. Li, C.; Fu, B.; Wang, S.; Stringer, L.C.; Wang, Y.; Li, Z.; Liu, Y.; Zhou, W. Drivers and impacts of changes in China’s drylands. Nat. Rev. Earth Environ. 2021, 2, 858–873. [Google Scholar] [CrossRef]
  26. Luo, Z.; Wu, W.; Yu, X.; Song, Q.; Yang, J.; Wu, J.; Zhang, H. Variation of Net Primary Production and Its Correlation with Climate Change and Anthropogenic Activities over the Tibetan Plateau. Remote Sens. 2018, 10, 1352. [Google Scholar] [CrossRef]
  27. He, Z.; Du, J.; Chen, L.; Zhu, X.; Lin, P.; Zhao, M.; Fang, S. Impacts of recent climate extremes on spring phenology in arid-mountain ecosystems in China. Agric. For. Meteorol. 2018, 260–261, 31–40. [Google Scholar] [CrossRef]
  28. Yan, K.; Ding, Y. The overview of the progress of Qilian Mountain National Park System Pilot Area. Int. J. Geoheritage Parks 2020, 8, 210–214. [Google Scholar] [CrossRef]
  29. Sun, Y.; Guan, Q.; Wang, Q.; Yang, L.; Pan, N.; Ma, Y.; Luo, H. Quantitative assessment of the impact of climatic factors on phenological changes in the Qilian Mountains, China. For. Ecol. Manag. 2021, 499, 119594. [Google Scholar] [CrossRef]
  30. Ma, Y.; Guan, Q.; Sun, Y.; Zhang, J.; Yang, L.; Yang, E.; Li, H.; Du, Q. Three-dimensional dynamic characteristics of vegetation and its response to climatic factors in the Qilian Mountains. CATENA 2022, 208, 105694. [Google Scholar] [CrossRef]
  31. Qiao, C.; Shen, S.; Cheng, C.; Wu, J.; Jia, D.; Song, C. Vegetation Phenology in the Qilian Mountains and Its Response to Temperature from 1982 to 2014. Remote Sens. 2021, 13, 286. [Google Scholar] [CrossRef]
  32. Qin, X.; Liu, W.; Mao, R.; Song, J.; Chen, Y.; Ma, C.; Li, M. Quantitative assessment of driving factors affecting human appropriation of net primary production (HANPP) in the Qilian Mountains, China. Ecol. Indic. 2021, 121, 106997. [Google Scholar] [CrossRef]
  33. Zhao, M.; He, Z.; Du, J.; Chen, L.; Lin, P.; Fang, S. Assessing the effects of ecological engineering on carbon storage by linking the CA-Markov and InVEST models. Ecol. Indic. 2019, 98, 29–38. [Google Scholar] [CrossRef]
  34. Li, H.; Wu, Y.; Chen, J.; Zhao, F.; Wang, F.; Sun, Y.; Zhang, G.; Qiu, L. Responses of soil organic carbon to climate change in the Qilian Mountains and its future projection. J. Hydrol. 2021, 596, 126110. [Google Scholar] [CrossRef]
  35. Liu, G.; Shao, Q.; Fan, J.; Ning, J.; Rong, K.; Huang, H.; Liu, S.; Zhang, X.; Niu, L.; Liu, J. Change Trend and Restoration Potential of Vegetation Net Primary Productivity in China over the Past 20 Years. Remote Sens. 2022, 14, 1634. [Google Scholar] [CrossRef]
  36. Mu, H.; Li, X.; Wen, Y.; Huang, J.; Du, P.; Su, W.; Miao, S.; Geng, M. A global record of annual terrestrial Human Footprint dataset from 2000 to 2018. Sci. Data 2022, 9, 176. [Google Scholar] [CrossRef]
  37. Pei, Z.Y.; Zhou, C.P.; Ouyang, H.; Yang, W.B. A carbon budget of alpine steppe area in the Tibetan Plateau. Geogr. Res. 2010, 29, 102–110. [Google Scholar]
  38. Hashimoto, S.; Carvalhais, N.; Ito, A.; Migliavacca, M.; Nishina, K.; Reichstein, M. Global spatiotemporal distribution of soil respiration modeled using a global database. Biogeosciences 2015, 12, 4121–4132. [Google Scholar] [CrossRef]
  39. Wang, C.; Zhao, W.; Zhang, Y. Runoff controls the development of eco-hydrological and economic conditions in an arid oasis of the downstream inland river basin. Arid. Land Res. Manag. 2022, 36, 265–282. [Google Scholar] [CrossRef]
  40. Zhu, L.; Meng, J.; Zhu, L. Applying Geodetector to disentangle the contributions of natural and anthropogenic factors to NDVI variations in the middle reaches of the Heihe River Basin. Ecol. Indic. 2020, 117, 106545. [Google Scholar] [CrossRef]
  41. Grace, J.B.; Keeley, J.E. A structural equation model analysis of postfire plant diversity in California shrublands. Ecol. Appl. Publ. Ecol. Soc. Am. 2006, 16, 503–514. [Google Scholar] [CrossRef]
  42. Peng, W.; Kuang, T.; Tao, S. Quantifying influences of natural factors on vegetation NDVI changes based on geographical detector in Sichuan, western China. J. Clean. Prod. 2019, 233, 353–367. [Google Scholar] [CrossRef]
  43. Zhang, Y.; Zhao, W.; Fu, L.; Zhao, C.; Jia, A. Land use conversion influences soil respiration across a desert-oasis ecoregion in Northwest China, with consideration of cold season CO2 efflux and its significance. Catena 2020, 188, 104460. [Google Scholar] [CrossRef]
  44. Liu, L.; Wang, Y.; Wang, Z.; Li, D.; Zhang, Y.; Qin, D.; Li, S. Elevation-dependent decline in vegetation greening rate driven by increasing dryness based on three satellite NDVI datasets on the Tibetan Plateau. Ecol. Indic. 2019, 107, 105569. [Google Scholar] [CrossRef]
  45. Lahn, B. A history of the global carbon budget. Wiley Interdiscip. Rev. Clim. Change 2020, 11, e636. [Google Scholar] [CrossRef]
  46. Zhao, M.; Running, S.W. Drought-Induced Reduction in Global Terrestrial Net Primary Production from 2000 Through 2009. Science 2010, 329, 940–943. [Google Scholar] [CrossRef]
  47. Chang, Q.; Xiao, X.; Wu, X.; Doughty, R.; Jiao, W.; Bajgain, R.; Qin, Y.; Wang, J. Estimating site-specific optimum air temperature and assessing its effect on the photosynthesis of grasslands in mid- to high-latitudes. Environ. Res. Lett. 2020, 15, 034064. [Google Scholar] [CrossRef]
  48. Wang, S.; Zhang, B.; Yang, Q.; Chen, G.; Yang, B.; Lu, L.; Shen, M.; Peng, Y. Responses of net primary productivity to phenological dynamics in the Tibetan Plateau, China. Agric. For. Meteorol. 2017, 232, 235–246. [Google Scholar] [CrossRef]
  49. Li, Z.; Feng, Q.; Li, Z.; Wang, X.; Gui, J.; Zhang, B.; Li, Y.; Deng, X.; Xue, J.; Gao, W.; et al. Reversing conflict between humans and the environment—The experience in the Qilian Mountains. Renew. Sustain. Energy Rev. 2021, 148, 111333. [Google Scholar] [CrossRef]
  50. Piao, S.; Cui, M.; Chen, A.; Wang, X.; Ciais, P.; Liu, J.; Tang, Y. Altitude and temperature dependence of change in the spring vegetation green-up date from 1982 to 2006 in the Qinghai-Xizang Plateau. Agric. For. Meteorol. 2011, 151, 1599–1608. [Google Scholar] [CrossRef]
  51. Yuan, M.M.; Guo, X.; Wu, L.; Zhang, Y.; Xiao, N.; Ning, D.; Shi, Z.; Zhou, X.; Wu, L.; Yang, Y.; et al. Climate warming enhances microbial network complexity and stability. Nat. Clim. Chang. 2021, 11, 343–348. [Google Scholar] [CrossRef]
  52. Zhang, Y.; Zhang, C.; Wang, Z.; Chen, Y.; Gang, C.; An, R.; Li, J. Vegetation dynamics and its driving forces from climate change and human activities in the Three-River Source Region, China from 1982 to 2012. Sci. Total. Environ. 2016, 563–564, 210–220. [Google Scholar] [CrossRef] [PubMed]
  53. Hao, L.; Pan, C.; Fang, D.; Zhang, X.; Zhou, D.; Liu, P.; Liu, Y.; Sun, G. Quantifying the effects of overgrazing on mountainous watershed vegetation dynamics under a changing climate. Sci. Total. Environ. 2018, 639, 1408–1420. [Google Scholar] [CrossRef] [PubMed]
Figure 1. Location and altitude (a), and vegetation type (b) of the study area. QLM: Qilian Mountains; QTP: Qinghai-Tibet Plateau; MD: meadows; GL: grassland; SHR: shrub; CF: coniferous forest; DE: desert; BF: broadleaf forest; AV: alpine vegetation; CV: cultivated vegetation.
Remotesensing 14 04046 g001
Figure 2. The analytical framework of the estimation process of the NEP and the driving mechanism of the NEP change from 2000 to 2020 in QLM. Soil heterotrophic respiration (RH), Geodetector model (GDM), structural equation model (SEM).
Remotesensing 14 04046 g002
Figure 3. Spatial distribution map of the optimal reclassified results of the driving factors for the NEP change in the Qilian Mountains. (a) Temperature, (b) Precipitation, (c) Solar radiation, (d) Altitude, (e) Aspect, (f) Slope, (g) Soil type, and (h) Human activity intensity. The blank region denotes no data.
Remotesensing 14 04046 g003
Figure 4. The spatial distribution of NEP in 2000 (a), 2020 (b), the NEP change from 2000 to 2020 (c), and the inter-annual change trends of NEP (d). The unit of the NEP is g C m−2 a−1.
Remotesensing 14 04046 g004
Figure 5. Change in the NEP (a), and fractional area change in the carbon sink and carbon source (b) in Qilian Mountains from 2000 to 2020.
Remotesensing 14 04046 g005
Figure 6. The q-statistics values of individual factors (a), and interaction between pairwise factors (b). ‘**’ represent significance at 99% (p < 0.01); ‘↑’ and ‘↑↑’ represent the interaction types of bivariable enhanced and nonlinear enhanced, respectively. The details of the interaction type can be found in Table 2.
Remotesensing 14 04046 g006
Figure 7. The final fitted structural equation model for the NEP change in Qilian Mountains (a) and the total contributions of the driving force to NEP (b). The arrows denote the effect paths of the driving factors, and the numbers adjacent to the arrows are standardized regression coefficients of the corresponding effect path. A black line denotes a positive effect, while a red line represents a negative effect. The boxes denote the latent variables, while the ellipses represent observed variables. Asterisks indicate the significant level of the standardized regression coefficient (* and ** indicate p < 0.05 and p < 0.01, respectively). R2 is the percentage of variance explained by the model. NE: natural environment; CF: climatic factors; HA: human activity intensity change.
Remotesensing 14 04046 g007
Figure 8. The spatial distribution of the change trends of annual average temperature (a), annual total precipitation (b), annual solar radiation (c), the inter-annual change trend of annual average temperature and annual total precipitation (d), and annual solar radiation (e) in Qilian Mountains from 2000 to 2020. The inset figures are the significant level of the changes, the red color denotes p < 0.05, while the gray color represents p > 0.05.
Remotesensing 14 04046 g008
Figure 9. Change in farmland area and livestock quantity (a), population and GDP (b) in QLM from 2000 to 2020.
Remotesensing 14 04046 g009
Figure 10. Relationship between human activity intensity (HAI) change and NEP change from 2000 to 2020 in QLM.
Remotesensing 14 04046 g010
Table 1. Data used in this study.
DataTimeResolutionSource
MOD17A32000–2020500 mhttps://ladsweb.modaps.eosdis.nasa.gov (accessed on 13 May 2022)
MCD12Q12000–2020500 mhttps://ladsweb.modaps.eosdis.nasa.gov (accessed on 3 May 2022)
Altitude-30 mhttps://earthexplorer.usgs.gov/ (accessed on 15 May 2022)
Soil typeThe 1990s1:1,000,000https://www.resdc.cn/ (accessed on 13 May 2022)
Solar radiation2000–2020~4400 mhttps://climate.northwestknowledge.net/ (accessed on 17 May 2022)
Human activity intensity2000–20181000 mMu et al. [36]
Meteorological data2000–2020-http://data.cma.cn/ (accessed on 23 May 2022)
Table 2. Interaction type of driving factors in the GDM.
Type of InteractionRelations of q-statistics Value
Nonlinear weakenq (X1X2) < Min (q (X1), q (X2))
Single factor nonlinear weakenMin (q (X1), q (X2)) < q (X1X2) < Max (q (X1), q (X2))
Bivariable enhancedQ (X1X2) > Max (q (X1), q (X2))
Independent q (X1X2) = q (X1) + q (X2)
Nonlinear enhancedq (X1X2) > q (X1) + q (X2)
Table 3. Correlations between driving factors and NEP change.
NEP_cT_cP_cAltitudeSlopeSR_cHAI_c
T_c0.521 **
P_c0.322 *0.307 *
Altitude−0.510 *−0.415 **0.224 **
Slope0.151 −0.062 0.1920.009
SR_c−0.221 *−0.263−0.236 *0.257 **−0.133 *
HAI_c−0.210 *0.110 *0.089 *−0.235 **−0.147 *0.004
Aspect0.220 0.051 *−0.010−0.008 −0.065 −0.110 0.057
Note: NEP_c: NEP change; T_c: temperature change; P_c: precipitation change; SR_c: solar radiation change; HAI_c: human activity intensity change. * p < 0.05; ** p < 0.01.
Publisher’s Note: MDPI stays neutral with regard to jurisdictional claims in published maps and institutional affiliations.

