Article

Urban Green Space Planning Based on Remote Sensing and Geographic Information Systems

1
School of Architecture, Chang’an University, Xi’an 710061, China
2
School of Water and Environment, Chang’an University, Xi’an 710054, China
*
Author to whom correspondence should be addressed.
Remote Sens. 2022, 14(17), 4213; https://doi.org/10.3390/rs14174213
Submission received: 17 July 2022 / Revised: 17 August 2022 / Accepted: 22 August 2022 / Published: 26 August 2022
(This article belongs to the Section Environmental Remote Sensing)

Abstract

:
Urban construction land expansion damages natural ecological patches, changing the relationship between residents and ecological land. This is widespread due to global urbanization. Considering nature and society in urban planning, we have established an evaluation system for urban green space construction to ensure urban development residents’ needs while considering natural resource distribution. This is to alleviate the contradiction of urban land use and realize the city’s sustainable development. Taking the Fengdong New City, Xixian New Area as an example, the study used seven indicators to construct an ecological source evaluation system, four types of factors to identify ecological corridors and ecological nodes using the minimum cumulative resistance model, and a Back Propagation neural network to determine the weight of the evaluation system, constructing an urban green space ecological network. We comprehensively analyzed and retained 11 ecological source areas, identified 18 ecological corridors, and integrated and selected 13 ecological nodes. We found that the area under the influence of ecosystem functions is 12.56 km2, under the influence of ecological demands is 1.40 km2, and after comprehensive consideration is 22.88 km2. Based on the results, this paper concludes that protecting, excavating, and developing various urban greening factors do not conflict with meeting the residents’ ecological needs. With consideration of urban greening factors, cities can achieve green and sustainable development. We also found that the BP neural network objectively calculates and analyzes the evaluation factors, corrects the distribution value of each factor, and ensures the validity and practicability of the weights. The main innovation of this study lies in the quantitative analysis and spatial expression of residents’ demand for ecological land and the positive and negative aspects of disturbance. The research results improve the credibility and scientificity of green space construction so that urban planning can adapt and serve the city and its residents.

Graphical Abstract

1. Introduction

The urbanization process has caused a series of negative impacts on urban spatial planning [1], including ecological forest land destruction [2], urban area management [3,4], water resource crisis [5], and the decline of residents’ happiness index. In urban construction and management, it is not only necessary to pay more attention to the protection and restoration of natural ecology but also to the desire of urban residents for the natural environment, which makes humanities and urban development the most important issues in urban planning [6], prompting countries to re-examine the relationship between urban residents and the environment [7], aiming to plan a just and sustainable city [8,9,10]. To further improve the urban ecological environment, maintain high-quality urban development, realize the value of ecological services, and optimize the living environment of residents, green space construction has become an important measure of urban planning, and the construction of an urban green space network has become a necessary way to achieve sustainable urban development.
In the initial stage, functions are the major focus in the design of green spaces [11], mainly manifested in planning a city’s open spaces [12], constructing city parks [13], and increasing urban green spaces. Little emphasis is placed on the quality of the green land [14]. In the later stage, the focus gradually shifts to city suburbs, as nature protection and construction of green and open spaces are valued [15]. The design of the green space network is also valued. Further, while the relationship between urban green spaces and cities has become increasingly clear, urban public spaces must be repaired and improved [16,17], and the regional green spaces must be protected and enhanced [18]. Accordingly, the development of urban green spaces progresses toward curbing global climate change [19], protecting the ecosystem [20], promoting the health and well-being of residents [21,22,23], and improving city quality [24]. Since the 1980s, Chinese research [25], such as the pioneering study, People and Green Spaces [26], has examined green spaces in China. Such studies and constituent elements have since proliferated, usually appearing along with keywords such as ecological green spaces, landscapes and greenbelts, open spaces, and green space systems. Elements essential to green spaces include a region’s natural ecological environment [27], urban green spaces, dedicated green spaces, ecological green spaces [28], urban forests, three-dimensional afforestation, cultivated land in urban areas, and water wetlands [29]. Some studies expand the scope of green space research to include not only land usage [30] but also policies and regulations [31]. Theoretical, scientific, and technological advancements have also induced significant progress in the research methods on green spaces, among which geographic information systems (GIS) and remote sensing (RS) are prevalent. With the continuous segmentation of research areas and purposes, people’s needs and environmental protection have garnered increasing attention [32,33].
In the 1960s, Roger Tomlinson first proposed the term GIS [34]. Since the 1990s, GIS has been gradually introduced into the study of urban green space ecological planning, for example, the current situation of landscape analysis [35] and spatial development prediction [36]. Regarding building urban green space, GIS is used in various aspects, such as source identification [37]. In the process of identifying ecological sources, some scholars use remote sensing images to identify large forests, water [38,39], scenic areas, and nature reserves to define ecological sources [40,41]. Some scholars have used GIS to analyze the sensitivity [42] and suitability [43] according to the characteristics of the study area and city and have built a comprehensive evaluation index system to select patches. Considering the service function of ecosystem patches, water balance equation [44,45], food supply, water production, soil protection, habitat protection, and near-water recreation [46], factors such as biodiversity conservation value, water resources security, and soil conservation [47] were integrated into the evaluation indicators of ecological land by GIS. The previous literature has comprehensively considered factors, including spatial structure [48] and landscape connectivity [49].
In past studies, although the nature of ecosystem functions was considered, the disturbance of ecological sources by human activities and the demand for ecological land at the urban scales were ignored [50]. Ecological needs include the needs for ecosystem services and the needs of residents for ecological units [51], considering that ecological needs can better reflect the concern for people and can also better coordinate the relationship between people and urban development. Furthermore, in past research, the weight of the evaluation system was usually calculated in a subjective way, and the research had certain blindness and uncertainty. In 1986, Rumelhart proposed a new neural network framework called the back-propagation (BP) neural network [52]. The artificial neural network method is used to calculate the weight of the evaluation index, which eliminates the shortcoming of artificial influence on the weight and lack of motivation [53]. The BP neural network calculates the contribution rate of each factor weight [54], which is popular in other fields. In urban planning, it is mostly used for weight calculation in the evaluation process, such as suitability evaluation [55,56], which reduces the influence of human subjective judgment on the weight to a certain extent and improves the scientificity of the evaluation results. Combined with the quantitative analysis of the BP neural network, the spatial expression and coupling of RS and GIS can better build an urban green space network.
Under the platform of RS and GIS, the BP neural network is used in the research to calculate the weight to ensure the validity and practicability of the ecological source evaluation. Considering landscape and human factors comprehensively, an index system is developed to identify ecological sources from ecosystem service function and residents’ demand for ecological land, and the least cumulative resistance model is used to identify ecological corridors and select ecological nodes, followed by urban green space construction. This article provides a new perspective for improving the scientificity and rationality of urban green space construction.

2. Study Area and Data Sources

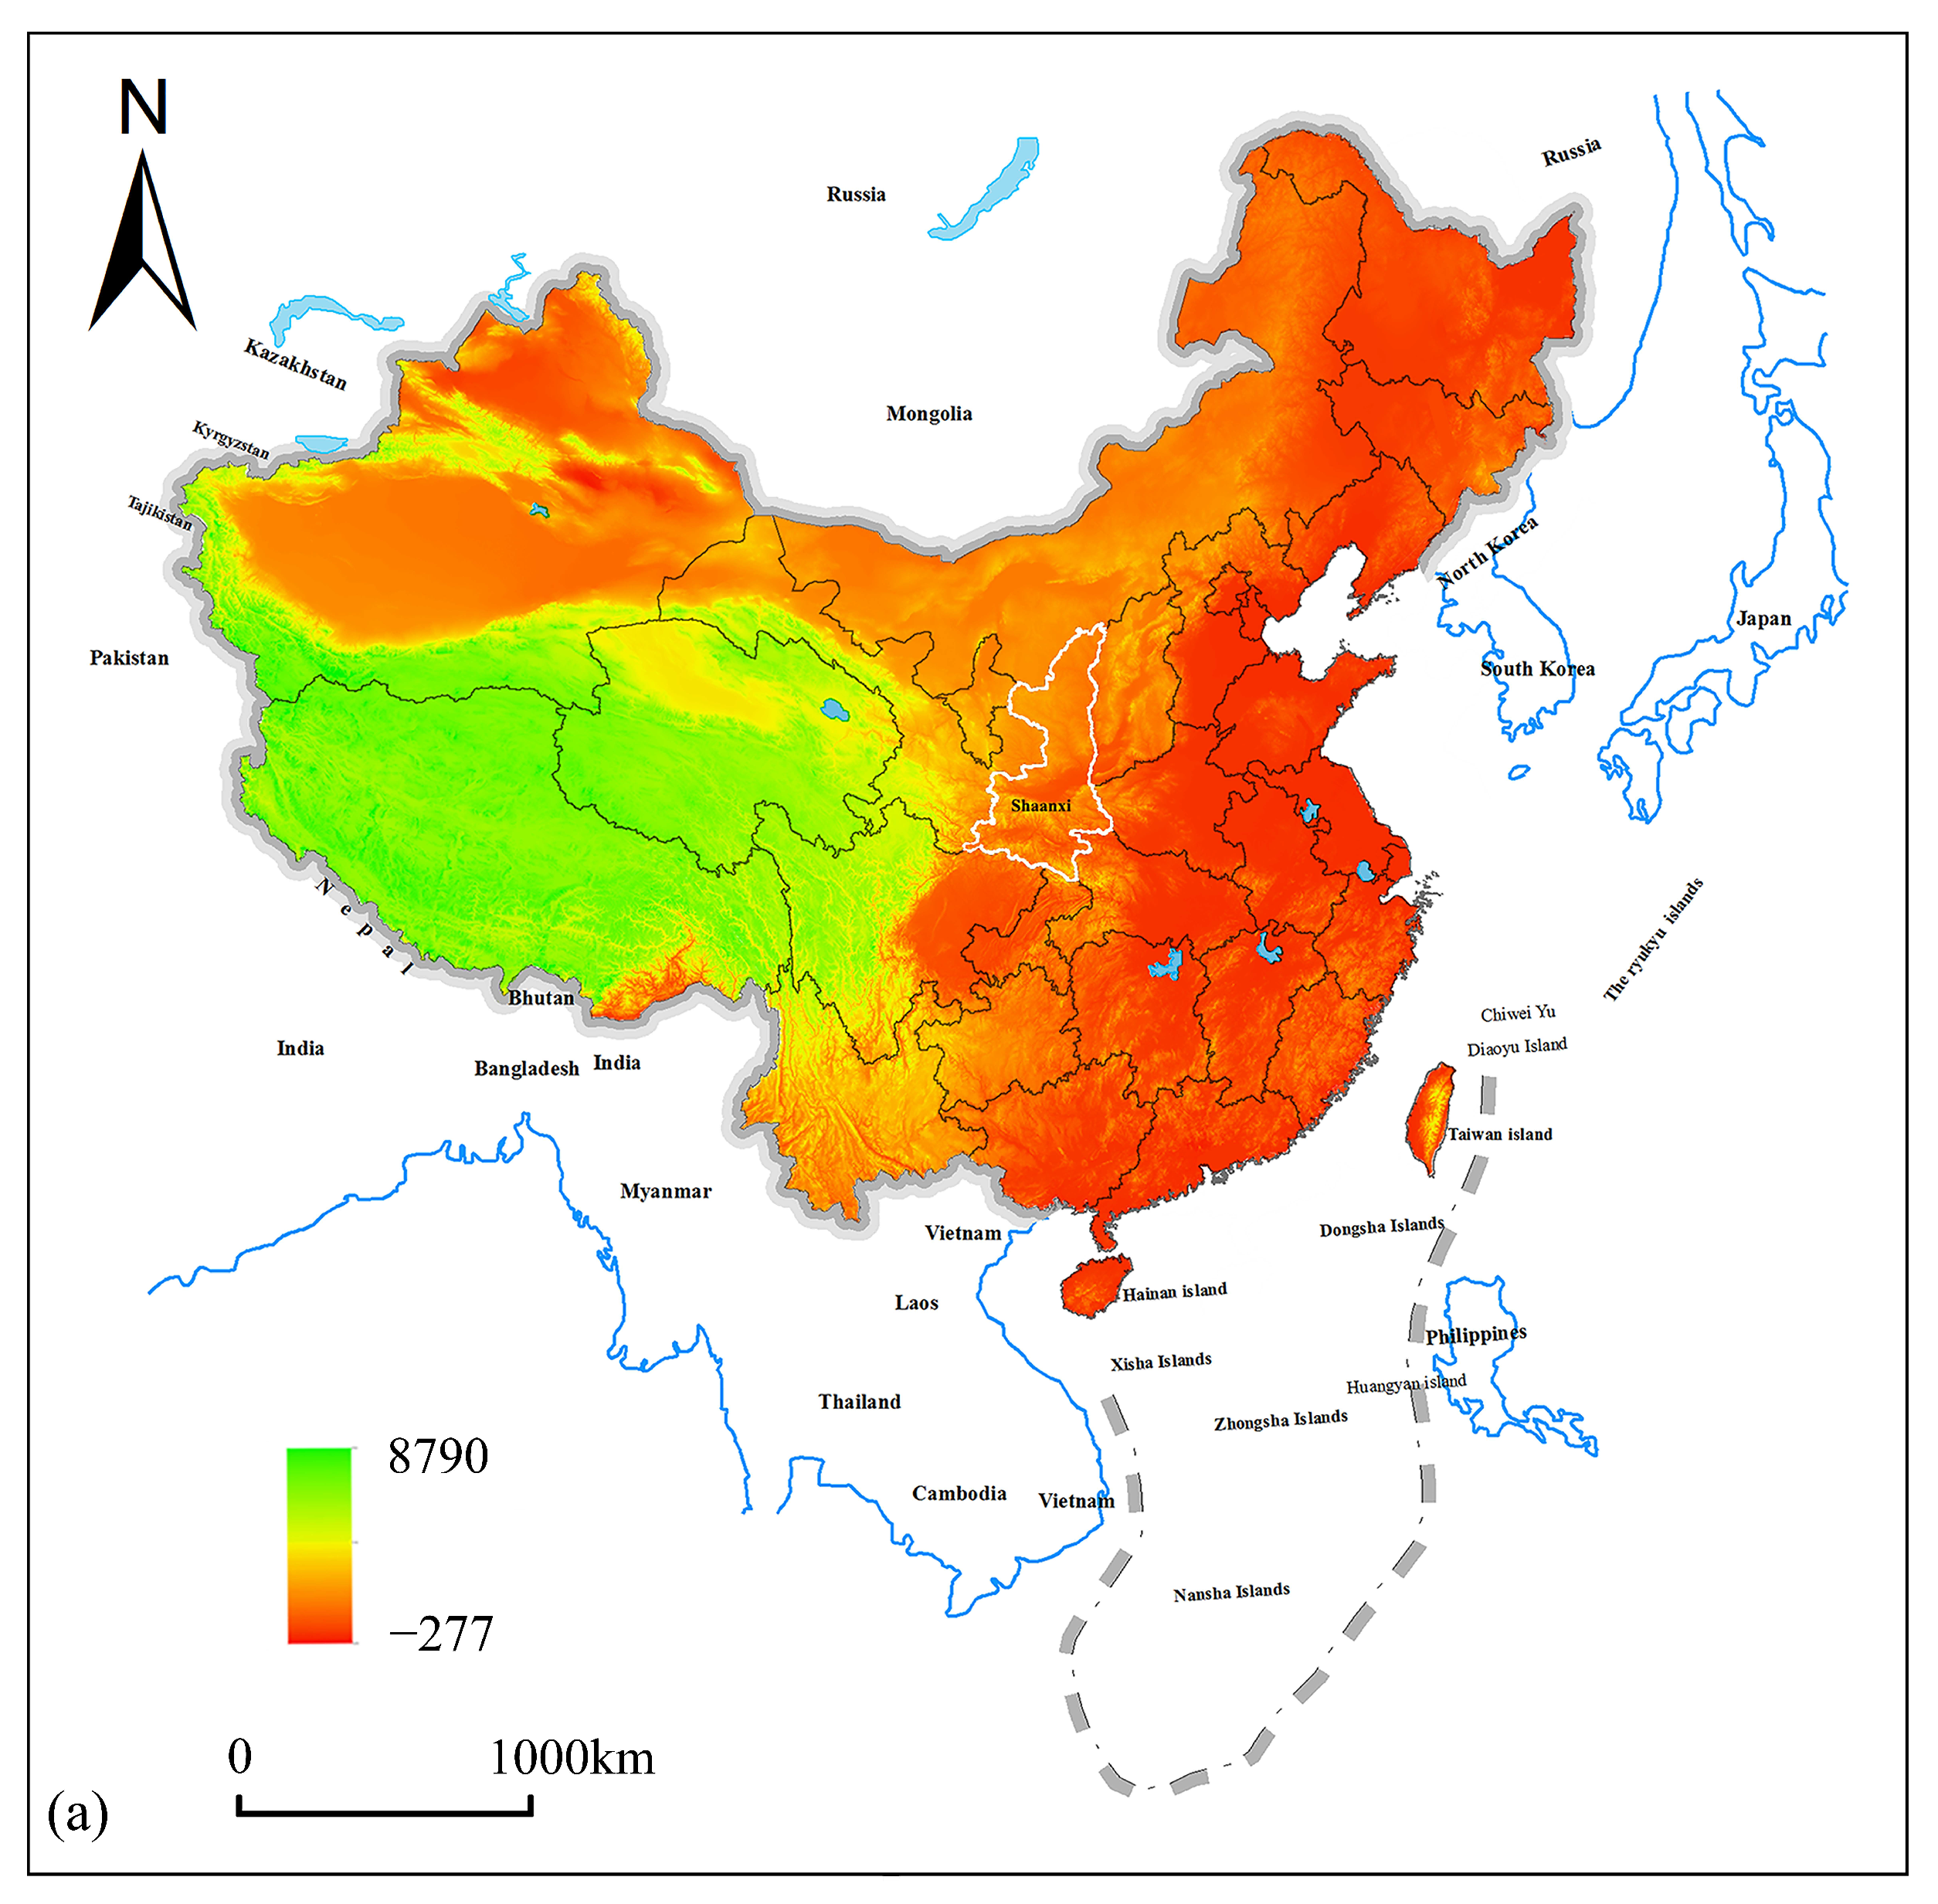
2.1. Overview of the Study Area
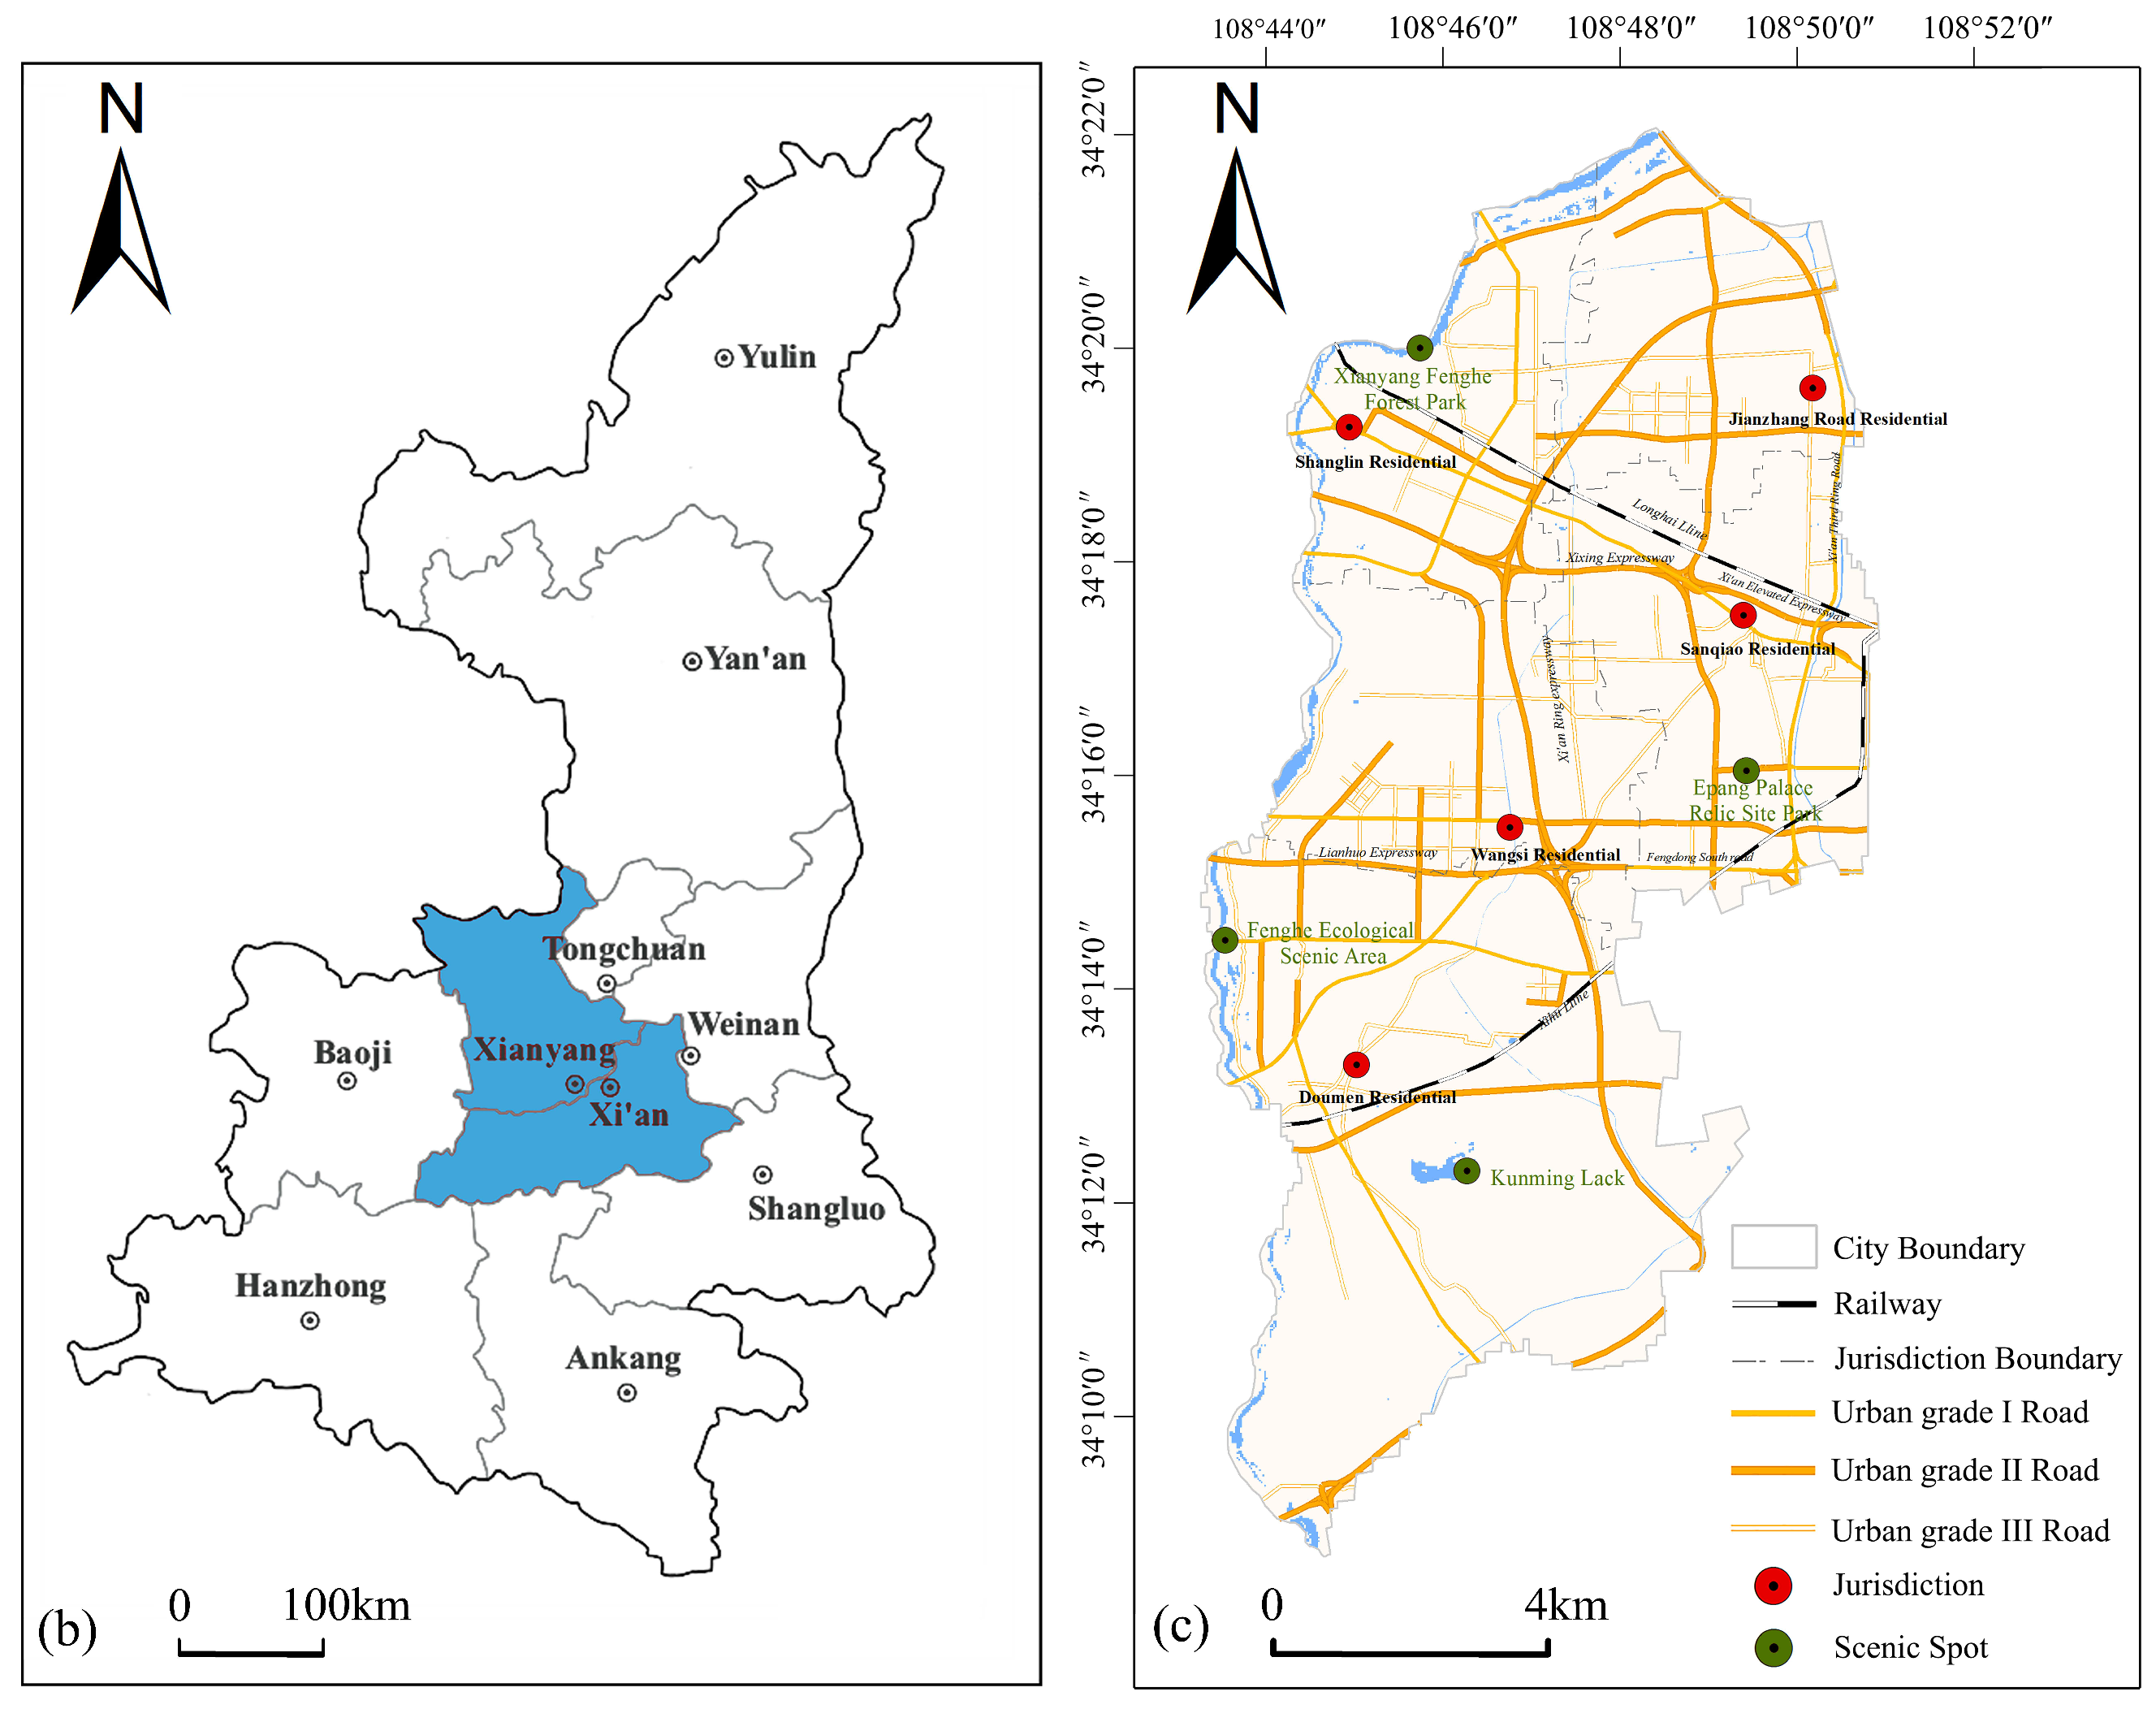
Fengdong New City of Xi’an is located in the Guanzhong Plain, bound by the Weihe River to the north and the Qin Mountains to the south. The town has natural water systems flowing through in all directions, with four distinct seasons of different temperatures and humidity and abundant light, heat, and water resources. The annual average temperature is 13 °C, with an average temperature of 26.5 and −1.4 °C in July and January, respectively. The frost-free period lasts 219 days, and the average annual precipitation is 600–800 mm. The area is dotted with high-quality arable land, a long history and culture with numerous cultural relics and sites, broad and rich green resources, and a gentle and elegant humanistic heritage. With a special ecological status, the town is the core area of the Guanzhong Plain urban agglomeration in the Xixian New Area. Fengdong New City aims to improve the sustainability and livability of the city and is a spatial carrier of important ecological functions in building a modern Xi’an (Figure 1).

2.2. Data Source

This study considered Fengdong New City of Xixian New Area and calculated the biodiversity service equivalent, fractional vegetation cover index, normalized difference vegetation index, normalized difference water index, China’s soil erosion model, intensity index of the demand for outdoor leisure, and human settlement index (HSI). The research data included digital satellite images from Landsat 8OLI_TIRS, the eighth satellite of the United States of America Landsat program with a spatial resolution of 30 m (www.gscloud.cn accessed on 16 July 2021), ALOS (12 m) terrain elevation data from digital elevation models (www.tuxingis.com accessed on 16 July 2021), daily rainfall data from rainfall stations (www.resdc.cn accessed on 16 July 2021), data of organic carbon content in soil (www.fao.org accessed on 16 July 2021), data of soil texture spatial distribution (www.resdc.cn accessed on 16 July 2021), and nightlight image data (https://eogdata.mines.edu/download_dnb_composites.html accessed on 16 July 2021). The study adopted the Gauss–Kruger projection and the WGS1984 coordinate system.
Satellite digital images with less than 2% cloud cover were processed with ENVI 5.2. After supervised classification and visual interpretation, the study extracted data on land-use status in the research setting. Considering the Green-Space Development Plan of Fengdong New City (2020–2035) as a reference, while making adjustments based on actual research, the required NDVI data were obtained with Band Math.
The soil type data come from the United Nations Food and Agriculture Organization and the 1:1,000,000 soil grid database of China. The data are in grid format, with a 1 km resolution. The main data include T_CLAY (clay particle), T_SAND (sand particle), T_SILT (silt particle), and T_OC (organic carbon).
The study employed China’s annual surface climate data as meteorological data, obtained from the China Meteorological Data Sharing Service System, and annual climate data from basic and general stations of five surface meteorological observation stations surrounding Fengdong New City. The data include PRE_Max_1 h (maximum 1-h precipitation), PRE_Time_2008 (precipitation from 20:00 to 08:00), PRE_Time_0820 (precipitation from 08:00 to 20:00), PRE_Time_2020 (precipitation from 20:00 to 20:00) and PRE_Time_0808 (precipitation from 08:00 to 08:00).

3. Materials and Methods

3.1. Research Technology Route

This study considered the construction of urban green space from the perspective of ecosystem service functions and residents’ needs for ecological land. Through the analysis of remote sensing data, rainfall data, soil organic carbon content data, etc., identification of corridors and ecological nodes, with the support of RS and GIS, Normalized Difference Vegetation Index (NDVI), Normalized Difference Water Index (NDWI), NDVIsoil, NDVIveg, and Vegetation Cover Index were calculated as important natural environment condition indicators. Using these indicators, combined with night light data and the distribution of residents, seven indicators (biodiversity, water resource conservation capacity slope, relative location, vegetation coverage, soil conservation capacity, outdoor recreation intensity, and ecological unit scarcity) were selected to analyze the urban green space ecological source. When constructing the resistance surface, land use types, rivers, roads, and construction land were selected, landscape factors and human factors were comprehensively considered, and the minimum cumulative resistance model was used to realize the multi-dimensional evaluation of ecological corridors. Next, ecological nodes were selected to construct an urban green space ecological network. In the evaluation system, the study used the learning algorithm of the BP neural network to calculate the weight. This method of determining the weight can reduce the influence of subjective judgment on the weight to a certain extent and improve the scientificity of the evaluation results (Figure 2).
ENVI combines band-based and file-based techniques using interactive functions, providing tools to convert image data into map formats, ENVI combined with ArcGIS, in the construction of urban green spaces, which provides comprehensive data visualization and analysis for all types of images [57]. In this study, ENVI was used to preprocess remote sensing images from Landsat8 satellite data, including image registration and cropping. The Maximum Likelihood Estimate (MLE) was used for supervised classification, and the classification of land use in the study area was obtained through class definition, sample selection, image classification, result processing and verification, after which the accuracy of the classification results was evaluated. In addition, using Band Math, by inputting the near-infrared band, red band, green band, and near-infrared band, the NDVI and NDWI values were obtained and analyzed, providing the basis for subsequent related research. Using spatial analysis in ArcGIS, it can perform spatial data operations and spatial data analysis methods such as distance, area, path calculation, buffer analysis, spatial query, and overlay analysis to identify, extract and quantify various urban green space landscape elements. The index elements and their distribution rules are displayed in a visual way, the geographic location and spatial relationship of each landscape element are more intuitively displayed, and the results of planning and design are simulated and analyzed. Through the processing of geographic information, the characteristics of urban green space landscape elements are comprehensively expressed in multi-level and multi-form.

3.2. Evaluating the Importance of Ecological Land in Urban Green Space

3.2.1. Calculating Ecosystem Functions

Understanding the service functions of urban green space ecosystems is an important prerequisite for the correct planning and layout of green spaces. Ecosystem functions usually consider the natural attributes of the land and are often used to measure the quality of the natural ecological environment of cities. They emphasize the sustainability of ecological units, which maintain the entire ecological environment of a city via self-adjustment and self-repair. In identifying ecological sources, evaluating ecosystem functions is a criterion for evaluating the quality of the natural environment of urban green spaces. According to the characteristics of urban green spaces, combined with the current situation of the research setting, while considering basic physical and geographical elements (e.g., terrain, climate, soil, water source, and biodiversity), features such as water resource conservation and soil retention capacity are quantified to represent the ecosystem service functions of green spaces, among which the distance from water sources, slopes, and fractional vegetation cover index determine water resource conservation.
Biodiversity conservation. Different land-use types have different ecosystem service values [58]. A region maintaining high biodiversity service value per unit area of the ecosystem can provide a favorable living environment for living creatures. Regarding the biodiversity service value per unit area of the ecosystem of Xi’an City and Xixian New Area [59,60,61], corrected by the mean NDVI [62], the biodiversity service value maintained by the study area is obtained.
D L = N D V I i ( N D V I t ) × D L O
where DL denotes the biodiversity service equivalent after correction with reference to NDVI; NDVIi denotes the mean NDVI corresponding to grid i; NDVIt denotes the mean NDVI of all grids in landscape type t corresponding to grid i; and DLo denotes the basic biodiversity service equivalent of landscape type t corresponding to grid i.
Water resource conservation function. The water resource conservation function mainly provides adjustment and supply services in the ecosystem [63]. Under the same natural conditions at the urban scale, the study selected relative location, fractional vegetation cover [64], and slope as the main indicators to comprehensively evaluate the water resource conservation capacity of the research setting. The fractional vegetation cover (FVC) is estimated with a linear pixel bipartite model [65].
F V C = ( N D V I N D V I s o i l ) ( N D V I v e g N D V I s o i l )
where FVC denotes fractional vegetation cover; NDVIsoil denotes the NDVI value of bare land and area without vegetation coverage; and NDVIveg denotes the NDVI value of the vegetation cover pixel.
Evaluation of soil retention capacity. The soil retention function provides important adjustment services for urban land, affecting the ecological security of urban green spaces and sustainable development in the future. The study employed field investigations in the early stage and the Chinese Soil Loss Equation (CSLE) to evaluate soil retention capacity [66]. The model regards the relevant content of CSLE. The CSLE model is concise and efficient, as per China’s soil and water conservation situation and topographic features. The basic form of the formula is,
A = R · K · L · S · B · E · T
where A denotes soil erosion modulus, measured with the unit of t/(hm2·a); R denotes the rainfall erosivity factor, measured with the unit of (MJ·mm)/(hm2·h·a); K denotes the soil erodibility factor (t·hm2·h)/(hm2·MJ·mm); L and S denote the dimensionless slope length and factor; B denotes the dimensionless factor of vegetation cover and biological measures; E denotes the dimensionless engineering measure factor; and T denotes the dimensionless tillage measure factor.

3.2.2. Calculating Ecological Demand Intensity

Calculation of ecological demand intensity usually considers the social attributes of ecological units. Influenced by the urban development level and residents’ demand for quality of life, it beautifies the environment and provides residents with spaces for recreational activities, rest, relaxation, and getting close to nature while enhancing the landscape effect of a city. In urban green spaces, the ecological value mainly affects the daily life of residents from two aspects. The first is the scarcity of the type of land in the region; the second is the intensity of residents’ activities. Therefore, the intensity of residents’ demand for each ecological unit mainly regards the relative location, land-use type, and amount of local ecological resources [7]. Normally, the closer a unit is to residential and commercial areas, the higher the demand intensity; the denser the setting population, the higher the ecological demand. Thus, the regional ecological demand is estimated by the intensity of outdoor recreation and the scarcity of ecological land.
Outdoor recreation intensity. Residents’ choice of leisure destinations is mainly affected by criteria such as land-use type, ecological benefits, accessibility relationship, scale, and the degree of closeness to the natural environment. Meanwhile, travel distance is also affected by special factors, such as working days and holidays. Hence, the intensity index of the demand for outdoor leisure is used to represent the degree of residents’ demand for ecological units in the city [31]. Regarding the nighttime light data, data on urban land can be extracted by capturing light signals [67]. Different diffusion radii of nightlight index and density values reflect the population density and range of residents’ activities. In green spaces, each ecological unit must serve numerous communities. Therefore, the study calculates the average distance as follows:
S I i = 0.5 P D i 1 + 0.5 P D i 2 | E D i | × ( N D W I i + N D V I i )
| E D i | = j = 1 n D i j j
where SIi denotes the people’s demand for outdoor leisure fulfilled by ecological land i; PDi1 and PDi2 denote the demand of the people on working days and holidays; NDWIi denotes the corresponding normalized difference water index; NDVIi denotes the corresponding normalized difference vegetation index; EDi denotes the distance between ecological land i and neighboring communities within a 3 km service radius; and j denotes a community within the 3 km service radius of an ecological land.
Scarcity of ecological units. At the urban scale, the contradiction between the high density of population and the low number of green spaces increases the demand for ecological units per the residents in the region. In the search for human agglomeration areas in southeastern China with multi-source RS data, Lu et al. integrated the DMSP/OLS nighttime light data and the normalized difference vegetation index of Terra MODIS and purposed the HSI accordingly [68,69]. The data reflect the degree of human aggregation in space. The higher the value, the higher the degree of aggregation of the setting population. In densely populated areas, construction usually prevails over other land usages, resulting in the scarcity of ecological units, thereby indicating that the area has a stronger ecological demand.
H S L = ( 1 N D V I m a x ) + N T L n o r ( 1 N D V I n o r ) + N D V I m a x + N T L n o r × N D V I m a x
N T L n o r = N T L N T L m i n N T L m a x N T L m i n
N D V I m a x = M A X ( N D V I 1 , N D V I 2 , N D V I 3 , , N D V I n )
where NDVI1, NDVI2, NDVI3, …, NDVIn denote the monthly average NDVI images of multiple periods; NDVImax denotes the maximum value of monthly average NDVI in the study time interval; NTLnor is the normalized nighttime light brightness value; NTL is the original value; and NTLmin and NTLmax represent the respective minimum and maximum brightness values of the nightlight data, respectively.

3.2.3. Constructing the Indicator System

With the full understanding of the classification and ecological value of urban land, guided by the theories of ecology, geographical science, and landscape architecture, and combined with urban development characteristics, indicators for the identification of ecological sources are selected based on ecosystem functions of various types of land and residents’ demand for ecological elements. The study employs indicators such as biodiversity, water resource conservation capacity, soil retention capacity, outdoor recreation intensity, and HSI to construct an evaluation system for the importance of ecological sources in urban green spaces. The assessment method based on the biodiversity index, distance from water sources, slope, FVC, the CSLE, outdoor recreation intensity index, and HSI is divided into the target, criterion, and indicator layers (Table 1).

3.3. Extracting Ecological Corridor Data per the Minimum Cumulative Resistance Model

3.3.1. Determining the Resistance Factor and Values

Resistance refers to the obstacles encountered by ecological sources during expansion or by species migrating between landscape units. Given the differences in the characteristics of the study area and research objects, the resistance factor and values will also be different. Per the ecological environment and urban construction situation in Fengdong New City, we divide the resistance factors into landscape resistance and human interference factors and construct an evaluation indicator system for ecological resistance from land-use type, distance from rivers, construction land, and distance from roads.
Landscaperesistance. Different land-use types have different resistances to the expansion of ecological sources (Figure 3). When the two land-use types have closer landscape characteristics, the resistance will be smaller. As per the land-use type map of the research setting, the land is classified into five types: construction land, woodland, cultivated land, water area, and urban green spaces. Rivers guide and promote the expansion of ecological sources. Therefore, when an ecological source is closer to a river, it encounters less resistance when expanding. Distance from rivers is divided into five grades.
Humaninterference. Roads are the backbone of urban development and guide the expansion of urban spaces. However, they hinder the development of ecological sources. An ecological source closer to roads encounters greater resistance during expansion. The resistance value of different road levels will also be different. In this study, the comprehensive traffic planning map was chosen and vectorized with ArcGIS 10.7 (Esri, Redlands, CA, USA) to reveal the roads with different levels and divide the road network layers into five grades with distance analysis tools. The status and future development of urban construction land are major obstacles to the expansion of ecological sources and are divided into five grades as per the proximities and magnitudes of resistance.
After choosing the resistance factors, they are graded and assigned values according to their resistance to ecological activities and source expansion, thereby establishing a resistance evaluation system. The setting of the resistance value can quantitatively reflect the challenge in spatial expansion and the resistance during the expansion of an ecological source [70]. In this study, the range of resistance levels is set at 0–9, which is merely a relative value to facilitate the calculation with no true meaning (Table 2).

3.3.2. Minimum Cumulative Resistance Model

Ecological corridors are key pathways connecting ecological sources that can effectively promote biological activities and ecological processes. A minimum cumulative resistance (MCR) model calculates the minimum cumulative cost distance between patches based on grid cell information to identify the directions and paths of MCR between sources. Knaapen et al. proposed the MCR model in 1992 [71] to analyze the costs of different processes when expanding in horizontal space, reflecting the characteristics of adaptability, scalability, and accessibility. Using the MCR model to extract the corridor data means calculating the shortest path for each ecological land unit to overcome resistance and reach the nearest ecological source. “Sources” mainly refer to the core ecological land. With ecological sources determined, the MCR model determines the MCR, laying the foundation for determining the existing ecological corridors, understanding the characteristics of the corridors, and optimizing the landscapes. The formula is as follows:
M C R = f min j = n i = m D i j R i
where MCR is the MCR value; f is the positive correlation function between the MCR and the ecological process; Dij is the spatial distance from source j to destination unit i; and Ri denotes the resistance coefficient of unit i to the movement of a certain species.

3.4. Determination of the Weight of the Evaluation Systems

The learning algorithm of the BP neural network is a feedforward network composed of neurons with nonlinear transfer functions [72]. Using an artificial neural network to determine the weights can somewhat reduce the influence of subjective human judgment on weights, increase the obtained weights, and improve the scientific quality of the evaluation results. The sample data of the BP network model comprise training, validation, and test samples. The sample data are determined as per the selection and grading of the indicators. The BP neural network is mainly composed of input, hidden, and output layers. The number of nodes in the input layer is based on the problem itself and is related to the number of indicators. The output layer is related to the evaluation target. The number of nodes in the hidden layer is determined as per the number of nodes in the input layer and the output layer [73].
After training, validating, and testing the evaluation model, the relationship between each layer of the neural network and neurons is obtained within the allowable range of errors. The comprehensive weight is determined by the weights from the input layer to the hidden layer and that from the hidden layer to the output layer. Thus, the following indicators depict the relationship between the input factors and the output factors [74].
Correlation significant coefficient
r i j = k = 1 p W k i ( 1 e x ) / ( 1 + e x )
x = w j k
Index of correlation
R i j = | ( 1 e y ) / ( 1 + e y ) |
y = r i j
Absolute influence coefficient
S i j = R i j / i = 1 m R i j
where i is the input unit of neural network, i = 1, …, m; j is the output unit of the neural network, j = 1, …, n; k is the unit of the hidden layer, k = 1, …, P; Wki is the weight coefficient of input neuron i and hidden neuron k; wjk is the weight coefficient of output neuron j and the hidden neuron k; and S is the weight of interest.

4. Results

4.1. Ecological Sources

Based on the established comprehensive evaluation index systems for the importance level of ecological land in urban green spaces and the indicator weights, we divided the impact factors of different grades into four grades (extremely, highly, moderately, and slightly important), using the natural breaks classification method. Using spatial analysis tools, we entered the indicator weights and superimposed them onto the index factors to evaluate the raster layer information, from which the results of ecological value grade distribution of Fengdong New City were obtained. The study selected the areas with high ecological value grades as the ecological sources of the study area.

4.1.1. Distributing Ecological Land Importance under the Influence of Ecosystem Functions

Overall, the biodiversity service capacity of Fengdong New City is relatively low (Figure 4a). The areas with high biodiversity service values are mainly distributed around the Xi’an Raocheng Expressway, the Fenghe River and its intersection, and the Fenghui Channel, which are relatively scattered within the city, mainly overlapping with green road belts and urban green spaces. Areas with high biodiversity service value are scarce and scattered along the Weihe River in the north, the Fenghe River in the northwest, the Taiping River in the northeast, and the Zaohe River in the east.
The water resource conservation capacity is mainly affected by the FVC, the distance from water sources, and the slope (Figure 4b,c). The main types of vegetation coverage include woodlands, cultivated land, and urban green spaces. The water resource conservation capacity is also affected by the distance from the water source. The closer the distance to the water source, the stronger the water resource conservation capacity. The effect of the slope factor is that the greater the slope, the lower the water resource conservation capacity. As the Fengdong area has a flat terrain, the slope factor has less influence on the water resource conservation capacity.
Soil erosion is mainly determined by natural factors and socio-economic factors. As the Fengdong area is located in the Guanzhong Plain, the area has a flat terrain with modest topographic relief. Moreover, the area’s climate is mild. Rainfall decreases from the northwest to the southeast, and rain erosion and scouring are weak. At the urban scale, the B value of the area is calculated on the basis of FVC. The calculation of the engineering measure factor references the land-use type, while the value of the tillage measure factor is determined according to the located area and cropping system. The soil erosion amount analysis (Figure 4d) shows that the soil erosion amount is mainly affected by the slope. Generally, the soil erosion capacity in the city is weak, while the service functions of soil and water conservation are good.
In identifying ecological sources in green spaces, superimposing the calculation results of biodiversity service equivalent, slope, distance from water sources, FVC index, and soil erosion model of China when only system functions are considered, the results of the importance levels of the ecological values of various land show that the extremely important ecological land covers 12.56 km2, accounting for 7.14% of the study area. Moreover, the highly important ecological land covers 32.16 km2, accounting for 18.29%. The moderately important ecological land covers 46.89 km2, accounting for 26.66%. The slightly important ecological land covers 84.27 km2, accounting for 47.91%.
From the perspective of the distribution of extremely important ecological land, areas with strong ecosystem functions are mainly distributed along important water resources, including the Wei River in the north, the Fenghe River in the west, the Taiping River in the central area, the Zao River in the east, the Fenghui Channel, the Kunming Lake in the south, and their surrounding areas. The extremely (highly) important ecological land of 9.07 km2 (18.22 km2) comprises urban green spaces, accounting for the highest proportion of 72.21% (56.65%). Thus, the areas covered by large areas of waters and vegetation have more significant service functions and more important ecological values and are the core ecological sources. Areas with lower ecological value are mainly construction and cultivated land, accounting for 97.91% in total. The ecological values of cultivated land in Fengdong have not been fully demonstrated given the influence of human activities and urban planning; 2.05% of the slightly important ecological land comprises urban green spaces because some green spaces in the city are streetside and auxiliary green spaces that are scattered and cover small areas, resulting in weak ecological functions (Figure 5).

4.1.2. Distributing Ecological Land Importance under Ecological Demand Intensity

The community sites closer to the ecological land are mainly in the southwest of Doumen Subdistrict, the middle of Wangsi Subdistrict, and the west, middle, and southwest of Shanglin Subdistrict. Areas with a high-intensity index for the demand for outdoor recreation are mainly distributed in major scenic areas, including Kunming Lake, Fenghe River Ecological Scenic Area, Xianyang Fenghe Forest Park, and Epang Palace Park. Within those areas, residents are also free to choose from numerous street green spaces and pocket parks while enjoying outdoor leisure activities (Figure 6a).
From Figure 6b, the areas with the highest scarcity of ecological land in Fengdong New City are Kunming Lake and Fenghe River Ecological Scenic Area, followed by the areas distributed to the east side of Xi’an Elevated Fast Trunk Road Express and the north side of the Lianyungang-Khorgas Expressway. Overall, considering the balance of supply and demand between the population and the number of ecological lands, the scarcity of ecological land in Fengdong New City is higher in the north than in the south. Land-use types include urban residential areas and ecological land.
When considering the ecological demand of residents, the results of the outdoor demand index and the HSI are superimposed to obtain the evaluation results of the distribution of ecological land importance (Figure 7). The extremely important ecological land covers 1.40 km2, accounting for 0.80% of the study area. The highly important ecological land covers 27.31 km2, accounting for 15.46%. The moderately important ecological land covers 68.16 km2, accounting for 38.57%. The slightly important ecological land covers 79.82 km2, accounting for 45.17%.
Relative to the evaluation results of the importance of ecological land when considering ecosystem functions and residents’ demand, the extremely important ecological land reduces by 11.16 km2 and shows a point distribution, mostly overlapping with local scenic areas. Among them, 47.09% are urban green spaces, followed by water areas accounting for 24.02%, which are the preferred open spaces for residents living nearby. The distribution of highly important and moderately important ecological land is consistent with urban green spaces, which occupy 16.46 km2. Among the moderately important ecological land, urban green spaces and cultivated land (the two major types of land use) cover 28.72 km2 and 24.82 km2, respectively. Regarding spatial distribution, from the perspective of the entire Fengdong New City, the land with strong ecological demand is mainly distributed near the urban construction land west of the Raocheng Expressway. In the Sanqiao and Jianzhang subdistricts in the north, the overall areas of land that can satisfy the ecological demand of residents are smaller, lacking large and small green spaces for residents to relax.

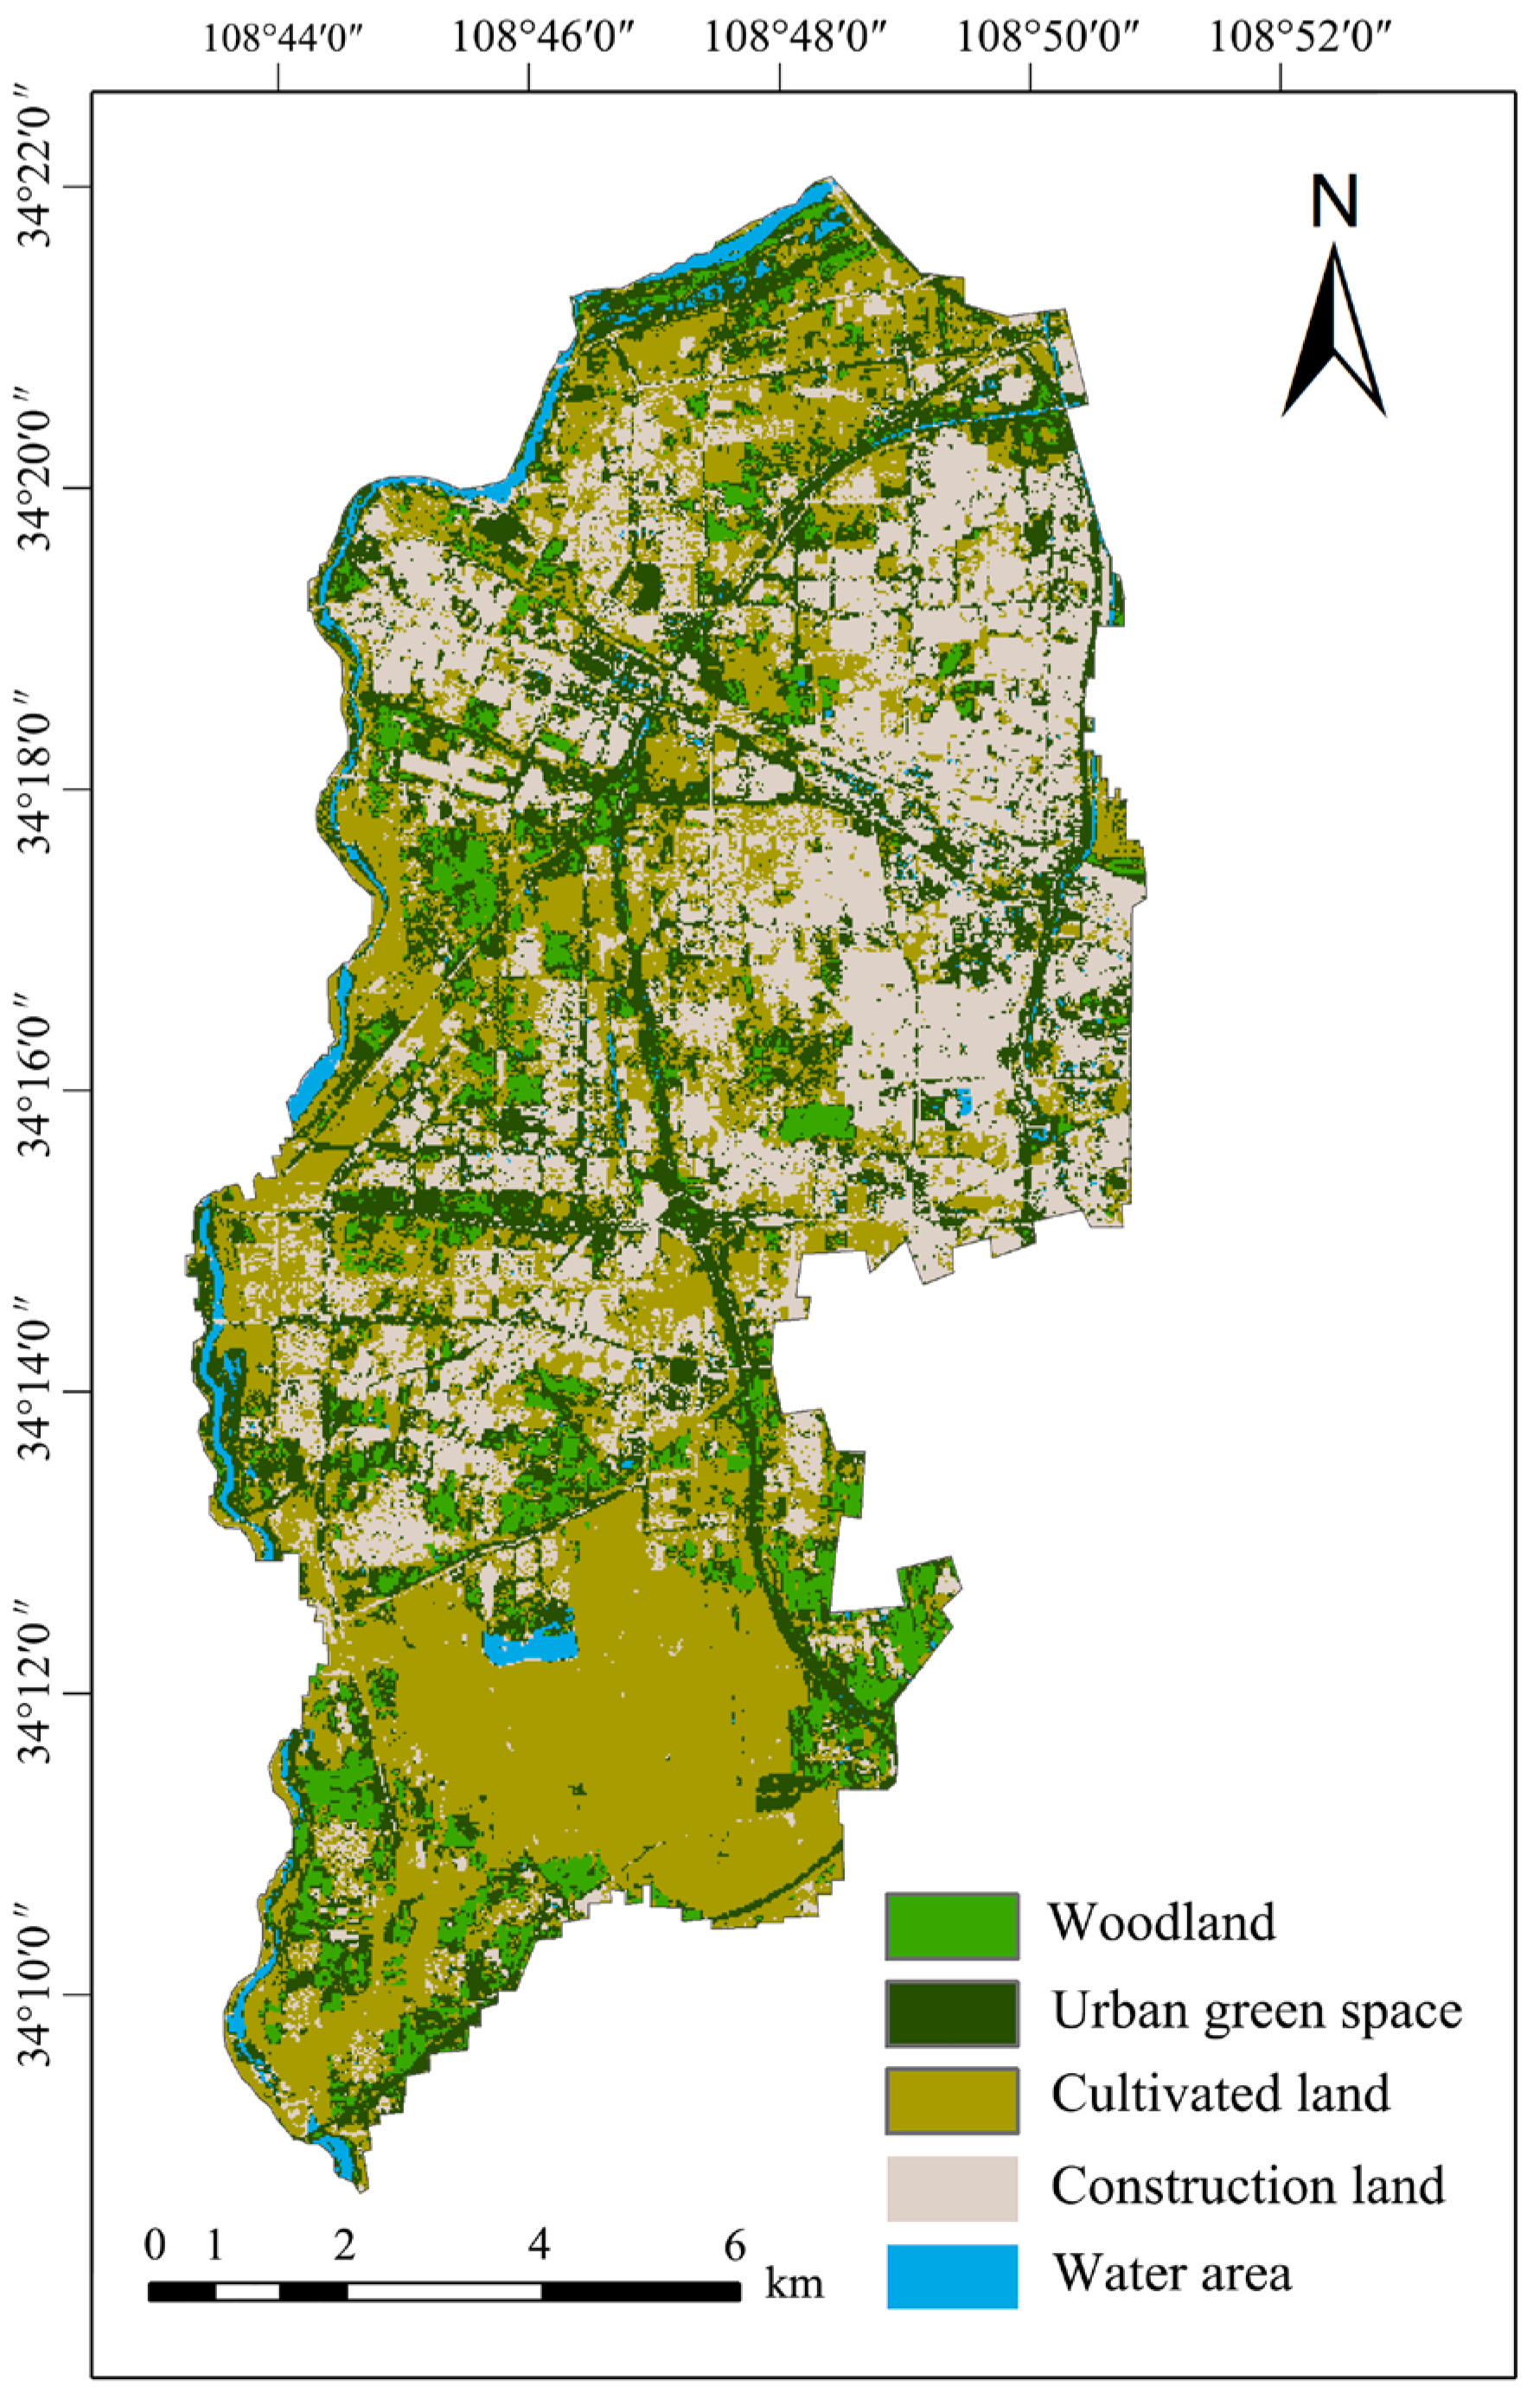
4.1.3. Evaluating the Importance of Ecological Land under Comprehensive Consideration

Considering the ecosystem functions and residents’ demands for ecological units comprehensively, while calculating the weights of all indicators via the BP neural network, the grade distribution of the ecological values of various types of land in the urban green spaces of the Fengdong area is as follows (Figure 8): The extremely important ecological land covers 22.88 km2, accounting for 13.04% of the study area. The highly important ecological land covers 35.69 km2, accounting for 20.33%. The moderately important ecological land covers 44.82 km2, accounting for 25.53%. The slightly important ecological land covers 72.15 km2, accounting for 41.10%. See also Table 3 for the integrative weights.
The extremely important ecological land covers the scenic areas and the areas surrounding the Raocheng Expressway, with 53.10% urban green spaces, 35.42% important woodland, and 9.69% partially high-quality cultivated land. The land is scattered with a high degree of fragmentation, mainly distributed along the Weihe River, Fenghe River, Taiping River, Zao River, and Fenghui Channel. Most apotheoses appear around communities or residential areas, giving residents an easy way to enjoy outdoor recreation. The Kunming Lake Relic Site, Fenghe River Ecological Scenic Area of Fengdong, Fengwei Ecological Landscape Area, Xianyang Fenghe Forest Park, and Epang Palace Park are major scenic spots in the Fengdong New City, with enjoyable green environments that satisfy various ecosystem service functions while providing ecological services for urban residents. Most of the highly and moderately important ecological land comprises urban green spaces, accounting for 84.13% in total, followed by cultivated land, accounting for 70.14%. The urban green spaces and cultivated land on both sides of the expressways have poor accessibility and have not been developed safely and effectively, resulting in poor interaction with residents.

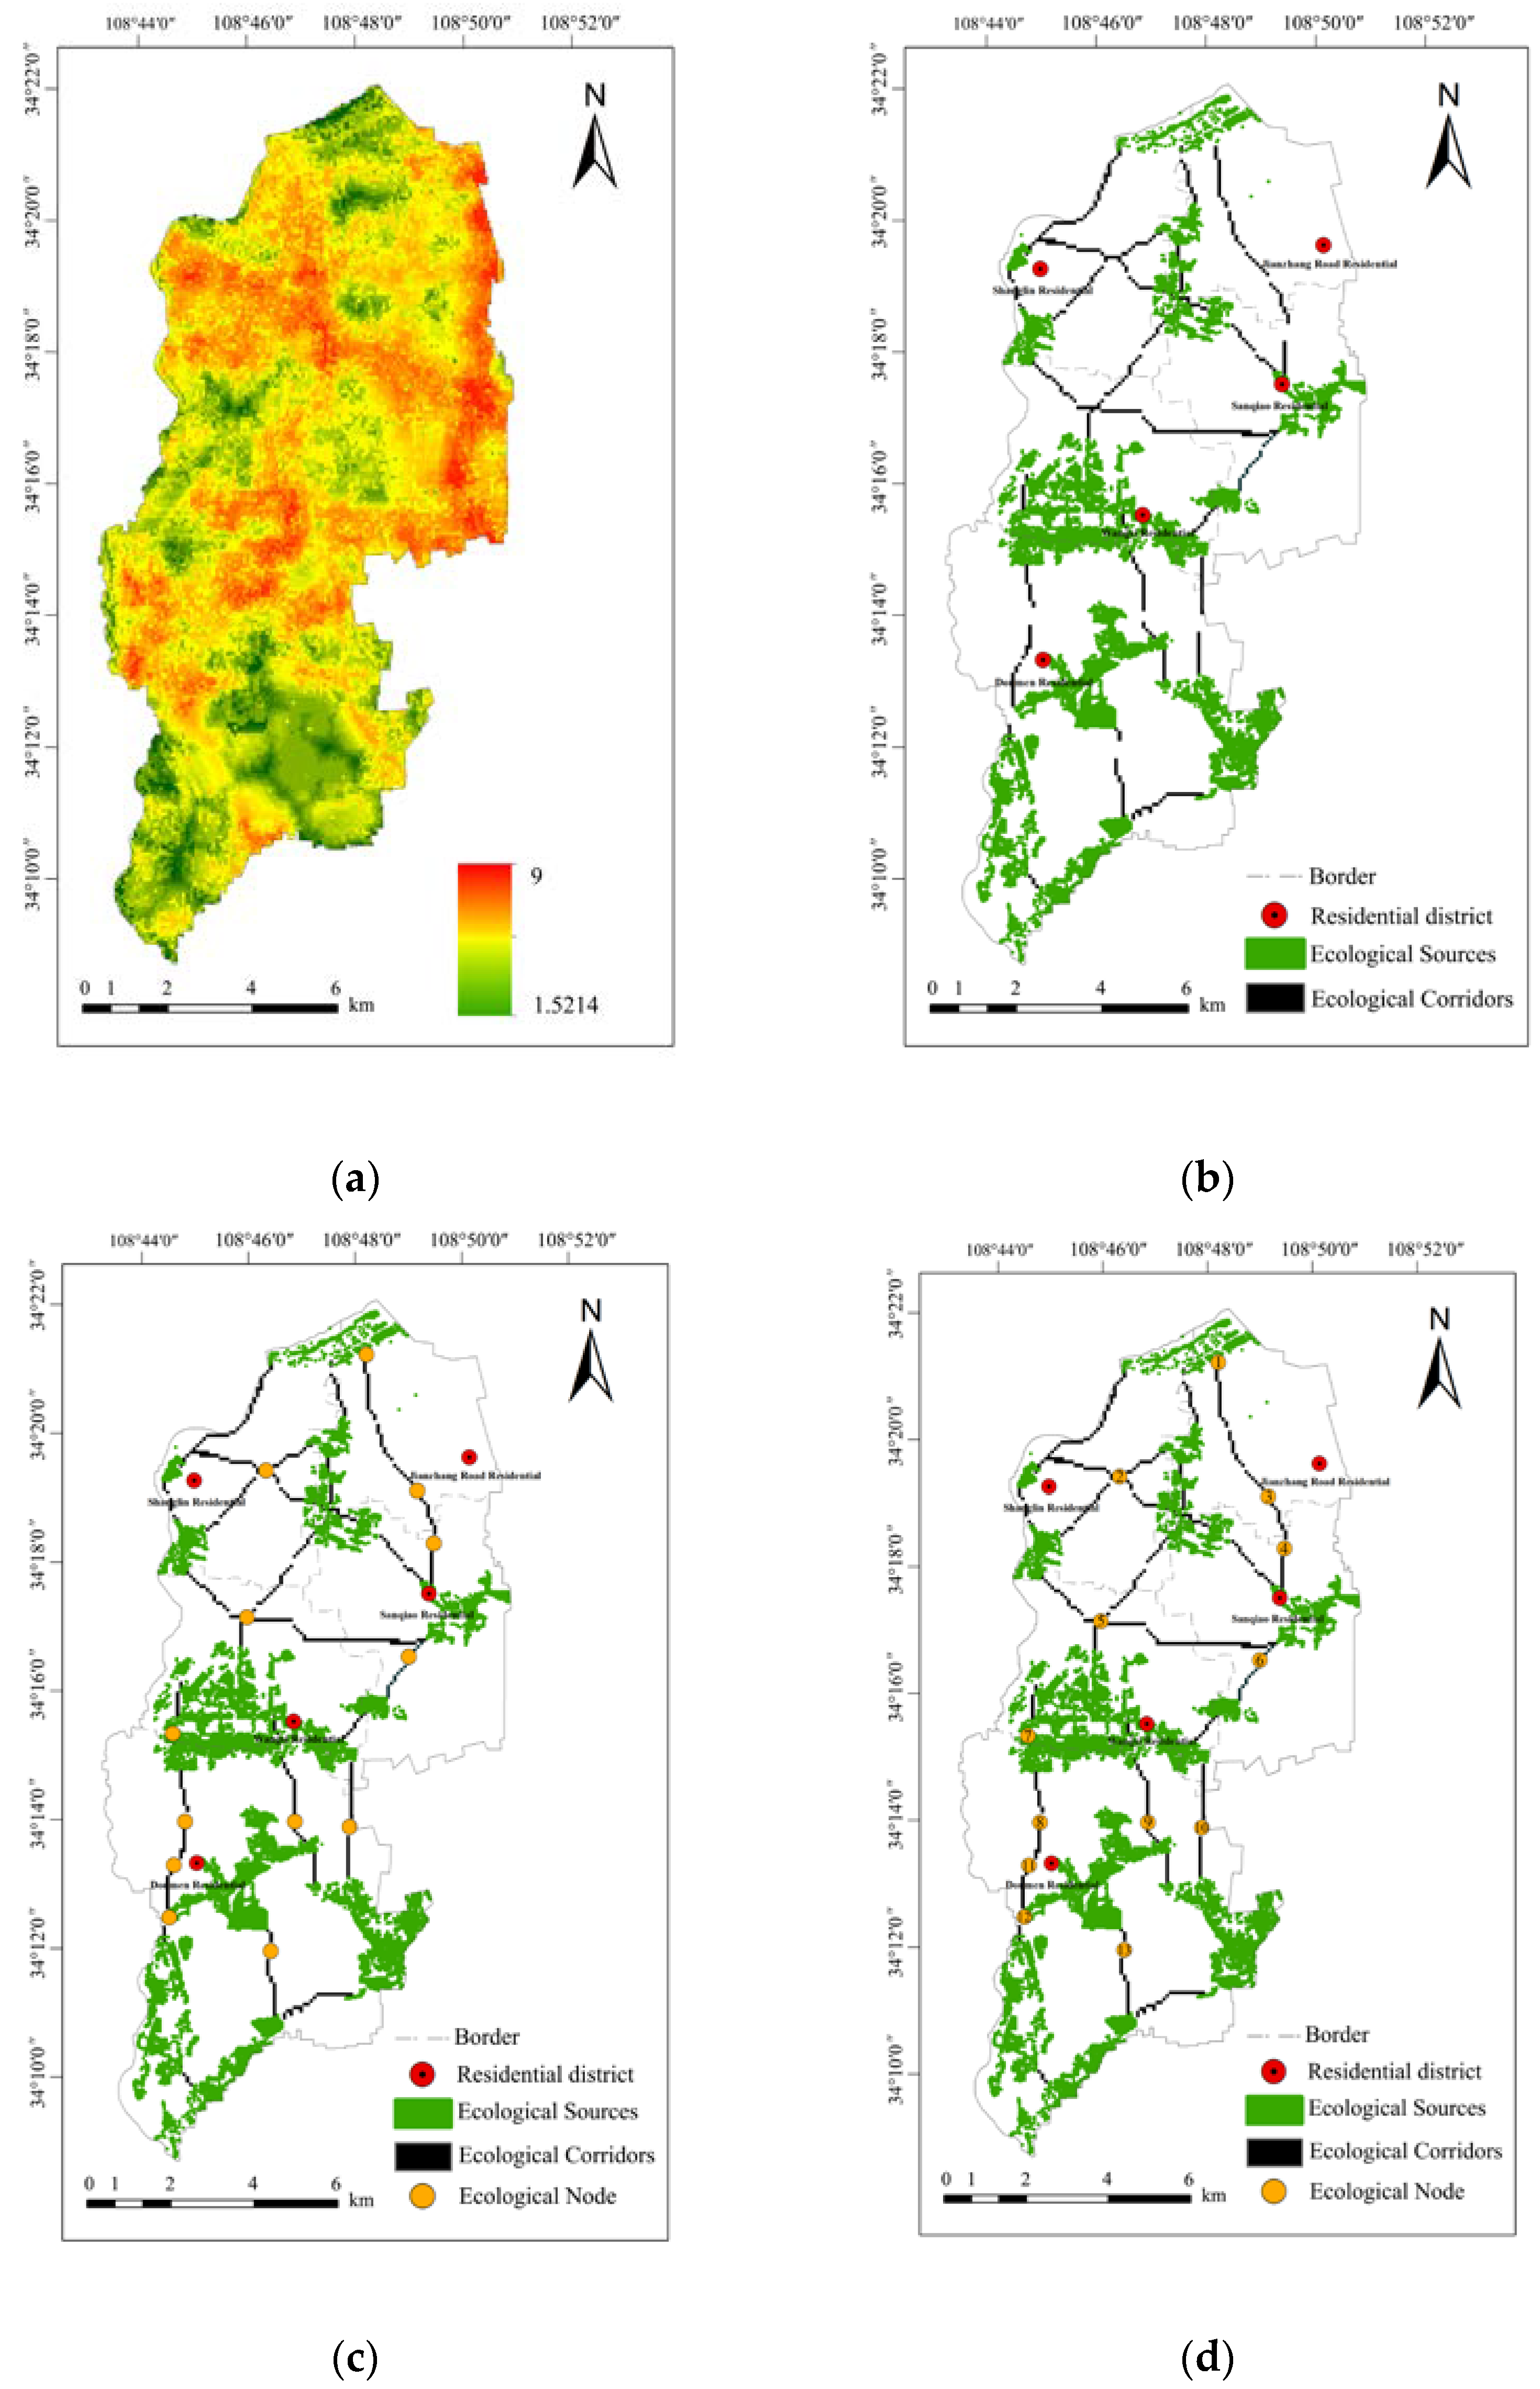
4.1.4. Identification of Ecological Sources

Ecological sources are the core components of urban green spaces and the basis for building ecological corridors in the future. A comprehensive comparison of ecosystem functions and ecological demand intensity and the evaluation of the importance of ecological land under comprehensive consideration (Figure 9) show that, with comprehensive consideration, the proportion of extremely important ecological sources increases from 12.56 km2 under the effect of ecosystem function and 1.40 km2 under the effect of ecological demand intensity to 22.88 km2. The area of slightly important land decreases from 84.27 and 79.82 to 72.15 km2. This method considers the protection and restoration of ecosystems while considering the interaction of residents and ecological land, which more accords with the people-oriented, high-quality, and sustainable development strategies of cities and the identification criteria of ecological sources (Figure 9c).
On comparing the proportions of different types of land at the extremely important level under different influences, with comprehensive consideration, the proportion of woodland was found to have increased to 35.42%. The proportion of water area is the highest at 24.02% when considering ecological demand intensity, decreasing to 1.79%. The proportion of urban green spaces is lower than that of ecosystem functions but higher than that of ecological demand intensity. The proportion of cultivated land is higher than that of ecosystem functions and lower than the proportion under the effect of ecological demand.
Regarding ecological land at the extremely important level, after considering its quantity, area, fragmentation, current development situation, and relationship with roads and residential areas, integration and eliminations are conducted to obtain the ecological source distribution map of Fengdong New City. After integration, the ecological sources are found to be mainly distributed in the Weihe River in the north, Fenghe River in the west, Fenghui Channel in the south, woodland in the southeast, the intersection of Shanglin, Wangsi, Jianzhang Road, and Sanqiao subdistricts, the intersection of Wangsi and Duomen subdistricts, the surrounding area of Kunming Pool, the area surrounding the Epang Palace site, and the urban green spaces of Sanqiao Interchange, totaling 11 green spaces.

4.2. Ecological Corridors and Nodes

4.2.1. Determination of Resistance Surfaces

The resistance values of different resistance factors are determined as per the content of Table 2. Using neighborhood analysis in the analysis tools of GIS, the data were set per the parameter. The resistance factors were inputted into a raster calculation to obtain a grading map of landscape and anthropic factors.
The weights of the resistance factors were obtained via the BP algorithm (Table 4). The resistance surfaces of the ecological sources in their expansion process were obtained per the resistance evaluation factors and their weight using the ArcGIS 10.7 weighted calculation.
Figure 10a shows that the areas with higher resistance values are mainly urban roads (e.g., West Third Ring Road, Xixing Expressway, Fengdong Nanlu, and the eastern section of the Lianyungang-Khorgas Expressway) and residential areas (e.g., the east of Sanqiao Subdistrict, the southeast of Shanglin Subdistrict, the southeast of Wangsi Subdistrict, and the west and north of Doumen Subdistrict). The areas with low resistance values include mainly Jianzhang Road Subdistrict, the west of Wangsi Subdistrict, and the central-eastern and southwestern parts of Doumen Subdistrict. The land-use types are mainly cultivated land and river wetlands.

4.2.2. Identification of Ecological Corridors

Ecological corridors are the main channels for ecological and biological activities. Beyond protecting ecological resources, they can also enhance the connection between ecological lands and ecosystem functions to better meet the demand of urban residents for ecological services and maintain the stability of regional ecosystems.
From Figure 10b, the pathways with minimum resistance from 11 ecological sources to the target land are calculated to form a network corridor layout. The ecological corridors of Fengdong New City are obtained by comparing and eliminating repeated paths between sources and paths that have gained attention and are being protected.

4.2.3. Identifying Ecological Nodes

Ecological nodes are crucial to biological activities and urban landscapes. They are generally located on ecological corridors connecting ecological sources or at the intersections of multiple ecological corridors, which are weak links in ecological corridors. Therefore, ecological nodes are of key significance for the interconnection between ecological sources. From Figure 10c, this study finds 13 ecological nodes, including two in Jianzhang Road Subdistrict, one in Shanglin Subdistrict, two in Sanqiao Subdistrict, two in Wangsi Subdistrict, and six in Doumen Subdistrict (Table 5).

4.3. Constructing Green Spaces

As seen in Figure 10d, the construction of urban green spaces stems from comprehensively considering ecological sources, ecological corridors, and ecological nodes. The extremely important ecological land is obtained using weighted calculation while considering ecosystem strength and ecological demand intensity. After elimination, 11 ecological sources were identified. Resistance surfaces were obtained, and 18 ecological corridors were identified using the minimum resistance model and considering the landscape and anthropic factors. After choosing the weak points of the ecological corridors, 13 ecological nodes were constructed.

5. Discussion

Planning urban green spaces is a key measure in exploring the coordinated coexistence of human activities and the ecological environment and achieving sustainable urban development. When identifying the ecological sources of green spaces, the importance of the ecological land should be evaluated from the perspectives of natural functions and human demand as well. According to the current characteristics and development direction of the study area, constructing green spaces promotes the sustainable development of cities.
In identifying ecological sources, rivers and surrounding wetlands are usually areas with high biodiversity service values [75]. However, given the long-term irrigation and weak protection of rivers, the Fenghui Channel, Taiping River, Zao River, and other rivers in Fengdong became narrower as the flow of the rivers decreased [76], seriously impacting biodiversity. Despite a large quantity of high-quality cultivated land in the central and western regions of Doumen Subdistrict in Fengdong New City, which should have tremendous ecosystem service function value and environmental service value [77,78,79], such lands are uncommon in the study area. Cultivated land, as a special type of ecosystem, has its own fragility, dependence, and variability. Currently, cultivated land in the Fengdong area is affected by urban construction and planning, reducing the area’s ecosystem functions. Areas with a high outdoor recreation index have satisfactory recreational facilities and take advantage of water sources or vegetation coverage. The phenomenon accords with the nature of human beings to draw close to the natural environment, such as water bodies. Areas surrounding urban constructed regions usually have a large demand for ecological land [62,80,81] and are mostly urban residential subdistricts [47,82]. From the findings, Kunming Lake, as a scenic spot for leisure, has the highest population concentration in Fengdong New City because, beyond being an important natural ecological area in Fengdong, it also carries important historical and cultural values. Currently, the Kunming Lake scenic spot integrates functions such as commerce, entertainment, and sightseeing, and the intensity of human activities is fierce. The results show that traveling is more convenient for residents, while the influence of distance factors is gradually weakened. The quality of ecological units and their derived functions are the main basis for selecting leisure destinations. Kunming Lake has significant construction areas in the population agglomeration areas, with fewer ecological areas. From the perspective of supply and demand balance, ecological land is scarce. Considering the needs of residents for ecological units, the distribution characteristics of ecological land species with extremely important ecological needs are more prominent [78], and the evaluation results of ecological land importance are more in line with the needs for ecological protection in the urbanization process [83,84,85].
Ecosystem service functions reflect the future development potential of urban green spaces, which must be properly developed and utilized under the premise of strengthening protection. Rivers and cultivated land should be the focus of future development. Among ecological sources, the value of protecting the ecosystem of water areas is the highest. It is necessary to maximize the value of water areas per local conditions based on the identification results of ecosystem service functions to maintain or improve the natural landscape of the water areas. Thus, to maintain the ecological function and environmental service values of cultivated land, the agricultural production method of intercropping can be adopted to strengthen the service functions of the farmland ecosystem, forming a sustainable agricultural development model based on biodiversity [86]. Fengdong retains the complete cultural and historical context of the Zhou, Qin, and Han dynasties, with a high landscape, commercial tourism, and historical value. The city is surrounded by five water channels, with extensive cultivated lands, cultural relics, historical sites, scenic spots, and spatial imagery. These features should become the basis of the construction of urban green spaces, and the ecological and cultural core areas of the city should be built while considering the humanistic environment, leisure activities of residents, and the style and features of the city. The cultural style of the city can be displayed by creating high-quality urban green spaces.
Areas with high ecological values should focus on the recreational needs of residents and disperse the burden on ecological sources. Hence, it is necessary to develop industries with rural characteristics such as ecological agriculture and rural tourism to partially solve the problems of ecological demand while improving the ecological quality and maintaining the functions of the farmland ecosystem. Areas with medium ecological values should focus on constructing corridors and integrating fragmented ecological sources to promote the overall ecological value of the city. Areas with low ecological values should promote urban and rural development concurrently and increase the utilization rate of land to create a good ecological environment. Ecological nodes are the most vulnerable areas of ecological corridors and must be protected to enhance connectivity and stability. For the ecological nodes within the scope of construction land in the urban area, the construction of urban green spaces can be strengthened. Beyond increasing the FVC and adjusting the microclimate of the area [87,88,89,90,91], it can also better satisfy residents’ demand for ecological land. Furthermore, for ecological nodes in natural sources such as wetlands and woodlands, the protection of vegetation and watershed must be strengthened.
Therefore, the significance of this study is as follows. It is necessary to think deeply about the relationship and adjustment mechanism between the various elements of the human–land system and guide the development of urban green space on a more harmonious, stable, and sustainable path. The study integrates the perspectives of the natural environment and human needs, focuses on the intensity of residents’ outdoor needs and the scarcity of ecological units, and quantifies the relationship between the supply and demand of humans and land. It is very important to pay attention to the people’s demand for ecological land and its disturbance to the environment. Only when the people’s needs are fully considered can urban planning be more in line with the process of urbanization and the construction of a good living environment. Moreover, the BP neural algorithm is used to determine the weight, which reduces the influence of human subjective evaluation on the weight to a certain extent and effectively improves the scientificity and objectivity of the identification result. In the process of urban development, most of them are faced with problems such as uneven distribution of green space elements and ineffective integration of cultural resources and green environment construction. The spatial pattern will directly determine the combination efficiency of resources and environmental elements in development and construction. The construction of urban green space from two perspectives of system functions can pre-set and plan the ideal space development model and actively coordinate the layout of green space land and urban construction land, which can be used as a reference for the construction of other cities.
Despite the research implications, this study has the following limitations. When evaluating the ecological value of green spaces, given the differences in the size and accuracy of the grids in the original data, there were subtle differences in the grid boundaries of the calculation results. Therefore, there are subtle differences in the values of total land areas. Further, when constructing the resistance surfaces, despite taking numerous existing studies and expert experiences into consideration, there remain some deficiencies in selecting resistance factors and assigning resistance values given the acquisition of data. Future studies can use higher-precision data and scenario analysis to create scenarios from different resistance factors and assigned resistance values and select the most appropriate.

6. Conclusions

The conflict between man and land is induced by the interference of excessive human activities on the sustainable development of the natural ecological environment, which is embodied in urban resource allocation, spatial distribution, and function distribution. Considering Fengdong New City, and from the two perspectives of ecological demand intensity and ecosystem functions, the extremely important ecological land under the influence of ecosystem (ecological) functions (demand) covers 12.56 km2 (1.40 km2). Given the weight calculation and comprehensive consideration of ecosystem functions and residents’ demand for ecological sources, the ecological sources obtained cover 22.88 km2, accounting for 13.04% of the study area. Regarding land-use type, the proportion of woodland (water areas) increases (decreases). Moreover, the proportion of urban green spaces is higher than that of ecosystem functions but lower than that of ecological demand intensity and vice versa for cultivated land. A comparison of the changes in the proportions of various land-use types in the three scenarios showed that woodland has vital biodiversity, water resource conservation, soil and water conservation, and residents’ demand value. The decrease in the proportion of water areas indicates that the ecosystem functions of rivers and lakes in the Fengdong area have not received adequate attention, nor has it been properly protected and developed. The limited interaction of such urban green spaces with residents is the main impact on the changing trend therein. Urban planning and development in the area have caused great changes in cultivated land, which is the primary reason for the trend of cultivated land changes. Today, urban spatial planning has changed from focusing on economic development unilaterally to focusing on capacity, quality and carrying capacity, excavating the key elements that constitute urban green space, and combining the two levels of ecosystem function and ecological demand intensity to guide the next green space pattern. The optimization has a certain reference value for other urban planning and management, the delineation of ecological land, and the construction of urban development zones and can be widely applied to other cities and regions.

Author Contributions

Conceptualization, H.B. and P.L.; methodology, P.L.; validation, Z.L., H.G. and H.C.; formal analysis, Z.L.; data curation, Z.L.; writing—original draft preparation, Z.L.; writing—review and editing, Z.L. All authors have read and agreed to the published version of the manuscript.

Funding

This research was funded by the National Key R&D Program of China (2018YFE0103800) and the Research Project on Major Theoretical and Practical Problems of Philosophy and Social Sciences in Shaanxi Province (2021ND0455).

Data Availability Statement

Not applicable.

Acknowledgments

We would like to thanks to the projects for their support of this research. We would also like to thank the editors and reviewers for their valuable opinions on the article.

Conflicts of Interest

The authors declare no conflict of interest. The funders had no role in the design of the study; in the collection, analyses, or interpretation of data; in the writing of the manuscript; or in the decision to publish the results.

References

  1. Li, Y. Thinking of developing urban planning theory. Urban Plan. 2005, 5, 34–38. [Google Scholar]
  2. Shahtahmassebi, A.R.; Li, C.; Fan, Y.; Wu, Y.; Gan, M.; Wang, K.; Malik, A.; Blackburn, G.A. Remote sensing of urban green spaces: A review. Urban For. Urban Green. 2021, 57, 126946. [Google Scholar] [CrossRef]
  3. Shafique, M.; Xiaowei, L.; Jian, Z. Photovoltaic-green roofs: A review of benefits, limitations, and trends. J. Sol. Energy 2020, 202, 485–497. [Google Scholar] [CrossRef]
  4. Puttinaovarat, S.; Horkaew, P.A. Geospatial platform for crowdsourcing green space area management using GIS and deep learning classification. ISPRS Int. J. Geo-Inf. 2022, 11, 208. [Google Scholar] [CrossRef]
  5. Shafique, M.; Reeho, K. Recent progress in low-impact development in South Korea: Water-management policies, challenges and opportunities. Water 2018, 10, 435. [Google Scholar] [CrossRef]
  6. Luo, P.P.; Mu, Y.; Wang, S.T.; Zhu, W.; Binaya, K.M.; Huo, A.D.; Zhou, M.M.; Lyu, J.Q.; Hu, M.C.; Duan, W.L.; et al. Exploring sustainable solutions for the water environment in Chinese and Southeast Asian cities. Ambio 2021, 51, 1199–1218. [Google Scholar] [CrossRef]
  7. Narain, V. Taken for a ride? Mainstreaming periurban transport with urban expansion policies. Land Use Policy 2017, 64, 145–152. [Google Scholar] [CrossRef]
  8. Riechers, M.; Barkmann, J.; Tscharntke, T. Diverging perceptions by social groups on cultural ecosystem services provided by urban green. Landsc. Urban Plan. 2018, 175, 161–168. [Google Scholar] [CrossRef]
  9. Wei, X.D.; Wang, N.; Luo, P.P.; Yang, J.; Zhang, J.; Lin, K. Spatiotemporal assessment of land marketization and its driving forces for sustainable urban–rural development in Shaanxi Province in China. Sustainability 2021, 13, 7755. [Google Scholar] [CrossRef]
  10. Zha, X.B.; Luo, P.P.; Zhu, W.; Wang, S.T.; Lyu, J.Q.; Zhou, M.M.; Huo, A.H.; Wang, Z.H. A bibliometric analysis of the research on Sponge City: Current situation and future development direction. Ecohydrology 2021, 14, e2328. [Google Scholar] [CrossRef]
  11. Regional Plan Association. Shaping the Region; Regional Plan Association: New York, NY, USA, 2015. [Google Scholar]
  12. Turner, T. Open space planning in London: From standards per 1000 to green strategy. Town Plan. Rev. 1992, 63, 365. [Google Scholar] [CrossRef]
  13. Tang, Y. Central Park New York City USA. Chin. Landsc. Archit. 1994, 4, 38–41. [Google Scholar]
  14. Bullock, C.H. Valuing urban green space: Hypothetical alternatives and the status quo. J. Environ. Plan. Manag. 2008, 51, 15–35. [Google Scholar] [CrossRef]
  15. Thompson, C.W. Urban open space in the 21st century. Landsc. Urban Plan. 2002, 60, 59–72. [Google Scholar] [CrossRef]
  16. Mensah, C.A. Urban green spaces in Africa: Nature and challenges. Int. J. Ecosyst. 2014, 4, 1–11. [Google Scholar]
  17. Peschardt, K.K.; Schipperijn, J.; Stigsdotter, U.K. Use of small public urban green spaces (SPUGS). Urban For. Urban Green. 2012, 11, 235–244. [Google Scholar] [CrossRef]
  18. James, P.; Tzoulas, K.; Adams, M.D.; Barber, A.; Box, J.; Breuste, J.; Elmqvist, T.; Frith, M.; Gordon, C.; Greening, K.L.; et al. Towards an integrated understanding of green space in the European built environment. Urban For. Urban Green. 2009, 8, 65–75. [Google Scholar] [CrossRef]
  19. Heidt, V.; Neef, M. Benefits of Urban Green Space for Improving Urban Climate. In Ecology, Planning, and Management of Urban Forests; Carreiro, M.M., Song, Y.C., Wu, J., Eds.; Springer: New York, NY, USA, 2008; pp. 84–96. [Google Scholar]
  20. Benedict, M.A.; McMahon, E.T. Green Infrastructure: Linking Landscapes and Communities; Island Press: Washington, DC, USA, 2012. [Google Scholar]
  21. Lwin, K.K.; Murayama, Y. Modelling of urban green space walk ability: Eco-friendly walk score calculator. Comput. Environ. Urban Syst. 2011, 35, 408–420. [Google Scholar] [CrossRef]
  22. President’s Council on Sustainable Development. Toward A Sustainable America: Advancing Prosperity, Opportunity and A Healthy Environment for the 21st Century; Diane Publishing: Collingdale, PA, USA, 1999.
  23. Evert, K.J. Dictionary Landscape and Urban Planning; Springer: Berlin, Germany, 2001. [Google Scholar]
  24. Kabisch, N.; Haase, D. Green spaces of European cities revisited for 1990–2006. Landsc. Urban Plan. 2013, 110, 113–122. [Google Scholar] [CrossRef]
  25. Xiaoxiang, S. A study on park and green space system with special reference to urban environmental protection. Acta Hortic. Sin. 1980, 4, 49–54. [Google Scholar]
  26. Zhang, W. People and green space. Environ. Prot. 1981, 2, 24–26. [Google Scholar]
  27. Li, M. From rural city to landscape gardening: The development of green space planning of human settlement environment. Archit. J. 1995, 10, 10–14. [Google Scholar]
  28. Shen, D.X.; Xiong, G.P. On urban green open space. Urban Plan. 1996, 6, 7–11. [Google Scholar]
  29. Li, F.; Wang, R. Research advance in ecosystem service of urban green space. J. Appl. Ecol. 2004, 15, 527–531. [Google Scholar]
  30. Lin, Y.E.; Zhong, X.I.; Wentao, Y.A. Reflections on urban green space planning in mountain city. J. Hum. Settl. West China 2014, 29, 37–44. [Google Scholar]
  31. Huang, T.-T.; Gao, M.-Y.; Han, R.-D.; Zhu, J.-N. Urban green space system planning under the background of land and space. J. Chin. Urban For. 2020, 18, 54–59. [Google Scholar]
  32. Toledo-Pereyra, L.H. Raul Romero-Torres: Surgeon, teacher, and pioneer (1928–2005). J. Investig. Surg. 2006, 19, 331. [Google Scholar] [CrossRef]
  33. Apan, A.A.; Raine, S.R.; Paterson, M.S. Mapping and analysis of changes in the riparian landscape structure of the Lockyer Valley catchment, Queensland, Australia. Landsc. Urban Plan. 2002, 59, 43–57. [Google Scholar] [CrossRef]
  34. Tomlinson, R. Thinking about GIS; Esri Press: California, CA, USA, 2007; p. 6. [Google Scholar]
  35. Wolf, W.J. Maryland’s green infrastructure—Using landscape assessment tools to identify a regional conservation strategy. Environ. Monit. Assess. 2000, 63, 265–277. [Google Scholar]
  36. Barton, C.M.; Bernabeu, J.; Aura, J.E.; Garcia, O.; La Roca, N. Dynamic landscapes, artifact taphonomy, and land use modeling in the Western Mediterranean. Geoarchaeol. Int. J. 2010, 17, 155–190. [Google Scholar] [CrossRef]
  37. Bunn, A.G.; Urban, D.L.; Keitt, T.H. Landscape connectivity: A conservation application of graph theory. J. Environ. Manag. 2000, 59, 265–278. [Google Scholar] [CrossRef] [Green Version]
  38. Wang, X.X.; Peng, L.; Su, C.J.; Xu, D.D.; Chen, T.T. Development and utilization of low-slope hilly land resources based on a landscape security pattern theory: A case study in Luxian County, Sichuan Province. Acta Ecol. Sin. 2016, 36, 3646–3654. [Google Scholar]
  39. Wang, M.Y.; Li, J.L.; Zheng, Z.N.; Jiang, W.D.; Xu, L.H.; Yang, L.; Yuan, Q.X.; Lu, X.Z.; Xiao, W. Landscape pattern optimization based on intensity of ecological function of mud flat reclamation: A case study of Dongtai County of Jiangsu Province. Chin. J. Ecol. 2015, 34, 1943–1949. [Google Scholar]
  40. Li, H.; Yi, N.; Yao, W.J.; Wang, S.Q.; Li, Z.Y.; Yang, S.H. Shangri-La county ecological land use planning based on landscape security pattern. Acta Ecol. Sin. 2011, 31, 5928–5936. [Google Scholar]
  41. Li, J.F.; Li, L.; Guo, L.; Du, S.H. Assessment on the ecological suitability in Zhuhai City, Guangdong, China, based on minimum cumulative resistance model. Chin. J. Appl. Ecol. 2016, 27, 225–232. [Google Scholar]
  42. Yang, T.R.; Kuang, W.H.; Liu, W.D.; Liu, A.L.; Pan, T. Optimizing the layout of eco-spatial structure in Guanzhong urban agglomeration based on the ecological security pattern. Geogr. Res. 2017, 36, 441–452. [Google Scholar]
  43. Liu, X.F.; Shu, J.M.; Zhang, L.B. Research on applying minimal cumulative resistance model in urban land ecological suitability assessment: As an example of Xiamen City. Acta Ecol. Sin. 2010, 30, 421–428. [Google Scholar]
  44. Shao, M.; Li, F.Z.; Li, X. Evaluation of supply and demand of green space ecosystem service function in Chengdu-Chongqing Urban agglomeration based on multi-source data. Landsc. Archit. 2021, 28, 60–66. [Google Scholar]
  45. Mu, D.; Luo, P.P.; Lyu, J.; Zhou, M.; Huo, A.; Duan, W.; Nover, D.; He, B.; Zhao, X. Impact of temporal rainfall patterns on flash floods in Hue City, Vietnam. J. Flood Risk Manag. 2020, 14, e12668. [Google Scholar] [CrossRef]
  46. Peng, J.; Li, H.L.; Liu, Y.X.; Hu, Y.N.; Yang, Y. Identification and optimization of ecological security pattern in Xiong’an New Area. Acta Geogr. Sin. 2018, 73, 701–710. [Google Scholar]
  47. Wang, Y.Y.; Jin, X.B.; Shen, C.Z.; Bao, G.Y.; Liu, J.; Zhou, Y.K. Establishment of an ecological security pattern in the eastern developed regions: A case study of the Sunan District. Acta Ecol. Sin. 2019, 39, 2298–2310. [Google Scholar]
  48. Zhu, J.; Su, J.; Yin, H.W.; Kong, F.H. Construction of Xuzhou ecological network based on comprehensive sources identification and multi-scale nesting. J. Nat. Resour. 2020, 35, 1986–2001. [Google Scholar]
  49. Wu, M.Q.; Hu, M.M.; Wang, T.; Fan, C.; Xia, B.C. Recognition of urban ecological source area based on ecological security pattern and multi-scale landscape connectivity. Acta Ecol. Sin. 2019, 39, 4720–4731. [Google Scholar]
  50. Zhang, Y.N.; Chen, Z.-J.; Zhang, Y.-Q.; Mei, M. Urban ecological importance assessment based on ecological function and ecological demand: A case study of Changsha resources and environment in the Yangtze Basin. Resour. Environ. 2018, 27, 2358–2367. [Google Scholar]
  51. Liu, S.H. On the demand of ecological economy. Econ. Res. J. 1988, 4, 77–79. [Google Scholar]
  52. Rumelhart, D.E.; Hinton, G.E.; Williams, R.J. Learning representations by back-propagating errors. Nature 1986, 323, 533–536. [Google Scholar] [CrossRef]
  53. Li, M.Y.; Tian, F.H.; Dong, Y.Z. Space identification of ecological importance and protection on urban ecological land in Yanji-Longjing-Tumen Area. Sci. Geol. Sin. 2016, 36, 1870–1876. [Google Scholar]
  54. Deng, X.; Li, J.; Zeng, H.; Chen, J.; Zhao, J. Research on computation methods of AHP wight vector and its applications. Math. Pract. 2012, 42, 93–100. [Google Scholar]
  55. Xu, K.; Kong, C.; Li, J.; Zhang, L. GEO-Environmental Suitability Evaluation of Land for Urban Construction Based on a Back-Propagation Neural Network and GIS: A Case Study of Hangzhou. J. Phys. Geogr. 2012, 33, 457–472. [Google Scholar] [CrossRef]
  56. Sun, H.; Zhao, J.; Pan, B.; Xiao, L. Assessment of suitability of construction land based on GIS and BPNN. Sci. Technol. Manage. Land Resour. 2008, 6, 112–116. [Google Scholar]
  57. Thenkabail, P.S. Remote Sensing Handbook; CRC Press: Boca Raton, FL, USA, 2015. [Google Scholar]
  58. Xie, G.D.; Lu, C.Z.; Xiao, Y.; Zheng, D. The economic evaluation of grassland ecosystem services in Qingha-iTibet Plateau. J. Mt. Sci. 2003, 21, 50–55. [Google Scholar]
  59. Qin, Y.L.; Shi, P.; He, W.H.; Huo, C.P.; Li, P.; Li, Z.B.; Yang, S.T.; Feng, Z.H. Influence of urbanization on landscape pattern and ecosystem service value in Xi’an City. Acta Ecol. Sin. 2020, 40, 8239–8250. [Google Scholar]
  60. Meng, X.; Cao, G.; Wenhui, A.N.; Zhixia, Y.U. Study on ecosystem services of Xixian new area based on land use planning. Ecol. Sci. 2017, 36, 142–148. [Google Scholar]
  61. Wang, J.J.; Gong, B. Evolution of landscape pattern and ecological risk in Xixian new area. J. Northeast For. Univ. 2019, 34, 250–256. [Google Scholar]
  62. Meng, J.-J.; Wang, Y.; Wang, X.D.; Zhou, Z.; Sun, N. Construction of landscape ecological security pattern in GUIYANG based on MCR model. Resour. Environ. Yangtze Basin 2016, 25, 1052–1061. [Google Scholar]
  63. Lü, Y.H.; Hu, J.; Sun, F.X.; Zhang, L.W. Water retention and hydrological regulation: Harmony but not the same in terrestrial hydrological ecosystem services. Acta Ecol. Sin. 2015, 35, 5191–5196. [Google Scholar]
  64. Zhu, Y.; Luo, P.; Su, F.; Zhang, S.; Sun, B. Spatiotemporal analysis of hydrological variations and their impacts on vegetation in semiarid areas from multiple satellite data. Remote Sens. 2020, 12, 4177. [Google Scholar] [CrossRef]
  65. Liu, G.F.; Wu, B.; Fan, W.Y.; Li, X.S.; Fan, N.N. Extraction of vegetation coverage in desertification regions based on the dimidiate pixel model—a case study in Maowusu Sandland. Res. Soil Water Conserv. 2007, 14, 268–271. [Google Scholar]
  66. Liu, B.Y.; Guo, S.Y.; Li, Z.G.; Xie, Y.; Zhang, L.L.; Liu, X.C. Sampling survey of hydraulic erosion in China. J. Chin. Soil Water Conserv. 2013, 10, 26–34. [Google Scholar]
  67. He, C.Y.; Shi, P.J.; Li, J.G.; Chen, J.; Pan, Y.; Li, J.; Zhuo, L.; Ichinose, T. Restoring urbanization process in China in the 1990s by using non-radiance-calibrated DMSP/OLS nighttime light imagery and statistical data. Chin. Sci. Bull. 2006, 51, 1614–1620. [Google Scholar] [CrossRef]
  68. Wang, Y.; Zhang, S.M.; Zhang, Y.; Zheng, L.L.; Zhao, X.Y.; Tao, Y.L.; Tian, G.H. Spatiotemporal responses of the fragmentation of green space to the human activity intensity in Zhengzhou City. J. Northeast For. Univ. 2021, 36, 231–239. [Google Scholar]
  69. Lu, D.; Tian, H.; Zhou, G.; Ge, H. Regional mapping of human settlements in Southeastern China with multisensor remotely sensed data. Remote Sens. Environ. 2008, 112, 3668–3679. [Google Scholar] [CrossRef]
  70. Huang, M.Y.; Yue, W.Z.; Feng, S.R.; Cai, J.J. Analysis of spatial heterogeneity of ecological security based on MCR model and ecological pattern optimization in the Yuexi county of the Dabie Mountain Area. J. Nat. Resour. 2019, 34, 771–784. [Google Scholar] [CrossRef]
  71. Knaapen, J.P.; Scheffer, M.; Harms, B. Estimating habitat isolation in landscape planning. Landsc. Urban Plan. 1992, 23, 1–16. [Google Scholar] [CrossRef]
  72. Gao, J. Principle and Simulation Example of Artificial Neural Network; China Machine Press: Beijing, China, 2003; p. 7. [Google Scholar]
  73. Xia, K.; Li, C.-B.; Shen, J.-Y. An optimization algorithm on the number of hidden layer nodes in feed-forward neural network. Comput. Sci. 2005, 32, 143–145. [Google Scholar]
  74. Sun, H.J.; Wang, X.H. Determination of the weight of evaluation indexes with artificial neural network method. J. Shandong Univ. Sci. Technol. Nat. Sci. 2001, 20, 84–86. [Google Scholar]
  75. Wang, L.H.; Zhang, D.Q.; Li, K.J. A survey of river ecosystem services value evaluation. Chin. J. Popul. Resour. Environ. 2015, 25, 10–14. [Google Scholar]
  76. Huang, W.; Weili, D.; Yaning, C. Rapidly declining surface and terrestrial water resources in Central Asia driven by socio-economic and climatic changes. Sci. Total Environ. 2021, 784, 147193. [Google Scholar] [CrossRef]
  77. Yi, F.; Mao, F.; Fu, B.J.; Liu, G. Farmland ecosystem service and its formation mechanism. Chin. J. Appl. Ecol. 2006, 17, 929–934. [Google Scholar]
  78. Kabisch, N.; Haase, D. Green justice or just green? Provision of urban green spaces in Berlin, Germany. Landsc. Urban Plan. 2014, 122, 129–139. [Google Scholar] [CrossRef]
  79. Swift, M.J.; Izac, A.; Noordwijk, M.V. Biodiversity and ecosystem services in agricultural landscapes—Are we asking the right questions? Agric. Ecosyst. Environ. 2004, 104, 113–134. [Google Scholar] [CrossRef]
  80. Zhang, L.Q.; Peng, J.; Liu, Y.X.; Wu, J. Coupling ecosystem services supply and human ecological demand to identify landscape ecological security pattern: A case study in Beijing-Tianjin-Hebei Region, China. Urban Ecosyst. 2017, 20, 701–714. [Google Scholar] [CrossRef]
  81. Gitelson, A.A.; Kaufman, Y.J.; Stark, R.; Rundquist, D. Novel algorithms for remote estimation of vegetation fraction. Remote Sens. Environ. 2002, 80, 76–87. [Google Scholar] [CrossRef]
  82. Chen, D.-Q.; Lan, Z.; Li, W. Construction of land ecological security in Guangdong province from the perspective of ecological demand. J. Ecol. Rural Environ. 2019, 35, 826–835. [Google Scholar]
  83. Michaeli, E.; Ivanová, M.; Solár, V.; Čech, V. The ecological stability evaluation of the landscape (case study from the eastern slovakia. J. ESWTR 2014, 1, 695–702. [Google Scholar]
  84. Wolch, J.R.; Byrne, J.A.; Newell, J.P. Urban green space, public health, and environmental justice: The challenge of making cities ‘just green enough’. Landsc. Urban Plan. 2014, 125, 234–244. [Google Scholar] [CrossRef]
  85. Kabisch, N.; Strohbach, M.; Haase, D.; Kronenberg, J. Urban green space availability in European cities. Ecol. Indic. 2016, 70, 586–596. [Google Scholar] [CrossRef]
  86. Su, B.Y.; Chen, S.B.; Li, Y.G.; Yang, W.Y. Intercropping enhances the farmland ecosystem services. Acta Ecol. Sin. 2013, 33, 4505–4514. [Google Scholar]
  87. Cao, Z.; Wang, S.; Luo, P.; Xie, D.; Zhu, W. Watershed ecohydrological processes in a changing environment: Opportunities and challenges. Water 2022, 14, 1502. [Google Scholar] [CrossRef]
  88. Wang, S.; Cao, Z.; Luo, P.; Zhu, W. Spatiotemporal variations and climatological trends in precipitation indices in Shaanxi Province, China. Atmosphere 2022, 13, 744. [Google Scholar] [CrossRef]
  89. Zhu, W.; Wang, S.; Luo, P.; Zha, X.; Cao, Z.; Lyu, J.; Zhou, M.; He, B.; Nover, D. A quantitative analysis of the influence of temperature change on the extreme precipitation. Atmosphere 2022, 13, 612. [Google Scholar] [CrossRef]
  90. Wei, X.D.; Yang, J.; Luo, P.P.; Lin, L.G.; Lin, K.L.; Guan, J.M. Assessment of the variation and influencing factors of vegetation NPP and carbon sink capacity under different natural conditions. Ecol. Indic. 2022, 112, 108834. [Google Scholar] [CrossRef]
  91. Luo, P.; Liu, L.; Wang, S.; Ren, B.; He, B.; Nover, D. Influence assessment of new Inner Tube Porous Brick with absorbent concrete on urban floods control. Case Stud. Constr. Mater. 2022, 17, e01236. [Google Scholar] [CrossRef]
Figure 1. Research location map. (a) Shannxi province in China; (b) Xianyang and Xi’an in Shannxi (c) Fending.
Remotesensing 14 04213 g001aRemotesensing 14 04213 g001b
Figure 2. Analytical steps in the construction of the urban green space ecological network using RS, GIS, and BP neural networks minimum cumulative resistance model. Orange refers to the main research content and results of the article, purple is the main method used, blue is the main factor in the study, and gray is the results of each stage of the study.
Remotesensing 14 04213 g002
Figure 3. Landscape resistance factor.
Remotesensing 14 04213 g003
Figure 4. (a) Biodiversity conservation capacity; (b) fractional vegetation cover; (c) distance from the water source; (d) calculation results of Chinese Soil Loss Equation.
Remotesensing 14 04213 g004
Figure 5. Ecosystem function evaluation. (a) Evaluation results of ecosystem function importance; (b) land analysis.
Remotesensing 14 04213 g005
Figure 6. (a) Outdoor recreation index; (b) scarcity of ecological land.
Remotesensing 14 04213 g006
Figure 7. Evaluation of ecological demand intensity. (a) The evaluation result of the importance of ecological demand intensity; (b) land analysis.
Remotesensing 14 04213 g007
Figure 8. Evaluation of ecological land importance. (a) Evaluation results of ecological land importance; (b) land analysis.
Remotesensing 14 04213 g008
Figure 9. (a) Analysis of the grades of ecological land under different types of demand; (b) analysis of the types of extremely important land; (c) ecological sources.
Remotesensing 14 04213 g009aRemotesensing 14 04213 g009b
Figure 10. (a) Comprehensive resistance surface; (b) ecological corridors; (c) ecological nodes; (d) urban green spaces in Fengdong New City.
Remotesensing 14 04213 g010
Table 1. Evaluation index of the ecological value of urban land use.
Target LayerCriterion LayerIndicator LayerAssessment Method
Evaluation of the ecological value of various types of land in green spacesEcosystem functionBiodiversityBiodiversity
Water resources conservation capacityDistance from water source/m
Slope/°
Fractional vegetation cover
Soil retention capacityThe Chinese Soil Loss Equation
Ecological Demand IntensityOutdoor recreation intensityOutdoor recreation intensity index
Scarcity of ecological landHuman settlement index
Table 2. Resistance factor and value.
Type of ResistanceResistance FactorSub-Type of Resistance FactorGrading IndexResistance Grade
Landscape type factorsLand-use typeConstruction landResidential and commercial areas9
Urban Green SpacesGreen spaces attached to urban roads, auxiliary green spaces, park green spaces7
Cultivated landAgricultural land5
WoodlandClosed forest land, brushwood, thin stocked land, and tree nurseries3
Water areasRivers and lakes1
RiversDistance from rivers0–1509
150–3007
300–4505
450–6003
>6001
Factor of human interferenceConstruction landDistance from construction land0–1009
100–2007
200–3005
300–4003
>4001
RoadsDistance from expressways0–3009
300–6007
600–9005
900–12003
>12001
Distance from arterial roads0–1509
150–3007
300–4505
450–6003
>6001
Distance from secondary trunk roads0–1009
100–2007
200–3005
300–4003
>4001
Table 3. The integrative weights of factors for evaluating the ecological values of urban green space.
FactorBiodiversityWater Resources Conservation CapacitySoil Retention CapacityOutdoor Recreation IntensityScarcity of Ecological Land
DLDistanceSlopeVegetation CoverageCSLESIHSI
Weight0.09170.06460.03970.25350.12460.22610.1998
Table 4. The integrative weights of the resistance factor.
FactorLandscape Type FactorFactor of Human Interference
Land-Use TypeDistance from RiversDistance from Construction LandDistance from ExpresswaysDistance from Arterial RoadsDistance from Secondary Trunk Roads
Weight26.0714.0622.1718.1712.477.06
Table 5. Distribution of ecological nodes.
NumberSubdistrictLongitudeLatitudeFeature of the Location
1 Jianzhang Subdistrict 108.803 34.356 Weihe River South Bank Ecological Zone
2 Shanglin Subdistrict 108.773 34.325 Cultivated land
3 Jianzhang Subdistrict 108.820 34.321 Construction land
4 Sanqiao Subdistrict 108.826 34.308 Construction land
5 Wangsi Subdistrict 108.768 34.287 Urban Green Spaces
6 Sanqiao Subdistrict 108.819 34.278 Construction land
7 Wangsi Subdistrict 108.746 34.257 Urban Green Spaces
8 Doumen Subdistrict 108.750 34.234 Urban Green Spaces
9 Doumen Subdistrict 108.784 34.234 Construction land
10 Doumen Subdistrict 108.802 34.234 Urban Green Spaces
11 Doumen Subdistrict 108.747 34.222 Cultivated land
12 Doumen Subdistrict 108.746 34.209 Cultivated land
13 Doumen Subdistrict 108.778 34.201 Cultivated land
Publisher’s Note: MDPI stays neutral with regard to jurisdictional claims in published maps and institutional affiliations.

