Technical Note

Investigation of Cultural–Environmental Relationships for an Alternative Environmental Management Approach Using Planet Smallsat Constellations and Questionnaire Datasets

1
Research Institute for Humanity and Nature, Kyoto 603-8047, Japan
2
Graduate School of Science and Technology for Innovation, Yamaguchi University, Ube 755-8611, Japan
3
Center for Research and Application of Satellite Remote Sensing, Yamaguchi University, Ube 755-8611, Japan
4
Graduate School of Science and Engineering, Ehime University, Matsuyama 790-8577, Japan
5
Department of Physics, Universitas Negeri Gorontalo, Kota Gorontalo 96128, Indonesia
*
Author to whom correspondence should be addressed.
Remote Sens. 2022, 14(17), 4249; https://doi.org/10.3390/rs14174249
Submission received: 13 June 2022 / Revised: 17 August 2022 / Accepted: 20 August 2022 / Published: 28 August 2022
(This article belongs to the Special Issue Small Satellites for Disaster and Environmental Monitoring)

Abstract

:
The values (i.e., importance) that humans place on ecosystems are critical for sustainable socioecological management. Recently, the value pluralism approach with instrumental, intrinsic, and relational values using multiple disciplines that integrate qualitative and quantitative methodologies has been encouraged. However, these values have received little attention in environmental management. This study explored the values placed on cultural practices among groups experiencing different land cover transformations (LCTs) under the rapid shrinkage of the Limboto Lake, Gorontalo Province, Indonesia, using questionnaires and time-series Landsat and PlanetScope smallsat constellations (SSCs). The time series of LCTs and questionnaire data were computed, visualized, and analyzed statistically using the chi-square test for comparing the two village groups. Results show SSCs enabled a detailed analysis due to high spatiotemporal resolutions in tropical regions. This observation would help in monitoring natural disasters (floods) caused by the decreased lake’s water storing capacity, agricultural damage, locality safety, and environmental protection in shorter cycles. Furthermore, we found that relational values originating from traditional beliefs and practices were the domain values in the land steady-type villages. Hence, integrating the cultural–environmental values of localities with prior spatiotemporal analysis into environmental management policy and implementation processes would be a high-potential alternative for environmental conservation.

Graphical Abstract

1. Introduction

Environmental degradation negatively affects social, economic, and ecological systems. Moreover, the activities, behaviors, and decisions of humans are inextricably linked to the capacities of the world’s ecosystems, such as water resources and ecosystem services [1,2,3]. The impacts resulting from the combination of social and ecological systems, particularly, have been widely regarded as the most critical driving factors influencing the present rapid ecosystem changes, such as lake level increases [4,5,6,7,8,9]. Meanwhile, cultural–environmental practices and knowledge have been nurtured, encouraged, and practiced in an ecofriendly manner, directly or indirectly contributing to environmental management. However, the cultures and knowledge of indigenous communities are often overlooked in the environmental management [10,11]. Therefore, understanding the values of local cultures (hereinafter cultural–environmental relationships) should provide important insights and alternative approaches for future environmental management.
Indonesia is located at a point where the massive Asian continent meets the Asian–Australian plates. Thus, it experiences an uplift movement, causing various unusual geological phenomena [12]. Among the interesting creations of pre-Pleistocene land uplifts by plate tectonics are the inner seas, which can be observed in the Tempe, Sidenreng, Buaya, and Limboto lakes on Sulawesi Island [12,13,14]. These lakes have undergone rapid shrinkage [12,13,14], which was further accelerated by social and ecological systems, such as large-scale sedimentation and erosion, as well as the discharge of various sludges, such as chemical, fecal, activated, and solid wastes [15]. Furthermore, the overgrowth of water hyacinth, which is an invasive floating plant that forms thick layers over water surfaces, has disadvantageously accelerated the lakes’ siltation and land conversion [16]. Consequently, these factors cause land cover (LC) transformation (LCT) in lake-side communities.
More feasible and sustainable management approaches are required to minimize the drastic losses of biological ecosystems and to regenerate nature [10]. The importance of traditional beliefs and indigenous knowledge and practices has been recognized for the conservation of natural and sacred environments [10,17,18,19,20,21,22,23,24]. Furthermore, the values (i.e., importance) that humans place on ecosystems are critical for sustainable socioecological management [2]. However, the study on such values in environmental management has received little attention [2,3]. Several studies have identified the significance of plural values, such as instrumental, intrinsic, and relational values, with regard to ecological management [2,3]. Instrumental and intrinsic values represent monetary values and the values related to nature, ecosystems, or life as ends, respectively [2]. Relational values refer to the significant relationships and responsibilities among humans or between humans and nature [2]. The exploration and recognition of the importance of plural values beyond the instrumental–intrinsic dichotomy has broadened the spectrum of ecosystem valuation through the integration of relational values [2,25]. However, the operationalization of value pluralism in environmental management remains largely elusive [26]. In contrast, from a methodological perspective, integrating qualitative and quantitative approaches using multiple disciplines has been highly encouraged for ecosystem assessment and management [27]. For instance, García-Nieto et al., Plieninger et al., and Palomo et al. used participatory geographic information systems to map the social values of ecosystem services in some localities [28,29,30]. García-Nieto et al. further compared the spatial perceptions of ecological services based on stakeholder profiles [28]. However, these approaches were applied in a crosssectional period. Consequently, the spatiotemporal LCTs due to long-term environmental changes were poorly considered, quantified, or associated with values. In addition, previous studies have scarcely quantitatively associated ecosystems with existing cultural values. Hence, the qualitative assessment of the cultural–environmental relationships associated with the quantitative spatiotemporal assessment of the LCTs caused by ecological degradation, such as rapid lake shrinkage, contributes to the identification of alternative intervention points for future environmental management.
Remote sensing technologies have been widely used to characterize natural features or physical objects on land surfaces using various temporal, spectral, and spatial resolution datasets. The use of publicly available datasets, such as the Landsat and Sentinel series, enables the long-term monitoring of spatial transformations [31,32,33,34,35,36]. In particular, the Landsat series are influential for long-term observation; however, obtaining cloud-free data in tropical regions experiencing heavy rainstorms is a considerable challenge [32,34,35,36]. Furthermore, the spatial resolution of 30 m limits the ability to obtain detailed information. Meanwhile, commercial smallsats have emerged as powerful resources for Earth observation. PlanetScope (PS) (Planet Labs, Inc., San Francisco, CA, USA) operates the largest constellation of Earth-imaging smallsats, as of June 2022, it comprises ~130 satellites called Doves, with a daily collection capacity of 200 million km2 and a spatial resolution of approximately 3 m [37]. These PS smallsat constellations (SSCs) comprise three satellite generations: Dove Classic (2014/07–2022/04), Dove-R (2019/03–2022/04), and SuperDoves (2020/03–Present) [37]. Each generation comprises multiple satellite groups launched and placed into a similar orbit around the same time [38]. Thus, this combination of multiple satellites, such as time series Landsat and PS, facilitates our comprehensive and qualitative understanding of the LCTs associated with rapid lake shrinkage.
This study mainly explored the cultural–environmental relationships between the village groups experiencing different LCTs in Gorontalo Province, Indonesia. Specifically, the objectives were to: (1) assess LCTs of lake-side villages from 2002 to 2022 using time series Landsat and PS SSC datasets; (2) investigate the local perception of lake shrinkage, cultural practices, and plural values among localities; and (3) assess cultural–environmental relationships using the results obtained in step 2 from villages experiencing different LCTs (the results of step 1). This study used multiple quantitative and qualitative methods to explore alternative intervention points for future environmental management.

2. Materials and Methods

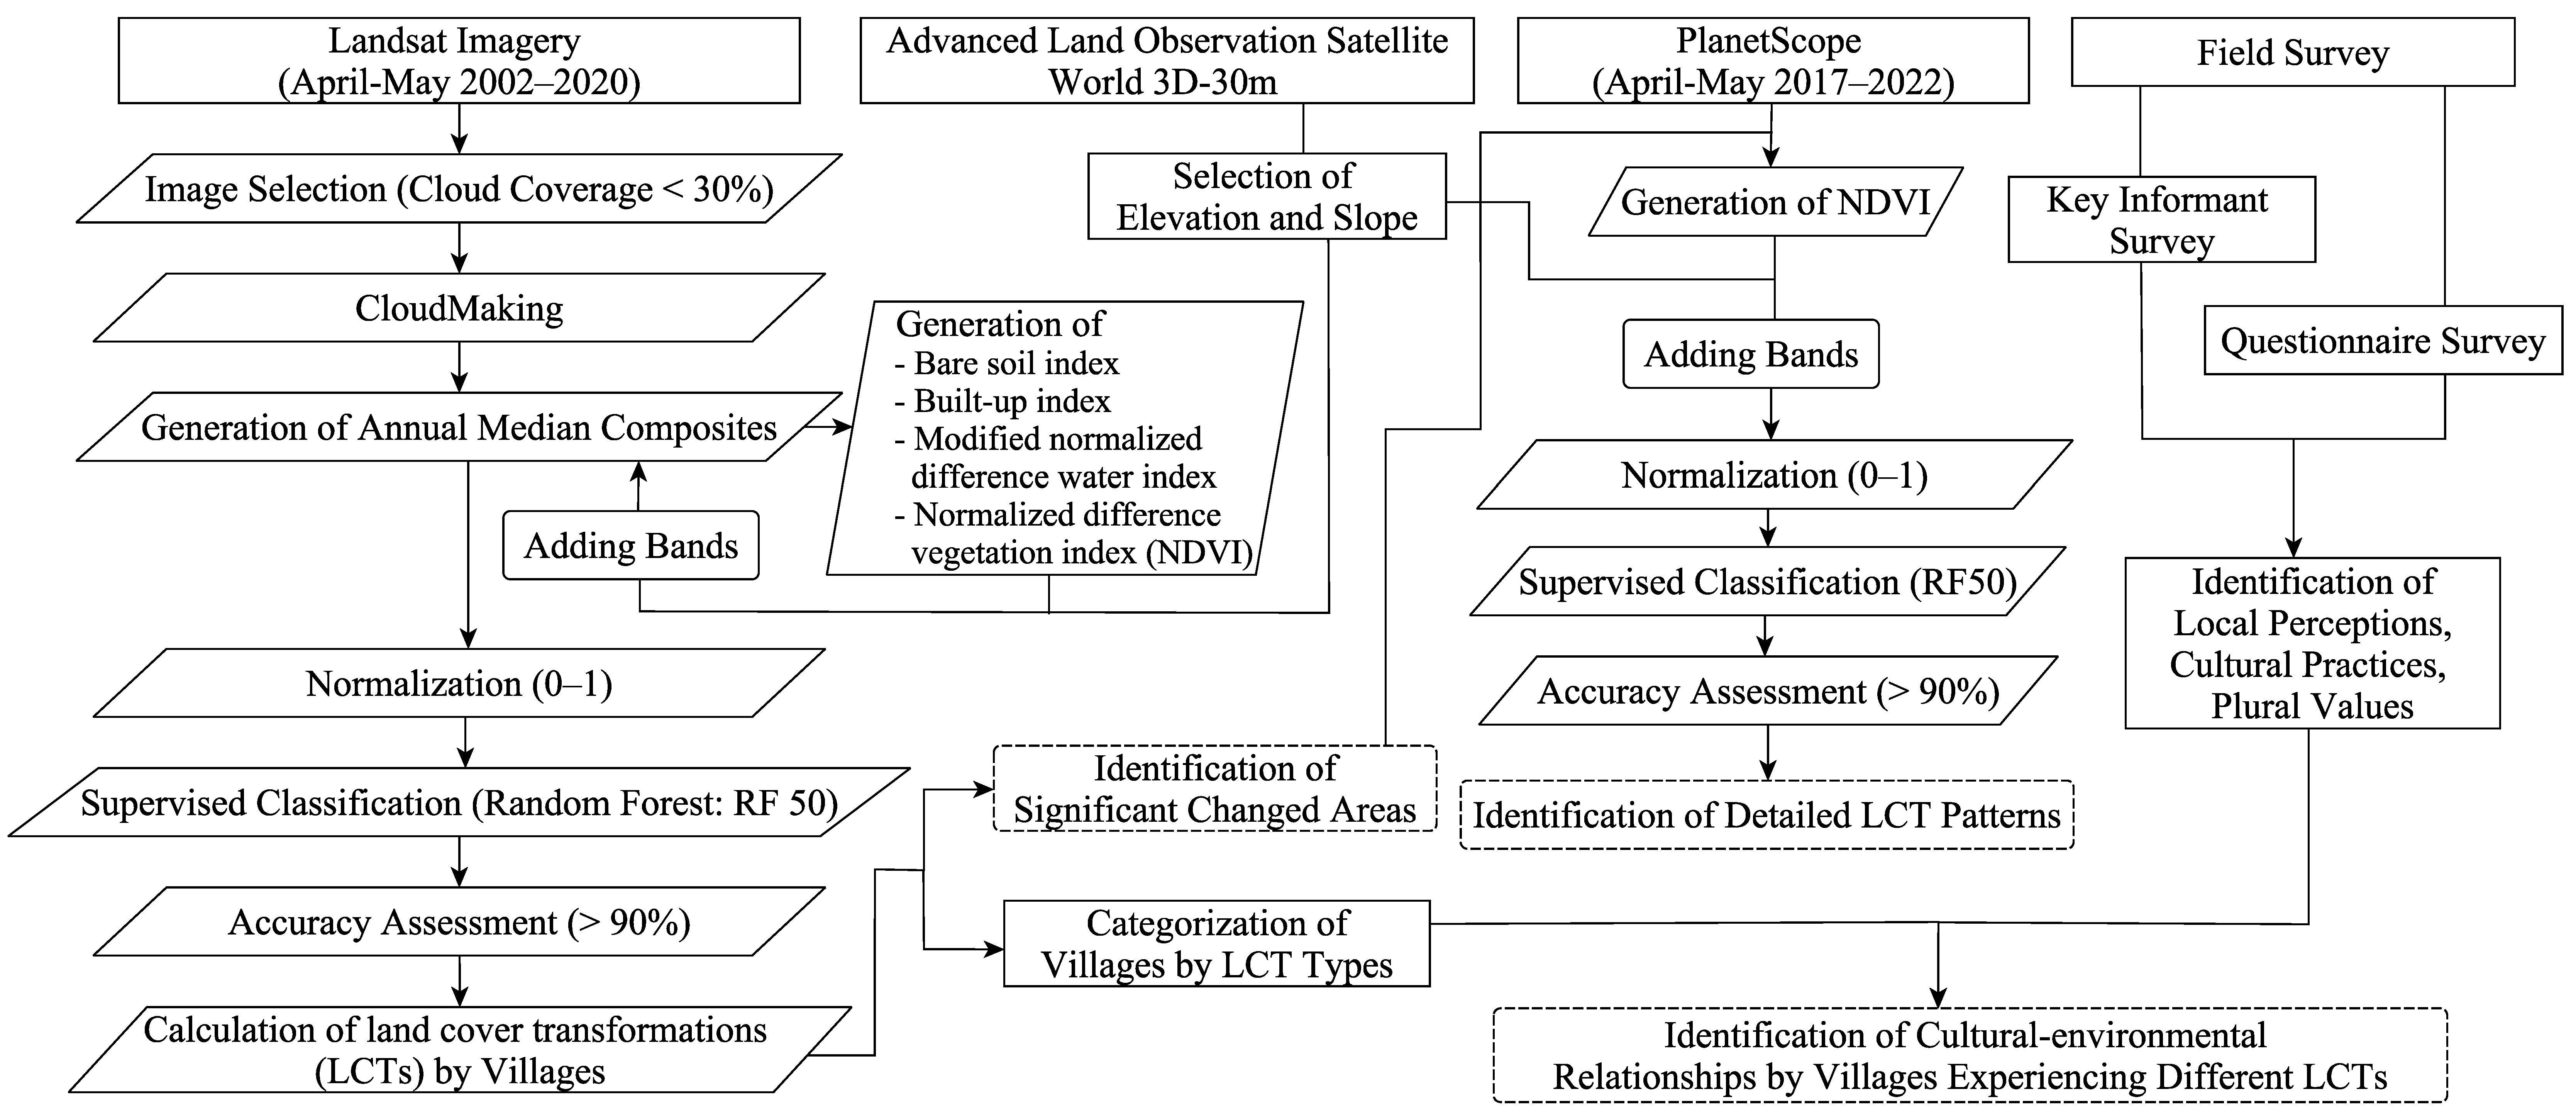
2.1. Overall Methodological Workflow
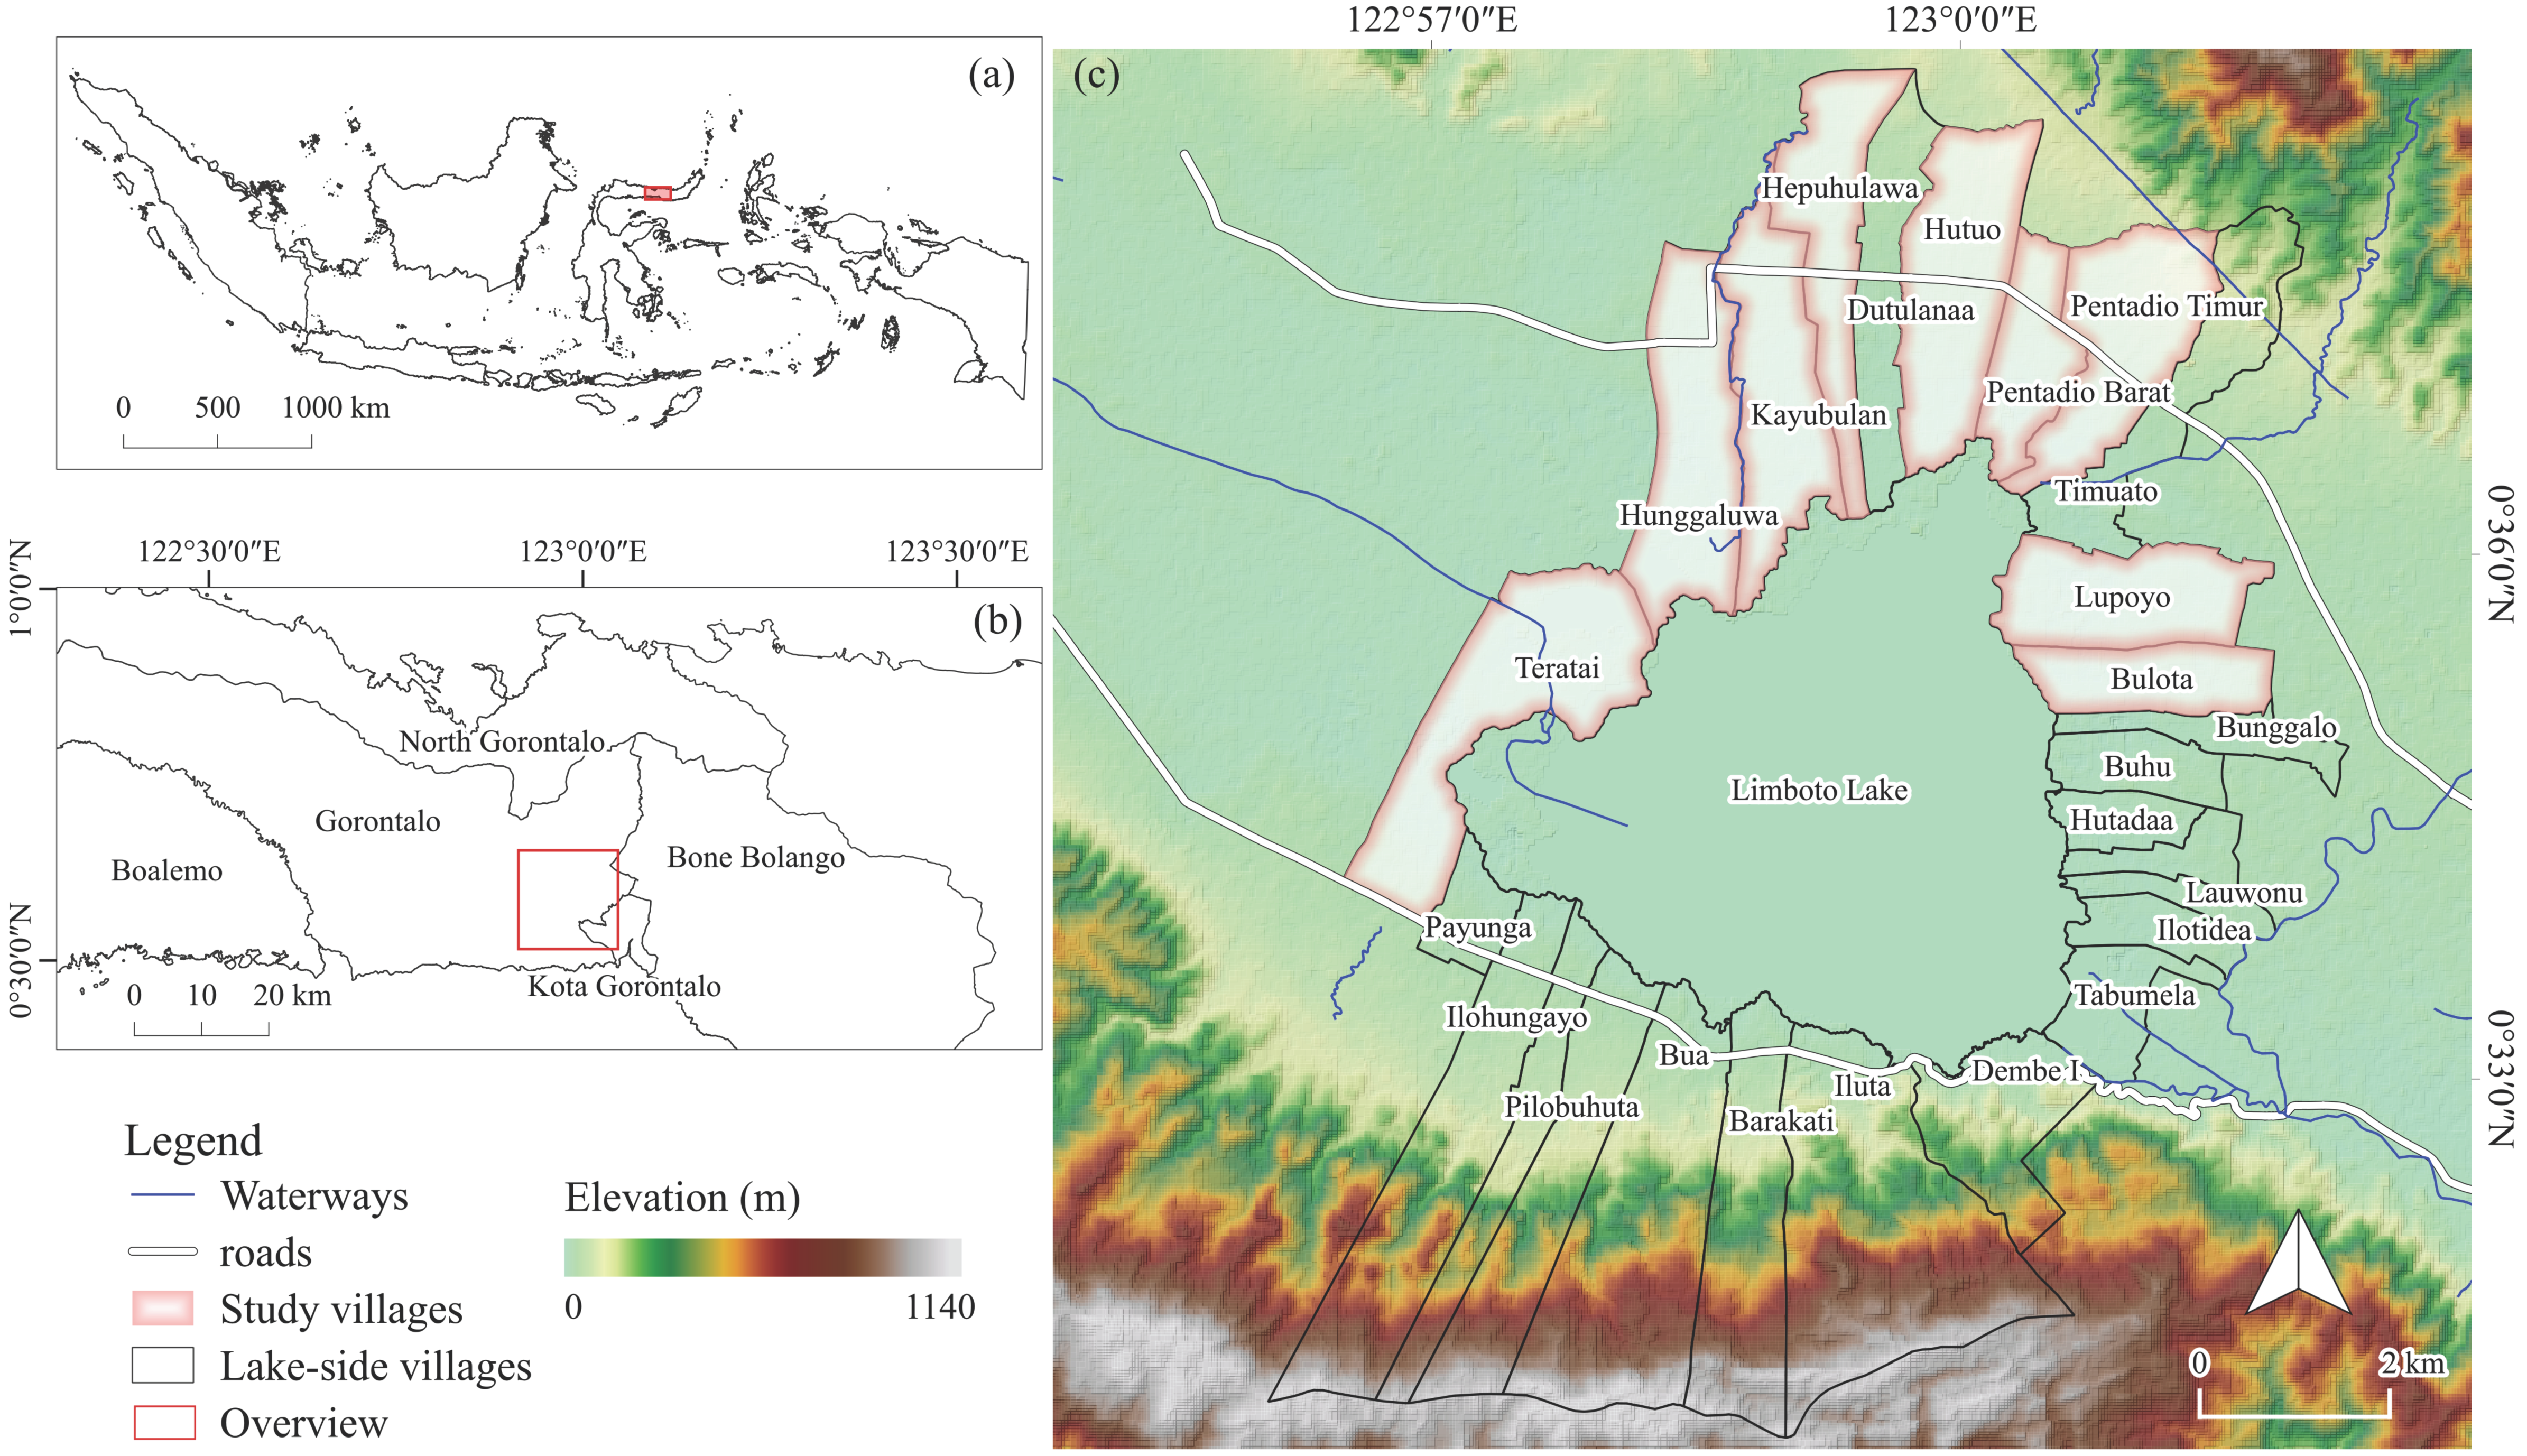
The methodological workflow used in this study is depicted in Figure 1. The workflow focused on three main steps to achieve its primary objective of exploring cultural–environmental relationships between groups experiencing different LCTs. First, the LCTs of the study villages were assessed using Landsat time series datasets (2002–2020), followed by detailed assessments of significant areas using PS time series (2017–2022). Second, local perceptions of lake shrinkage, cultural practices, and plural values were studied through a field survey. Third, cultural–environmental relationships were statistically assessed on the basis of the results obtained from steps 1 and 2. This paper presents a discussion based on the findings described above. The methods used in each step are described in the following sections.

2.2. Study Area

Limboto Lake was formed during the pre-Pleistocene uplift of the inner bay [39], and it plays remarkable ecological, hydrological, socioeconomic, and cultural roles [40,41]. Unfortunately, it is one of the 10 critically endangered lakes in Indonesia [42]. The lake surface extent was reduced from 31.5 km2 (1978) to 20.4 km2 (2019) [33]; one of the factors contributing to the lake’s shrinkage is riverbank erosion, which mainly comprises inner bay sediments accumulated during plate collision [33]. This substantial lake shrinkage has further reduced the reservoir capacity volume, thereby degrading the lake environment (e.g., biodiversity, ecosystems, and water quality), resulting in eutrophication and high vulnerability to natural disasters, as well as restructuring the socioeconomic activities of localities at various scales [33].
Some areas of Gorontalo Province are very popular in terms of religious and cultural integration under Indonesia’s transmigration program, which started in 1973 and is one of the largest government-sponsored population resettlement schemes worldwide. This program moved millions of families from densely populated islands such as Java, Madura, and Bali to less-densely populated ones, including mainly Sumatra, Kalimantan, Sulawesi, and, more recently, Papua [43]. Most Indonesian migrants under this program receive land ownership for settlement, including farmland [43]. Gorontalo Province has been targeted as one of the destinations of the people of Java and Bali since 1980 [44].
In the Limboto area, indigenous beliefs and practices of the lake have existed. According to a myth, Limboto Lake was a vast sea. When water retreated from the area, forest and shrubbery appeared along with clear water springs, and four angels from heaven were bathed. Later, citrus trees grew in the heavenly forest around the lake, filling the air with fragrance. In this way, the local name of Bulalo lo Limu o Tutu (The Lake of Citrus from Heaven) was given and changed to Limboto [45]. The existence of Limboto Lake is believed to be a miracle that provides a source of livelihood for the people of Gorontalo [46], and the lake is regarded a sacred area.
The lake is surrounded by 27 villages. The main residential areas of the lake-side are mostly located on the eastern and northern coasts. The main livelihood in the lake-side area is lowland agriculture, such as crop cultivation and freshwater fisheries. Paddy and corn cultivation in the province has rapidly increased since 2001 [47], resulting from province-level agricultural strategy development. Because of image availability, we focused on nine villages located in the lake’s upper half: the Bulota, Hepuhulawa, Hunggaluwa, Hutuo, Kayubulan, Lupoyo, Pentadio Barat, Pentadio Timur, and Teratai villages (Figure 2).

2.3. Satellite Imagery and Data Processing

Landsat surface reflectance products were chosen on the basis of season and cloud coverage to minimize potential impacts from meteorology and agricultural activities. This study mainly focused on imagery acquired between April and May with less than 30% cloud coverage. Subsequently, a cloud-masking function was applied to the acquired Landsat 7 and 8 imagery. Thereafter, indexes such as bare soil index (BSI), modified normalized difference water index (MNDW), built-up index (NDBI), and normalized difference vegetation index (NDVI) were generated using Equations (1)–(4) and added to each median composite. Furthermore, elevation and slope data acquired from Advanced Land Observation Satellite World 3D-30m were also added to the same composite to improve the classification quality. Subsequently, the data were normalized to the range of 0–1. Furthermore, PS surface reflectance products (Ortho Scene–Analytic Level 3B) from 2017 to 2022 were also used to assess detailed LCTs. NDVI, elevation, and slope were similarly added to each image and then normalized. As a result, five annual medium Landsat images of 2002, 2013, 2015, 2018, and 2020 and six PS images of 2017, 2018, 2019, 2020, 2021, and 2022 were generated with a ground resolution of 30 m and 3 m in the World Geodetic System 84 Universal Transverse Mercator coordinate system Zone 51. The main specifications of the imagery and sensors used in this study are summarized in Table 1.
BSI = ((Red + SWIR) − (NIR + Blue))/((Red + SWIR) + (NIR + Blue))
MNDWI = (Green − SWIR)/(Green + SWIR)
NDBI = (SWIR − NIR)/(SWIR + NIR)
NDVI = (NIR − Red)/(NIR + Red)

2.4. LC Classification and Accuracy Assessment

LC classes were categorized into four classes: agricultural land/barren lands, built-up, vegetation, and water in the Landsat series. Furthermore, because the PS series has a higher spatial resolution, its LCs were classified into five classes: agriculture, barren, built-up, vegetation, and water. Ground control points for supervised classification were selected at the pixel level per image to improve LC classification quality. A simple random forest (RF) classifier with 50 decision trees was used. RF classification is a machine learning classification method using decision trees, which is a hierarchical classifier comparing data with various properties [48]. Subsequently, the classification accuracy of the LC maps was assessed using the overall accuracy obtained from confusion matrices, which compare actual and predicted values. We aimed for greater than 90% accuracy per imagery. The ground control point, classifier, and accuracy assessment were implemented in Google Earth Engine, generating 11 annual LC maps. Thus, total areas were calculated separately by class for LCT comparison by village and village categorization. LCT trends were also statistically evaluated using Sen’s Slope test with significance at the 95% confidence level.

2.5. Field Survey

The field survey was conducted in March 2022 to collect demographic information, local perceptions of lake shrinkage, cultural practices, and plural values at the local level. A total of 10 key informant interviews and 163 questionnaire surveys were conducted using a local language. A stratified random sampling technique by sex and age was employed to select respondents for the questionnaire surveys with support from village authorities. The interview contents included village characteristics, occupational characteristics among villagers, and the existence of traditional lakes or non-lake-related culture. In addition, the questionnaire included personal profiles, such as age, sex, occupation, perception of lake shrinkage, existing cultural practices, and localities’ relationship to them. Concerning questions about the lake’s perception, the respondents were asked to choose one of the four options: “strongly agree”, “agree a little”, “disagree a little”, and “strongly disagree”. Furthermore, regarding the question on the relationship to cultural practices, the respondents were asked to choose one of the three options: “currently practicing”, “practiced in the past”, and “did not practice at all”. The culture mentioned in this question was based on the answer provided from the previous question regarding existing cultural practices. Furthermore, an open-end question about existing cultural details was asked. Religion-related practices were excluded from this study. Data analysis was statistically performed, and relationships were explored using the chi-square test. Furthermore, cultural practices referred to in the field survey were summarized in a table by categorizing by value domains (instrumental, intrinsic, and relational values), and articulated values such as symbolic, livelihoods, identity, and monetary benefits, for example (Table 2).

3. Results

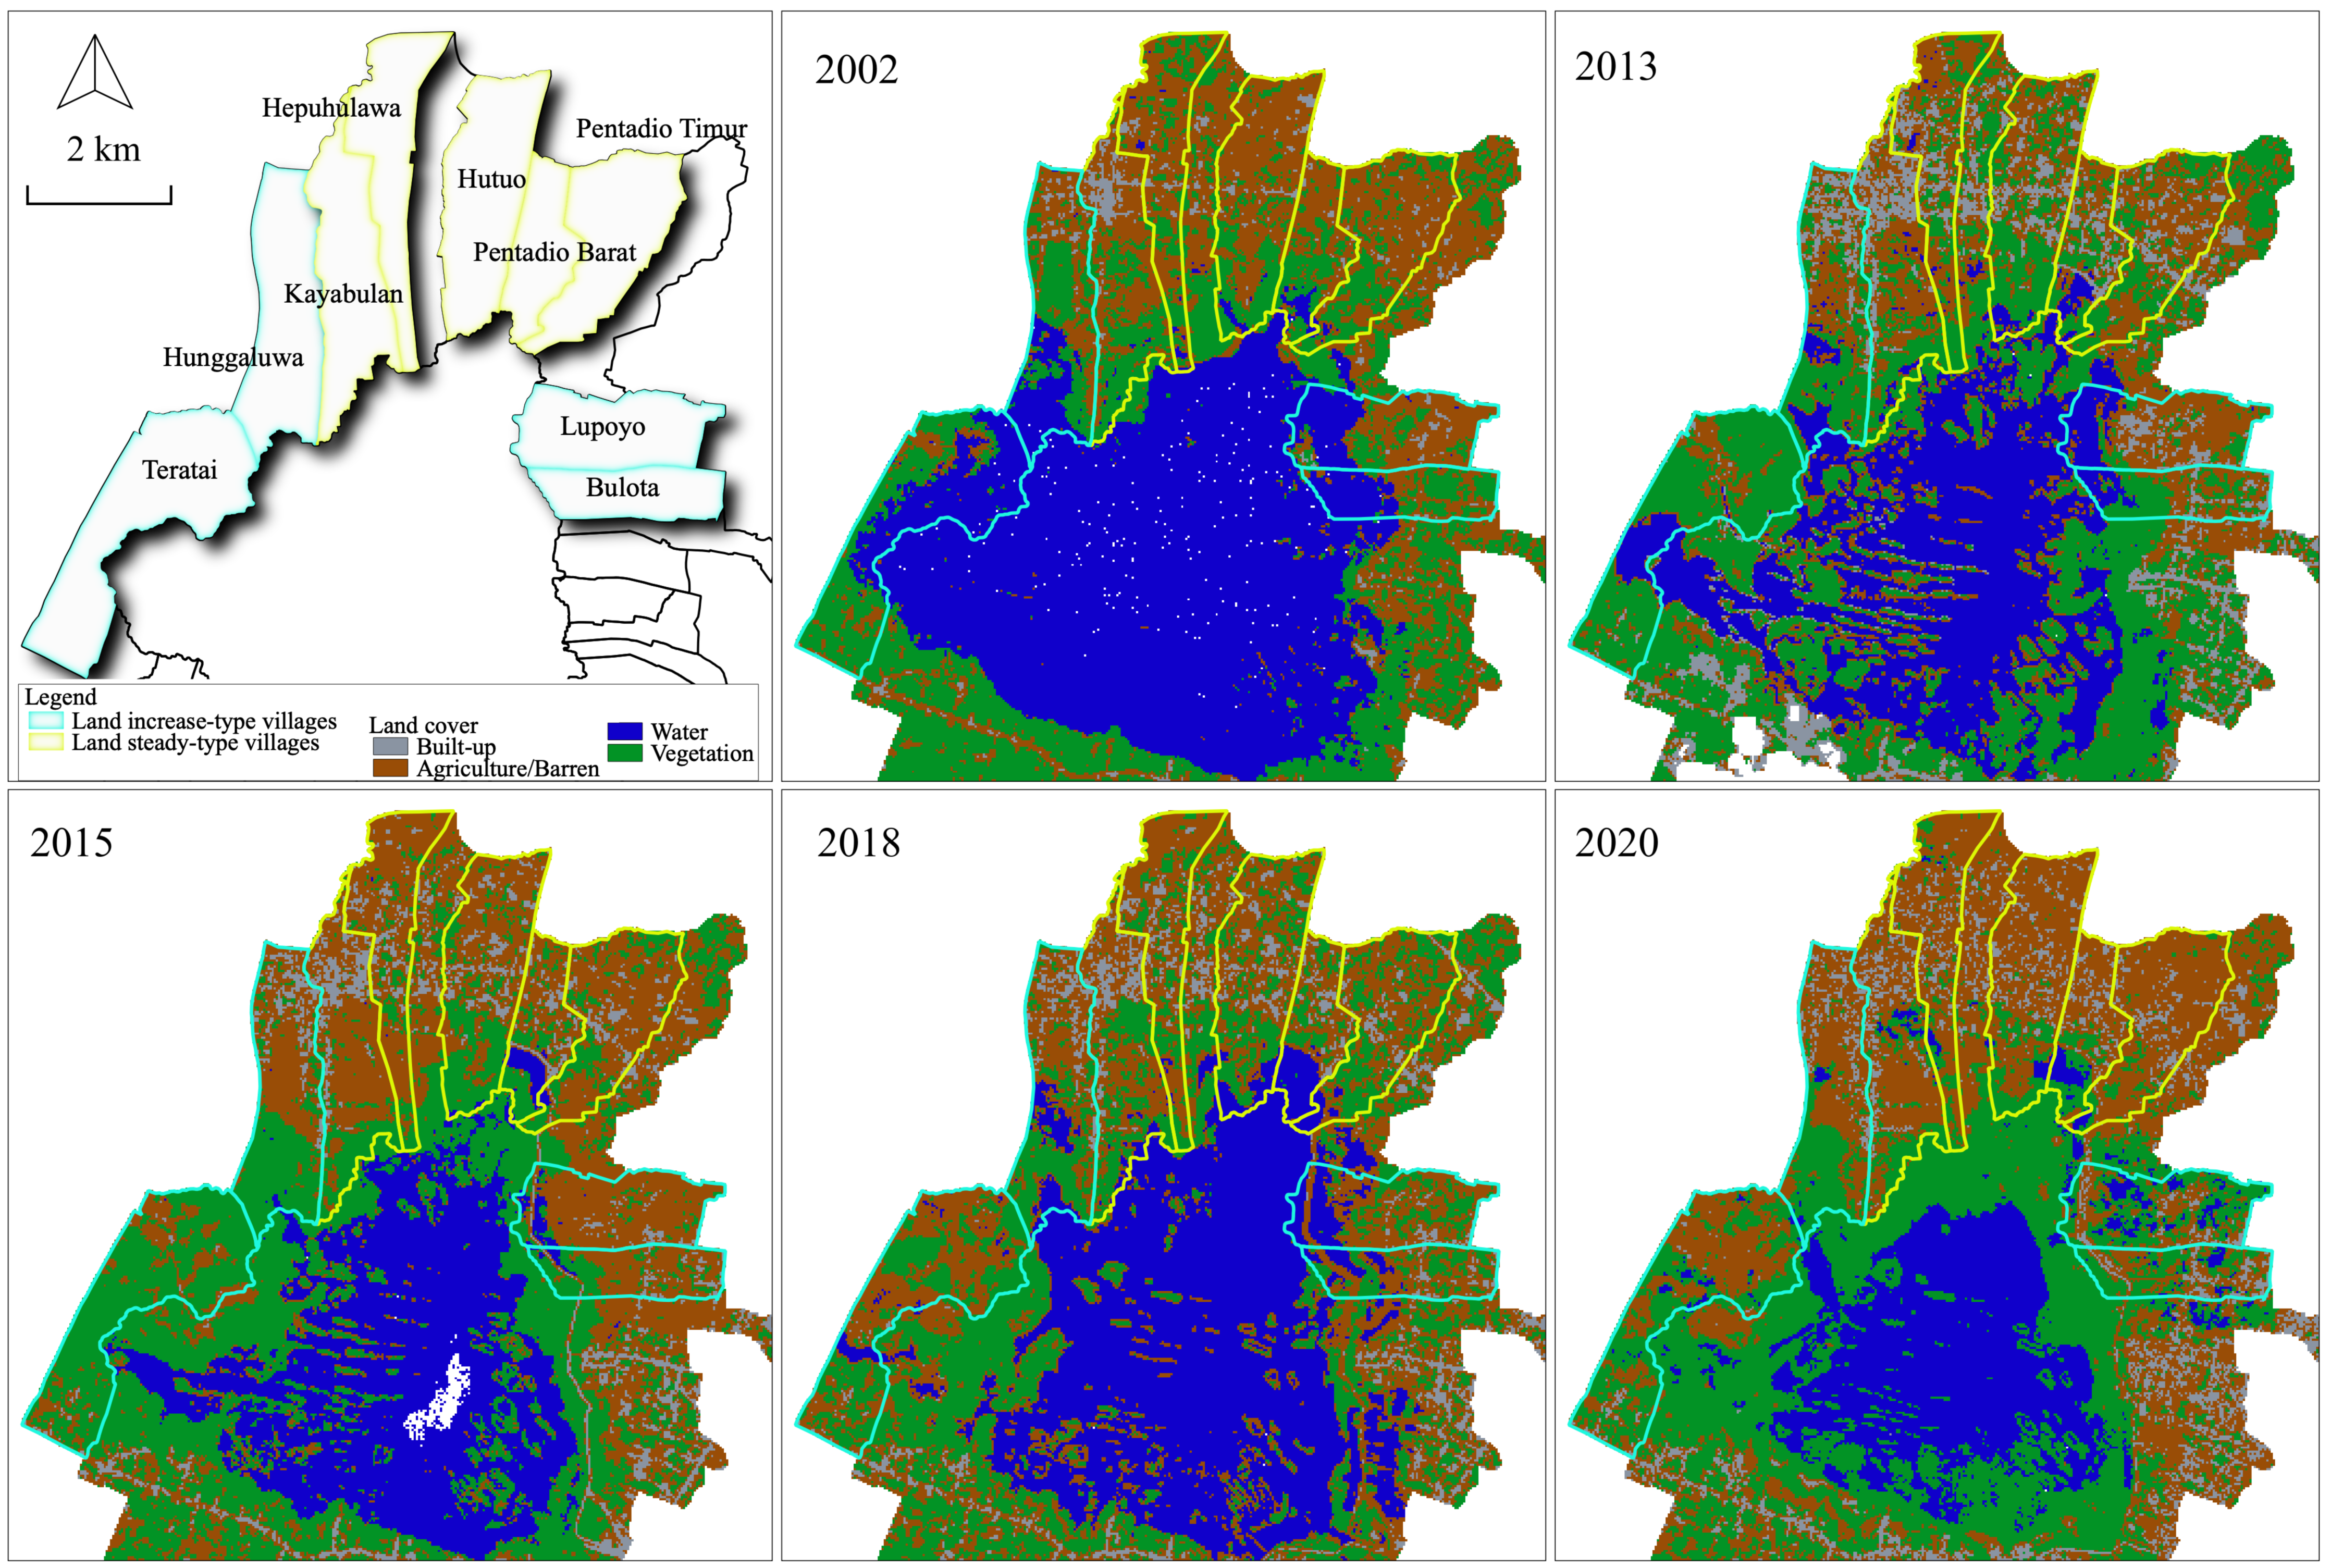
3.1. Assessment of Time Series LCTs

3.1.1. LCTs Using Landsat Series

The five LC maps were generated using the Landsat series with an overall accuracy of the confusion matrices of 91.7% (2002), 93.3% (2013), 93.8% (2015), 93.8% (2018), and 100.0% (2020). The results are shown in Figure 3. Notably, lake shrinkage was most noticeable in the lake’s western part, which receives water from major rivers [33]. Since 2013, vegetation, such as water hyacinths, has also been observed in the lake, spreading along the lake’s edge and transforming into agricultural lands, by forming a delta, particularly in the lake’s western part. By comparison, lands on the lake’s eastern part have been developed into urban areas.
The observed LCTs from 2002 to 2020 were agricultural land/barren (1.3-fold increase), built-up (2.8-fold), vegetation (0.9-fold), and water (0.2-fold). Furthermore, changes in areas excluding water extents, from 2002 to 2020 were 1.90 km2 (Teratai), 0.89 km2 (Hunggaluwa), 0.52 km2 (Bulota), 0.31 km2 (Lupoyo), 0.00 km2 (Hepuhulawa, Hutuo, and Pentadio Timur), −0.07 km2 (Kayabulan), and −0.10 km2 (Pentadio Barat). The study villages can be subsequently categorized into two types: “land increase-type villages” (hereafter LIVs) and “land steady-type villages” (hereafter LSVs). Bulota, Hunggaluwa, Lupoyo, and Teratai can be categorized as the former, whereas Hepuhulawa, Hutuo, Kayabulan, Pentadio Barat, and Pentadio Timur can be categorized as the latter. According to the field survey, LSVs were formed in the period of 1800–1920s, whereas LIVs were newly formed in the period of 1870–2000s.
Although the categorized villages demonstrated similar tendencies, the most significant LCT was observed in all classes in Teratai village. For example, increases in vegetation extents were found 1.8- (2002–2015), 0.6- (2015–2018), and 1.1-fold increases (2018–2020). Other notable positive increases in vegetation extents were also observed in LIVs, such as Lupoyo village (2.2-fold) in 2018–2020. By comparison, the agricultural lands/barren in Teratai village experienced the highest increase (2.4-fold) in 2015–2018, exhibiting an opposite vegetation increase trend. Other notable increases were mostly observed in LSVs, such as Pentadio Timur (1.6-fold), followed by Hutuo (1.4-fold) and Kayubulan and Pentadio Barat villages (1.3-fold), in 2018–2020. Furthermore, a similar tendency of the built-up areas was observed in all villages. Critical LCTs of vegetation and lands/barren extends in LIVs were presented in Figure 4.

3.1.2. LCTs Using PS Series

PS is the largest SSC with a daily collection capacity [37]; however, we derived the six LC maps with overall accuracy of confusion matrices of 92.0% (2017), 91.7% (2018), 91.7% (2019), 95.2% (2020), 95.5% (2021), and 95.5% (2022), as examples. Figure 5 depicts time series LCTs of lake-side areas, including Teratai village, which experienced the most significant changes, as described in Section 3.1.1. The observed LCTs from 2017 to 2022 were agriculture (1.1-fold increase), barren (0.4-fold), built-up (0.7-fold), vegetation (1.3-fold), and water (0.1-fold). According to the statistical test described in Section 2.4, negative increase trends were found in water (a slope of −0.094), barren (−0.064), and built-up (−0.004). In comparison, positive increase trends were found in vegetation (0.109) and agriculture (0.059). However, no trends were statistically identified in all classes from 2017 to 2022 in the study area. By associating with the results obtained from 3.1.1, the LCTs of the study area were possibly formed from water to vegetation, such as water hyacinth, barren, and agricultural land areas. In 2022, a new watercourse was also observed, particularly in Teratai village, crossing agricultural areas (Figure 5h).

3.2. Investigation of Cultural–Environmental Relationships

3.2.1. Sample Characteristics

The sex distribution of the survey respondents was 52.8% male and 47.2% female. Furthermore, the age distribution was as follows: 1.9% (17–19 years), 13.1% (20–29 years), 28.1% (30–39 years), 28.8% (40–49 years), 19.4% (50–59 years), and 8.8% (above 60 years).
The most common occupations in the study villages were agriculture and fishing (according to the interviews of key informants). According to the questionnaire survey results, the agriculture and fishery sectors accounted for 22.7% (LIVs) and 59.4% (LSVs), respectively. In particular, the major occupation in LIVs was fishing (13.6%), followed by government employee (hereafter GE) (11.4%), employee (10.2%), and agriculture (9.1%), whereas, in LSVs, the major occupation was fishing (40.6%), followed by agriculture (18.8%), and bentor (three-wheeled vehicle) driving (hereafter BD) and owners (10.1%). Furthermore, both village types had diverse minor occupations. For more statistical analysis, we categorized occupations in LIVs and LSVs into agriculture, fishing, BD, owners, and others, accounting for 9.1% (18.8%), 13.6% (40.6%), 8.0% (10.1%), 2.3% (10.1%), and 67.0% (20.3%), respectively. The others included cake bakers, carpenters, haircutters, housewives, mosque imams, sewers, traders, and traditional embroiders, for example.

3.2.2. Local Perceptions of Lake Shrinkage and Cultural Practices

The results reveal that LSVs have higher local perception of lake shrinkage (88.9%) than LIVs (67.0%). Among lake-related cultural practices, the most widely described culture in both village types was myths, accounting for 52.0% (LSVs) and 44.4% (LIVs), followed by the Dayango ritual [accounting for 44.4% (LIVs) and 32.0% (LSVs), respectively]. The parentages of the respondents’ cultural relationships in current participation were 57.4% (LIVs) and 48.9% (LSVs). The chi-square tests of independence were also used to examine the significance of the above-described values (local perception and cultural relationship) by village type. The results indicate that the relationships between these were all significant, X2 (3, N = 163) = 15.4, p = 0.0015 and X2 (3, N = 169) = 10.6, p = 0.0139.
Moreover, Table 2 summarizes the cultural practices and beliefs referred to in the field survey. A total of 50.0% (LSVs) and 28.6% (LIVs) of the respondents mentioned the existence of culture. The value domain mainly comprises relational values with articulated values, such as symbolic values, livelihoods, and identity values. These values in LIVs are categorized into myth (31.6%), followed by song (23.7%), musical instrument (15.8%), dance (13.2%), Dayango ritual (10.5%), and martial art and others (2.6%). By comparison, those in LSVs are myth (36.1%), followed by the Dayango ritual (22.2%), dance and martial art (16.7%), song (5.6%), and musical instruments (2.8%). In addition, the lake-related cultural practices in LSVs (69.4%) were more than double those in LIVs (34.6%). For example, the traditional Limboto Lake-related myths describe specific prohibitions, such as fishing in a particular lake area and taking specific foods/objects into the lake. Limboto Lake used to be a source of clean water and a place for angels from heaven to bathe. Therefore, the myth was primarily created to prevent nature and biological content from being damaged and explored on a large scale. However, as time passed and new people and cultures arrived in Gorontalo, the myth began to fade even though the traditional elders still believed the myth to be true (key informant interview).

3.2.3. Perceptions and Cultural–Environmental Relationships by Occupations

The shrinkage of the lake was most recognized by the respondents working in the fishery sector (38.5%), followed by agriculture (21.5%), in LSVs. However, in LIVs, the share of the fishery sector was 14.8%, followed by employees (13.1%). The perception level of lake shrinkage did not statistically differ by occupation in both village types, X2 (12, N = 90) = 17.3, p = 0.138 (LIVs) and X2 (8, N = 73) = 5.55, p = 0.0698 (LSVs). Furthermore, active participation in cultural practice was found in the fishery sector in LSVs (56.4%) and LIVs (18.6%). A significant relationship was found only in LSVs, X2 (8, N = 68) = 21.39, p = 0.0062.

4. Discussion

4.1. Time Series Analysis of LCTs Using Multiple Satellite Datasets

The time series analysis facilitated the LCT quantification due to the rapid environmental degradation. The results presented in this study quantified the extent of LCTs surrounding Limboto Lake, Gorontalo, Indonesia, which is a critically endangered lake experiencing rapid shrinkage. The time series LCT analysis results indicated that the LCTs of the lake-side areas are attributed to water and vegetation, such as water hyacinths, barren, and agricultural land areas (Figure 5). A huge amounts of small particle sediments from river erosion, accumulated in enclosed seas, are easily transportable in turbid water. Furthermore, these sediments accelerate rapid lake shrinkage and form massive LCTs in the lake-side areas in this region [33]. To date, several studies have quantified rapid and dramatic lake shrinkage using optical imagery, such as the Landsat series [4,5,33]. The combination of Landsat and high spatiotemporal SSC series can be used to quantify long-term LCT characteristics. Thus, more detailed information, such as land uses and changes in the waterways associated with LCTs, can be obtained. Previously, Kimijima et al. investigated the mechanism of rapid lake shrinkage using temporal Landsat series (1978–2017) and field investigations in a wider area, covering Limboto Lake [33]. However, our work quantified the LCTs of the lake-side villages by integrating them with high spatiotemporal resolution datasets, further revealing detailed LCTs.
This land-use change would be further influenced by external factors such as the national agricultural reconstruction policy. Since the early 2000s, the Indonesian central government has prioritized the production of rice, corn, soybean, and meat [49]. As a result, rice productivity in Gorontalo Province increased by 1.5 times between 2001 and 2021 [50,51]. The key informant interviews confirmed an occupational shift to the agricultural sector in search of generating high income. Moreover, the average population growth of Gorontalo Province showed 1.49- (2000–2010) and 1.58-fold increases (2010–2019), which are higher than the national growth, of 1.49- and 1.31-fold increases, respectively [52]. In this regard, it is expected that this continuous population growth will increase the food demand, resulting in the expansion of agricultural areas and an occupational shift to the agricultural sector. Teratai village, a LIV showing huge conversion from water to land surface, has high potential for agricultural land increases. Therefore, the converted lands for agricultural activities would further influence the lake environment associated with various human activities and released discharges.
Long-term monitoring using SSC datasets would help detect diverse LCTs by overcoming the limitations of the medium spatiotemporal resolutions of Landsat series, even in tropical regions that experience heavy rainstorms. Furthermore, the shrinkage of the lake increased the vulnerability to natural disasters such as floods due to the decreased capacity of water storage. This increased vulnerability to flooding directly affects the expanded agricultural areas and improved productivity at the lake-side areas. To obtain detailed information, the high temporal resolution of the SSC series (the availability of daily, weekly, and monthly products) is further able to quantify the LCTs in shortened periods. For example, the number of available images (PSB.SD Ortho tile) with less than 20% cloud coverage in the study area in 2020 was found to be approximately five times more (43 images) than that of Landsat8 (9 images) [53]. This makes weekly, monthly, and seasonal analyses possible. Gradual changes in the global environment, such as deforestation, can be monitored annually; however, monitoring rapid or extreme environmental changes, such as natural disasters (floods), estimating damage, and tracing recovery processes should be analyzed within a much shorter cycle [54]. Therefore, the high spatiotemporal resolution of SSCs would also be a potent tool and aid in monitoring the impacts of natural disasters and their control, locality safety, and environmental protections.

4.2. The Relationship between Occupation and Cultural–Environmental Relationship

Assessments of long-term LCTs can be a basis for exploring the variation in the cultural–environmental relationships among the respondents witnessing various LCTs. This study found that the fishery and agriculture sectors were the most common occupational domains in LIVs and LSVs. Existing cultural–environmental practices were mainly associated with the relational value, resulting from traditional beliefs and practices. Notably, lake-related relational values were the most common domain in LSVs. This result is consistent with studies reporting that traditional practices, such as beliefs, myths, taboos, and songs, help conserve environment [24,55]. The statistical test results revealed the significance of the local perception of lake shrinkage and cultural relationships by village type. Moreover, this significance was most notably indicated in the status of cultural relationships by occupation, particularly in LSVs. This can be explained by differences in the village formation period and major occupations. Villages formed earlier would be more ecologically, hydrologically, socioeconomically, and culturally attributed to the lake [40,41] than newly formed communities, which are mainly inhabited by outsiders having different cultural belief and practice systems [55]. Furthermore, the fishery is the main occupation in the LSVs (40.6%), followed by agriculture (18.8%), as described in Section 3.2.1. Contents of myths, songs, and rituals are directly related to the above main sectors, including prevention of nature’s destruction, disasters, and failures in the agriculture and fishery sectors. Therefore, local systems of cultural beliefs and practices have promoted an awareness of human–nature relationships, along with a moral concern for nature [24,55] as a part of life. Although the key informant interviews revealed that traditional cultural practices were disappearing because of the lack of practitioners, respectable cultural–environmental practices and preserving nature and biology have been directly and indirectly performed at a local level. Therefore, emphasizing and integrating local people’s cultural–environmental relationships, as represented by relational values from the symbolic, livelihood, and identity perspectives, in environmental management approaches and strategies would have high potential as an alternative intervention point at the local and community levels.

4.3. Methodological Contributions

We demonstrated how to integrate multiple disciplines using qualitative (the narrative in the key informant interviews and open-ended questions in the questionnaire survey) and quantitative (the time series assessment using combined satellite datasets and the questionnaire survey) methodologies. The results contributed to obtain a more comprehensive understanding of cultural–environmental relationships by villages experiencing different LCTs and explore an alternative approach for the environmental management. To date, plural values have been inadequately considered during environmental management [2,3]. Furthermore, although a multiple-discipline approach has been proposed by Jacobs et al., only a few studies have discussed the importance of the plural values associated with environmental degradation using quantified data [27]. Integrating time series quantitative data in advance can be the basis of the following analysis, making qualitative data more reliable and valid; however, such approaches are limited. Previously, Arias-Arévalo et al. used qualitative data based on questionnaires and interviews to investigate the importance of relational values with regard to environmental management [2]. However, our work depends on quantitative spatiotemporal data in advance using combined multiple satellite datasets to compare plural values among the respondents experiencing different LCTs.

4.4. Limitations

This study had several limitations related to the quality of the input data and the categorization of the sample communities. First, cloud-free Landsat series and complete images of Landsat7 were limited because of various factors, including scanline errors. Second, differences in the spatial resolution of the datasets used led to mixed pixels, possibly resulting in the overestimation or miscalculation of LCs. In particular, the misclassified barren area was most frequently classified as a built-up area in our study. A highly reflective bare soil surface can also represent an urban area such as a built-up area [56]. Third, our results were primarily based on satellite-based LCTs. However, details of various local characteristics, such as village formation types (non/trans-immigrant-based) and the status of localities (non/immigrants), should be associated at the village level for further analysis.

5. Conclusions

This study explored cultural–environmental relationships between village groups experiencing different LCTs in Gorontalo Province, Indonesia, using questionnaires and time series Earth SSCs. According to the results, significant LCTs were found in the western part of the lake, converting from water to vegetation, and agricultural lands. Moreover, a significant relationship of cultural relationships by occupation was identified in LSVs, where relational values were mainly associated with articulated symbolic, livelihood, and identity values originating from traditional beliefs and practices. Therefore, using the plural valuation approach, integrating qualitative and quantitative methodologies from multiple disciplines can provide a method for investigating the cultural–environmental relationships. The results broaden our understanding of the various types of plural values associated with LCT types and occupations. Subsequently, the importance of relational values among the respondents is strongly attributed to the conservation of nature and biology. Therefore, cultural–environmental relationships represented by relational values are expected to be integrated as an alternative tool for environmental management approaches and strategies.

Author Contributions

S.K. contributed to conceptualization of the research, methodology, data analysis, data visualization, writing-original draft preparation, and writing review and editing. M.N. provided PS datasets and technical advice. M.S. conducted funding acquisition. M.J. conducted the field survey. All authors have read and agreed to the published version of the manuscript.

Funding

This research was financially supported by the Research Institute for Humanity and Nature (RIHN: a constituent member of NIHU). Project No. RIHN 14200102.

Data Availability Statement

Not applicable.

Acknowledgments

We thank Center for Research and Application of Satellite Remote Sensing, Yamaguchi University, Japan, for providing PS datasets for this research. We also thank Ujaval Gandhi and Santhosh M, Spatial Thoughts, for the kind advice on coding. Thanks are due to Hiroki Kasamatsu for advising on the questionnaires. We are also grateful to the Universitas Negeri Gorontalo team for conducting the field survey. Many thanks to the local people who kindly and impartially responded to the interview and questionnaire used in this research.

Conflicts of Interest

The authors declare no conflict of interest.

References

  1. Daily, G.C.; Polasky, S.; Goldstein, J.; Kareiva, P.M.; A Mooney, H.; Pejchar, L.; Ricketts, T.H.; Salzman, J.; Shallenberger, R. Ecosystem services in decision making: Time to deliver. Front. Ecol. Environ. 2009, 7, 21–28. [Google Scholar] [CrossRef]
  2. Arias-Arévalo, P.; Martín-López, B.; Gómez-Baggethun, E. Exploring intrinsic, instrumental, and relational values for sustainable management of social-ecological systems. Ecol. Soc. 2017, 22, 43. [Google Scholar] [CrossRef]
  3. Jones, N.; Shaw, S.; Ross, H.; Witt, K.; Pinner, B. The study of human values in understanding and managing social-ecological systems. Ecol. Soc. 2016, 21, 15. [Google Scholar] [CrossRef]
  4. Du, Y.; Xue, H.-P.; Wu, S.-J.; Ling, F.; Xiao, F.; Wei, X.-H. Lake area changes in the middle Yangtze region of China over the 20th century. J. Environ. Manag. 2011, 92, 1248–1255. [Google Scholar] [CrossRef]
  5. Bakoariniaina, L.N.; Kusky, T.; Raharimahefa, T. Disappearing Lake Alaotra: Monitoring catastrophic erosion, waterway silting, and land degradation hazards in Madagascar using Landsat imagery. J. Afr. Earth Sci. 2006, 44, 241–252. [Google Scholar] [CrossRef]
  6. Page, M.J.; Trustrum, N.A.; DeRose, R.C. A high resolution record of storm-induced erosion from lake sediments, New Zealand. J. Paleolimnol. 1994, 11, 333–348. [Google Scholar] [CrossRef]
  7. Ariztegui, D.; Anselmetti, F.; Robbiani, J.-M.; Bernasconi, S.; Brati, E.; Gilli, A.; Lehmann, M. Natural and human-induced environmental change in southern Albania for the last 300 years—Constraints from the Lake Butrint sedimentary record. Glob. Planet. Chang. 2010, 71, 183–192. [Google Scholar] [CrossRef]
  8. United Nation. Drying Lake Chad Basin Gives Rise to Crisis. 2019. Available online: https://www.un.org/africarenewal/magazine/december-2019-march-2020/drying-lake-chad-basin-gives-rise-crisis (accessed on 3 September 2020).
  9. Kiprutto, N.; Munyao, C.; Ngoriarita, J.; Kangogo, M.; Kiage, E. Tracing the Possible Root Causes for Fleeing Flamingos in Kenya’s Lake Nakuru National Park. J. Nat. Sci. Res. 2012, 2, 23–31. [Google Scholar]
  10. Aniah, P. Behind the Myth: Indigenous Knowledge and Belief Systems in Natural Resource Conservation in North East Ghana. Int. J. Environ. Prot. Policy 2014, 2, 104. [Google Scholar] [CrossRef]
  11. Fairhead, J.; Leach, M. False forest history, complicit social analysis: Rethinking some West African environmental narratives. World Dev. 1995, 23, 1023–1035. [Google Scholar] [CrossRef]
  12. Japan International Cooperation Agency. The Study on Flood Control and Water Management Limboto-Bolango-Bone Basin in The Republic of Indonesia Volume-III Supporting Report: Part-A Existing Conditions; Japan International Cooperation Agency: Tokyo, Japan, 2002. [Google Scholar]
  13. Druce, S.C. The Lands West of the Lakes; KITLV Press: Leiden, The Netherlands, 2009. [Google Scholar]
  14. Katili, J.A. Past Anr Present Getectonic Indonesia Position of Sulawesi, Indonesia. Tectonophysic 1978, 45, 289–322. [Google Scholar] [CrossRef]
  15. Fulazzaky, M.A.; Gany, A.H.A. Challenges of soil erosion and sludge management for sustainable development in Indonesia. J. Environ. Manag. 2009, 90, 2387–2392. [Google Scholar] [CrossRef] [PubMed]
  16. Sulastri. Inland water resources and limnology in Indonesia. Tropics 2006, 15, 285–295. [Google Scholar] [CrossRef]
  17. Appiah-Opoku, S. Indigenous Beliefs and Environmental Stewardship: A Rural Ghana Experience. J. Cult. Geogr. 2007, 24, 79–98. [Google Scholar] [CrossRef]
  18. Appiah-Opoku, S. Indigenous Knowledge and Environmental Management in Africa: Evidence from Ghana. Africa’s Development in the Twenty-First Century: Pertinent Socio-Economic and Development; Ashgate Publishing, Ltd.: Surrey, UK, 2006; pp. 205–216. [Google Scholar]
  19. Kandari, L.S.; Bisht, V.K.; Bhardwaj, M.; Thakur, A.K. Conservation and management of sacred groves, myths and beliefs of tribal communities: A case study from north-India. Environ. Syst. Res. 2014, 3, 16. [Google Scholar] [CrossRef]
  20. Mukul, S.A.; Rashid, A.M.; Uddin, M.B. The role of spiritual beliefs in conserving wildlife species in religious shrines of Bangladesh. Biodiversity 2012, 13, 108–114. [Google Scholar] [CrossRef]
  21. Chunhabunyatip, P.; Sasaki, N.; Grünbühel, C.; Kuwornu, J.K.M.; Tsusaka, T.W. Influence of Indigenous Spiritual Beliefs on Natural Resource Management and Ecological Conservation in Thailand. Sustainability 2018, 10, 2842. [Google Scholar] [CrossRef]
  22. Martin, A.M.; De Anguita, P.M.; Perez, J.V.; Lanzana, J. The role of secret societies in the conservation of sacred forests in Sierra Leone. BOIS FORETS DES Trop. 2011, 310, 43–55. [Google Scholar] [CrossRef]
  23. Reyes-García, V.; Benyei, P. Indigenous knowledge for conservation. Nat. Sustain. 2019, 2, 657–658. [Google Scholar] [CrossRef]
  24. Wongsiri, A.; Nonthapot, S. The Use and Transmission of Traditional Beliefs for Environmental Conservation in the Bueng Khong Long Wetland, Thailand. J. Mekong Soc. 2022, 18, 103–124. [Google Scholar]
  25. Chan, K.M.; Balvanera, P.; Benessaiah, K.; Chapman, M.; Díaz, S.; Gómez-Baggethun, E.; Gould, R.; Hannahs, N.; Jax, K.; Klain, S.; et al. Opinion: Why protect nature? Rethinking values and the environment. Proc. Natl. Acad. Sci. USA 2016, 113, 1462–1465. [Google Scholar] [CrossRef] [PubMed]
  26. Arias-Arévalo, P.; Gómez-Baggethun, E.; Martín-López, B.; Pérez-Rincón, M. Widening the Evaluative Space for Ecosystem Services: A Taxonomy of Plural Values and Valuation Methods. Environ. Values 2018, 27, 29–53. [Google Scholar] [CrossRef]
  27. Jacobs, S.; Martín-López, B.; Barton, D.N.; Dunford, R.; Harrison, P.A.; Kelemen, E.; Saarikoski, H.; Termansen, M.; García-Llorente, M.; Gómez-Baggethun, E.; et al. The means determine the end—Pursuing integrated valuation in practice. Ecosyst. Serv. 2018, 29, 515–528. [Google Scholar] [CrossRef]
  28. García-Nieto, A.P.; Quintas-Soriano, C.; García-Llorente, M.; Palomo, I.; Montes, C.; Martin-Lopez, B. Collaborative mapping of ecosystem services: The role of stakeholders' profiles. Ecosyst. Serv. 2015, 13, 141–152. [Google Scholar] [CrossRef]
  29. Plieninger, T.; Dijks, S.; Oteros-Rozas, E.; Bieling, C. Assessing, mapping, and quantifying cultural ecosystem services at community level. Land Use Policy 2013, 33, 118–129. [Google Scholar] [CrossRef]
  30. Palomo, I.; Martín-López, B.; Potschin, M.; Haines-Young, R.; Montes, C. National Parks, buffer zones and surrounding lands: Mapping ecosystem service flows. Ecosyst. Serv. 2013, 4, 104–116. [Google Scholar] [CrossRef]
  31. Kimijima, S.; Nagai, M. Human Mobility Analysis for Extracting Local Interactions under Rapid Socio-Economic Transformation in Dawei, Myanmar. Sustainability 2017, 9, 1598. [Google Scholar] [CrossRef]
  32. Kimijima, S.; Sakakibara, M.; Nagai, M.; Gafur, N.A. Time-Series Assessment of Camp-Type Artisanal and Small-Scale Gold Mining Sectors with Large Influxes of Miners Using LANDSAT Imagery. Int. J. Environ. Res. Public Health 2021, 18, 9441. [Google Scholar] [CrossRef]
  33. Kimijima, S.; Sakakibara, M.; Amin, A.; Nagai, M.; Arifin, Y.I. Mechanism of the Rapid Shrinkage of Limboto Lake in Gorontalo, Indonesia. Sustainability 2020, 12, 9598. [Google Scholar] [CrossRef]
  34. Kimijima, S.; Sakakibara, M.; Nagai, M. Investigation of Long-Term Roving Artisanal and Small-Scale Gold Mining Activities Using Time-Series Sentinel-1 and Global Surface Water Datasets. Int. J. Environ. Res. Public Health 2022, 19, 5530. [Google Scholar] [CrossRef]
  35. Kimijima, S.; Sakakibara, M.; Nagai, M. Characterizing Time-Series Roving Artisanal and Small-Scale Gold Mining Activities in Indonesia Using Sentinel-1 Data. Int. J. Environ. Res. Public Health 2022, 19, 6266. [Google Scholar] [CrossRef]
  36. Kimijima, S.; Sakakibara, M.; Nagai, M. Detection of Artisanal and Small-Scale Gold Mining Activities and Their Transformation Using Earth Observation, Nighttime Light, and Precipitation Data. Int. J. Environ. Res. Public Health 2021, 18, 10954. [Google Scholar] [CrossRef] [PubMed]
  37. Planet Labs. PlanetScope. 2022. Available online: https://developers.planet.com/docs/data/planetscope/#:~:text=lastupdated%3AJune01%2C2022,200millionkm2%2Fday (accessed on 8 June 2022).
  38. Frazier, A.E.; Hemingway, B.L. A Technical Review of Planet Smallsat Data: Practical Considerations for Processing and Using PlanetScope Imagery. Remote Sens. 2021, 13, 3930. [Google Scholar] [CrossRef]
  39. Yunginger, R.; Bijaksana, S.; Dahrin, D.; Zulaikah, S.; Hafidz, A.; Kirana, K.H.; Sudarningsih, S.; Mariyanto, M.; Fajar, S.J. Lithogenic and Anthropogenic Components in Surface Sediments from Lake Limboto as Shown by Magnetic Mineral Characteristics, Trace Metals, and REE Geochemistry. Geosciences 2018, 8, 116. [Google Scholar] [CrossRef]
  40. Noor, S.Y. Trophic status of Limboto lake in Gorontalo Province. IOP Conf. Series: Mater. Sci. Eng. 2019, 567, 012029. [Google Scholar] [CrossRef]
  41. Subehi, L.; Wibowo, H.; Jung, K. Characteristics of Rainfall-Discharge and Water Quality at Limboto Lake, Gorontalo, Indonesia. J. Eng. Technol. Sci. 2016, 48, 288–300. [Google Scholar] [CrossRef]
  42. Lamangida, T.; Akib, H.; Malago, J. Management of Public Assets Study Management of Lake Limboto Gorontalo District. IOSR J. Humanit. Soc. Sci. 2018, 23, 92–99. [Google Scholar] [CrossRef]
  43. Human Rights Watch. ‘Why Our Land ?’ Oil Palm Expansion in Indonesia Risks Peatlands and Livelihoods; Human Rights Watch: New York, NY, USA, 2021. [Google Scholar]
  44. Hunowu, M.A.; Pakuna, H.B.; Obie, M. Creating Harmony in Multi-Ethnic and Religious Community: Evidence from the Transmigration Land of Raharja Village, Indonesia. East Afr. Sch. Multidiscip. Bull. 2020, 3, 181–186. [Google Scholar] [CrossRef]
  45. The Jakarta Post. Painting Messages on Lake Limboto. 2013. Available online: https://www.thejakartapost.com/news/2013/10/07/painting-messages-lake-limboto.html (accessed on 1 July 2022).
  46. Baruadi, M.K.; Eraku, S. Folklore Dalam Legenda Danau Limboto. PROSIDING 2018, 10, 642. [Google Scholar]
  47. BPS—Statistics Indonesia. Statistic Indonesia. 2020. Available online: https://www.bps.go.id/ (accessed on 30 April 2022).
  48. Japan Association on Remote Sensing. Remote Sensing Note; Japan Association on Remote Sensing: Tokyo, Japan, 1996. [Google Scholar]
  49. Richter, C.; Kovacs, H.; Buck, J.; Wacker, A.; Fürtig, B.; Bermel, W.; Schwalbe, H. 13C-direct detected NMR experiments for the sequential J-based resonance assignment of RNA oligonucleotides. J. Biomol. NMR 2010, 47, 259–269. [Google Scholar] [CrossRef]
  50. BPS Statistics Indonesia. Production (Tons), 2001–2003. 2022. Available online: https://www.bps.go.id/indicator/53/23/5/production.html (accessed on 30 April 2022).
  51. BPS Statistics Indonesia. Harvested Area, Productivity, and Production of Paddy by Province 2019–2021. 2022. Available online: https://www.bps.go.id/indicator/53/1498/1/harvested-area-productivity-and-production-of-paddy-by-province.html (accessed on 30 April 2022).
  52. BPS Statistics Indonesia. Average Population Growth by Province, 1971–2019. 2022. Available online: https://www.bps.go.id/statictable/2009/02/20/1268/rata-rata-laju-pertumbuhan-penduduk-menurut-provinsi-1971---2019.html (accessed on 30 April 2022).
  53. Planet Labs. Planet Explore. 2022. Available online: https://www.planet.com/expl (accessed on 1 May 2022).
  54. Kimijima, S.; Nagai, M.; Sakakibara, M. Monitoring Coexisting Rapid Small-scale and Large-scale Gold Mining Developments Using Planet Smallsats Constellations. Mining 2022, 2, 566–577. [Google Scholar] [CrossRef]
  55. Lebbie, A.; Guries, R. The Role of Sacred Groves in Biodiversity in Sierra Leone; Ohio University Press: Athens, OH, USA, 2008. [Google Scholar]
  56. Barenblitt, A.; Payton, A.; Lagomasino, D.; Fatoyinbo, L.; Asare, K.; Aidoo, K.; Pigott, H.; Som, C.K.; Smeets, L.; Seidu, O.; et al. The large footprint of small-scale artisanal gold mining in Ghana. Sci. Total Environ. 2021, 781, 146644. [Google Scholar] [CrossRef] [PubMed]
Figure 1. Overall methodological workflow.
Remotesensing 14 04249 g001
Figure 2. Study area: (a) country overview; (b) regional overview; (c) topographical setting and lake-side villages.
Remotesensing 14 04249 g002
Figure 3. Land cover classification results of land increase-type villages and land steady-type villages from the random forest model using Landsat series.
Remotesensing 14 04249 g003
Figure 4. Land cover classification of vegetation and lands/barren in Teratai and Lupoyo villages.
Remotesensing 14 04249 g004
Figure 5. Example of LCTs at the lake surrounding areas using PS series: (a) lake-side overview; (bg) LCTs (2017−2022); (h) overview of (g) 2022′s red square.
Remotesensing 14 04249 g005
Table 1. Main specification of satellite imagery used in the study.
Instrument NameInstrument TypeAcquisition DateSpatial Res. (m)Temporal Res. (days)Swatch Width (km)
Landsat series
Landsat7ETM+2002/04/14, 05/16 15–3016185.0 × 185.0
Landsat8OLI2013/04/2015–3016185.0 × 185.0
2015/04/10, 05/12, 05/28
2018/05/04
2020/04/23, 05/09, 05/25
Planet series
Dove ClassicPS22017/04/123125.0 × 11.5
2018/04/20
2019/04/16
2020/04/09
SuperDovePSB.SD2021/04/213132.5 × 19.6
2022/05/03
Table 2. Examples of the cultural practices.
Value
Domain
Articulated ValueCategoryVillage
Type
N%Example
RelationalSymbolic valueMythLI
LS
12 (4)
13 (13)
31.6% (44.4%) 36.1% (52.0%)* Traditional Limboto Lake-related myths and specific prohibitions
Symbolic valueSongLI
LS
8 (0)
2 (1)
23.7% (0%)
5.6% (4.0%)
* A traditional Limboto Lake-related song, namely Lohidu, describes lake activities such as fishing, fish feeding, rowing, and the situations of the lake.
LivelihoodsDayango RitualLI
LS
4 (4)
8 (8)
10.5% (44.4%)
22.2% (32.0%)
* A traditional ritual, namely Dayango, is performed to prevent disasters, e.g., agricultural crop failure, lake fish loss, disease, and rain; this ritual is performed in the dry season. Farm animals, such as goats, are transported on boats and bathed in the lake.
IdentityMartial artsLI
LS
1 (0)
6 (3)
2.6% (0%)
16.7% (12.0%)
Martial arts were developed in 2000 for self-defense. These martial arts are mainly performed during traditional wedding ceremonies.
IdentityMusicalinstrumentLI
LS
6 (0)
1 (0)
15.8% (0%)
2.8% (0%)
Gambus is a traditional musical instrument, which is a six-stringed, plucked instrument of Arabic origin.
IdentityDanceLI
LS
5 (1)
6 (0)
13.2% (11.1%)
16.7% (0%)
Traditional dances have been practiced in Gorontalo since 1462. These dances were created as Gorontalian identical symbols during the tense period of wars.
InstrumentalMonetary benefitsOthersLI
LS
1 (0)
0
2.6% (0%)
0%
Perfume production
Note: LI and LS in the Village type column indicate land increase-type village and land steady-type village. The column “N” indicates the respondents who described any cultural beliefs and practices. The number enclosed in parentheses under the N column indicates respondents who described lake-related cultural beliefs and practices. The percentage under the % column indicates respondents who described any cultural beliefs and practices. The percentage enclosed in parentheses under the % column indicates respondents who described lake-related cultural beliefs and practices. * indicates environment-related beliefs and practices.
Publisher’s Note: MDPI stays neutral with regard to jurisdictional claims in published maps and institutional affiliations.

