Article

A Forest Fire Susceptibility Modeling Approach Based on Light Gradient Boosting Machine Algorithm

1
College of Information Science and Technology, Nanjing Forestry University, Nanjing 210037, China
2
National Laboratory of Radar Signal Processing, Xidian University, Xi’an 710071, China
*
Author to whom correspondence should be addressed.
Remote Sens. 2022, 14(17), 4362; https://doi.org/10.3390/rs14174362
Submission received: 11 July 2022 / Revised: 18 August 2022 / Accepted: 29 August 2022 / Published: 2 September 2022

Abstract

:
A forest fire susceptibility map generated with the fire susceptibility model is the basis of fire prevention resource allocation. A more reliable susceptibility map helps improve the effectiveness of resource allocation. Thus, further improving the prediction accuracy is always the goal of fire susceptibility modeling. This paper developed a forest fire susceptibility model based on an ensemble learning method, namely light gradient boosting machine (LightGBM), to produce an accurate fire susceptibility map. In the modeling, a subtropical national forest park in the Jiangsu province of China was used as the case study area. We collected and selected eight variables from the fire occurrence driving factors for modeling based on correlation analysis. These variables are from topographic factors, climatic factors, human activity factors, and vegetation factors. For comparative analysis, another two popular modeling methods, namely logistic regression (LR) and random forest (RF) were also applied to construct the fire susceptibility models. The results show that temperature was the main driving factor of fire in the area. In the produced fire susceptibility map, the extremely high and high susceptibility areas that were classified by LR, RF, and LightGBM were 5.82%, 18.61%, and 19%, respectively. The F1-score of the LightGBM model is higher than the LR and RF models. The accuracy of the model of LightGBM, RF, and LR is 88.8%, 84.8%, and 82.6%, respectively. The area under the curve (AUC) of them is 0.935, 0.918, and 0.868, respectively. The introduced ensemble learning method shows better ability on performance evaluation metrics.

Graphical Abstract

1. Introduction

Forests are essential for maintaining ecosystem balance. However, as one of the main threats to forests, fires destroy the environment and cause huge economic losses. Although the number of fires has shown a downward trend, the overall number is still high [1,2,3]. In order to reduce the loss caused by fire, various fire detection technologies, such as fire patrol, satellite and ground sensing networks have been used [4,5]. More ambitious researchers have tried to develop more practical and accurate fire models for mapping the fire susceptibility zone of a local area [6,7].
Forest fire susceptibility presents the likelihood of a fire occurring in a particular region, which is usually affected by different driving factors [8]. Analyzing and selecting the driving factors that cause forest fires is necessary for determining fire susceptibility [9]. Currently, the topography, climate, human activity, and vegetation factors are the four recognized categories in the susceptibility modeling [10,11].
Nowadays, developing fire models and mapping forest fire zones appear to be the first choices in fire management [12,13]. In recent decades, some traditional methods, such as expert-knowledge-based methods [14], multicriteria decision analysis [15], and analytic hierarchy process [16] have been used in the development of fire models. However, when the number of fire influencing factors is excessive, it needs to construct the large judgment matrix with many elements, and the weight of fire influencing factors is difficult to determine in the expert-knowledge based model [13]. At the same time, it is difficult to judge the importance of fire-influencing factors and even lead to rank reversal [13]. Sometimes, there are some inconsistencies in the analytical system process since the set of criteria is not fixed ex ante, and the importance of each fire influencing factor is obtained through a questionnaire survey of decision-makers. For these reasons, it is likely that traditional methods are no longer appropriate for some cases involving uncertain situations such as forest fires [17]. Thus, it is imperative that more reliable and effective techniques are developed for modeling forest fires.
Machine learning can learn and efficiently derive the relative critical attribute of different fire datasets [18] which is more reliable and faster than humans, especially when different fires are involved [19]. Recently, machine learning methods such as support vector machines [20], neural networks [21], kernel logistic regression benchmark classifiers [22,23], and hybrid artificial method [24] are prevalent in the study of fire prediction models.
Among them, random forest (RF) and logistic regression (LR) models are classical machine learning models that are effective in modeling forest fire susceptibility, which is the reason for their widespread use [9,25,26]. However, for the case of a larger number of decision trees in RF, the space and time involved in training are comparatively higher [27]. LR is not good at handling the problems of nonlinearity and data imbalance [28]. Although it is difficult to determine which modeling method or technique should be used to construct the fire susceptibility model in a selected region, providing high prediction accuracy is the primary concern of such studies. Previous studies have indicated that machine learning methods can provide accurate results in most cases [29].
In order to provide more options for developing more accurate forest fire prediction, this paper proposed an ensemble learning method, namely light gradient boosting machine (LightGBM), to model forest fire susceptibility. To the best of our knowledge, there is currently no exploration of forest fire susceptibility modeling using this methodology [30]. In order to validate its performance, the well-recognized RF and LR modeling methods were also used for constructing the fire susceptibility model for the purpose of comparative analysis. The introduced ensemble learning method shows a better ability on performance evaluation metrics, such as classification accuracy and AUC. This paper extends the application of LightGBM to the prediction of fire susceptibility.

2. Materials and Methods

The modeling of the introduced ensemble learning method is based on the real dataset of subtropical national forest park areas from 2013 to 2017. For validation and comparative analysis, the LR and RF were also applied to construct the models under the same modeling characteristics. Figure 1 presents the general workflow from data input to obtain the fire susceptibility map.

2.1. Study Area

A subtropical national forest park area, namely mountain Laoshan, was used as the case study area, which is located in the Jiangsu province of China (Figure 2). This is an evergreen and deciduous broad-leaved mixed forest. The region has a variety of ecological resources. It starts from the eastern Pukou high-tech zone; the south is close to the Yangtze River; the north is close to the Chu River; and the west end is located in Hexian County, Anhui Province. It covers an area of approximately 80 km2 and ranges in altitude from 4.5 m to 414.7 m, where forests cover up to 80%. The Laoshan mountain range extends in a southwest to northeast direction. The subtropical monsoon climate of Laoshan is very mild and humid throughout the year, where annual precipitation reaches 1000 mm and the average annual temperature is 15.3 °C.

2.2. Fire-Influencing Factors

Topography is considered to be one of the essential fire factors, because topography affects water flow and heat transfer in local areas, indirectly affects vegetation growth, as well as limits human activities [31].
Altitude could result in different environmental conditions in terms of vegetation growth, humidity, and temperature [32,33]. Consequently, the probability of the occurrence of a fire may vary with altitude. In this area, altitude is not high enough to consider the effects of atmospheric oxygen levels. The aspect of facing the sun means lower humidity, and consequently, increases the dryness of combustible materials [34]. Fire spread is more likely to spread uphill due to convection [35] and more heat transfer through conduction; depending on slope steepness, there are more opportunities for direct flame contact with fuels [36]. The Topographic Wetness Index (TWI) indicates the spatial distribution of soil moisture in watersheds [37]. The higher the TWI, the higher the soil moisture [38]. Consequently, this influences fire occurrence and spread. Slope, aspect, and altitude affect water evaporation. Fires may travel quickly on upward slopes but slower in areas with downward slopes [39].
Vegetation growth distribution, coverage, and the context of the vegetation canopy could influence the fuel of the fire [40]. The vegetation distribution situation is reflected using an index known as normalized difference vegetation index (NDVI) [41,42].
Climate not only affects forest fires but also changes the combustion conditions of vegetation [43]. To consider the features of forest fires, climatic factors such as temperature are also used [44,45]. The temperature affects the flammability of the vegetation. The higher the temperature, the stronger the evaporation effect, the lower the water content of the vegetation [46] and the lower the amount of heat needed to bring fuels to ignition (pyrolysis) [47]. Thus, temperature (TMP) is correlated with the wetting and drying of combustible materials, which to some extent reflects the fire proneness rate [48].
Along the road or near human settlements, careless human activity, such as the cigarette ends dropped, may trigger accidental fires [49]. Therefore, fire factors should take into account human activity factors, such as the distance to roads (DTR), and distance to populated areas (DTP) [15,31,50].
The fire factors that we collected and used in this research are shown in Table 1. The dataset is comprised of NDVI, TWI, TMP, altitude, aspect, slope, DTR, and DTP. There, altitude, slope, aspect, TWI, DTR, and DTP are derived from DEM data. The climate dataset of the fire season can be obtained from the geospatial data cloud. The TMP and NDVI are extracted from Landsat-8 satellite data of fire season between 2013 and 2017. We use the temperature inversion method to extract the TMP, and the TMP used in the modeling is averaged. NDVI is calculated using the formula: NDVI = (NIR − R)/(NIR + R) based on near-infrared reflectance (NIR) and red reflectance (R). The spatial distribution of fires was derived from the moderate resolution imaging spectrometer (MODIS). A total of 454 historical fire points recorded during the period 2013–2017 were extracted and randomly divided into two parts for modeling. Among them, 318 (70%) fire points were for training the model. The others were for validating. The spatial distribution of the factors in the area is demonstrated in Figure 3. The resolution of all the elements is 30 × 30 m.

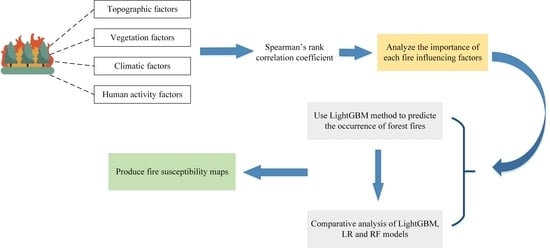
2.3. LightGBM-Based Modeling

While the scale of forest fire data collected has become more extensive, traversing all the sample data with traditional adaptive boosting models (such as XGBoost, pGBRT, etc.) is increasingly facing challenges in terms of efficiency. LightGBM is a newly adaptive boosting model [51] that is a distributed and effective method of tackling the challenges that need to be considered in traditional adaptive boosting models, including small memory, computational complexities, and time. It can address classification or regression tasks with the constructed decision tree based on the gradient boosting framework. The main steps of the modeling are as follows:
  • Gradient-based one-side sampling (GOSS). Firstly, the first a × 100% of the samples sorted by the absolute values of the gradients in descending order are large gradient samples, and the last (1 − a) × 100% are called small-gradient samples, where a is the scale threshold. The small gradient samples are randomly sampled with a sampling ratio of b × 100% to obtain the smaller sample dataset;
  • Split data horizontally, and different workers own part of the data. Then, the number of features is decreased using the exclusive feature bundling (EFB) algorithm;
  • Using the histogram algorithm to decrease the time complexity of traversing the sample. Discretize the continuous floating point feature values into K integers, and construct a histogram of width K. K integers are used as an index to accumulate statistics in the histogram when traversing the data. After accumulating statistics in the histogram once, the discretized values of the histogram are traversed to search the optimal splitting point;
  • Voting parallelism. Filter the local optimal features based on voting and then merge them into the global optimal features;
  • Build a local histogram for selected features on each work; then, build the global histogram for selected features and calculate the global optimal partition (global aggregate);
  • Train the model and set the parameter max_depth to 7 to prevent overfitting. Then, the value of AUC is used as an evaluation metric and the optimal model is obtained by 5-fold cross-validation.
We integrated the spatiotemporal information of fire occurrence driving factors, namely topographic factors, climatic factors, human activity factors, and vegetation factors in the LightGBM model, and then developed a LightGBM-based fire susceptibility model in this study. The model performance and spatial prediction ability are obtained by the training and validation of the collected historical fire data. The decision tree is constructed based on the gradient boosting framework. Firstly, it reduces the amount of data and features based on GOSS and EFB algorithms. Secondly, the optimal partition is derived through the voting mechanism. Then, the value of AUC is used as an evaluation metric and the optimal model is obtained by k-fold cross validation. The model diagram is shown in Figure 4.

3. Results

3.1. Variable Correlation Analysis

It is necessary to analyze the distribution of each feature (attribute, dimension) and the relationship between them when modeling. Figure 5 shows the correlation between the variables with a scatter plot matrix. It can be seen that altitude is negatively correlated with both temperature and TWI. This is consistent with the general knowledge that the higher the altitude, the lower the average temperature and humidity. There is a positive correlation between altitude and NDVI. Because within a specific height range, the higher the altitude, the less human activities, and the more lush the vegetation. The south-facing slopes can influence vegetation type and density as well as soil moisture, as it is warmer and drier [52,53]. However, in this area, the altitude is not high enough, and the difference in warm and dryness between the north- and south-facing aspects is not obvious. Consequently, the vegetation type and density difference are not obvious, and there is no significant correlation between aspect and NDVI. This is consistent with the equation of TWI calculation where the larger the slope, the smaller the TWI.
It is necessary to calculate the value of the correlation coefficient before the modeling, so that we know how strong the relationship is between the independent and dependent variables. Spearman’s rank correlation coefficient is using to analyze the correlation of eight forest fire-influencing factors with fire points [54]. The formula for calculating the value of the correlation coefficient between the variables is shown in Equation (1) [55]:
ρ = 1 n i = 1 n ( R ( x i ) R ( x ) ¯ ) · ( R ( y i ) R ( y ) ¯ ) ( 1 n i = 1 n ( R ( x i ) R ( x ) ¯ ) 2 ) · ( 1 n i = 1 n ( R ( y i ) R ( y ) ¯ ) 2 )
where R ( x i ) and R ( y i ) are the digits of x and y, respectively; R ( x ) ¯ and R ( y ) ¯ denote the mean rank.
The outcomes of Spearman’s rank correlation coefficient are given in Table 2. When the P-value is below 0.05, it indicates that there are correlations between the variables. It can be seen that the P values of the eight influencing variables are all less than 0.01 (Table 2), indicating that they are related and thus there is no need to exclude any factors in this analysis. Among them, the highest relationship is TMP (0.486), followed by NDVI (0.370), altitude (0.331), and slope (0.298). Aspect (0.044), DTR (0.045), and DTP (0.008) have weaker predictive power. The out of bag (oob) error is the number of wrongly classifying the oob sample. The minimum oob error implies the smallest prediction error rate for out-of-bag samples. The importance of variables is derived from the minimum oob error (Figure 6). It can be seen that TMP has a more significant effect on fire ignition than others. The importance rankings of the forest fire-influencing factors are shown in Figure 6.

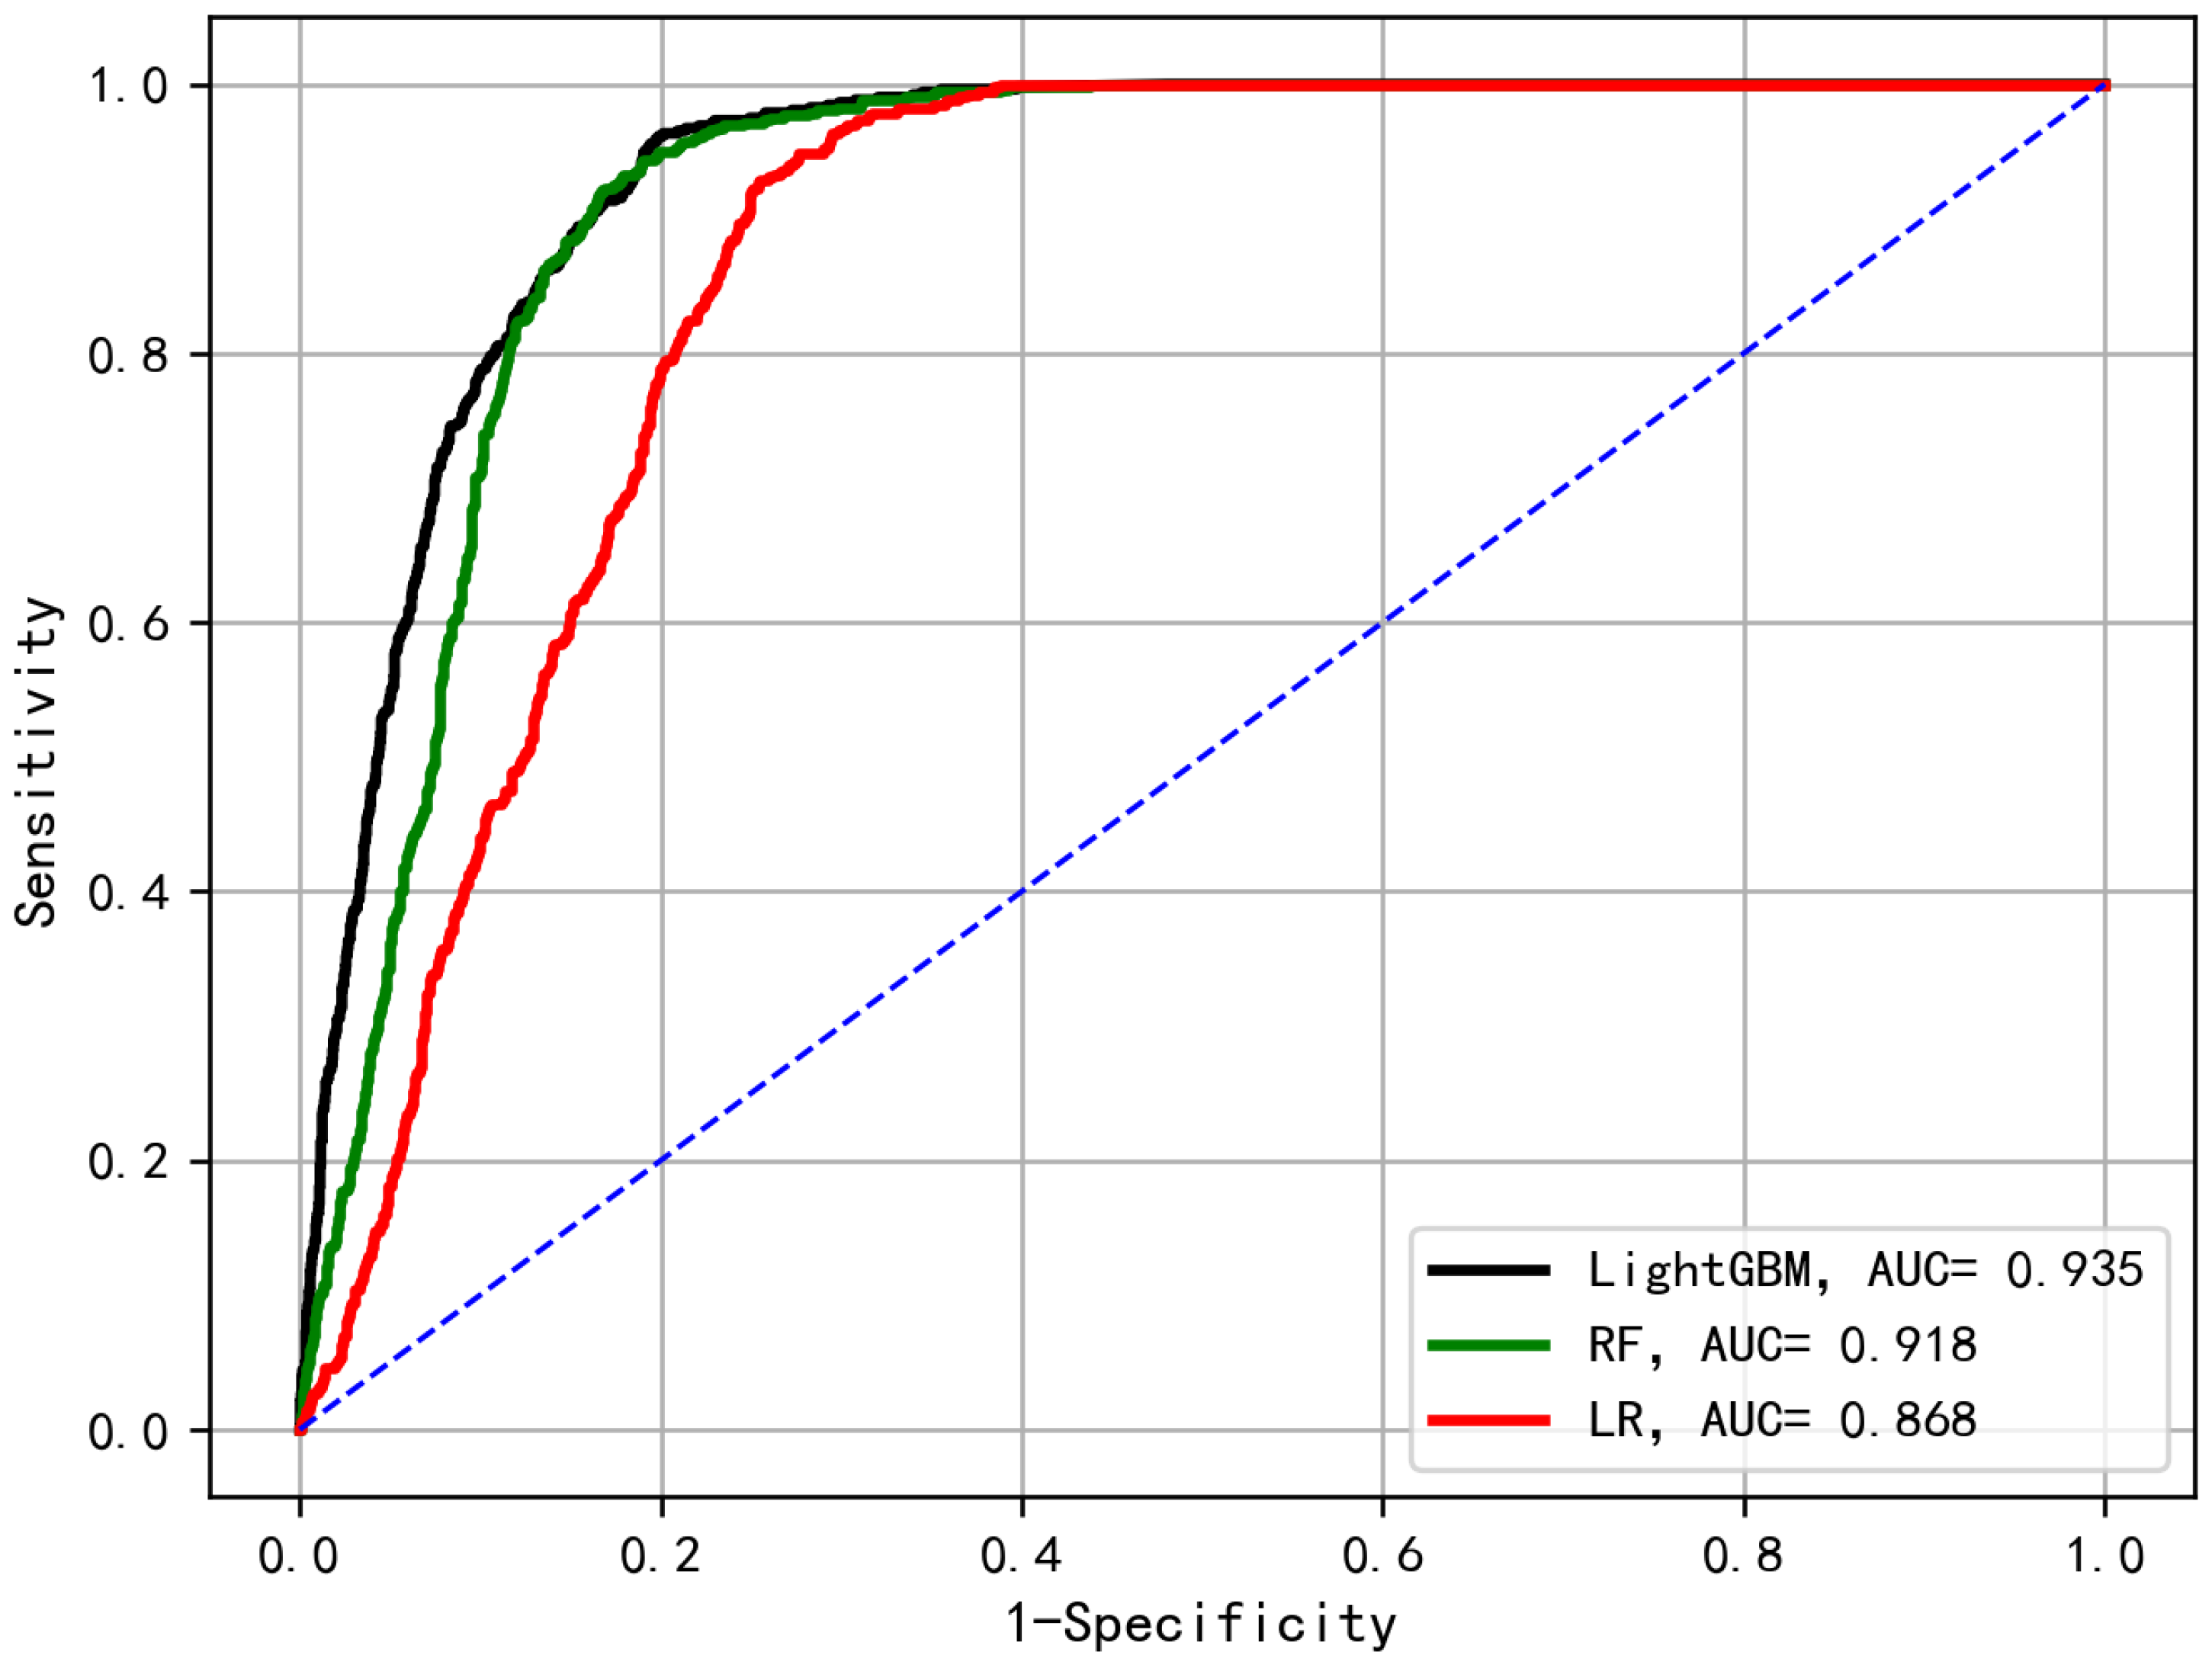
3.2. Performance Comparative Analysis

Table 3 shows the performance of three models in training and validation stages. The F1-score (Equation (2)) of the LightGBM model is higher than LR and RF models. This indicates that the discrepancy between LightGBM predicted data and validation data is small. With the training dataset, the classification accuracy (ACC) of the RF, LR, and LightGBM is 82.61%, 84.81%, and 88.83%, respectively. In contrast, their accuracy is 75.12%, 76.52%, 81.81% in the validation dataset. Under the same conditions, LightGBM model is more accurate.
F 1 - score = 2 · p r e c i s i o n · r e c a l l p r e c i s i o n + r e c a l l
where precision represents the number of fires correctly detected divided by the total number of fires detected by the model; recall represents the number of fires correctly detected by the model divided by the actual number of fires, that is, the detection rate; and the F1-score represents the harmonic mean between precision and recall [56].
The receiver operating characteristic (ROC) curve is shown in Figure 7. The area under curve (AUC) of the LightGBM model is the 0.935. The AUC of the RF and LR model is 0.918 and 0.868, respectively. The LightGBM model shows the potential ability to predict the forest fire susceptibility. This also indicates that ensemble learning is more suitable than non-ensemble learning when developing applications such as forest fire analysis in this area.
Figure 8 shows the generated fire susceptibility maps of the three models, where the fire susceptibility are classified into five levels: extremely low, low, moderate, high, and extremely high. The proportion of the area of different fire susceptibility levels over the total area with three models are counted, respectively, where the percentages of extremely high and high susceptibility levels that were classified by LR, RF, and LightGBM, could be derived, which were 5.82%, 18.61%, and 19%, respectively. The areas predicted as high fire susceptibility by RF and LightGBM are larger than that predicted by LR under the same factor conditions. Overall, the maps generated by the three models are similar under the same modeling factors and conditions (Figure 8). In addition, areas of high susceptibility are gathered in the surrounding area, partly concentrated at the junction of the two sidehills at the lower left.

4. Discussions

4.1. Fire-Influencing Factors and Fire Susceptibility Prediction

A forest fire susceptibility map plays an important role in fire susceptibility management and fire resource allocation [57]. The results show that natural factors, such as topography, vegetation, etc., are fire-influencing factors. Human activity is also strongly associated with fire occurrence. Based on topographic factors, climatic factors, vegetation factors, and human activity factors, this paper proposes the LightGBM-based modeling method. The reasons for recommending the LightGBM model can be summarized as follows:
  • Faster model training efficiency [58] and lower memory usage [59];
  • Support single-computer multi-threading, multi-computer parallel computing, and GPU training [51]; capable of handling large-scale data [60];
  • Many machine learning algorithms do not directly support category features, the LightGBM model does [60].
In different environments, the fire-influencing factors and the corresponding weights of each factor are different [61]. Therefore, it is very difficult to design a fire susceptibility prediction model with universal applicability [62]. Previous studies have shown that although fire susceptibility prediction models are not universally applicable, the feature importance evaluation method of fire-influencing factors is widely applicable [63]. This paper evaluates the importance of fire influencing factors and applies LightGBM to fire susceptibility prediction.
Based on the study area, four categories of fire influencing factors were selected and extracted from public data: topography (altitude, slope, aspect, and TWI), vegetation (NDVI), climate (TMP), and human activity (DTP, DTR). These fire-influencing factors are widely used in current fire susceptibility predictions and are considered to be effective factors [11,64].
This paper models fire-influencing factors using the LightGBM method, which is a new adaptive boosting model [51]. We integrated the spatiotemporal information of fire and fire occurrence driving factors into the LightGBM model, and then developed a LightGBM-based fire susceptibility model. This model addresses classification tasks with the constructed decision tree based on the gradient boosting framework. The comparative analysis results indicate that ensemble learning performs better than non-ensemble learning in developing applications, such as forest fire analysis.

4.2. The Influence of Factors on the Fire Susceptibility Model

Topographic factors are often used in fire susceptibility prediction models [22]. TWI, altitude, aspect, and slope were used as topography-related fire influencing factors in this paper. The correlation coefficient of altitude is 0.331, which is the third of all factors. In higher altitudes, the soil moisture and temperature are lower. Although soil moisture is lower at higher altitudes due to the downward movement of water, the lower temperatures result in a higher amount of heat needed to bring fuels to ignition. In higher altitudes, less human activity also makes human-made fires less likely. In the study area, the slope is small, so there is little variation in soil moisture. Thus, the high altitude area has lower temperature and less human activity [65], which makes the high altitude area of the region significantly less susceptible to fire occurrence than the low-altitude area [66].
From the extracted fire points, we can see that the vast majority of fires in the region are located in low-slope areas, which have gentler topography [67]. When a fire occurs, it can spread in all directions without obvious directionality. As can be seen in Table 2, slope has an obvious impact on the occurrence of fire with a correlation coefficient of 0.298.
The correlation coefficient of TWI is 0.195. The likelihood of fire occurrence is low in areas with a high moisture content [68]. In areas with less surface water, the moisture content of surface vegetation is low. Consequently, it increases the likelihood of fire occurrence [69]. The aspect also affects the likelihood of fire occurrence. The sunny areas will have a higher temperature than the shaded areas, thus increasing the likelihood of fire occurrence [70]. As the majority of the study area is oriented north–south, with relatively small areas facing the sun, aspect has less influence on fires with a correlation coefficient of 0.044.
Factors, such as TWI, aspect, and altitude directly or indirectly affect the temperature. High temperature can rapidly evaporate the moisture content of surface vegetation, and even cause droughts in this region [71], so that the likelihood of fire occurrence increases [72]. The historical fire events show that the vast majority of fires occur in the summer and autumn [73,74]. In this paper, the subtropical monsoon climate makes the climate of Laoshan very mild and the average temperature is 15.3 °C throughout the year. Examining Figure 3, it can be seen that there is a large number of areas with a temperature exceeding 25 °C. This means that the region is generally hot and prone to fires. The correlation coefficient of temperature is up to 0.486, which corresponds to the actual situation in this region.
Vegetation is considered the provider of fuel for fire occurrence and spread [75,76]. Vegetation is widespread, and types of them varied in different areas. Different vegetation distribution, vegetation type and vegetation moisture content also imply the different likelihood of fire occurrence [77,78,79]. Although such vegetation parameters are helpful in performing more accurate modeling, NDVI is widely considered an effective index [80]. In this area, the vegetation is densely distributed. Moreover, the higher temperature makes the moisture content of the vegetation relatively lower, making the relatively drier area more fire-prone. As a result, the derived correlation coefficient of 0.370 of the vegetation factor is reasonable.
In areas close to roads, large numbers of vehicles, pedestrians, accidents, littered cigarette butts, etc., can start a fire [17,81]. However, areas near popular locations for people to gather also have the likelihood of fire occurrence [82]. In this area, the impact of human activity along roads on fires higher than that in people gather area. As a result, the correlation coefficients of DTR are larger than DTP.

4.3. Results and Application Analysis

Forest fire prediction plays an integral role in forest management [83]. Developing a high accurate fire prediction model is challenging [84]. As seen in Table 3 and Figure 7, LightGBM obtained a classification accuracy of 88.83% on the training set and 81.81% on the validation set with an AUC of 0.935. The LightGBM proposed in this paper is better in forest fire prediction modeling compared to LR and RF. In this paper, the dataset is randomly divided into training and validation sets in the ratio of 7:3, which is the way widely used in related works [84,85,86,87]. In future work, we would consider other ways of dividing the dataset (a ratio of 8:2).
For forest fire managers, such an accurate model is helpful in the timely detection of fires. The fire patrol can start a new route with the fire susceptibility map, thereby decreasing the time to patrol and probably saving in cost during the patrol, especially if there is a heavy task in the area. Recently, we have witnessed a growing interest in wireless sensor networks [88]. With the susceptibility map, a cost-effective means of deploying sensor nodes can be provided, where the different densities of fire sensor nodes are deployed according to the fire susceptibility level.
In the meantime, the timely detection of fires is a priority. Although increasing human patrol is currently an effective method of detecting fire in time, with the advancement of technology, drones become an increasingly practical tool [89]. Drones are expected to replace human patrol in the future in a cost-effective way. The fire susceptibility map provides a reference for planning drone paths, meanwhile, reducing human costs and increasing efficiency.

5. Conclusions

Forest fire prevention is a long-term process that requires unremitting efforts in the development of reliable fire susceptibility prediction methods so as to provide accurate results for fire managers. The main contributions of this paper can be summarized as follows:
  • We developed a forest fire susceptibility model based on an ensemble learning method to produce an accurate fire susceptibility map for Nanjing Laoshan National Forest Park;
  • The correlation coefficient between fire-influencing factors are calculated based on Spearman correlation, to determine whether there are correlations between the factors in the study area;
  • The result of the importance ranking of forest fire-influencing factors indicates that TMP and NDVI are two significant factors, which can be used as a reference for fire management department;
  • The introduced ensemble learning method shows a better ability on performance evaluation metrics, such as classification accuracy and AUC. To validate its performance, we applied another two widely used modeling methods to establish the forest fire susceptibility models for comparative analysis. The accuracy of LightGBM in training data and validation data are 88.83% and 81.81%, respectively. The results are higher than LR and RF. The result of the AUC also reveals that LightGBM has better performance. These show that the introduced ensemble learning method is better than the compared methods in terms of the accuracy and AUC value. This paper extends the application of LightGBM to the prediction of fire susceptibility.
Overall, the maps generated by the three models are similar under the same modeling conditions. The likelihood of fire occurrence over a perimeter and the junction of the two sidehills in the area is worrisome. This should be of great concern when making wildfire prevention strategies across this area. Moreover, local fire management officials can use fire susceptibility maps to reasonably allocate firefighting resources and facilities (such as fire towers and patrols paths).

Author Contributions

Conceptualization, F.Z. and H.L.; methodology, Y.S.; software, Y.S.; validation, Y.S.; formal analysis, F.Z.; investigation, H.L. and S.X.; resources, F.Z.; data curation, Y.S.; writing—original draft preparation, Y.S.; writing—review and editing, F.Z. and Y.S.; visualization, Y.S.; supervision, F.Z.; funding acquisition, F.Z. and H.L. All authors have read and agreed to the published version of the manuscript.

Funding

This work was supported in part by the National Natural Science Foundation of China(NSFC) under Grant 32171788, the Key Research and Development plan of Jiangsu Province (Grant No. BE2021716), the Jiangsu Modern Agricultural Machinery Equipment and Technology Demonstration and Promotion Project (NJ2021-19).

Data Availability Statement

A 30m-resolution DEM data can be downloaded from Geospatial Data Cloud (GDC) (https://www.gscloud.cn, accessed on 20 April 2022). The MODIS data can be downloaded from National Aeronautics and Space Administration (NASA) (https://ladsweb.modaps.eosdis.nasa.gov/, accessed on 27 April 2022).

Conflicts of Interest

The authors declare no conflict of interest.

References

  1. Luo, Y.X.; Li, Q.; Jiang, L.R.; Zhou, Y.H. Analysis of Chinese fire statistics during the period 1997–2017. Fire Saf. J. 2021, 125, 103400. [Google Scholar] [CrossRef]
  2. Rahim, M. The current trends and challenging situations of fire incident statistics. Malays. J. Forensic Sci. 2015, 6, 63–78. [Google Scholar]
  3. Bryant, S.; Preston, I. Focus on Trends in Fires and Fire-Related Fatalities; Home Office: London, UK, 2017. [Google Scholar]
  4. Chuvieco, E.; Aguado, I.; Salas, J.; García, M.; Yebra, M.; Oliva, P. Satellite remote sensing contributions to wildland fire science and management. Curr. For. Rep. 2020, 6, 81–96. [Google Scholar] [CrossRef]
  5. McFayden, C.B.; Woolford, D.G.; Stacey, A.; Boychuk, D.; Johnston, J.M.; Wheatley, M.J.; Martell, D.L. Risk assessment for wildland fire aerial detection patrol route planning in Ontario, Canada. Int. J. Wildland Fire 2019, 29, 28–41. [Google Scholar] [CrossRef]
  6. Eskandari, S.; Pourghasemi, H.R.; Tiefenbacher, J.P. Relations of land cover, topography, and climate to fire occurrence in natural regions of Iran: Applying new data mining techniques for modeling and mapping fire danger. For. Ecol. Manag. 2020, 473, 118338. [Google Scholar] [CrossRef]
  7. Singh, P.K.; Sharma, A. An insight to forest fire detection techniques using wireless sensor networks. In Proceedings of the 2017 IEEE 4th International Conference on Signal Processing, Computing and Control (ISPCC), Solan, India, 21–23 September 2017; pp. 647–653. [Google Scholar]
  8. Venkatesh, K.; Preethi, K.; Ramesh, H. Evaluating the effects of forest fire on water balance using fire susceptibility maps. Ecol. Indic. 2020, 110, 105856. [Google Scholar] [CrossRef]
  9. Ma, W.; Feng, Z.; Cheng, Z.; Chen, S.; Wang, F. Identifying forest fire driving factors and related impacts in china using random forest algorithm. Forests 2020, 11, 507. [Google Scholar] [CrossRef]
  10. Chen, T.; Xia, J.; Zou, L.; Hong, S. Quantifying the influences of natural factors and human activities on NDVI changes in the Hanjiang river basin, China. Remote Sens. 2020, 12, 3780. [Google Scholar] [CrossRef]
  11. Artés, T.; Oom, D.; De Rigo, D.; Durrant, T.H.; Maianti, P.; Libertà, G.; San-Miguel-Ayanz, J. A global wildfire dataset for the analysis of fire regimes and fire behaviour. Sci. Data 2019, 6, 1–11. [Google Scholar] [CrossRef]
  12. Weixin. Analytic Network Process. Available online: https://blog.csdn.net/weixin_34116110/article/details/85959973 (accessed on 1 June 2022).
  13. Xueqian, H. The Advantages and Disadvantages of Analytic Hierarchy Process and Fuzzy Comprehensive Evaluation Method. Available online: https://zhidao.baidu.com/question/85314097.html (accessed on 1 June 2022).
  14. Goleiji, E.; Hosseini, S.M.; Khorasani, N.; Monavari, S.M. Forest fire risk assessment-an integrated approach based on multicriteria evaluation. Environ. Monit. Assess. 2017, 189, 1–9. [Google Scholar] [CrossRef]
  15. Abedi Gheshlaghi, H.; Feizizadeh, B.; Blaschke, T. GIS-based forest fire risk mapping using the analytical network process and fuzzy logic. J. Environ. Plan. Manag. 2020, 63, 481–499. [Google Scholar] [CrossRef]
  16. Ljubomir, G.; Pamučar, D.; Drobnjak, S.; Pourghasemi, H.R. Modeling the spatial variability of forest fire susceptibility using geographical information systems and the analytical hierarchy process. In Spatial Modeling in GIS and R for Earth and Environmental Sciences; Elsevier: Amsterdam, The Netherlands, 2019; pp. 337–369. [Google Scholar]
  17. Zhao, P.; Zhang, F.; Lin, H.; Xu, S. GIS-Based Forest Fire Risk Model: A Case Study in Laoshan National Forest Park, Nanjing. Remote Sens. 2021, 13, 3704. [Google Scholar] [CrossRef]
  18. Sayad, Y.O.; Mousannif, H.; Al Moatassime, H. Predictive modeling of wildfires: A new dataset and machine learning approach. Fire Saf. J. 2019, 104, 130–146. [Google Scholar] [CrossRef]
  19. Lattimer, B.; Hodges, J.; Lattimer, A. Using machine learning in physics-based simulation of fire. Fire Saf. J. 2020, 114, 102991. [Google Scholar] [CrossRef]
  20. Li, Y.; Feng, Z.; Chen, S.; Zhao, Z.; Wang, F. Application of the artificial neural network and support vector machines in forest fire prediction in the guangxi autonomous region, China. Discret. Dyn. Nat. Soc. 2020, 2020, 5612650. [Google Scholar] [CrossRef]
  21. Al-Kahlout, M.M.; Ghaly, A.M.A.; Mudawah, D.Z.; Abu-Naser, S.S. Neural network approach to predict forest fires using meteorological data. Int. J. Acad. Eng. Res. (IJAER) 2020, 4, 68–72. [Google Scholar]
  22. Tehrany, M.S.; Jones, S.; Shabani, F.; Martínez-Álvarez, F.; Tien Bui, D. A novel ensemble modeling approach for the spatial prediction of tropical forest fire susceptibility using LogitBoost machine learning classifier and multi-source geospatial data. Theor. Appl. Climatol. 2019, 137, 637–653. [Google Scholar] [CrossRef]
  23. Zhang, G.; Wang, M.; Liu, K. Forest fire susceptibility modeling using a convolutional neural network for Yunnan province of China. Int. J. Disaster Risk Sci. 2019, 10, 386–403. [Google Scholar] [CrossRef]
  24. Jaafari, A.; Zenner, E.K.; Panahi, M.; Shahabi, H. Hybrid artificial intelligence models based on a neuro-fuzzy system and metaheuristic optimization algorithms for spatial prediction of wildfire probability. Agric. For. Meteorol. 2019, 266, 198–207. [Google Scholar] [CrossRef]
  25. Cao, Y.; Wang, M.; Liu, K. Wildfire susceptibility assessment in Southern China: A comparison of multiple methods. Int. J. Disaster Risk Sci. 2017, 8, 164–181. [Google Scholar] [CrossRef]
  26. Milanović, S.; Marković, N.; Pamučar, D.; Gigović, L.; Kostić, P.; Milanović, S.D. Forest fire probability mapping in eastern Serbia: Logistic regression versus random forest method. Forests 2020, 12, 5. [Google Scholar] [CrossRef]
  27. Su, T.; Zhang, S. Object-based crop classification in Hetao plain using random forest. Earth Sci. Inf. 2021, 14, 119–131. [Google Scholar] [CrossRef]
  28. Nusinovici, S.; Tham, Y.C.; Yan, M.Y.C.; Ting, D.S.W.; Li, J.; Sabanayagam, C.; Wong, T.Y.; Cheng, C.Y. Logistic regression was as good as machine learning for predicting major chronic diseases. J. Clin. Epidemiol. 2020, 122, 56–69. [Google Scholar] [CrossRef] [PubMed]
  29. Zhou, W.F.; Wang, J.G.; Deng, L.F.; Yao, Y.; Liu, J.L. Terminal Temperature Prediction of Molten Steel in VD Furnace based on XGBoost and LightGBM Algorithms. In Proceedings of the 2021 IEEE 40th Chinese Control Conference (CCC), Shanghai, China, 26–28 July 2021; pp. 6289–6294. [Google Scholar]
  30. Sun, X.; Liu, M.; Sima, Z. A novel cryptocurrency price trend forecasting model based on LightGBM. Financ. Res. Lett. 2020, 32, 101084. [Google Scholar] [CrossRef]
  31. Yathish, H.; Athira, K.; Preethi, K.; Pruthviraj, U.; Shetty, A. A comparative analysis of forest fire risk zone mapping methods with expert knowledge. J. Indian Soc. Remote Sens. 2019, 47, 2047–2060. [Google Scholar] [CrossRef]
  32. Huang, Z.; Huang, X.; Fan, J.; Eichhorn, M.P.; An, F.; Chen, B.; Cao, L.; Zhu, Z.; Yun, T. Retrieval of aerodynamic parameters in rubber tree forests based on the computer simulation technique and terrestrial laser scanning data. Remote Sens. 2020, 12, 1318. [Google Scholar] [CrossRef]
  33. Sari, F. Forest fire susceptibility mapping via multi-criteria decision analysis techniques for Mugla, Turkey: A comparative analysis of VIKOR and TOPSIS. For. Ecol. Manag. 2021, 480, 118644. [Google Scholar] [CrossRef]
  34. Suryabhagavan, K.; Alemu, M.; Balakrishnan, M. GIS-based multi-criteria decision analysis for forest fire susceptibility mapping: A case study in Harenna forest, southwestern Ethiopia. Trop. Ecol. 2016, 57, 33–43. [Google Scholar]
  35. Gollner, M.J.; Miller, C.H.; Tang, W.; Singh, A.V. The effect of flow and geometry on concurrent flame spread. Fire Saf. J. 2017, 91, 68–78. [Google Scholar] [CrossRef]
  36. Morandini, F.; Silvani, X.; Dupuy, J.L.; Susset, A. Fire spread across a sloping fuel bed: Flame dynamics and heat transfers. Combust. Flame 2018, 190, 158–170. [Google Scholar] [CrossRef]
  37. Mattivi, P.; Franci, F.; Lambertini, A.; Bitelli, G. TWI computation: A comparison of different open source GISs. Open Geospat. Data, Softw. Stand. 2019, 4, 1–12. [Google Scholar] [CrossRef]
  38. Riihimäki, H.; Kemppinen, J.; Kopeckỳ, M.; Luoto, M. Topographic Wetness Index as a Proxy for Soil Moisture: The Importance of Flow-Routing Algorithm and Grid Resolution. Water Resour. Res. 2021, 57, e2021WR029871. [Google Scholar] [CrossRef]
  39. Guo, F.; Wang, G.; Su, Z.; Liang, H.; Wang, W.; Lin, F.; Liu, A. What drives forest fire in Fujian, China? Evidence from logistic regression and Random Forests. Int. J. Wildland Fire 2016, 25, 505–519. [Google Scholar] [CrossRef]
  40. Fang, L.; Yang, J.; Zu, J.; Li, G.; Zhang, J. Quantifying influences and relative importance of fire weather, topography, and vegetation on fire size and fire severity in a Chinese boreal forest landscape. For. Ecol. Manag. 2015, 356, 2–12. [Google Scholar] [CrossRef]
  41. Adámek, M.; Jankovská, Z.; Hadincová, V.; Kula, E.; Wild, J. Drivers of forest fire occurrence in the cultural landscape of Central Europe. Landsc. Ecol. 2018, 33, 2031–2045. [Google Scholar] [CrossRef]
  42. Hu, M.; Xia, B. A significant increase in the normalized difference vegetation index during the rapid economic development in the Pearl River Delta of China. Land Degrad. Dev. 2019, 30, 359–370. [Google Scholar] [CrossRef]
  43. Barbero, R.; Abatzoglou, J.T.; Larkin, N.K.; Kolden, C.A.; Stocks, B. Climate change presents increased potential for very large fires in the contiguous United States. Int. J. Wildland Fire 2015, 24, 892–899. [Google Scholar] [CrossRef]
  44. Ahmed, M.R.; Hassan, Q.K.; Abdollahi, M.; Gupta, A. Processing of near real time land surface temperature and its application in forecasting forest fire danger conditions. Sensors 2020, 20, 984. [Google Scholar] [CrossRef]
  45. Sevinc, V.; Kucuk, O.; Goltas, M. A Bayesian network model for prediction and analysis of possible forest fire causes. For. Ecol. Manag. 2020, 457, 117723. [Google Scholar] [CrossRef]
  46. Yoon, D.; Kim, Y.J.; Lee, W.K.; Choi, B.R.; Oh, S.M.; Lee, Y.S.; Kim, J.K.; Lee, D.Y. Metabolic changes in serum metabolome of beagle dogs fed black ginseng. Metabolites 2020, 10, 517. [Google Scholar] [CrossRef]
  47. Banerjee, P. Maximum entropy-based forest fire likelihood mapping: Analysing the trends, distribution, and drivers of forest fires in Sikkim Himalaya. Scand. J. For. Res. 2021, 36, 275–288. [Google Scholar] [CrossRef]
  48. Ehsani, M.R.; Arevalo, J.; Risanto, C.B.; Javadian, M.; Devine, C.J.; Arabzadeh, A.; Venegas-Quiñones, H.L.; Dell’Oro, A.P.; Behrangi, A. 2019–2020 Australia fire and its relationship to hydroclimatological and vegetation variabilities. Water 2020, 12, 3067. [Google Scholar] [CrossRef]
  49. Mohajane, M.; Costache, R.; Karimi, F.; Pham, Q.B.; Essahlaoui, A.; Nguyen, H.; Laneve, G.; Oudija, F. Application of remote sensing and machine learning algorithms for forest fire mapping in a Mediterranean area. Ecol. Indic. 2021, 129, 107869. [Google Scholar] [CrossRef]
  50. Zhang, F.; Zhao, P.; Xu, S.; Wu, Y.; Yang, X.; Zhang, Y. Integrating multiple factors to optimize watchtower deployment for wildfire detection. Sci. Total Environ. 2020, 737, 139561. [Google Scholar] [CrossRef] [PubMed]
  51. Ke, G.; Meng, Q.; Finley, T.; Wang, T.; Chen, W.; Ma, W.; Ye, Q.; Liu, T.Y. Lightgbm: A highly efficient gradient boosting decision tree. In Proceedings of the Advances in Neural Information Processing Systems 30 (NIPS 2017), Long Beach, CA, USA, 4–9 December 2017; Volume 30. [Google Scholar]
  52. Dohrenwend, J.C. Systematic valley asymmetry in the central California Coast Ranges. Geol. Soc. Am. Bull. 1978, 89, 891–900. [Google Scholar] [CrossRef]
  53. Deák, B.; Kovács, B.; Rádai, Z.; Apostolova, I.; Kelemen, A.; Kiss, R.; Lukács, K.; Palpurina, S.; Sopotlieva, D.; Báthori, F.; et al. Linking environmental heterogeneity and plant diversity: The ecological role of small natural features in homogeneous landscapes. Sci. Tota. Environ. 2021, 763, 144199. [Google Scholar] [CrossRef]
  54. Dang, V.H.; Dieu, T.B.; Tran, X.L.; Hoang, N.D. Enhancing the accuracy of rainfall-induced landslide prediction along mountain roads with a GIS-based random forest classifier. Bull. Eng. Geol. Environ. 2019, 78, 2835–2849. [Google Scholar] [CrossRef]
  55. Song, H.Y.; Park, S. An analysis of correlation between personality and visiting place using Spearman’s rank correlation coefficient. Ksii Trans. Internet Inf. Syst. (TIIS) 2020, 14, 1951–1966. [Google Scholar]
  56. Sun, C.; Huang, C.; Zhang, H.; Chen, B.; An, F.; Wang, L.; Yun, T. Individual Tree Crown Segmentation and Crown Width Extraction From a Heightmap Derived From Aerial Laser Scanning Data Using a Deep Learning Framework. Front. Plant Sci. 2022, 13, 914974. [Google Scholar] [CrossRef]
  57. Ghorbanzadeh, O.; Blaschke, T.; Gholamnia, K.; Aryal, J. Forest fire susceptibility and risk mapping using social/infrastructural vulnerability and environmental variables. Fire 2019, 2, 50. [Google Scholar] [CrossRef]
  58. Ge, X.; Sun, J.; Lu, B.; Chen, Q.; Xun, W.; Jin, Y. Classification of oolong tea varieties based on hyperspectral imaging technology and BOSS-LightGBM model. J. Food Process. Eng. 2019, 42, e13289. [Google Scholar] [CrossRef]
  59. Rufo, D.D.; Debelee, T.G.; Ibenthal, A.; Negera, W.G. Diagnosis of diabetes mellitus using gradient boosting machine (LightGBM). Diagnostics 2021, 11, 1714. [Google Scholar] [CrossRef]
  60. Jin, D.; Lu, Y.; Qin, J.; Cheng, Z.; Mao, Z. SwiftIDS: Real-time intrusion detection system based on LightGBM and parallel intrusion detection mechanism. Comput. Secur. 2020, 97, 101984. [Google Scholar] [CrossRef]
  61. Wu, Y.; Kang, J.; Mu, J. Assessment and simulation of evacuation in large railway stations. In Building Simulation; Tsinghua University Press: Beijing, China, 2021; Volume 14, pp. 1553–1566. [Google Scholar]
  62. Efthimiou, N.; Psomiadis, E.; Panagos, P. Fire severity and soil erosion susceptibility mapping using multi-temporal Earth Observation data: The case of Mati fatal wildfire in Eastern Attica, Greece. Catena 2020, 187, 104320. [Google Scholar] [CrossRef]
  63. Tshering, K.; Thinley, P.; Shafapour Tehrany, M.; Thinley, U.; Shabani, F. A comparison of the qualitative analytic hierarchy process and the quantitative frequency ratio techniques in predicting forest fire-prone areas in Bhutan using GIS. Forecasting 2020, 2, 36–58. [Google Scholar] [CrossRef]
  64. Chen, J.; Xu, C.; Lin, S.; Wu, Z.; Qiu, R.; Hu, X. Is There Spatial Dependence or Spatial Heterogeneity in the Distribution of Vegetation Greening and Browning in Southeastern China? Forests 2022, 13, 840. [Google Scholar] [CrossRef]
  65. Feng, S.; Lu, H.; Yao, T.; Xue, Y.; Yin, C.; Tang, M. Spatial characteristics of microplastics in the high-altitude area on the Tibetan Plateau. J. Hazard. Mater. 2021, 417, 126034. [Google Scholar] [CrossRef]
  66. González, J.R.; Pukkala, T. Characterization of forest fires in Catalonia (north-east Spain). Eur. J. For. Res. 2007, 126, 421–429. [Google Scholar] [CrossRef]
  67. Asori, M.; Emmanuel, D.; Dumedah, G. Wildfire hazard and Risk modelling in the Northern regions of Ghana using GIS-based Multi-Criteria Decision Making Analysis. J. Environ. Earth Sci. 2020, 10. [Google Scholar] [CrossRef]
  68. Pan, J.; Wang, W.; Li, J. Building probabilistic models of fire occurrence and fire risk zoning using logistic regression in Shanxi Province, China. Nat. Hazards 2016, 81, 1879–1899. [Google Scholar] [CrossRef]
  69. Babu, K.V.S.; Roy, A.; Prasad, P.R. Forest fire risk modeling in Uttarakhand Himalaya using TERRA satellite datasets. Eur. J. Remote Sens. 2016, 49, 381–395. [Google Scholar] [CrossRef]
  70. Fang, K.; Yao, Q.; Guo, Z.; Zheng, B.; Du, J.; Qi, F.; Yan, P.; Li, J.; Ou, T.; Liu, J.; et al. ENSO modulates wildfire activity in China. Nat. Commun. 2021, 12, 1–8. [Google Scholar] [CrossRef] [PubMed]
  71. Theeuwes, N.E.; Solcerova, A.; Steeneveld, G.J. Modeling the influence of open water surfaces on the summertime temperature and thermal comfort in the city. J. Geophys. Res. Atmos. 2013, 118, 8881–8896. [Google Scholar] [CrossRef]
  72. Littell, J.S.; Peterson, D.L.; Riley, K.L.; Liu, Y.; Luce, C.H. A review of the relationships between drought and forest fire in the United States. Glob. Chang. Biol. 2016, 22, 2353–2369. [Google Scholar] [CrossRef]
  73. Perry, M.C.; Vanvyve, E.; Betts, R.A.; Palin, E.J. Past and future trends in fire weather for the UK. Nat. Hazards Earth Syst. Sci. 2022, 22, 559–575. [Google Scholar] [CrossRef]
  74. Williams, A.P.; Abatzoglou, J.T.; Gershunov, A.; Guzman-Morales, J.; Bishop, D.A.; Balch, J.K.; Lettenmaier, D.P. Observed impacts of anthropogenic climate change on wildfire in California. Earth’s Future 2019, 7, 892–910. [Google Scholar] [CrossRef]
  75. Al-Fugara, A.; Mabdeh, A.N.; Ahmadlou, M.; Pourghasemi, H.R.; Al-Adamat, R.; Pradhan, B.; Al-Shabeeb, A.R. Wildland fire susceptibility mapping using support vector regression and adaptive neuro-fuzzy inference system-based whale optimization algorithm and simulated annealing. ISPRS Int. J. Geo-Inf. 2021, 10, 382. [Google Scholar] [CrossRef]
  76. Wooster, M.J.; Roberts, G.J.; Giglio, L.; Roy, D.P.; Freeborn, P.H.; Boschetti, L.; Justice, C.; Ichoku, C.; Schroeder, W.; Davies, D.; et al. Satellite remote sensing of active fires: History and current status, applications and future requirements. Remote Sens. Environ. 2021, 267, 112694. [Google Scholar] [CrossRef]
  77. Chen, D.; Pereira, J.M.; Masiero, A.; Pirotti, F. Mapping fire regimes in China using MODIS active fire and burned area data. Appl. Geogr. 2017, 85, 14–26. [Google Scholar] [CrossRef]
  78. Riley, K.L.; Loehman, R.A. Mid-21st-century climate changes increase predicted fire occurrence and fire season length, Northern Rocky Mountains, United States. Ecosphere 2016, 7, e01543. [Google Scholar] [CrossRef]
  79. Venevsky, S.; Le Page, Y.; Pereira, J.; Wu, C. Analysis fire patterns and drivers with a global SEVER-FIRE v1. 0 model incorporated into dynamic global vegetation model and satellite and on-ground observations. Geosci. Model Dev. 2019, 12, 89–110. [Google Scholar] [CrossRef]
  80. Michael, Y.; Helman, D.; Glickman, O.; Gabay, D.; Brenner, S.; Lensky, I.M. Forecasting fire risk with machine learning and dynamic information derived from satellite vegetation index time-series. Sci. Total Environ. 2021, 764, 142844. [Google Scholar] [CrossRef] [PubMed]
  81. Tedim, F.; Xanthopoulos, G.; Leone, V. Forest fires in Europe: Facts and challenges. In Wildfire Hazards, Risks Furthermore, Disasters; Elsevier: Amsterdam, The Netherlands, 2015; pp. 77–99. [Google Scholar]
  82. Nunes, L.J.; Raposo, M.A.; Pinto Gomes, C.J. A historical perspective of landscape and human population dynamics in Guimarães (Northern Portugal): Possible implications of rural fire risk in a changing environment. Fire 2021, 4, 49. [Google Scholar] [CrossRef]
  83. Hasan, S.S.; Zhang, Y.; Chu, X.; Teng, Y. The role of big data in China’s sustainable forest management. For. Econ. Rev. 2019, 1, 96–105. [Google Scholar] [CrossRef]
  84. Bui, D.T.; Van Le, H.; Hoang, N.D. GIS-based spatial prediction of tropical forest fire danger using a new hybrid machine learning method. Ecol. Inf. 2018, 48, 104–116. [Google Scholar]
  85. Pham, B.T.; Jaafari, A.; Avand, M.; Al-Ansari, N.; Dinh Du, T.; Yen, H.P.H.; Phong, T.V.; Nguyen, D.H.; Le, H.V.; Mafi-Gholami, D.; et al. Performance evaluation of machine learning methods for forest fire modeling and prediction. Symmetry 2020, 12, 1022. [Google Scholar] [CrossRef]
  86. Pourghasemi, H.R.; Gayen, A.; Lasaponara, R.; Tiefenbacher, J.P. Application of learning vector quantization and different machine learning techniques to assessing forest fire influence factors and spatial modelling. Environ. Res. 2020, 184, 109321. [Google Scholar] [CrossRef]
  87. Kalantar, B.; Ueda, N.; Idrees, M.O.; Janizadeh, S.; Ahmadi, K.; Shabani, F. Forest fire susceptibility prediction based on machine learning models with resampling algorithms on remote sensing data. Remote Sens. 2020, 12, 3682. [Google Scholar] [CrossRef]
  88. Kadir, E.A.; Irie, H.; Rosa, S.L. Modeling of wireless sensor networks for detection land and forest fire hotspot. In Proceedings of the 2019 International Conference on Electronics, Information, and Communication (ICEIC), Auckland, New Zealand, 22–25 January 2019; pp. 1–5. [Google Scholar]
  89. Xue, X.; Jin, S.; An, F.; Zhang, H.; Fan, J.; Eichhorn, M.P.; Jin, C.; Chen, B.; Jiang, L.; Yun, T. Shortwave Radiation Calculation for Forest Plots Using Airborne LiDAR Data and Computer Graphics. Plant Phenomics 2022, 2022, 9856739. [Google Scholar] [CrossRef]
Figure 1. The general workflow shows the interaction from data input to the produced fire susceptibility map.
Remotesensing 14 04362 g001
Figure 2. The study area.
Remotesensing 14 04362 g002
Figure 3. The spatial distribution of fire-influencing factors: (a) slope; (b) aspect; (c) altitude; (d) TWI; (e) NDVI; (f) TMP; (g) distance to roads; and (h) distance to populated areas.
Remotesensing 14 04362 g003aRemotesensing 14 04362 g003b
Figure 4. LightGBM model diagram.
Remotesensing 14 04362 g004
Figure 5. Scatter plot of forest fire influencing factors.
Remotesensing 14 04362 g005
Figure 6. The importance of forest fire-influencing factors.
Remotesensing 14 04362 g006
Figure 7. The ROC curves of the three models.
Remotesensing 14 04362 g007
Figure 8. Forest fire susceptibility maps. (a) LR; (b) RF; and (c) LightGBM.
Remotesensing 14 04362 g008
Table 1. Classification of the forest fire influencing factors.
ClustersFactorsDescriptionData Range
MinMax
Topographic factorsSlope(°)Slope = arctan(elevation difference/horizontal distance).0.0036.12
Aspect(°)The direction of the projection of slope normals on the horizontal.0.00360.00
TWITWI is related to catchment areas and surrounding slope gradient.−8.055.30
Altitude(m)The vertical distance above sea level at a location on the ground.4.50414.70
Vegetation factorsNDVINDVI = (NIR − R)/(NIR + R).−0.090.55
Climatic factorsTMP(°C)Average temperature for the time period.21.1647.18
Human activity factorsDTR(m)The distance to the nearest roads.0.003482.33
DTP(m)The distance to the nearest populated areas.400.005000.00
Table 2. The relationship between the independent variables and dependent variables.
FactorsSpearman’s Rank
Correlation Coefficient
p Values
Altitude0.331<0.01
Aspect0.044<0.01
TWI0.195<0.01
TMP0.486<0.01
Slope0.298<0.01
NDVI0.370<0.01
DTR0.045<0.01
DTP0.008<0.01
Table 3. Performance of the three models.
StageEvaluation MetricsRFLRLightGBM
TrainingF1-score0.760.680.85
ACC(%)82.6184.8188.83
ValidationF1-score0.630.610.78
ACC(%)75.1276.5281.81
Publisher’s Note: MDPI stays neutral with regard to jurisdictional claims in published maps and institutional affiliations.

