Article

Precipitation over the U.S. Coastal Land/Water Using Gauge-Corrected Multi-Radar/Multi-Sensor System and Three Satellite Products

1
Department of Hydrology and Atmospheric Sciences, University of Arizona, Tucson, AZ 85721, USA
2
Departamento de Meteorología, Universidad de Valparaíso, Valparaíso 2360173, Chile
*
Author to whom correspondence should be addressed.
Remote Sens. 2022, 14(18), 4557; https://doi.org/10.3390/rs14184557
Submission received: 13 August 2022 / Revised: 5 September 2022 / Accepted: 8 September 2022 / Published: 12 September 2022
(This article belongs to the Section Atmospheric Remote Sensing)

Abstract

:
The weather and climate over the coastal regions have received increasing attention because of substantial population growth, the rising sea level, and extreme weather. Satellite remote sensing provides global precipitation estimates (including coastal land/ocean). While these datasets have been extensively evaluated over land, they have rarely been assessed over coastal ocean. As precipitation radars cover both coastal land and ocean, we used the Multi-Radar/Multi-Sensor System (MRMS) gauge-corrected precipitation product from 2018 to 2020 to evaluate three widely used satellite-based precipitation products over the U.S. coastal land versus the ocean (and the water over the Great Lakes). These products included the Integrated Multi-satellite Retrievals for GPM (IMERG), Precipitation Estimation from Remotely Sensed Information using Artificial Neural Networks (PERSIANN), and Climate Prediction Center Morphing technique (CMORPH). The MRMS data showed a precipitation climatology difference between the coastal land and the ocean that was higher in the winter and lower in the summer and autumn. IMERG and CMORPH performed best over land and water, respectively, while PERSIANN was the most consistent in its performance over land versus water. Heavy precipitation was overestimated by the three products, with larger overestimates over water than over land. These results were not affected by the MRMS uncertainties due to the gauge correction or by the use of different versions.

1. Introduction

Precipitation is critical to the world’s socio-cultural and financial well-being. Understanding precipitation contributes to a better knowledge of climate and hydrological systems, helps society become more weather-resilient, and improves water management by offering early warning systems for weather extremes [1,2,3]. Understanding coastal precipitation is especially critical, as precipitation affects the coastal region in numerous ways—it can disrupt coastal ecosystems (especially wetlands), delay transportation, cause property damage, and jeopardize human safety [4,5]. Moreover, the population is rapidly increasing in coastal regions [6,7], raising the socio-economic importance of coastal precipitation.
Although precipitation climatology has been extensively studied over land due to the spatial coverage of rain gauges and other products, precipitation over coastal waters in the United States and worldwide has received much less attention [8,9,10]. Among all available precipitation products, gauge-corrected ground radar products are perhaps the most reliable due to their high spatial and temporal resolution, active microwave beams, and bias correction by gauges. Additionally, ground radars cover coastal waters (including the Great Lakes) and can thus be used to understand coastal precipitation over both land and water.
In addition to ground radars, satellite precipitation products have become a promising source of global precipitation measurements. These satellite retrievals come from microwave (MW), infrared (IR), and/or space-borne radar measurements. While IR measurements from geostationary satellites offer a high temporal resolution, they are prone to errors since precipitation events are inferred indirectly from cloud-top temperatures [11]. MW radiances from low-Earth orbits are better related to precipitation over ocean, but their precipitation retrieval over land is more challenging due to the land’s emissivity uncertainty and also their limited temporal coverage [11]. Finally, space-borne radars such as the one carried by the Global Precipitation Measurement (GPM)’s core are more accurate than retrievals from MW and IR, but their spatial coverage is much smaller [12]. In general, retrievals from satellites are less accurate than ground-based measurements from radars or rain gauges since the latter option is more direct [13].
Multiple organizations have released remote sensing precipitation products that attempt to strike a balance between the accuracy of MW sensors and the temporal coverage of IR measurements by combining both sources and sometimes incorporating radar data as well [13]. Many of these datasets are also bias-corrected using ground-based observations from sources like rain gauges. Because of their wide use, this study focused on the Integrated Multi-satellite Retrievals for GPM (IMERG) [14], Precipitation Estimation from Remotely Sensed Information using Artificial Neural Networks (PERSIANN) [15], and Climate Prediction Center Morphing technique (CMORPH) [16]. Given the relatively large errors of satellite precipitation retrievals, benchmarking these products to ground-based measurements is essential for identifying sources of error for further improvement. Benchmarking has been extensively performed over land due to the relative abundance of surface observations, compared with those over the ocean [17,18,19].
However, ground-based precipitation measurements over the ocean (including the coastal ocean) are scarce, with only a few relevant studies in the past. For instance, the IMERG products have been evaluated over the ocean using moored, buoy-mounted gauge observations; a shipboard disdrometer and radar measurements; gauge measurements over low-lying atolls; and radar measurements over an atoll ([20] and references therein). More relevant to this study, Carr et al. [21] used the gauge-corrected Multi-Radar/Multi-Sensor System (MRMS) data for seven months (March–September 2011) to address the retrieval uncertainty of satellite microwave precipitation in the southern U.S. (including the coastal ocean), and Derin et al. [22] used MRMS data for one year (2015) to evaluate and better understand the retrieval processes of IMERG over the U.S.’s coastal land and ocean.
Complementary to these studies, our goal was to use three years of MRMS data to understand the differences in precipitation over the contiguous U.S. (CONUS) coastal land and water (including the coastlines of the Great Lakes), and to use this dataset to evaluate three satellite precipitation products (IMERG, CMORPH, and PERSIANN). The comparatively longer period of data than that of previous studies enabled us to evaluate the three satellite products’ performance in estimating extreme precipitation. The impact of MRMS data uncertainty on the satellite products’ evaluation was also briefly addressed.

2. Materials and Methods

2.1. Satellite Precipitation Products

IMERG is a gridded GPM product that integrates data from various satellites and ground observations [14,23]. Precipitation estimates are provided every half hour in 0.1° grids globally between 60°N and 60°S. IMERG has three runs—early, late, and final—to handle varying data source latency and accuracy requirements [24]. The final run (hereafter IMERG-F) is intended for research applications as it is corrected in Version 6 using climatological data from gauge analyses produced by the Global Precipitation Climatology Centre (GPCC) [25].
The PERSIANN–CCS–CDR (cloud classification system–climate data record) [15] offers precipitation estimates at 0.04° spatial and 3-hourly temporal resolutions from 1983 to the present across the global domain of 60°S to 60°N. It is based on the gridded satellite IR product of the National Oceanic and Atmospheric Administration (NOAA) Climate Prediction Center (CPC-4 km) and the Global Precipitation Climatology Project (GPCP v2.3) [26]. It is generated from precipitation outputs from the PERSIANN–CCS model, aggregated to a monthly resolution, and then corrected with monthly 2.5° GPCP v2.3 precipitation. This product will be referred to as PERSIANN hereafter for simplicity.
CMORPH precipitation estimates use passive MW measurements by propagating the MW measurements using motion vectors from IR imagery at half-hour intervals [27]. The spatial pattern and intensity of the precipitation features are determined between MW sensor scans using time-weighted linear interpolation. CMORPH is reprocessed at 0.25° grids between 60°S and 60°N [16,28].
Table 1 provides the basic information of the satellite precipitation products evaluated in this study. All three satellite precipitation products (IMERG-F, PERSIANN, and CMORPH) use GPCP in their bias correction. IMERG-F uses GPCP to correct precipitation over the ocean to achieve a reasonable bias profile [23]. In addition to GPCP, IMERG-F also uses GPCC for bias correction over land. The GPCC monthly gauges’ analysis is corrected to reduce undercatch, and the monthly IMERG multi-satellite estimate is adjusted to the gauges’ large-scale mean. To access the gauge correction’s impact on precipitation over coastal land vs. the ocean in IMERG-F, we also included IMERG-Late (hereafter referred to as IMERG-L). Unlike IMERG-F, IMERG-L does not include gauge correction. PERSIANN uses GPCP for bias correction over both land and ocean. The bias adjustment is applied to each pixel by multiplying a weight value based on the difference between GPCP and the PERSIANN–CCS–CDR estimate. Furthermore, a threshold of 0.1 mm/hr is used to eliminate the falsely assigned light precipitation values. CMORPH is bias-corrected using daily CPC gauges over land and the GPCP merged analysis over ocean. For land-based bias correction, CMORPH compares the probability distribution of the raw data to that of the daily CPC gauge analysis and calculates the ratio between the two. Over the ocean, the raw CMORPH is adjusted using the GPCP’s monthly merged analysis and then downscaled to 0.25°, assuming the adjustment coefficient remains constant within a grid [28]. Note that all these products include some bias adjustment from GPCP, which is itself derived from satellite observations over ocean. The GPCP product was not included for evaluation here due to its coarser resolution (with the most recent version in 0.5° grids).

2.2. Reference Data

The gauge-corrected MRMS is an hourly 0.01° gridded precipitation product produced by integrating Next Generation Weather Radar products, additional sensors, and ground gauges [29]. MRMS is an appropriate reference dataset because of its high spatial and temporal resolution, gauge correction and modeling, and spatial coverage of the CONUS coastal ocean (including the Great Lakes region) [10]. The hourly MRMS values were averaged to daily values from January 2018 to December 2020, which were then re-gridded by taking the average value of all grids within each coarser grid of the satellite products in this study.
The MRMS accuracy was passed through a Radar Quality Index (RQI) threshold mask [30]. RQI is a measurement of radar beams’ quality and ranges from 0 to 100, and the 2-minute RQI values were averaged into daily values. It decreases with more uncertainty-blockage due to the terrain, beam height, and width. We filtered the MRMS estimates with RQI values higher than 80 in this study in three different ways:
(1)
For the three-year precipitation climatology, the monthly mean RQI values were used, since selecting grids with daily RQI greater than 80 would cause the data to become less continuous.
(2)
For extreme precipitation, the 3-year mean RQI values greater than 80 were used to filter the data to select the top percentiles of precipitation data.
(3)
For the case study, pixels with a daily mean RQI higher than 80 were used because of the short period (4 days).

2.3. Methods

This study compared land/ocean pixels within 110 km of the CONUS coastlines (including the Great Lakes) because it represents a good coverage of the MRMS precipitation after using the RQI as a mask. Figure 1 shows the study region of this work. The comparison between the satellite products and MRMS is quantified via three statistical metrics: the coefficient of determination (R2), mean bias (MB), and mean absolute error (MAE). To account for R2 spatial autocorrelation, a field significance test for R2 was computed. If the sample (satellite product) size was n, all estimates from a satellite product were shuffled first, and then n maps were randomly selected to compute an R2 value with MRMS. The R2 value was significant when it exceeded the null hypothesis’s critical value (α = 0.05, one-sided). To determine the significance of the difference between the mean values over land and water, we utilized the Welch’s t-test, which considers the fact that variances are different between land and water.
To account for extreme precipitation, we followed the R99p metric, defined as the annual sum of precipitation on wet days (those exceeding the 99th percentile for each pixel) by the World Meteorological Organization [31]. We first selected the days in each year that exceeded the 99th percentile and then computed the sum of precipitation on those days.

3. Results

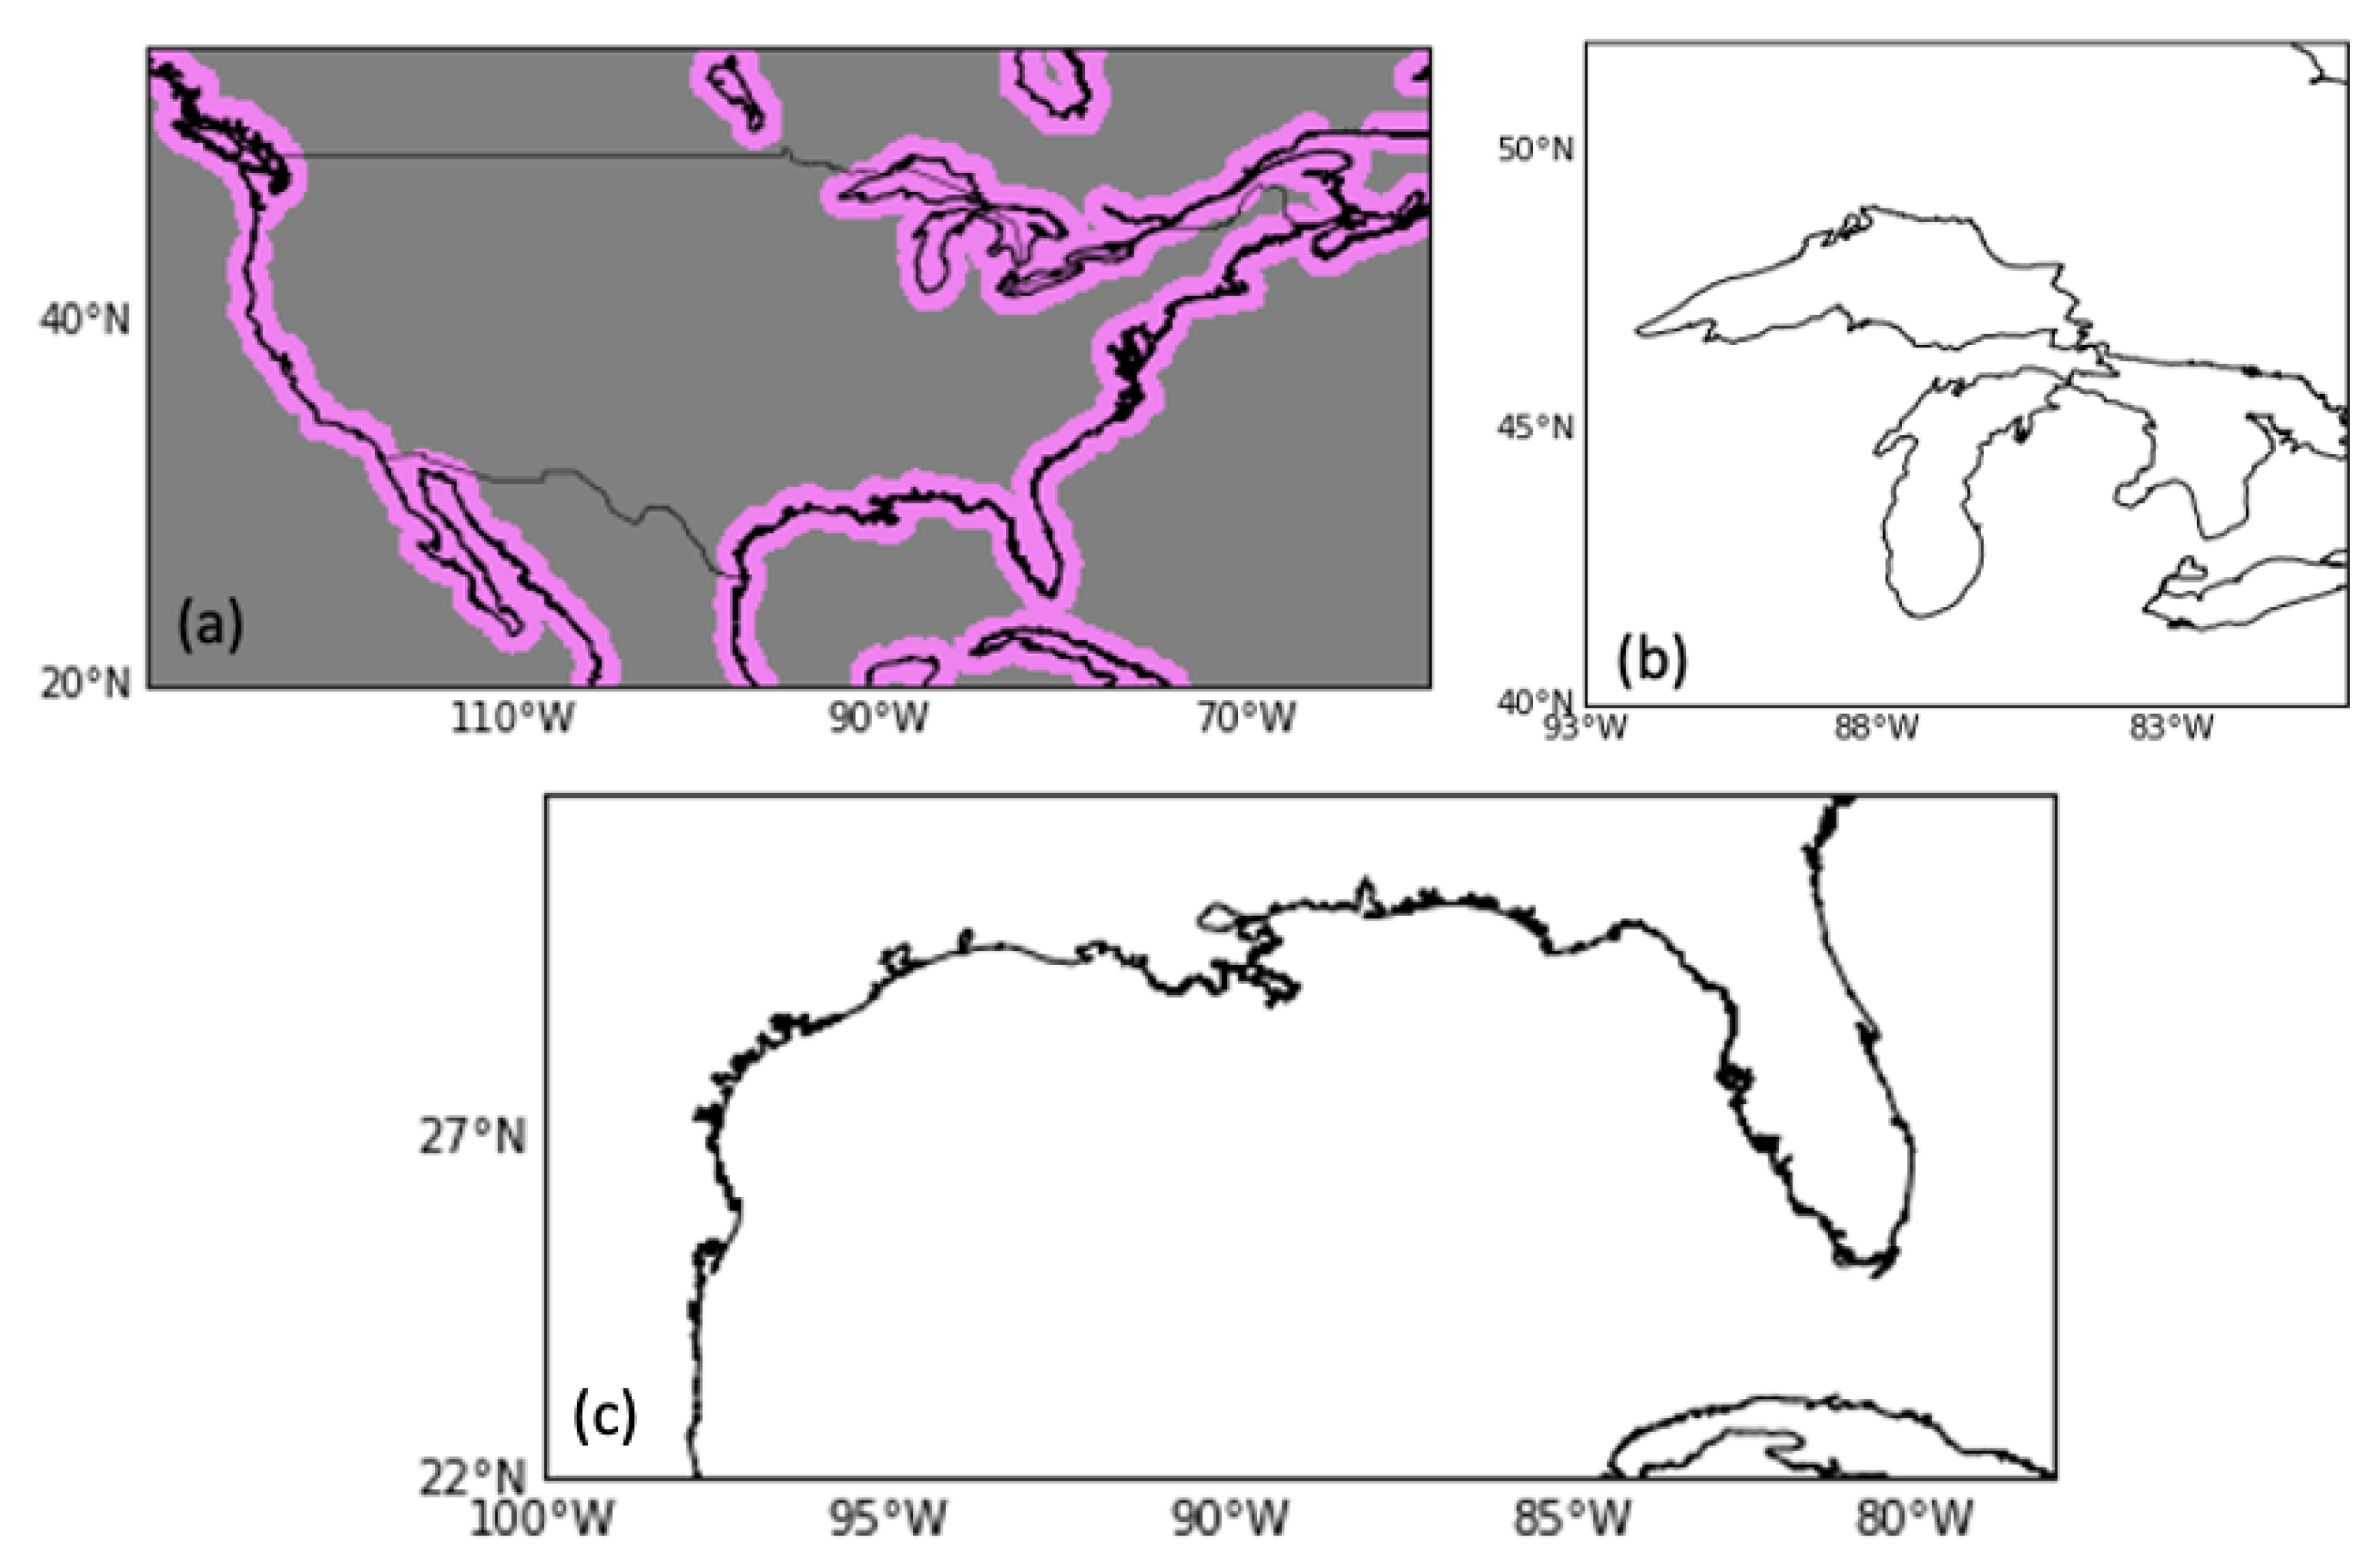
3.1. MRMS Precipitation Distributions over Coastal Land/Water

Figure 2a shows there were no remarkable MRMS precipitation differences over land vs. over water in most parts of the coastal regions (including the Great Lakes), with two exceptions. Over the northwest, the land received more precipitation (3.47 mm/day) than the ocean (3.04 mm/day), attributed by Purnell and Kirshbaum [32] to the midlatitude cyclones’ landfalls and the windward enhancement of frontal precipitation by coastal topography, as well as atmospheric rivers as mentioned by Zhang et al. [33]. Over the east coast near North Carolina, there was higher oceanic precipitation (4.08 mm/day) than land precipitation (3.88 mm/day), which may be related to the Gulf Stream’s transportation of substantial moisture and latent heat to the atmosphere, enhancing precipitation [34].
Figure 2b shows the regional distribution of heavy rainfall (R99p) from 2018 to 2020. The Great Lakes region received comparable amounts of heavy precipitation over land and water. There were large amounts of heavy precipitation over both land and ocean in the Gulf of Mexico and near the coast of North Carolina. In the northwest, land received more heavy precipitation than the ocean, which is consistent with the climatology in Figure 2a.
To delve further into the details of the coastal precipitation’s land–water distribution, a cross-sectional plot of rainfall, averaged over all grids at a given distance of the coastline (binned every 10 km), is shown in Figure 2c. The cross-section of precipitation climatology shows a more distinct difference between coastal land and water (Figure 2c) than that of the spatial distribution of climatology (Figure 2a), with higher precipitation over land (3.00 mm/day) than over ocean (2.70 mm/day).
Seasonal cross-sections (Figure 3) reveal that winter precipitation has a greater land–water difference than that of the other seasons. For winter, the northwest receives more precipitation over land (5.24 mm/day) and water (4.21 mm/day) when compared with that of other coastal regions (Figure A1) due to extreme events like atmospheric rivers [33]. Conversely, the lower land–water differences in summer and autumn are primarily caused by those over the coast of the Gulf of Mexico (land: 4.28 mm/day, water: 3.70 mm/day) and the Gulf Stream near North Carolina (land: 4.58 mm/day, water: 5.04 mm/day). Other ocean precipitation regimes such as the Gulf of Mexico experience much precipitation over both land and ocean in warm seasons.

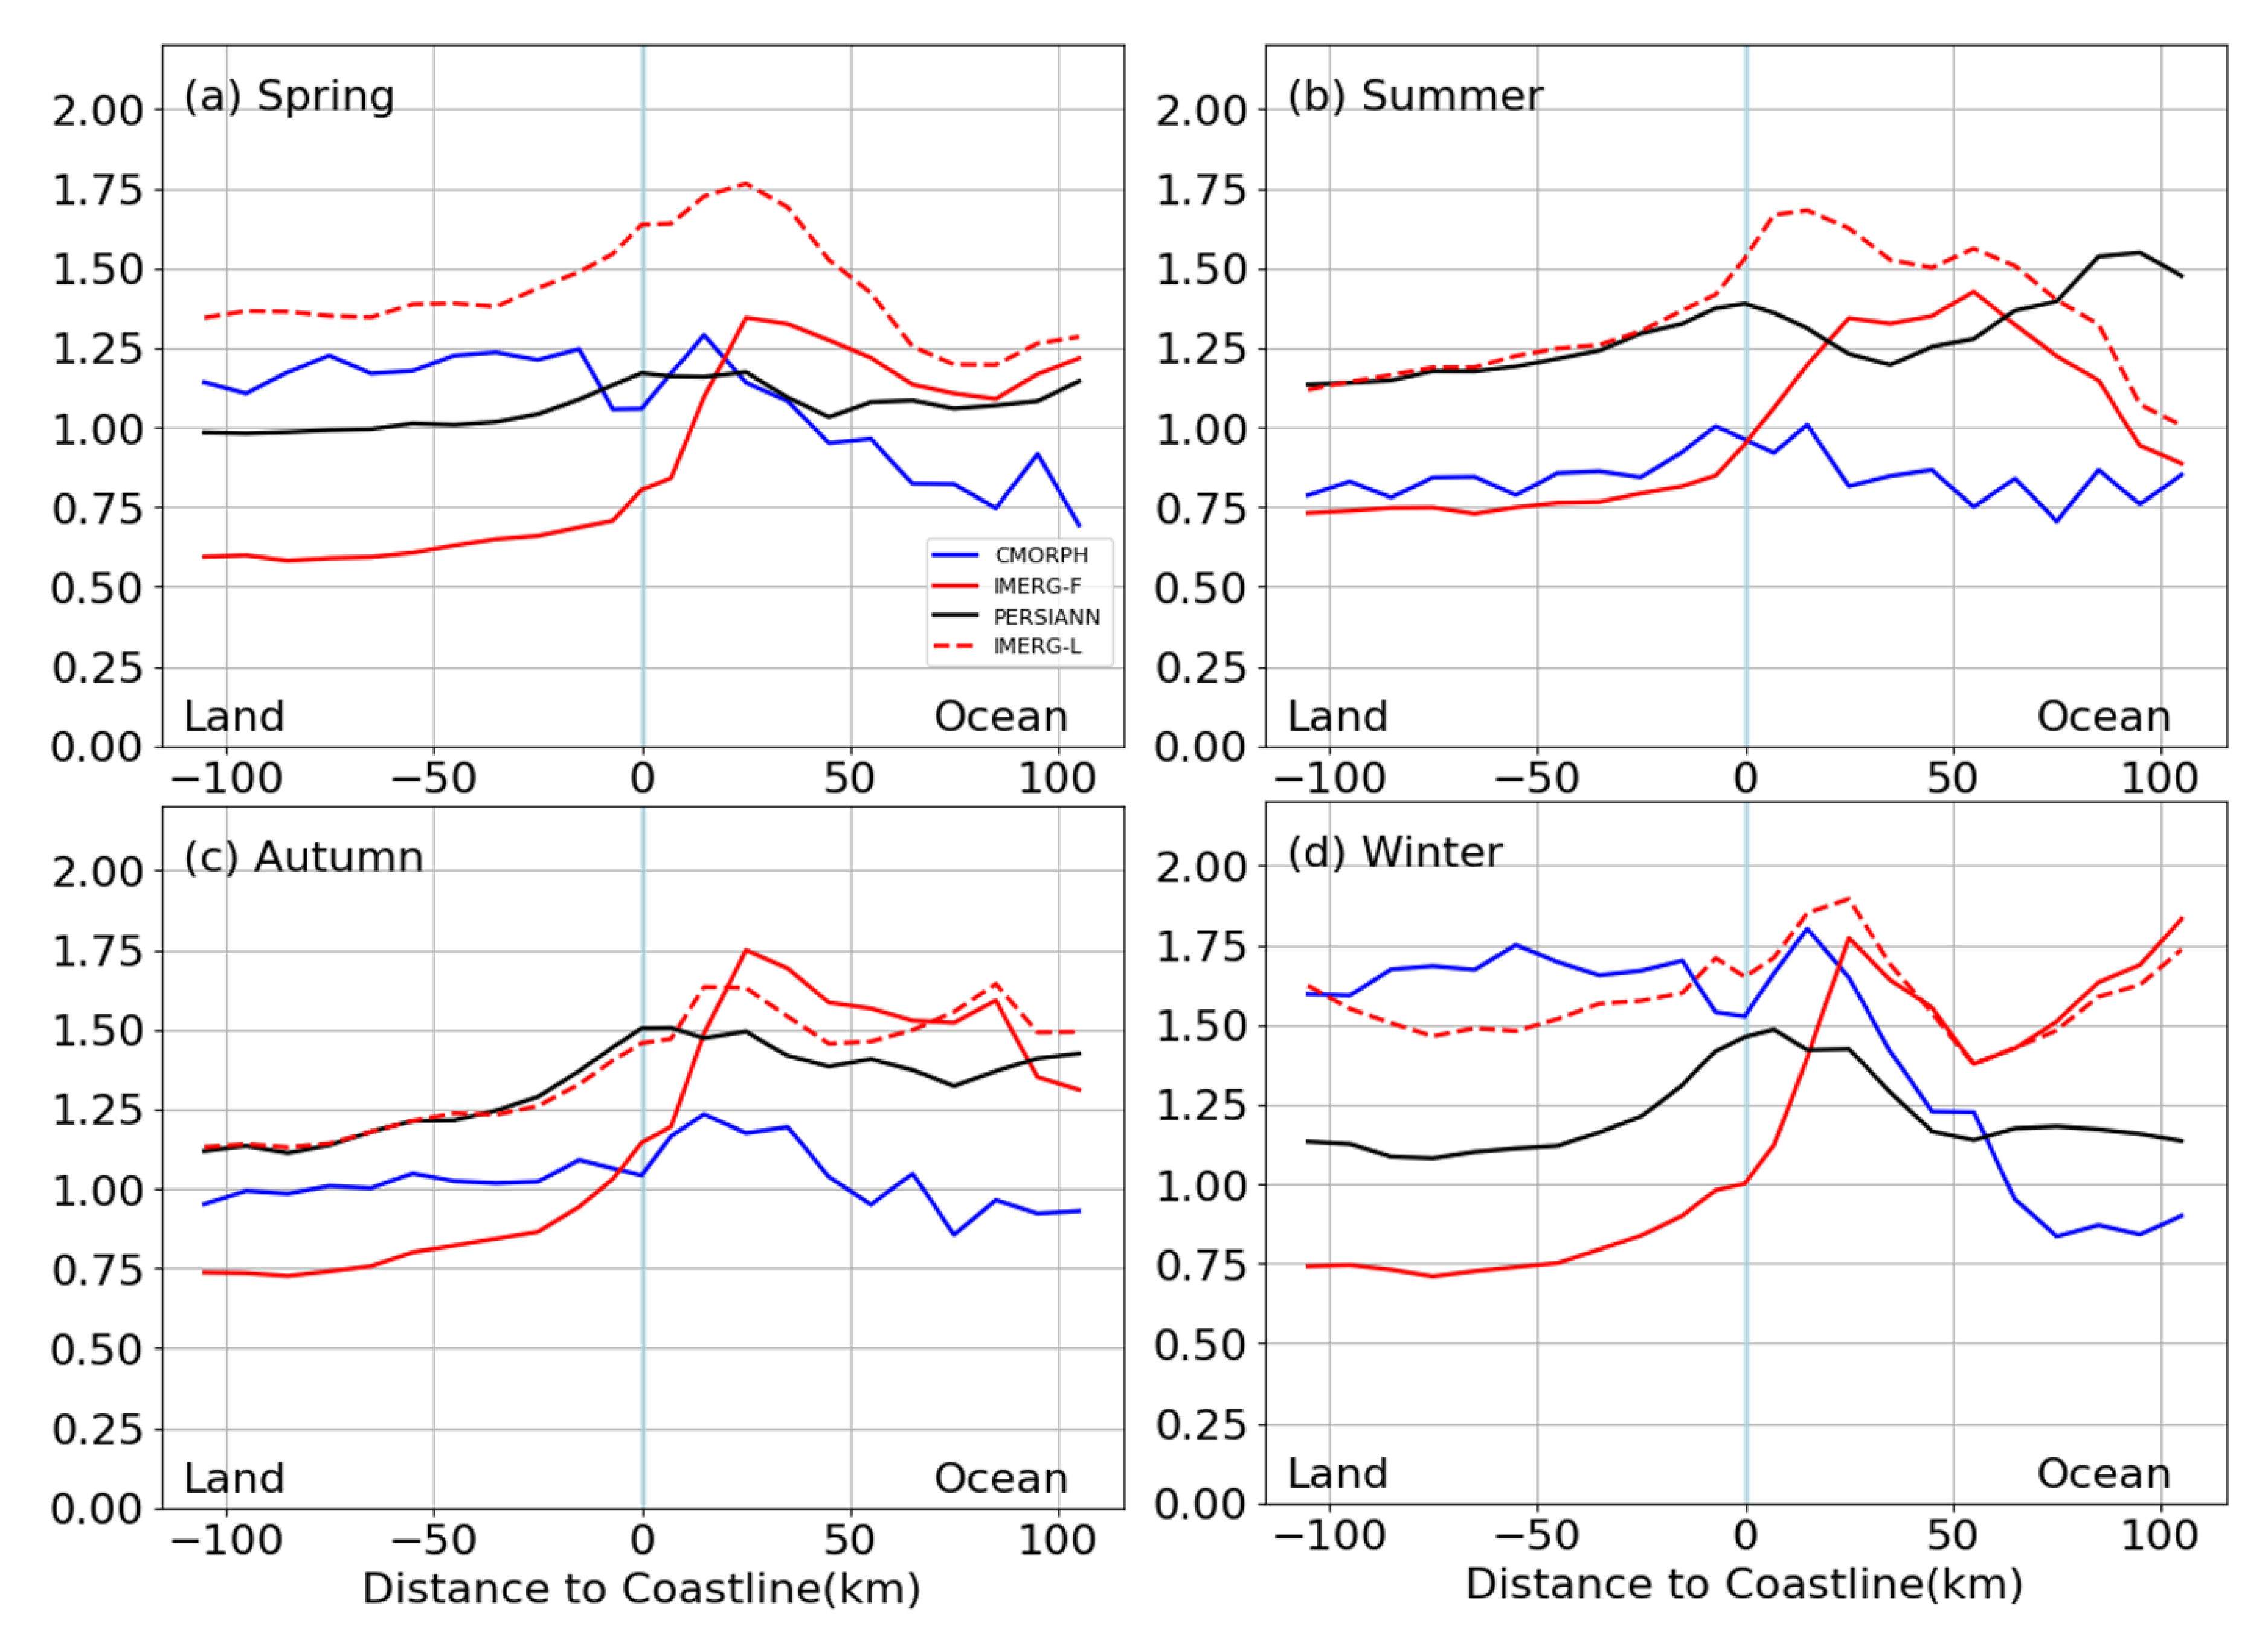
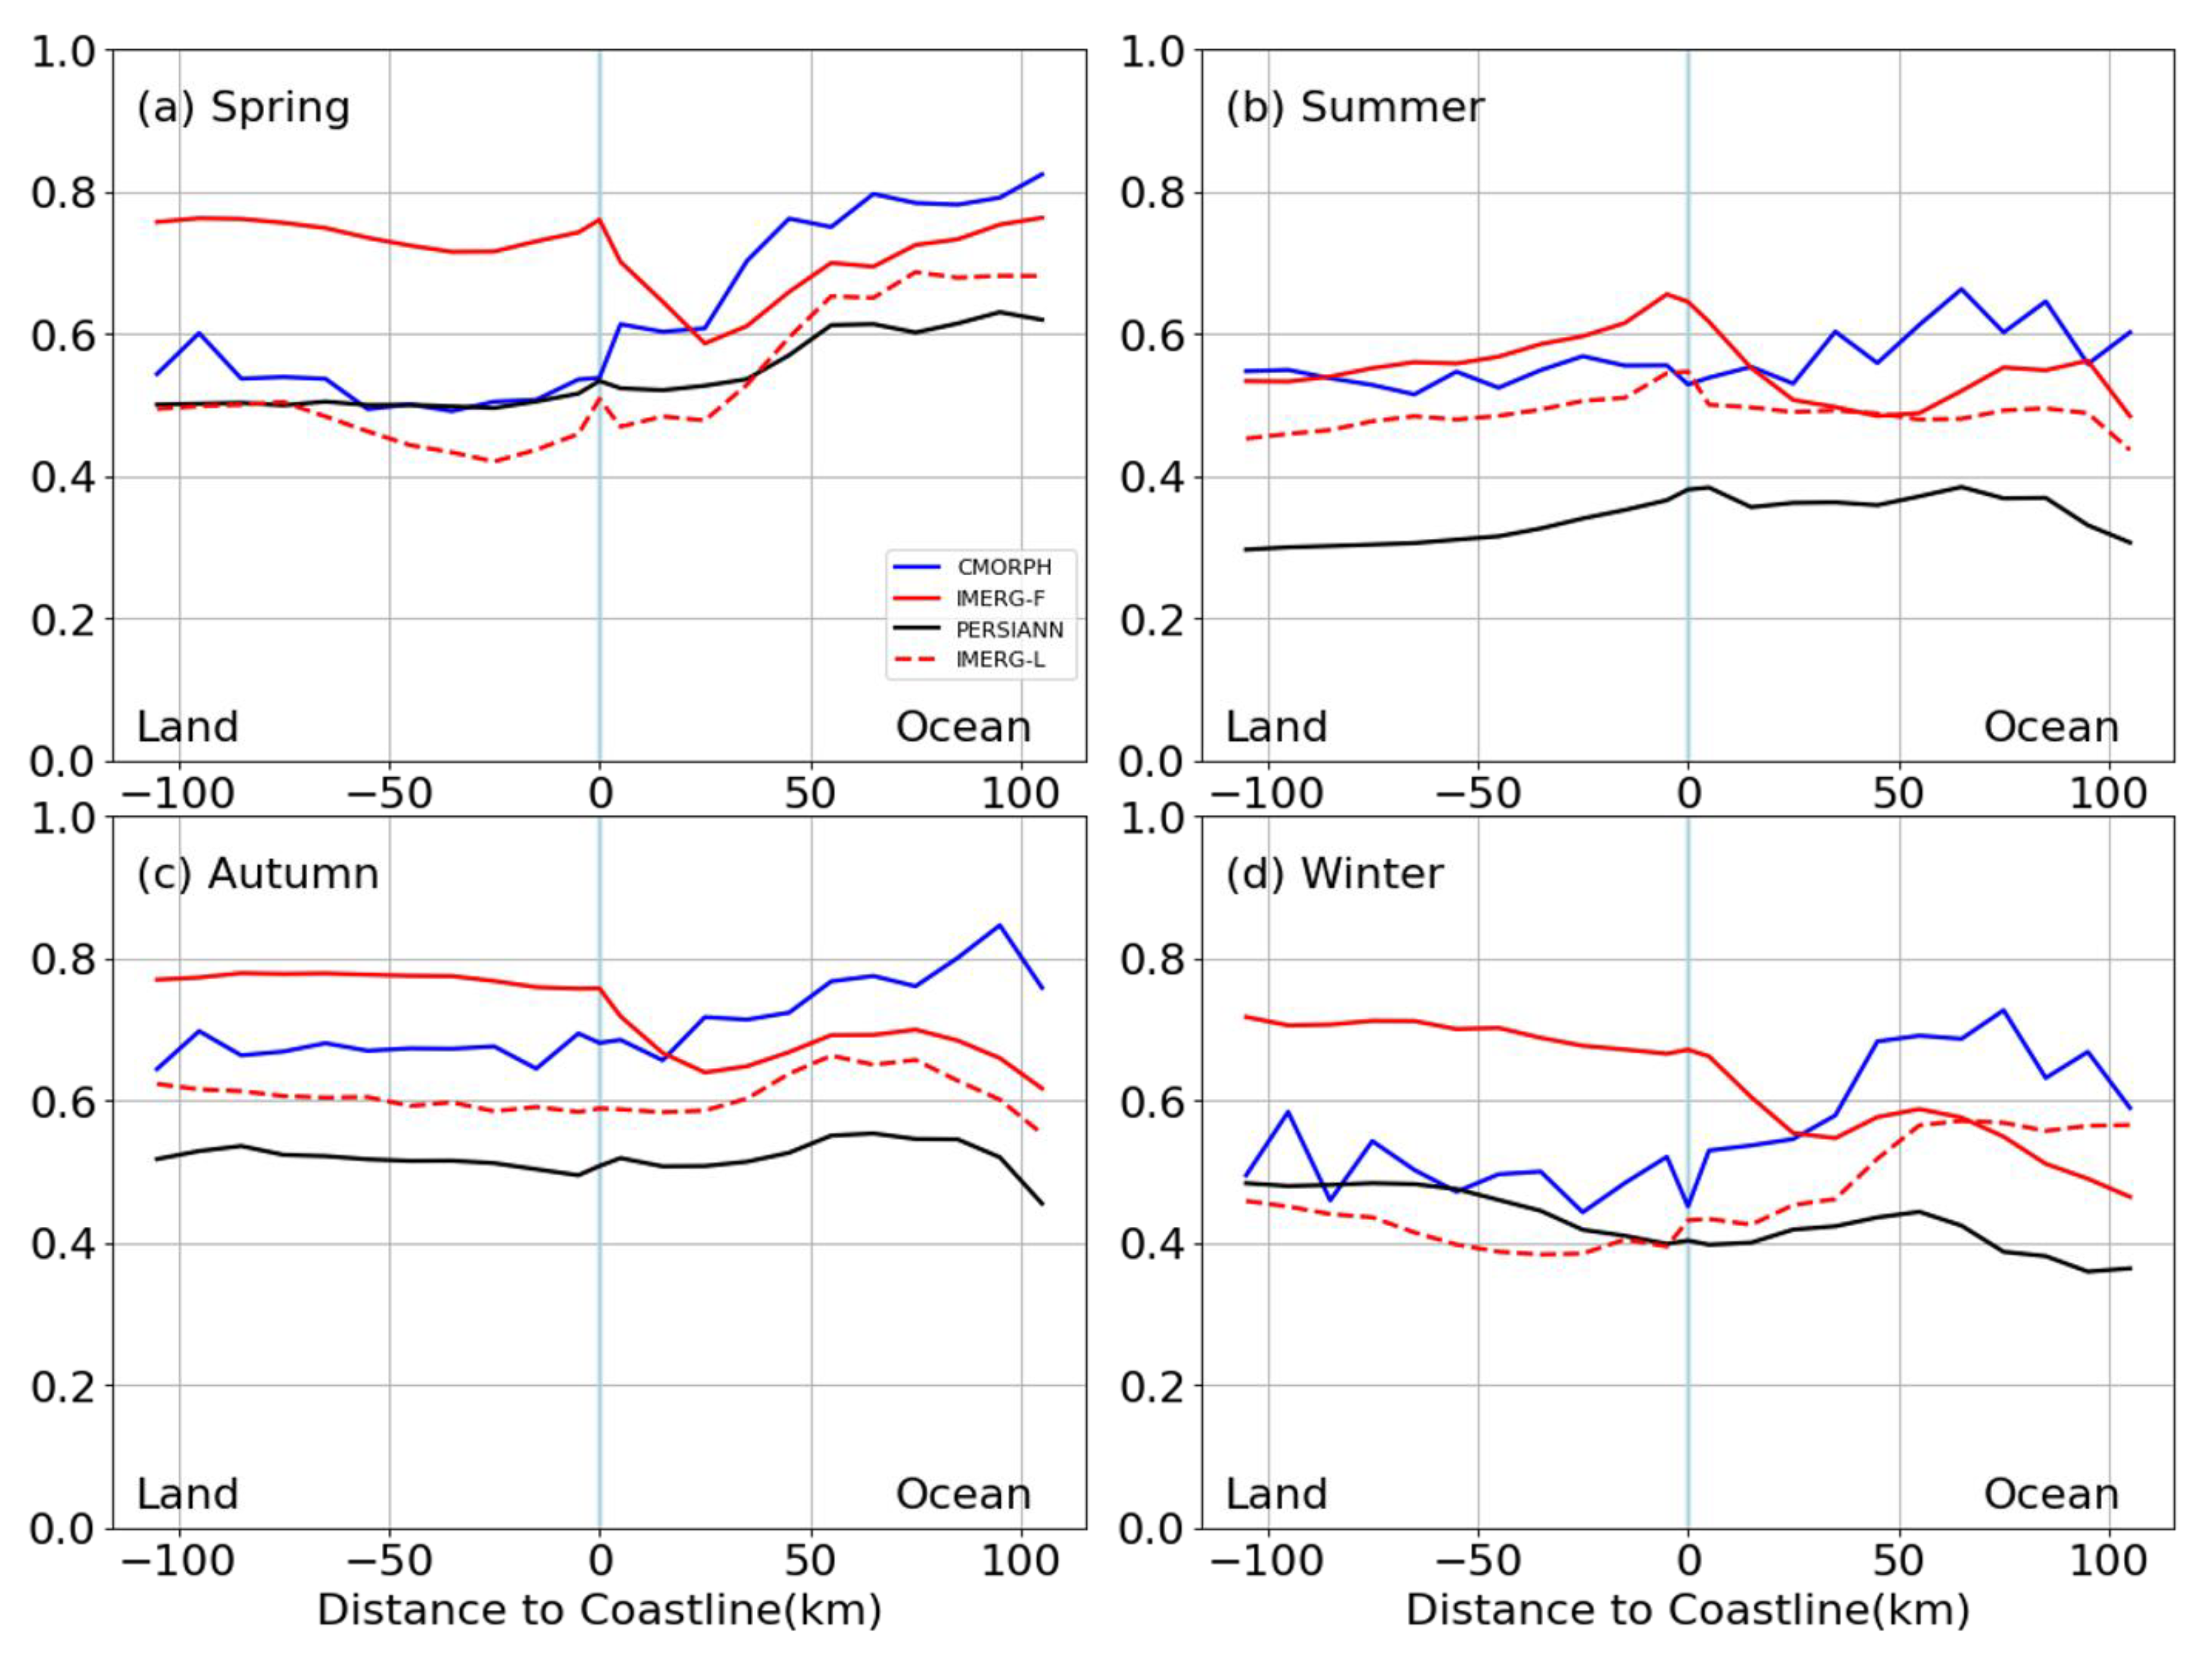
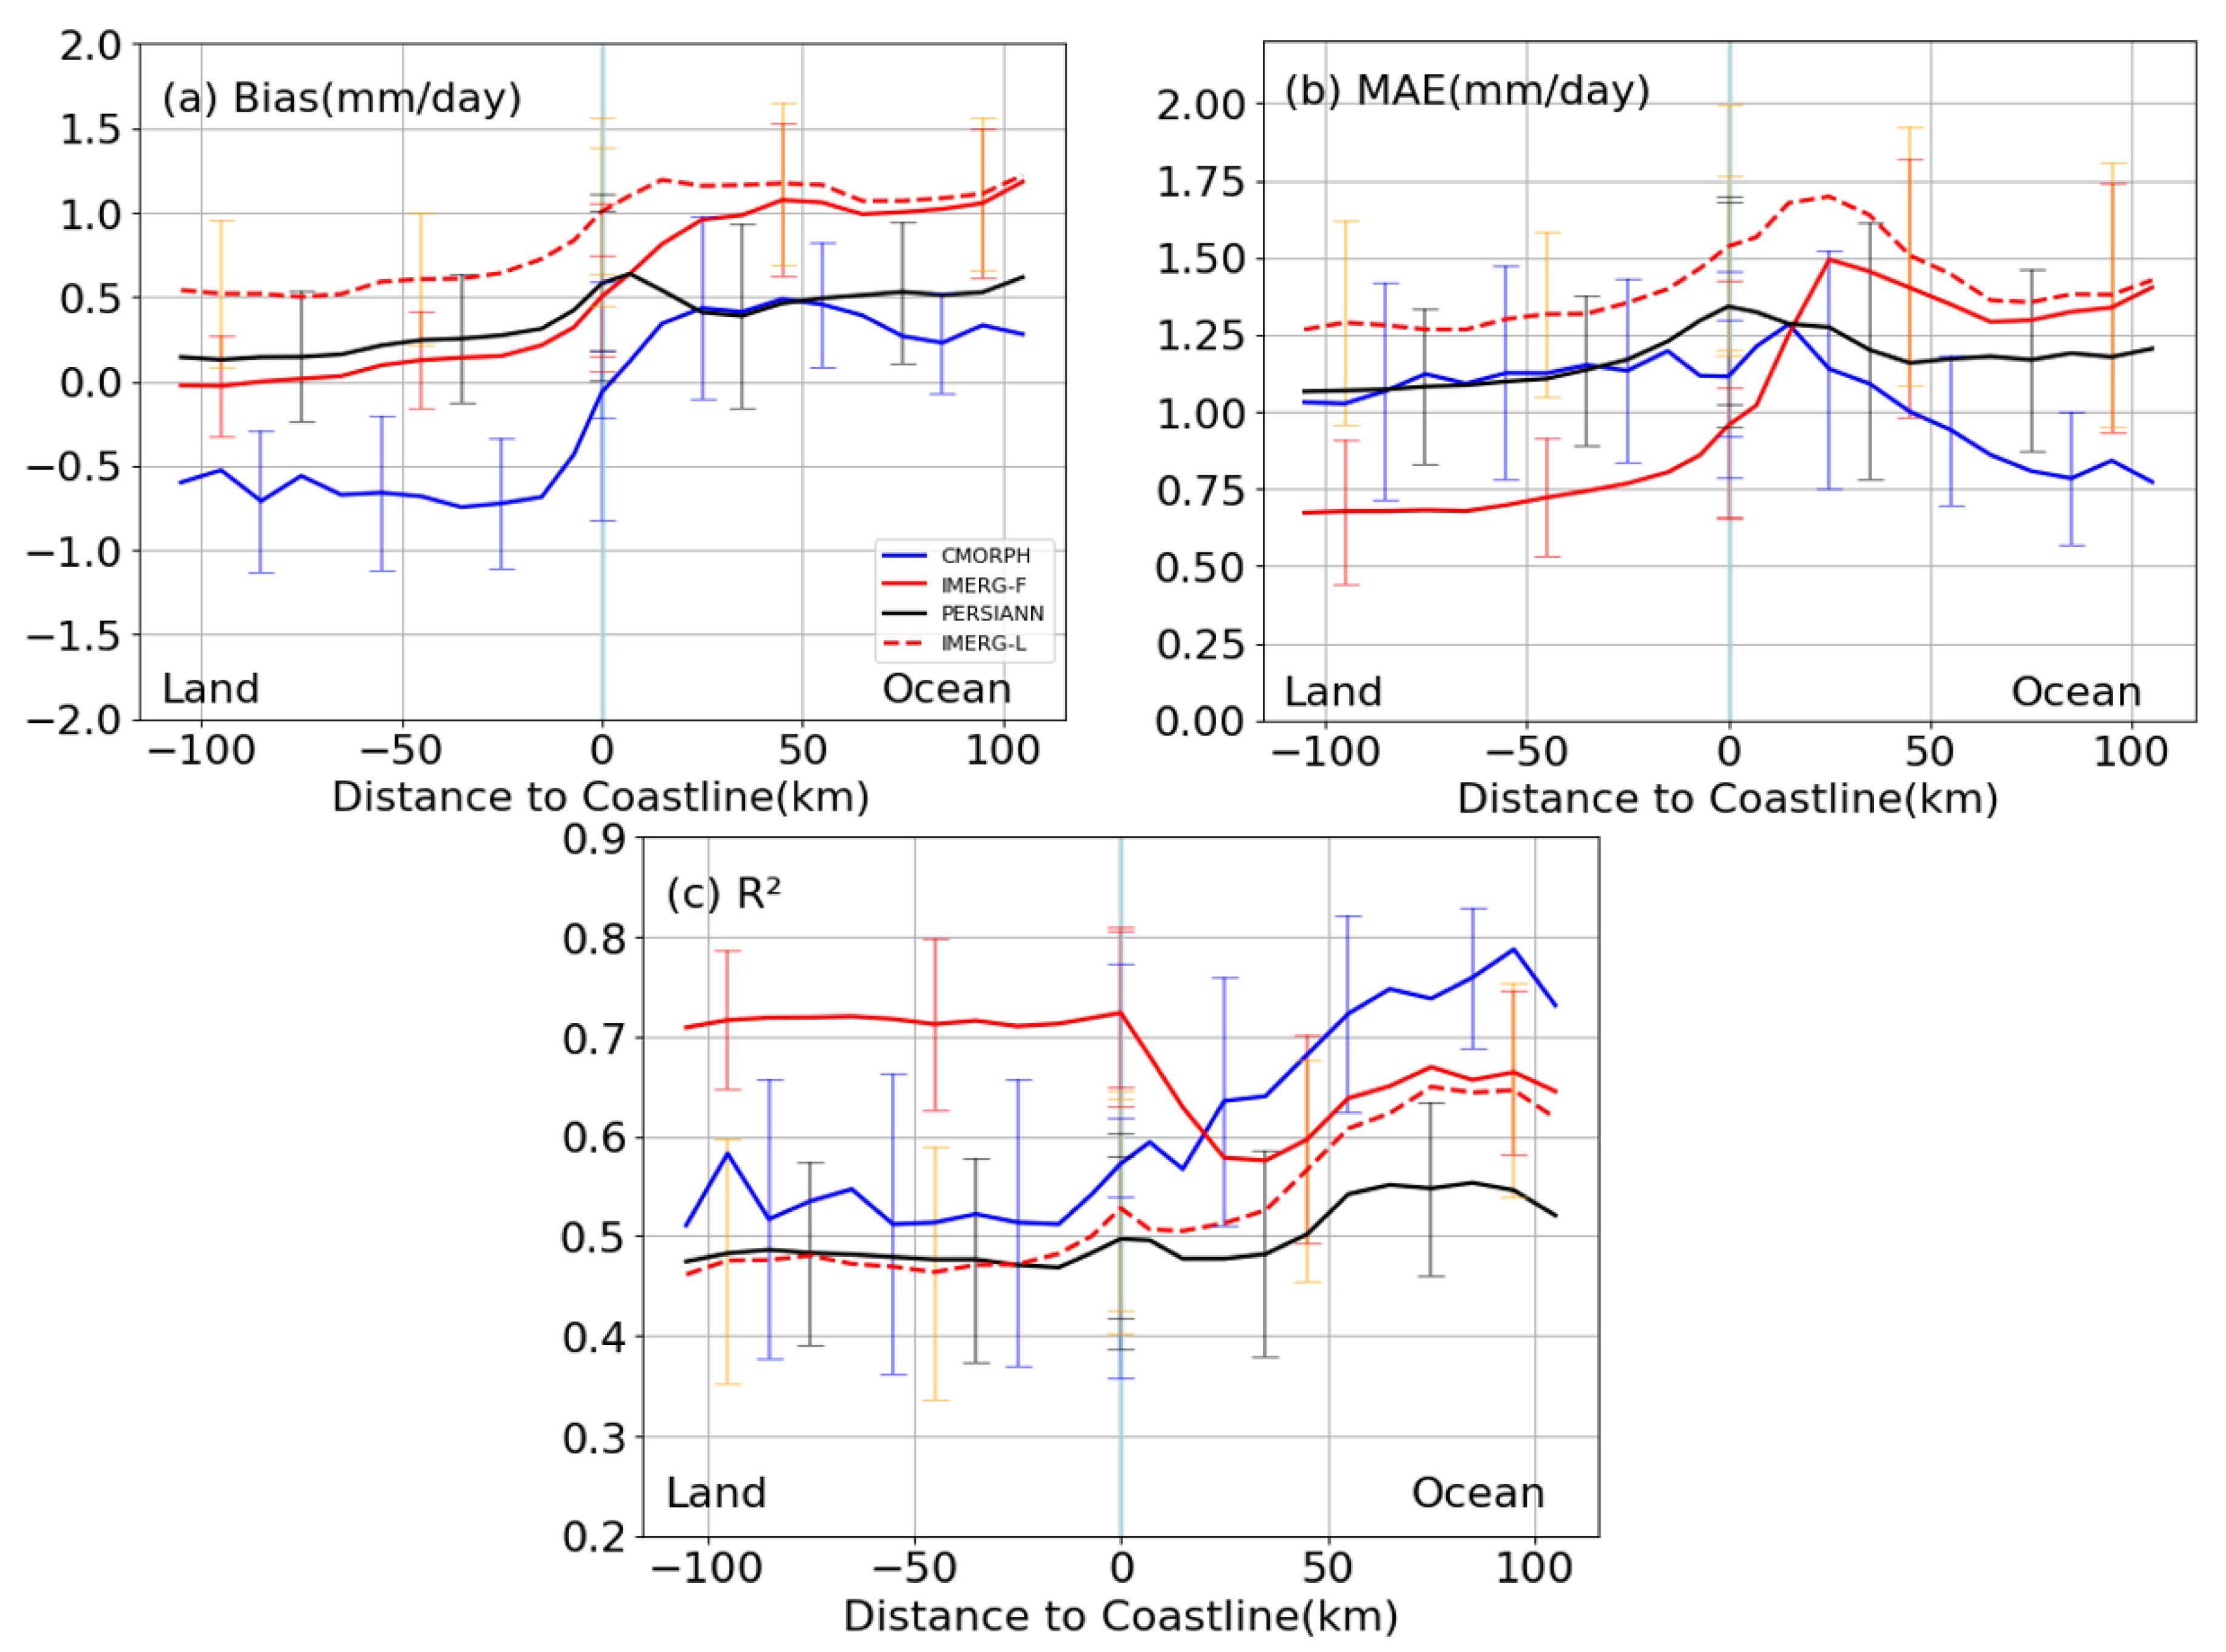
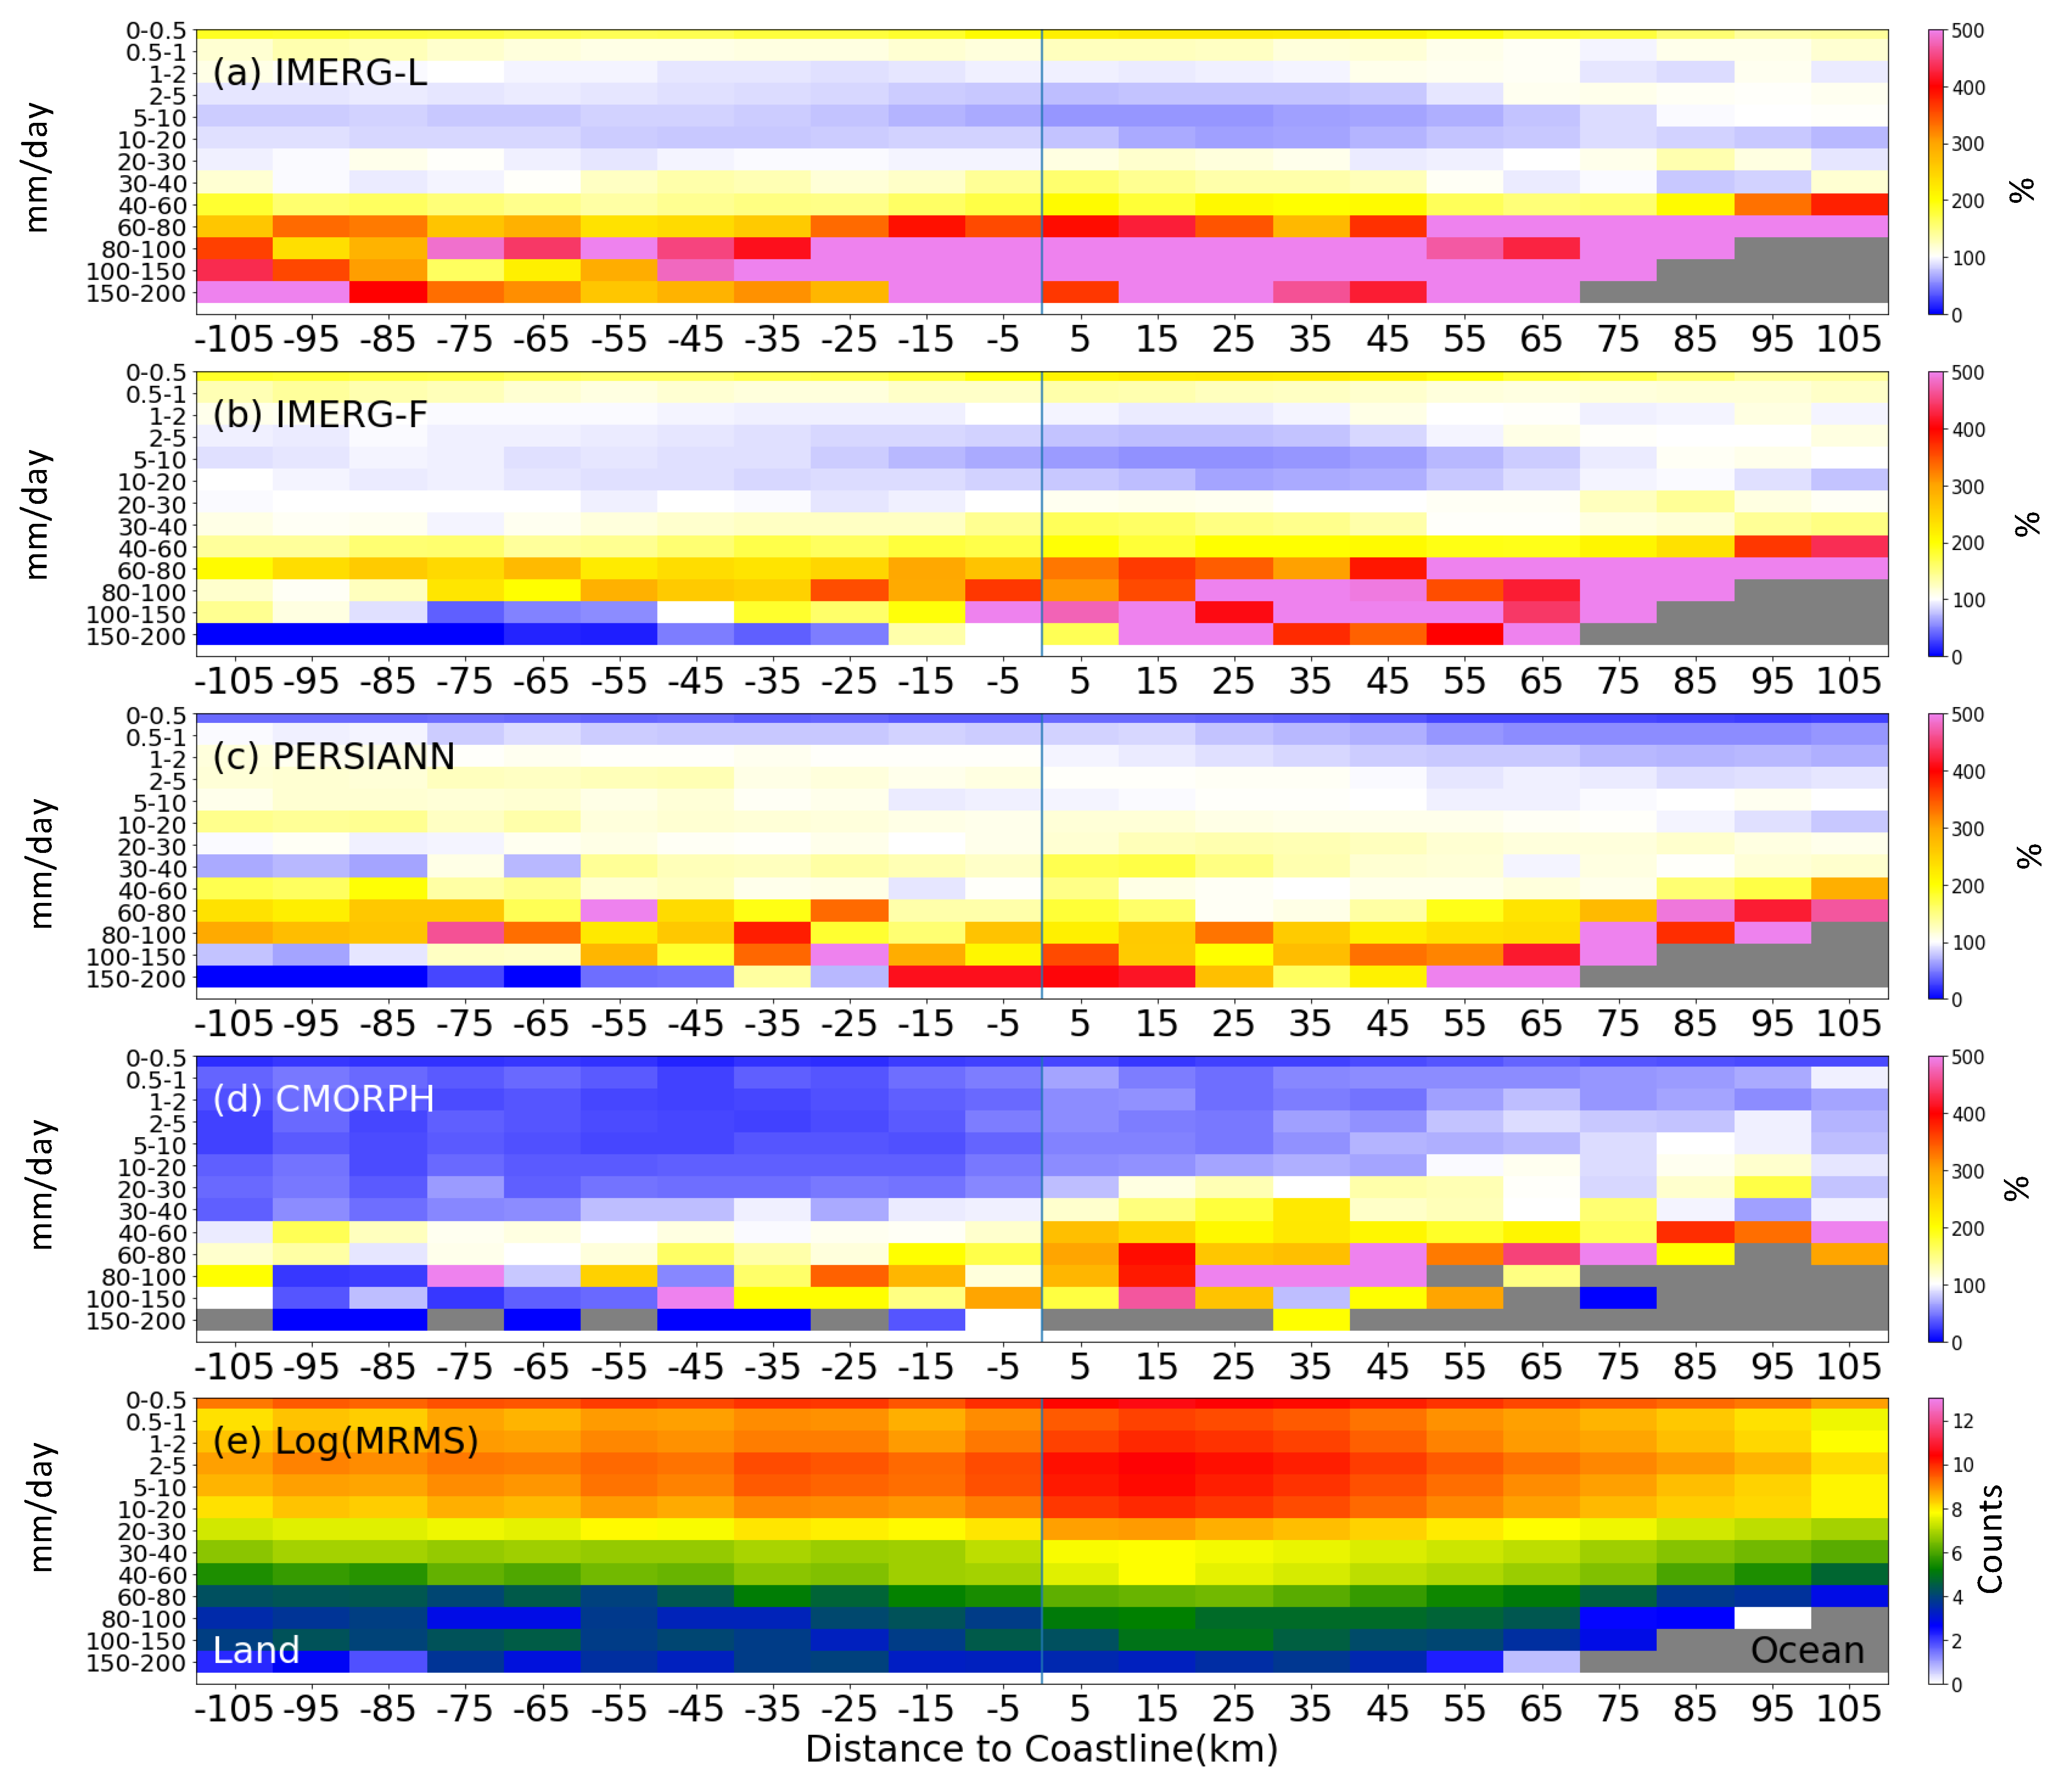
3.2. Satellite Precipitation Products’ Evaluation

Figure 2c shows that PERSIANN showed the most similar land–sea pattern to that of MRMS. To further investigate the performances of these products compared with that of MRMS, Figure 4 and Table 2 show the statistical metrics of all four precipitation products. Over coastal land, IMERG-F performed best overall, with the smallest magnitude of MB and MAE and the highest R2. However, it had a worse MB for extreme precipitation than that of CMORPH. CMORPH performed slightly better than PERSIANN overall.
Over the coastal ocean, CMORPH showed an overall better performance, with the smallest MB and MAE, highest R2, and second smallest MB for extreme precipitation (Figure 4 and Table 2). In contrast, IMERG-F performed worse than PERSIANN and CMORPH. With respect to the differences between coastal land and coastal water, PERSIANN showed the highest consistency for MB and MB (R99p). In contrast, IMERG-F was the least consistent between land and water in MAE and MB (R99p), while CMORPH was the least consistent in MB and R2 (Table 2).
To better understand the above performance of IMERG-F, Figure 5 shows the spatial distribution of bias in mean and extreme precipitation for IMERG-L (without gauge correction). The excellent performance of IMERG-F over coastal land was partly due to the gauge correction, as the results from IMERG-L were much worse (Figure 4 and Figure 5). For instance, the gauge correction substantially reduced the bias from 0.61 mm/day in IMERG-L to 0.10 mm/day in IMERG-F over coastal land (Table 2). IMERG-F’s performance was worse over coastal water than it was over land, with a mean bias of 0.95 mm/day, especially along the east coast, the Gulf of Mexico, and the Great Lakes (Figure 5). However, this performance was still slightly better than that of IMERG-L (Table 2), because IMERG-F apparently applied the gauge correction over coastal land (multiplied by a factor) to coastal ocean (with this factor gradually decreasing to near-zero when the distance to the coastline reached ~50 km over ocean; Figure 4).
CMORPH showed an underestimation over land (−0.65 mm/day), likely due to lower detection of the input level 2 passive microwave retrievals in the cold season, as suggested by Xie et al. [28]. CMORPH had smaller mean biases in magnitude, smaller MAEs, and higher R2 over water than over land (Figure 4 and Table 2), primarily during winter and spring (Figure A2, Figure A3 and Figure A4), likely due to less uncertainty in the level 2 PMW precipitation retrieval and the statistical downscaling of the 2.5-degree pentad GPCP analysis for bias correction over ocean.
All products overestimated extreme precipitation over both coastal land and water, with higher biases over water (Table 2). For instance, IMERG-F overestimated the total annual precipitation on extreme wet days (R99p) over water, mostly over the Great Lakes, the east coast, and the Gulf of Mexico (Figure 5b), with a mean bias over coastal water of 123.86 mm/yr (Table 2). The performance over land was much better, with a bias of 30.82 mm/yr over coastal land (Table 2). Without gauge correction, IMERG-L overestimated extreme precipitation across both the ocean and land (Table 2 and Figure 2), with a bias three times larger (93.04 mm/yr) over coastal land than that of IMERG-F. The gauge correction did not have a large impact on the results over coastal water, with the mean bias of 145.20 mm/yr in IMERG-L versus 123.86 mm/yr in IMERG-F (Table 2).
To better understand the above results on extreme precipitation and mean bias, Figure 6 shows the performance of satellite precipitation products for different precipitation bins from land to ocean. Overall, all satellite products slightly underestimated precipitation when MRMS precipitation was between 0.5 and 20 mm/day and overestimated precipitation when MRMS precipitation was greater than 40 mm/day. IMERG-F and IMERG-L both overestimated extreme precipitation over the ocean, and IMERG-L had more overestimation over land than that of IMERG-F. CMORPH had more underestimation over land between 0–40 mm/day and less underestimation over the ocean. PERSIANN exhibited the most consistent performance over land versus over the ocean.

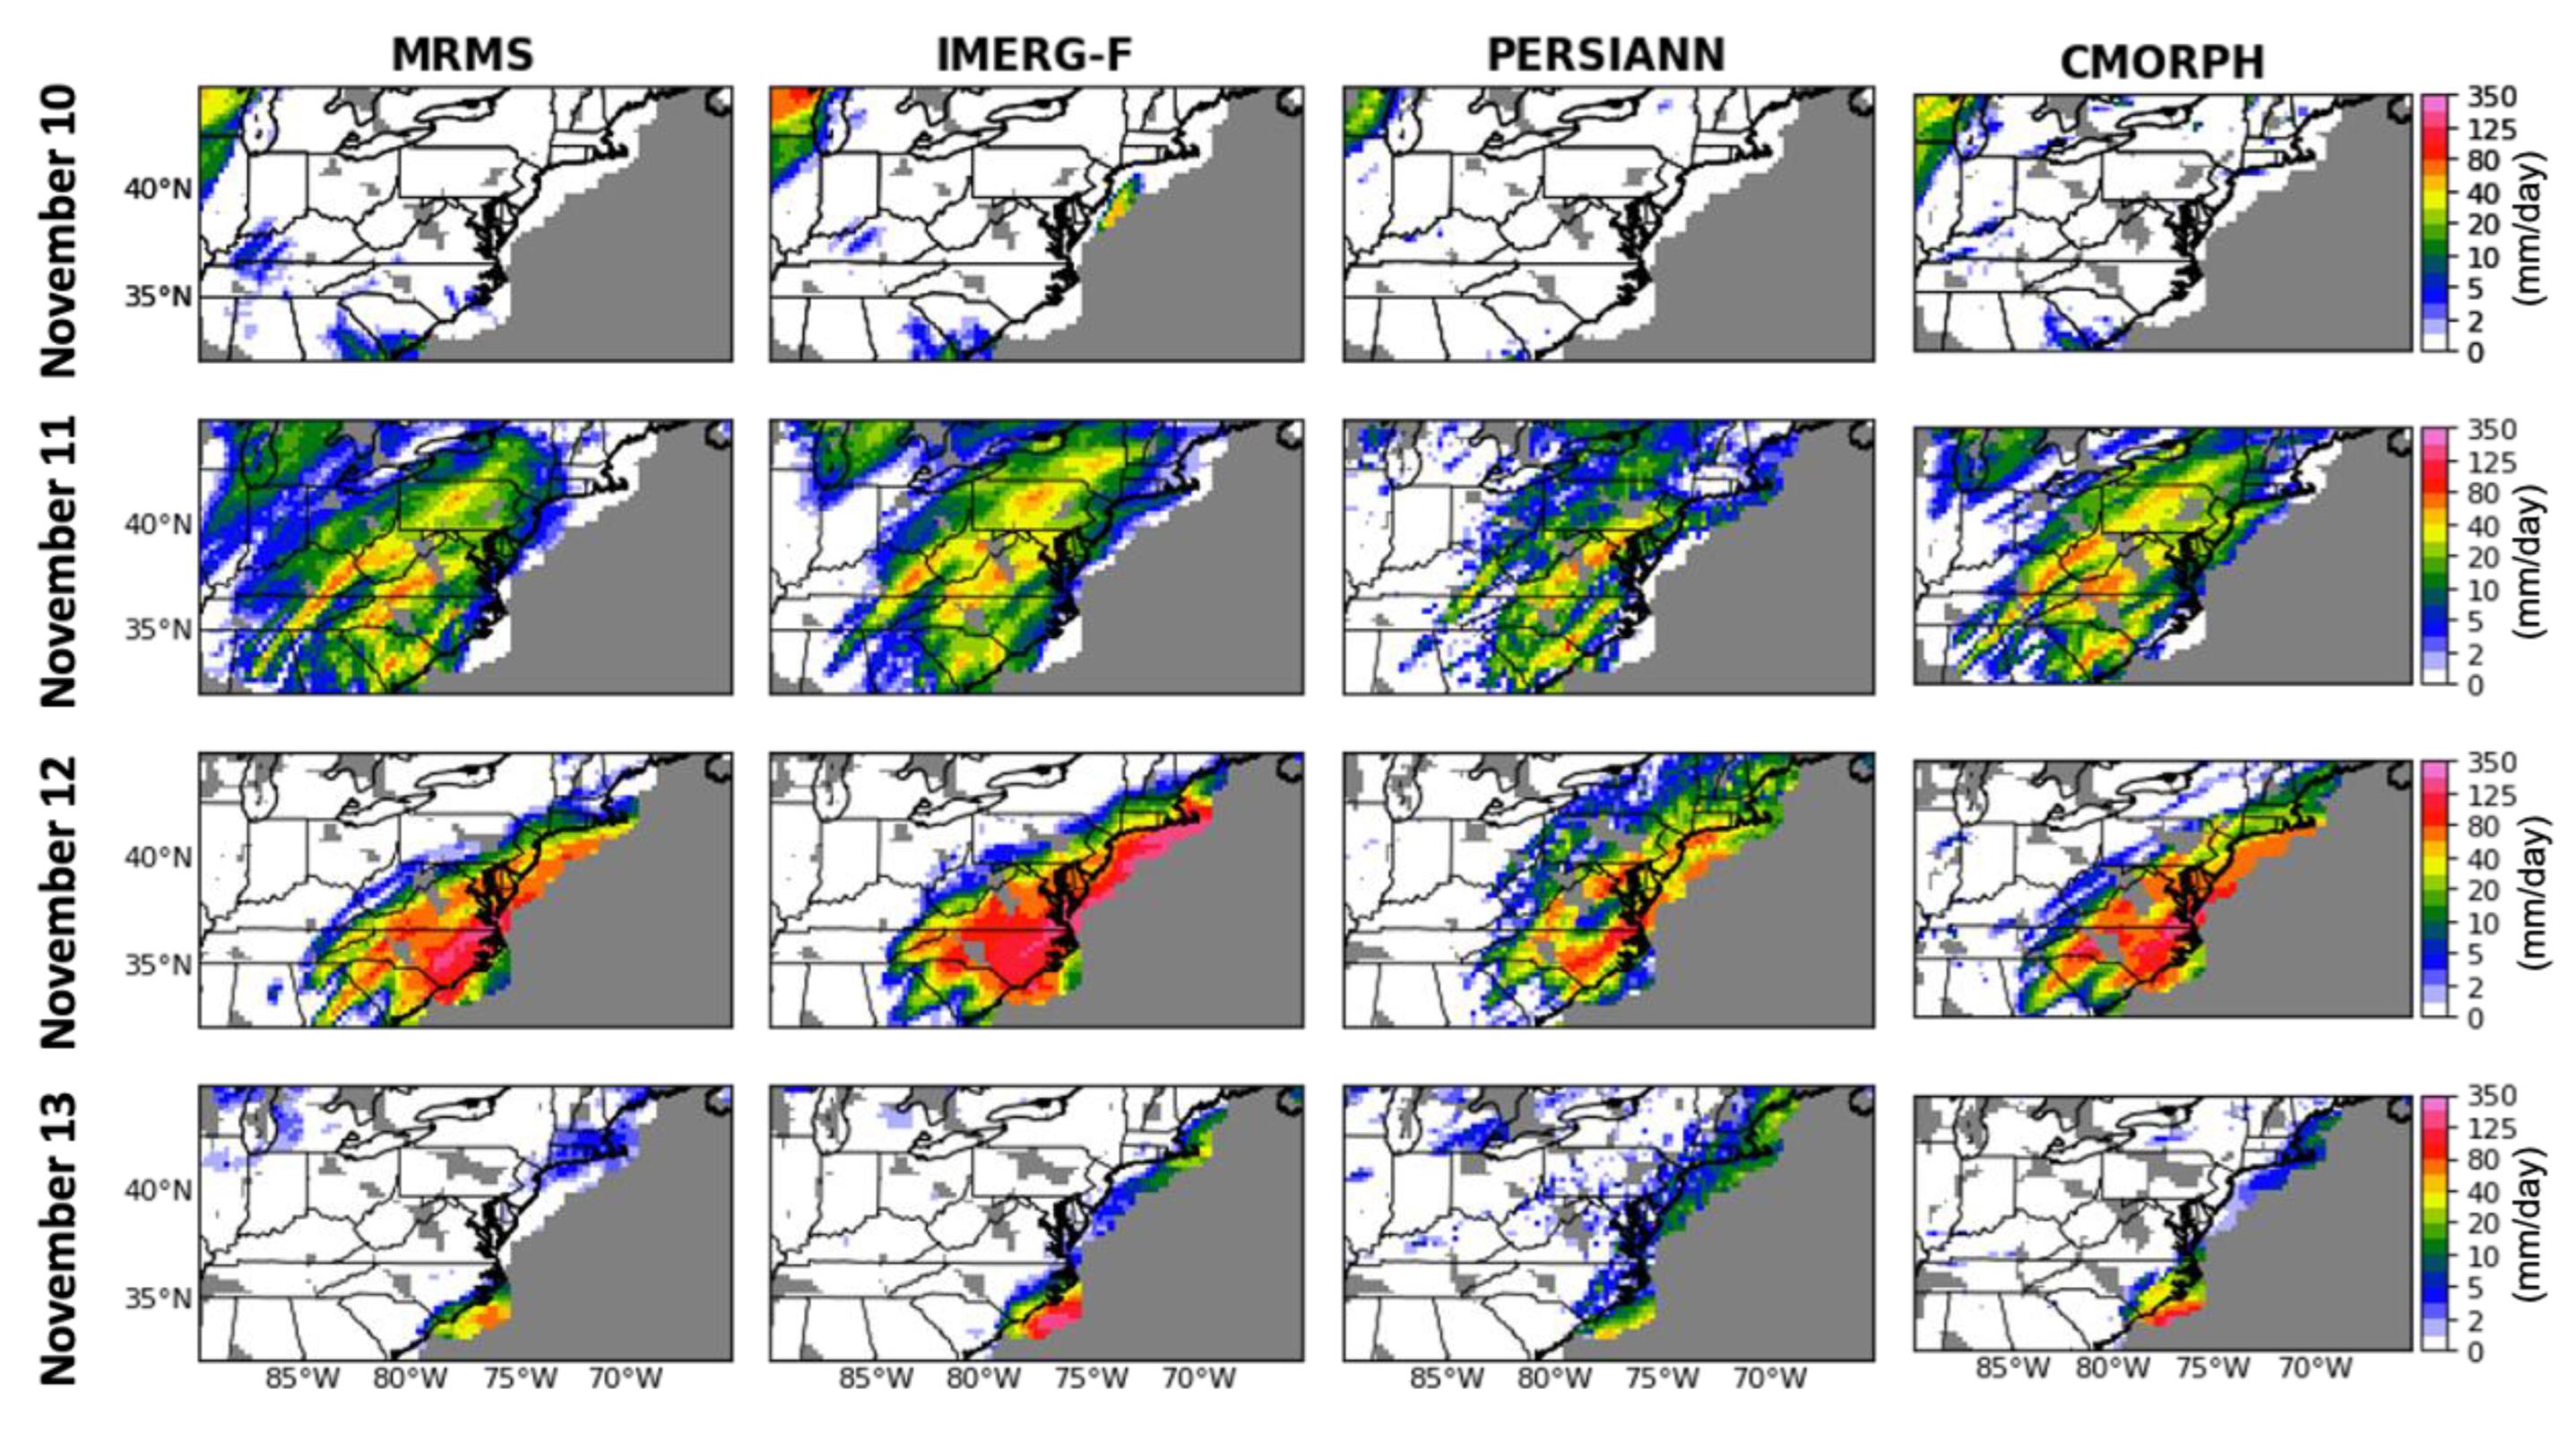
3.3. Case study: Extreme Precipitation Event on 10–13 November 2020

On 11–12 November 2020, heavy precipitation fell on most parts of the eastern U.S. The extreme precipitation was caused by a slow-moving cold front with a very high tropical moisture head caused by Tropical Storm Eta. From 10 to 12 November (Figure 7), MRMS showed that the cold front moved eastward, bringing heavy precipitation to the Appalachian Mountains at a rate of about 60 mm/day on November 11th, and continued to bring massive rainfall to North Carolina’s coastal region at a rate of around 125 mm/day on 12 November. The rainfall triggered flash flooding and minor river flooding, causing injury to more than 100 people in North Carolina [35]. From the second and fourth columns, both IMERG-F and CMORPH showed good spatial agreements with MRMS over land, with CMORPH exhibiting better agreement with MRMS than with IMERG-F and PERSIANN over the ocean (Figure 7 and Figure 8). PERSIANN was less spatially continuous over land, leading to worse performance than the other products (Figure 8). Over the ocean, PERSIANN had a smaller bias in magnitude but a worse R2 than that of IMERG-F and CMORPH. The field significance test showed that all R2 values in Figure 8 were significant at the 95% level. Both IMERG-F and CMORPH performed better over land than over the ocean, while PERSIANN’s performance was similar over land versus over the ocean.

4. Discussion

As mentioned above, the use of GPCC gauge data for bias correction in IMERG-F likely contributed to the overall good performance of this product over coastal land. This is consistent with the findings from prior studies. For instance, Ji et al. [36] used several satellite precipitation products to simulate streamflows and found the IMERG-F daily product performed the best. Tang et al. [17] compared nine products over land in China and found that IMERG-F had good quality, particularly in the diurnal cycle. In contrast, CMORPH’s overall good performance over coastal ocean was likely due to the bias correction using pentad GPCP merged products. Hence, IMERG-F could benefit from a similar GPCP correction over ocean (e.g., from 40 km away from the coastline, as motivated by Figure 4). Over land, CMORPH used the CPC’s daily gauge data for bias correction based on the probability distribution of precipitation. To improve CMORPH over land, better treatment of light precipitation events is needed. Among the satellite products, PERSIANN’s performance had the weakest dependence on surface type (land versus water; Figure 4, Figure 5 and Figure 6 and Figure A2,Figure A3,Figure A4), as it corrected for biases over both land and ocean using GPCP and the primary input for its retrieval was the geostationary satellite infrared data (with a weak dependence on surface type; see Section 2.1), rather than the polar-orbiting satellite microwave data (with its surface emissivity strongly depending upon surface type). While PERSIANN, IMERG-F, and CMORPH all used GPCP for bias correction over ocean, CMORPH had a better performance. This suggests that PERSIANN and IMERG-F may consider revising their bias correction over ocean.
Wang et al. [20] showed an underestimation of IMERG-F using a ground-based S-band weather radar in the Kwajalein Atoll in the tropical north Pacific, which appears contradictory to this study (e.g., Figure 4a). Derin et al. [22] and Cui et al. [37] mentioned that IMERG products tended to have a significant convective underestimation of rain types and to overestimate stratiform precipitation. As the Kwajalein Atoll is near the Intertropical Convergence Zone (ITCZ), its precipitation types are mainly convective, leading to more underestimation in IMERG-F in [20]. To further illustrate the performance of IMERG-F for different types of precipitation and link these results to our study, Figure 9 shows the cross-section of IMERG-F’s seasonal mean bias over the Gulf of Mexico. When the Gulf of Mexico had more convective precipitation in summer and fall, IMERG-F had a much lower bias at the location closest to the open ocean (~100 km) than it did in winter when there was less convective precipitation. The quantitative difference between the small positive bias in summer and fall in Figure 9 and the negative bias in [20] was likely caused by the two different geographical locations (coastal ocean vs. open ocean near the ITCZ), and further studies on this topic are needed.
As MRMS was used as the reference data, one obvious question is whether the conclusions in Section 3 are affected by data uncertainties in MRMS. We address this issue from two perspectives. First, since MRMS also uses gauge correction over land, we compared the MRMS precipitation and the radar-retrieved-only precipitation for a year (2018) in Figure 10. The two products agreed with each other very well in the cross-section, with small differences in the magnitude of the annual mean precipitation and extreme precipitation over most of the coastal regions. If we take the differences between these two products over land as a measure of the MRMS’s uncertainty over land and water, these differences are much smaller than those between the satellite products and MRMS.
As MRMS has more uncertainty in cold seasons [38], it is important to address how this potentially affected our results. Figure 11 shows the spatial distribution of RQI in winter and summer from 2018 to 2020. Indeed, MRMS had worse quality in cold seasons, particularly in the northern U.S. over land. However, the RQI mean values remained consistent in most of the coastal areas, including the gulf coast, west coast, and east coast. Note that radars near the Great Lakes had worse quality in the winter than in the summer, suggesting the need for further improvement of MRMS or more reliable measurements for the regional analysis of satellite precipitation products there during winter.
Another way to address the MRMS data uncertainty is to compare the MRMS data used here versus the version used in [22] for one month (June 2018). Figure 12 shows the datasets agree with each other well. Both the MRMS data used here and in [22] show that the coastal ocean received less precipitation than that of the coastal land for one month, with the values decreasing toward the ocean. Together, the results in Figure 10, Figure 11 and Figure 12 demonstrate that MRMS data uncertainties do not affect the main conclusions of this study. Note that while the radar quality (as indicated by the RQI values) may be fine for the case study of an extreme event in Figure 7 and Figure 8, the radar precipitation retrieval accuracy may be affected. This goes beyond the scope of this study and needs further study.

5. Conclusions

This study used the MRMS to analyze the distribution of coastal precipitation in the US from 2018 to 2020. The results show a distinct precipitation difference over coastal water vs. coastal land that is higher in the winter and lower in the summer and autumn. The northwest and the east coast near North Carolina had high land/water differences—land received higher rainfall in the northwest, and the ocean received higher precipitation on the east coast. The extreme precipitation distribution was also consistent with the above precipitation climatology distribution.
The evaluation of IMERG-F, PERSIANN, and CMORPH against MRMS shows that IMERG-F outperformed the other products over coastal land, consistent with prior studies. CMORPH was best over coastal water but underestimated the precipitation over coastal land, in agreement with [17]. PERSIANN had the least difference in errors over land versus over water. All three satellite products slightly underestimated (or overestimated) precipitation when MRMS precipitation was less than 20 mm/day (or greater than 40 mm/day). Furthermore, these satellite products overestimated heavy precipitation over water more than they did over land, demonstrating the difficulties of observing extreme rainfall over ocean from satellites.
Various bias corrections have different effects on satellite precipitation products over land versus over water. For example, while the GPCC gauge correction in IMERG-F increases the quality over land, its relatively poor performance over ocean may be improved by using an approach similar to that of CMORPH. While CMORPH’s retrieval over the ocean based on GPCP bias correction is better than the other two products, its performance over land may be improved by a better treatment of light precipitation events.
These results were not affected by the MRMS uncertainties, as the MRMS precipitation differences between the gauge-corrected version and the version without the correction and between the two versions of MRMS data used here and in [22] are much smaller in magnitude than those between satellite products and MRMS. Note that there are additional sources of MRMS data uncertainty. For instance, the gauges utilized in MRMS do not include metadata that could be used to adjust rainfall amounts for wind undercatch or any other observational constraint associated with gauges [39]. Furthermore, there was a lower accuracy in MRMS over the west coast due to its complex terrain. MRMS may also have uncertainties in capturing spatial distributions and rainfall intensity of shallow stratiform rainfall events [40]. Future efforts need to consider these additional uncertainties and conduct further analyses to better understand the different performances of the three satellite products. These analyses could answer questions such as the following: Why does CMORPH perform best over the ocean when all three satellite products use GPCP for bias correction? Why does IMERG-F perform best over land when all three satellite products use gauge data for bias correction? As all these products include some bias adjustment from GPCP, which is itself derived from satellite observations over ocean, how does the revision of the GPCP product affect the performance of these three products?

Author Contributions

Conceptualization, Y.X. and X.Z.; methodology, Y.X. and X.Z., J.A. and A.O.; writing—original draft preparation, Y.X.; writing—review and editing, J.A., A.O. and X.Z.; supervision, X.Z.; All authors have read and agreed to the published version of the manuscript.

Funding

This work was funded by the NASA grant 80NSSC19K0442 in support of ACTIVATE, which is an Earth Venture Suborbital-3 (EVS-3) investigation funded by NASA’s earth science division and managed through the Earth System Science Pathfinder Program Office, and by NASA grant 80NSSC22K0285.

Data Availability Statement

We thank various centers for making data available: IMERG at https://gpm.nasa.gov/data/directory (accessed on 8 March 2020), PERSIANN-CCS-CDR at https://chrsdata.eng.uci.edu (accessedon 8 March 2020), CMORPH at https://www.ncei.noaa.gov/products/climate-data-records/precipitation-cmorph (accessed on 8 March 2020), GC-MRMS at https://www.nssl.noaa.gov/projects/mrms/ (accessed on 7 January 2020) and https://mesonet.agron.iastate.edu/archive/ (accessed on 8 March 2020).

Acknowledgments

The authors thank four anonymous reviewers for their insightful feedbacks. The authors benefited from the discussions with Ali Behrangi, Jackson Tan, and Lauren Cutler.

Conflicts of Interest

The authors declare no conflict of interest.

Appendix A

Figure A1. Spatial distribution of seasonal MRMS precipitation climatology (mm/day) for (a) spring, (b) summer, (c) autumn, and (d) winter.
Remotesensing 14 04557 g0a1
Figure A2. The cross-section of MAE (mm/day) in (a) spring, (b) summer, (c) autumn, and (d) winter over all CONUS coastlines for the seasonal climatology from January 2018 to December 2020.
Remotesensing 14 04557 g0a2
Figure A3. Same as Figure A2 except for R2 instead of MAE.
Remotesensing 14 04557 g0a3
Figure A4. Same as Figure A2 except for bias instead of MAE.
Remotesensing 14 04557 g0a4

References

  1. Cheng, L.; AghaKouchak, A. Nonstationary Precipitation Intensity-Duration-Frequency Curves for Infrastructure Design in a Changing Climate. Sci. Rep. 2014, 4, 7093. [Google Scholar] [CrossRef] [PubMed]
  2. Sheffield, J.; Wood, E.F.; Pan, M.; Beck, H.; Coccia, G.; Serrat-Capdevila, A.; Verbist, K. Satellite Remote Sensing for Water Resources Management: Potential for Supporting Sustainable Development in Data-Poor Regions. Water Resour. Res. 2018, 54, 9724–9758. [Google Scholar] [CrossRef]
  3. Verdin, A.; Funk, C.; Rajagopalan, B.; Kleiber, W. Kriging and Local Polynomial Methods for Blending Satellite-Derived and Gauge Precipitation Estimates to Support Hydrologic Early Warning Systems. IEEE Trans. Geosci. Remote Sens. 2016, 54, 2552–2562. [Google Scholar] [CrossRef]
  4. Gabler, C.A.; Osland, M.J.; Grace, J.B.; Stagg, C.; Day, R.; Hartley, S.B.; Enwright, N.M.; From, A.S.; McCoy, M.L.; McLeod, J.L. Macroclimatic change expected to transform coastal wetland ecosystems this century. Nat. Clim. Chang. 2017, 7, 142–147. [Google Scholar] [CrossRef]
  5. Wang, H.; Steyer, G.D.; Couvillion, B.R.; Rybczyk, J.M.; Beck, H.J.; Sleavin, W.J.; Meselhe, E.A.; Allison, M.A.; Boustany, R.G.; Fischenich, C.J.; et al. Forecasting landscape effects of Mississippi River diversions on elevation and accretion in Louisiana deltaic wetlands under future environmental uncertainty scenarios. Estuar. Coast. Shelf Sci. 2014, 138, 57–68. [Google Scholar] [CrossRef]
  6. Small, C.; Nicholls, R.J. A Global Analysis of Human Settlement in Coastal Zones. J. Coast. Res. 2003, 19, 584–599. [Google Scholar]
  7. Klein, R.J.T.; Nicholls, R.; Thomalla, F.J. Resilience to natural hazards: How useful is this concept? Glob. Environ. Chang. B Environ. Hazards 2003, 5, 35–45. [Google Scholar] [CrossRef]
  8. Curtis, S. Means and Long-Term Trends of Global Coastal Zone Precipitation. Sci. Rep. 2019, 9, 5401. [Google Scholar] [CrossRef]
  9. Coppin, D.; Bellon, G.; Pletzer, A.; Scott, C. Detecting and Tracking Coastal Precipitation in the Tropics: Methods and Insights into Multiscale Variability of Tropical Precipitation. J. Clim. 2020, 33, 6689–6705. [Google Scholar] [CrossRef]
  10. Derin, Y.; Kirstetter, P.-E.; Gourley, J.J. Evaluation of IMERG satellite precipitation over the land-coast-ocean continuum—Part I: Detection. J. Hydrometeorol. 2021, 22, 2843–2859. [Google Scholar] [CrossRef]
  11. Prigent, C. Precipitation retrieval from space: An overview. Comptes Rendus Geosci. 2010, 342, 380–389. [Google Scholar] [CrossRef]
  12. Hayden, L.; Liu, C. Differences in the Diurnal Variation of Precipitation Estimated by Spaceborne Radar, Passive Microwave Radiometer, and IMERG. J. Geophys. Res. Atmos. 2021, 126, e2020JD033020. [Google Scholar] [CrossRef]
  13. Zhang, C.; Chen, X.; Shao, H.; Chen, S.; Liu, T.; Chen, C.; Ding, Q.; Du, H. Evaluation and Intercomparison of High-Resolution Satellite Precipitation Estimates—GPM, TRMM, and CMORPH in the Tianshan Mountain Area. Remote Sens. 2018, 10, 1543. [Google Scholar] [CrossRef]
  14. Tan, J.; Huffman, G.J.; Bolvin, D.T.; Nelkin, E.J. IMERG V06: Changes to the Morphing Algorithm. J. Atmos. Ocean. Technol. 2019, 36, 2471–2482. [Google Scholar] [CrossRef]
  15. Sadeghi, M.; Nguyen, P.; Naeini, M.R.; Hsu, K.; Braithwaite, D.; Sorooshian, S. PERSIANN-CCS-CDR, a 3-hourly 0.04° global precipitation climate data record for heavy precipitation studies. Sci. Data 2021, 8, 157. [Google Scholar] [CrossRef]
  16. Zeweldi, D.A.; Gebremichael, M. Evaluation of CMORPH Precipitation Products at Fine Space–Time Scales. J. Hydrometeorol. 2009, 10, 300–307. [Google Scholar] [CrossRef]
  17. Tang, G.; Clark, M.P.; Papalexiou, S.M.; Ma, Z.; Hong, Y. Have satellite precipitation products improved over last two decades? A comprehensive comparison of GPM IMERG with nine satellite and reanalysis datasets. Remote Sens. Environ. 2020, 240, 111697. [Google Scholar] [CrossRef]
  18. Sui, X.; Li, Z.; Ma, Z.; Xu, J.; Zhu, S.; Liu, H. Ground Validation and Error Sources Identification for GPM IMERG Product over the Southeast Coastal Regions of China. Remote Sens. 2020, 12, 4154. [Google Scholar] [CrossRef]
  19. Singh, A.K.; Tripathi, J.; Singh, K.; Singh, V.; Sateesh, M. Comparison of different satellite-derived rainfall products with IMD gridded data over Indian meteorological subdivisions during Indian Summer Monsoon (ISM) 2016 at weekly temporal resolution. J. Hydrol. 2019, 575, 1371–1379. [Google Scholar] [CrossRef]
  20. Wang, J.; Wolff, D.B.; Tan, J.; Marks, D.A.; Pippitt, J.L.; Huffman, G.J. Validation of IMERG Oceanic Precipitation over Kwajalein. Remote Sens. 2022, 14, 3753. [Google Scholar] [CrossRef]
  21. Carr, N.; Kirstetter, P.-E.; Hong, Y.; Gourley, J.J.; Schwaller, M.; Petersen, W.; Wang, N.-Y.; Ferraro, R.R.; Xue, X. The Influence of Surface and Precipitation Characteristics on TRMM Microwave Imager Rainfall Retrieval Uncertainty. J. Hydrometeorol. 2015, 16, 1596–1614. [Google Scholar] [CrossRef]
  22. Derin, Y.; Kirstetter, P.-E.; Brauer, N.; Gourley, J.J.; Wang, J. Evaluation of IMERG satellite precipitation over the land-coast-ocean continuum—Part II: Quantification. J. Hydrometeorol. 2022, 23, 1297–1314. [Google Scholar] [CrossRef]
  23. Huffman, G.J.; Bolvin, D.T.; Braithwaite, D.; Hsu, K.; Joyce, R.; Kidd, C.; Nelkin, E.J.; Sorooshian, S.; Tan, J.; Xie, P. NASA Global Precipitation Measurement (GPM) Integrated. 7 February 2018. Available online: https://gpm.nasa.gov/sites/default/files/document_files/IMERG_ATBD_V5.2_0.pdf (accessed on 17 December 2021).
  24. Tan, J.; Huffman, G.J.; Bolvin, D.T.; Nelkin, E.J. Diurnal Cycle of IMERG V06 Precipitation. Geophys. Res. Lett. 2019, 46, 13584–13592. [Google Scholar] [CrossRef]
  25. Becker, A.; Finger, P.; Meyer-Christoffer, A.; Rudolf, B.; Schamm, K.; Schneider, U.; Ziese, M. A description of the global land-surface precipitation data products of the Global Precipitation Climatology Centre with sample applications including centennial (trend) analysis from 1901–present. Earth Syst. Sci. Data 2013, 5, 71–99. [Google Scholar] [CrossRef]
  26. Adler, R.F.; Sapiano, M.R.P.; Huffman, G.J.; Wang, J.-J.; Gu, G.; Bolvin, D.; Chiu, L.; Schneider, U.; Becker, A.; Nelkin, E.; et al. The Global Precipitation Climatology Project (GPCP) Monthly Analysis (New Version 2.3) and a Review of 2017 Global Precipitation. Atmosphere 2018, 9, 138. [Google Scholar] [CrossRef]
  27. Joyce, R.J.; Janowiak, J.E.; Arkin, P.A.; Xie, P. CMORPH: A method that produces global precipitation estimates from passive microwave and infrared data at high spatial and temporal resolution. J. Hydrometeorol. 2004, 5, 487–503. [Google Scholar] [CrossRef]
  28. Xie, P.; Joyce, R.; Wu, S.; Yoo, S.-H.; Yarosh, Y.; Sun, F.; Lin, R. Reprocessed, Bias-Corrected CMORPH Global High-Resolution Precipitation Estimates from 1998. J. Hydrometeorol. 2017, 18, 1617–1641. [Google Scholar] [CrossRef]
  29. Zhang, J.; Howard, K.W.; Langston, C.; Kaney, B.; Qi, Y.; Tang, L.; Grams, H.; Wang, Y.; Cocks, S.; Martinaitis, S.M.; et al. Multi-Radar Multi-Sensor (MRMS) Quantitative Precipitation Estimation: Initial Operating Capabilities. Bull. Am. Meteorol. Soc. 2016, 97, 621–638. [Google Scholar] [CrossRef]
  30. Zhang, J.; Qi, Y.; Langston, C.; Kaney, B. Radar Quality Index (RQI)—A combined measure for beam blockage and VPR effects in a national network. Weather Radar Hydrol. 2012, 351, 388–393. [Google Scholar]
  31. World Meteorological Organization. 2021. Available online: https://public.wmo.int/en (accessed on 20 December 2021).
  32. Purnell, D.J.; Kirshbaum, D.J. Synoptic Control over Orographic Precipitation Distributions during the Olympics Mountains Experiment (OLYMPEX). Mon. Weather Rev. 2018, 146, 1023–1044. [Google Scholar] [CrossRef]
  33. Zhang, Z.; Ralph, F.M.; Zheng, M. The Relationship Between Extratropical Cyclone Strength and Atmospheric River Intensity and Position. Geophys. Res. Lett. 2019, 46, 1814–1823. [Google Scholar] [CrossRef]
  34. Minobe, S.; Kuwano-Yoshida, A.; Komori, N.; Xie, S.-P.; Small, R.J. Influence of the Gulf Stream on the troposphere. Nature 2008, 452, 206–209. [Google Scholar] [CrossRef] [PubMed] [Green Version]
  35. Davies, R. USA—Deadly Flash Floods in North Carolina. Floodlist. 13 November 2020. Available online: https://floodlist.com/america/usa/north-carolina-floods-november-2020 (accessed on 16 December 2021).
  36. Ji, H.; Peng, D.; Gu, Y.; Liang, Y.; Luo, X. Evaluation of multiple satellite precipitation products and their potential utilities in the Yarlung Zangbo River Basin. Sci. Rep. 2022, 12, 13334. [Google Scholar] [CrossRef]
  37. Cui, W.; Dong, X.; Xi, B.; Feng, Z.; Fan, J. Can the GPM IMERG Final Product Accurately Represent MCSs’ Precipitation Characteristics over the Central and Eastern United States? J. Hydrometeorol. 2020, 21, 39–57. [Google Scholar] [CrossRef]
  38. Wang, J.; Petersen, W.; Wolff, D. Validation of Satellite-Based Precipitation Products from TRMM to GPM. Remote Sens. 2021, 13, 1745. [Google Scholar] [CrossRef]
  39. Martinaitis, S.M.; Cocks, S.B.; Simpson, M.J.; Osborne, A.P.; Harkema, S.S.; Grams, H.M.; Zhang, J.; Howard, K.W. Advancements and Characteristics of Gauge Ingest and Quality Control within the Multi-Radar Multi-Sensor System. J. Hydrometeorol. 2021, 22, 2455–2474. [Google Scholar] [CrossRef]
  40. Bytheway, J.L.; Hughes, M.; Mahoney, K.; Cifelli, R. A Multiscale Evaluation of Multisensor Quantitative Precipitation Estimates in the Russian River Basin. J. Hydrometeorol. 2019, 20, 447–466. [Google Scholar] [CrossRef]
Figure 1. The study regions: (a) coastal land and coastal water (20°N to 55°N, 60°W to 130°W) highlighted in pink; (b) Great Lakes (40°N to 52°N, 80°W to 93°W); and (c) Gulf of Mexico (22°N to 32°N, 78°W to 100°W).
Remotesensing 14 04557 g001
Figure 2. The spatial distribution of (a) MRMS precipitation climatology (mm/day) and (b) extreme precipitation (R99p; mm/year) from 2018 to 2020, and (c) the coastal cross-section of MRMS precipitation climatology (mm/day) averaged over all the CONUS coastlines (including the Great Lakes region). The results from four satellite products are also shown in (c). The error bars show the standard deviation of each product’s 3-year-averaged precipitation at all grids in each distance bin.
Remotesensing 14 04557 g002
Figure 3. The cross-sections of seasonal precipitation climatology (mm/day) for the period 2018–2020: (a) spring; (b) summer; (c) autumn; and (d) winter.
Remotesensing 14 04557 g003
Figure 4. (a) The mean bias (mm/day), (b) MAE (mm/day), and (c) R2 over all CONUS coastlines (including the Great Lakes region) for the monthly climatology from January 2018 to December 2020 shown as cross-section plots. The error bars show the standard deviation of each satellite product’s 3-year-averaged precipitation at all grids in each distance bin.
Remotesensing 14 04557 g004
Figure 5. The mean bias spatial distribution of (a) the precipitation climatology (mm/day) and (b) the extreme precipitation (R99p; mm/year) of IMERG-F from 2018 to 2020 against that of MRMS. (c,d) The same as (a,b), but for IMERG-L.
Remotesensing 14 04557 g005
Figure 6. Histogram of the ratio of satellite precipitation products vs. MRMS (in percentages) as a function of different MRMS precipitation bins and distance-to-coastline bins over land and ocean. (a) IMERG-L, (b) IMERG-F, (c) PERSIANN, (d) CMORPH, and (e) the base −10 logarithm of histogram counts of MRMS daily precipitation (re-gridded to IMERG’s resolution). Gray indicates no data.
Remotesensing 14 04557 g006
Figure 7. The progression (from top to bottom) of the daily accumulated precipitation (mm/day) associated with a cold front from 10 to 13 November 2020, using results from MRMS, IMERG-F, PERSIANN, and CMORPH (left to right, respectively), where all products were re-gridded to the resolution of CMORPH (0.25°) for comparison.
Remotesensing 14 04557 g007
Figure 8. The error statistics of the three satellite products against MRMS data over the ocean and land (as shown in Figure 7).
Remotesensing 14 04557 g008
Figure 9. Cross-sections of seasonal mean bias (mm/day) for IMERG-F from 2018 to 2020 at the Gulf of Mexico.
Remotesensing 14 04557 g009
Figure 10. Comparison of daily precipitation (mm/day) from MRMS with and without gauge correction for 2018. (a) Cross-sections of precipitation for pixels along the coastline; (b) spatial differences of MRMS climatology without gauge correction minus GC–MRMS climatology; (c) the same as (b), but for R99p.
Remotesensing 14 04557 g010
Figure 11. Comparison of mean RQI in (a) winter (DJF) and (b) summer (JJA) from 2018 to 2020.
Remotesensing 14 04557 g011
Figure 12. Comparison of the daily precipitation (mm/day) from two versions of MRMS (as used in this study and in the study by Derin et al. in 2022) for June 2018. (a) Cross-sections of precipitation for pixels along the coastline, and (b) the spatial precipitation differences (this study compared with the study by Derin et al.).
Remotesensing 14 04557 g012
Table 1. Basic information of the four satellite precipitation products.
ProductsTemporal ResolutionSpatial ResolutionSensorBias Correction (Land) Bias Correction (Ocean)
IMERG-F V06Daily0.1°Radar, MW, and IRGPCP & GPCCGPCP
IMERG-L V06Daily0.1°Radar, MW, and IRGPCPGPCP
PERSIANNDaily0.04°IRGPCPGPCP
CMORPHDaily0.25°MW and IRCPCGPCP
Table 2. The mean bias (MB; mm/day), mean absolute error (MAE; mm/day), coefficient of determination (R2) of monthly precipitation, and MB of extreme precipitation (R99p; mm/year) from the four satellite products over coastal water and land, and their (ocean–land) differences. The bold values indicate that the differences between ocean and land are significant using Welch’s t-test.
ProductMB (mm/day)MAE (mm/day)
LandOceanDifferenceLandOceanDifference
IMERG-F0.100.950.850.731.330.60
IMERG-L0.611.140.531.321.530.21
PERSIANN0.220.500.281.131.220.09
CMORPH−0.650.351.001.111.03−0.08
ProductR2 (−)MB (R99p; mm/yr)
LandOceanDifferenceLandOceanDifference
IMERG-F0.710.64−0.0730.82123.8693.04
IMERG-L0.470.580.1193.92145.2051.28
PERSIANN0.480.510.0330.5358.0527.52
CMORPH0.520.690.1711.4761.6050.13
Publisher’s Note: MDPI stays neutral with regard to jurisdictional claims in published maps and institutional affiliations.

