
Retrieval of Aerosol Optical Properties over Land Using an Optimized Retrieval Algorithm Based on the Directional Polarimetric Camera
Abstract
:
1. Introduction
2. Data Description
2.1. The Introduction of DPC
2.2. AERONET Aerosol Products
2.3. MODIS and AIRS Products
3. Aerosol Retrieval Algorithm Description
3.1. Radiative Transfer
3.2. State Vector
3.3. Surface Reflectance Model
3.4. Inversion
4. Validation against AERONET Measurements
4.1. AOD
4.2. Fine Mode AOD
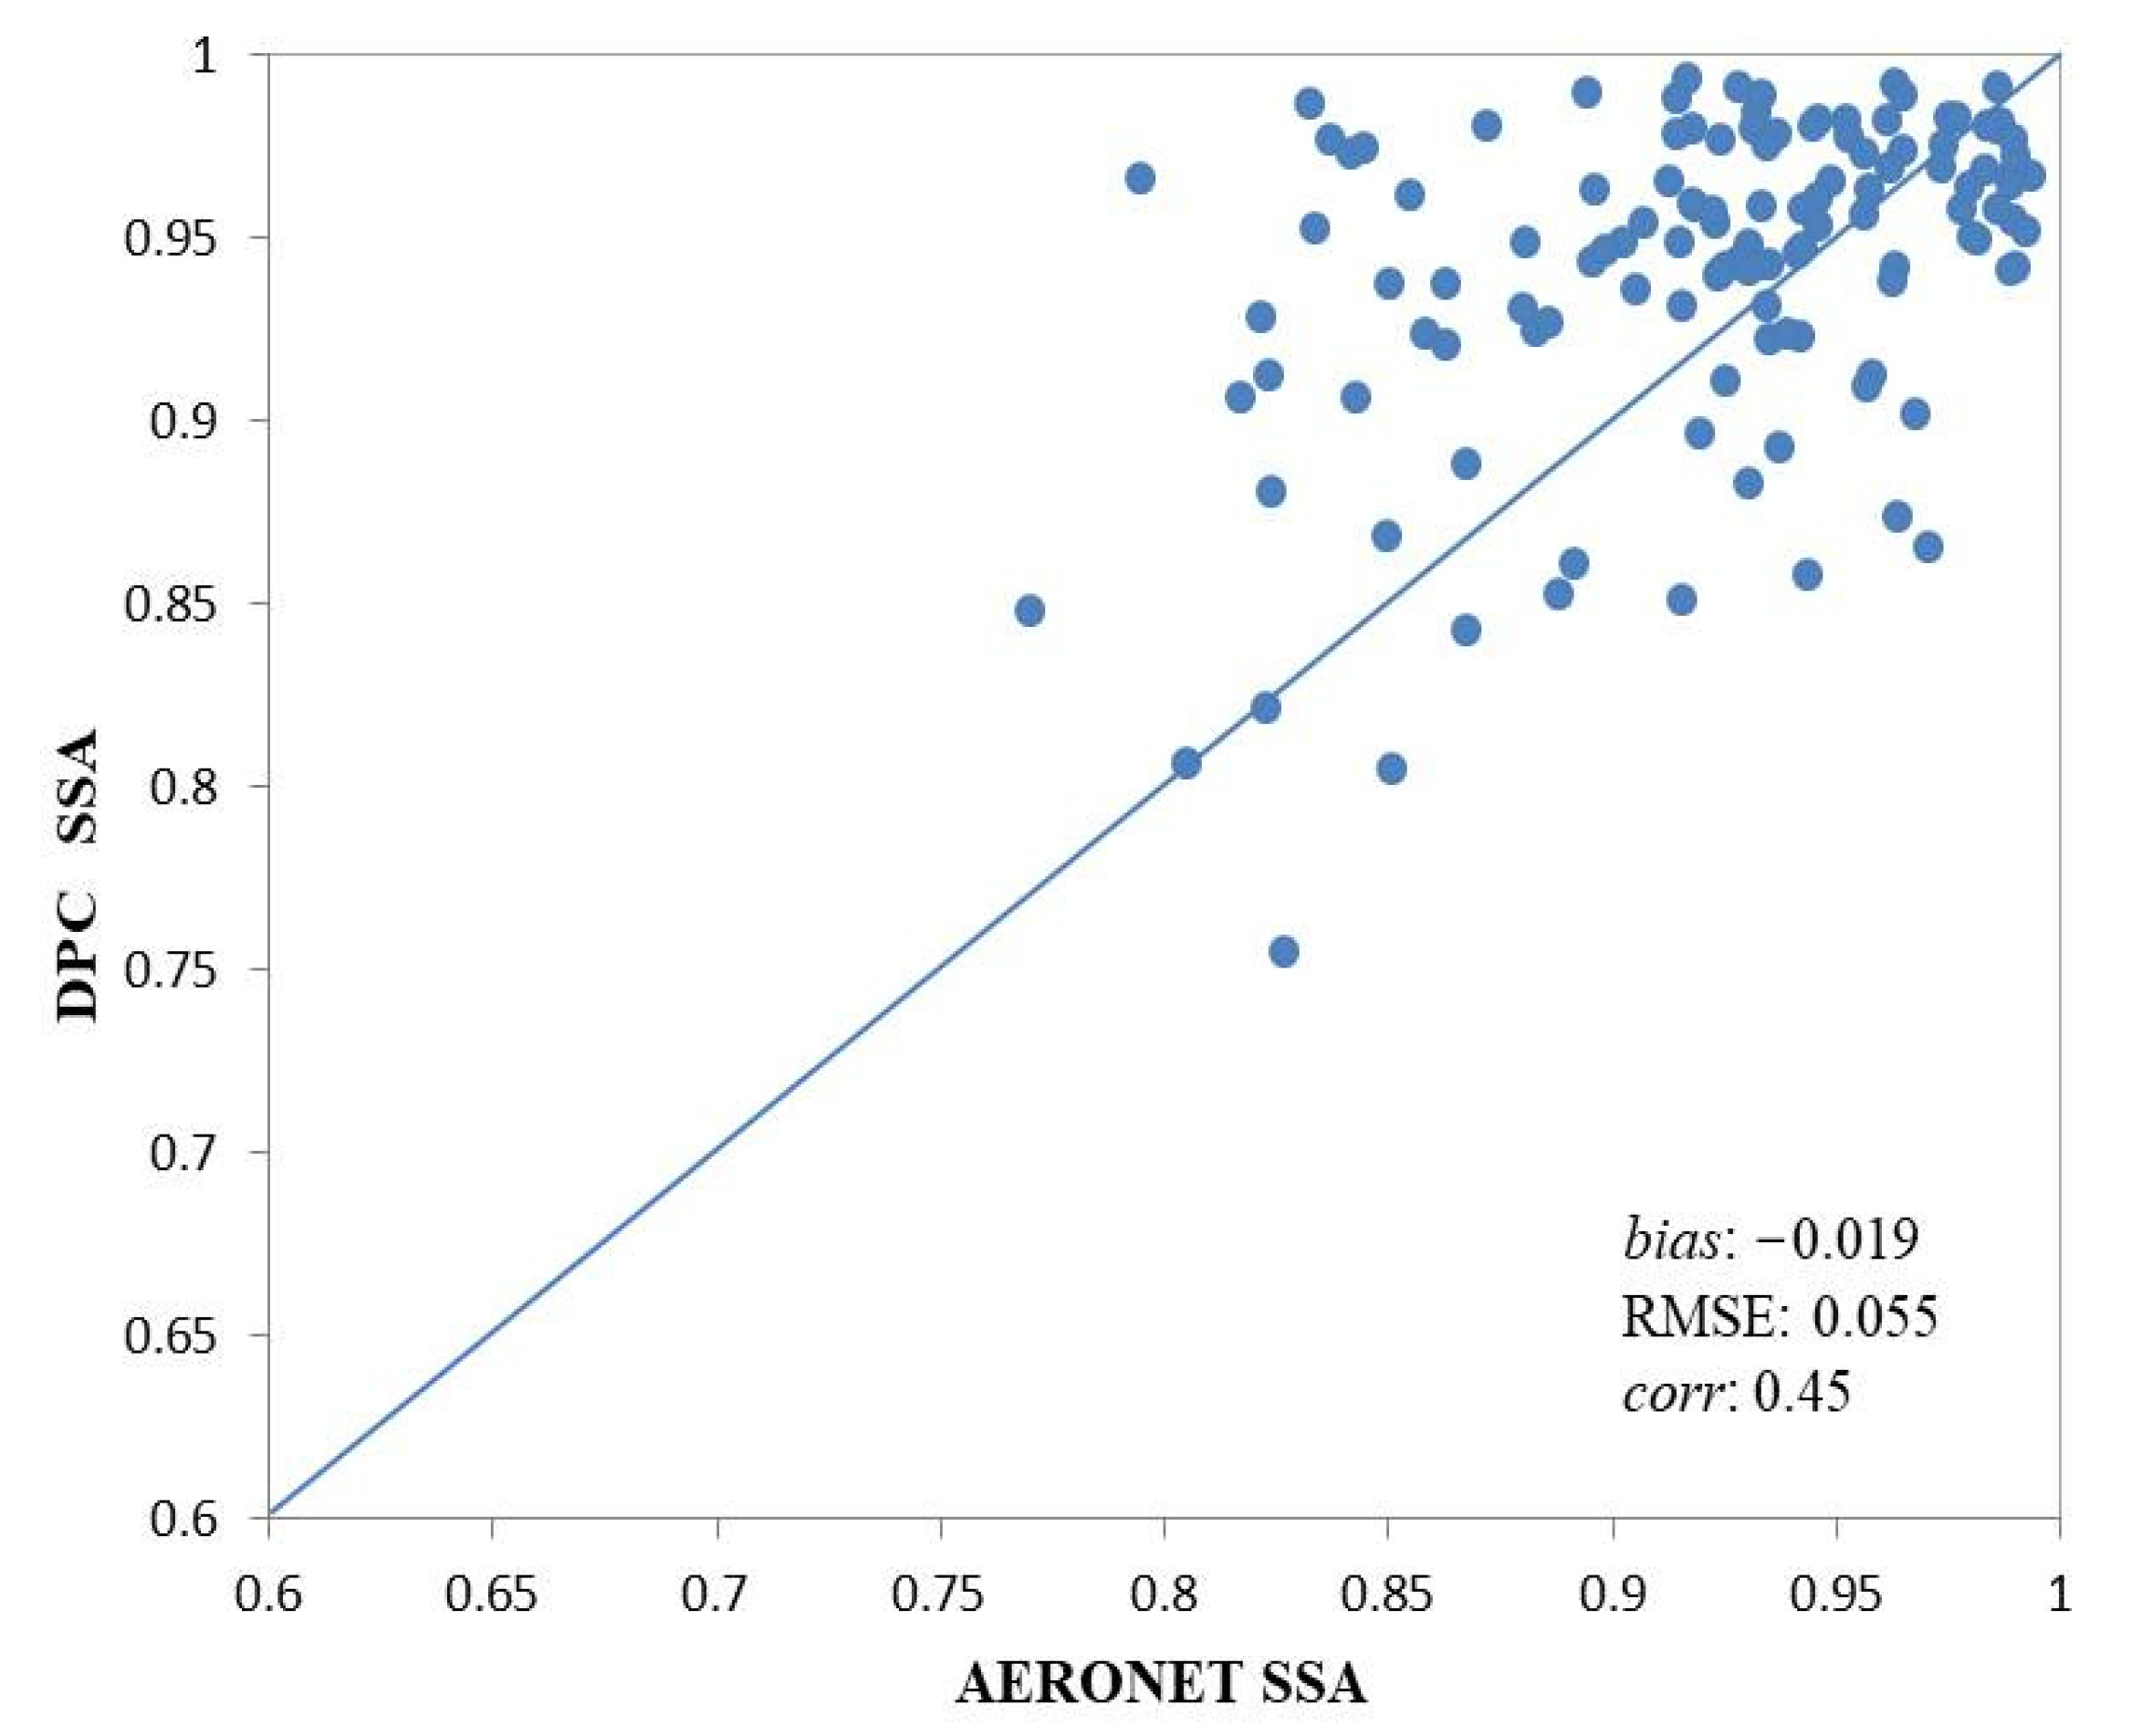
4.3. Single Scattering Albedo (SSA)
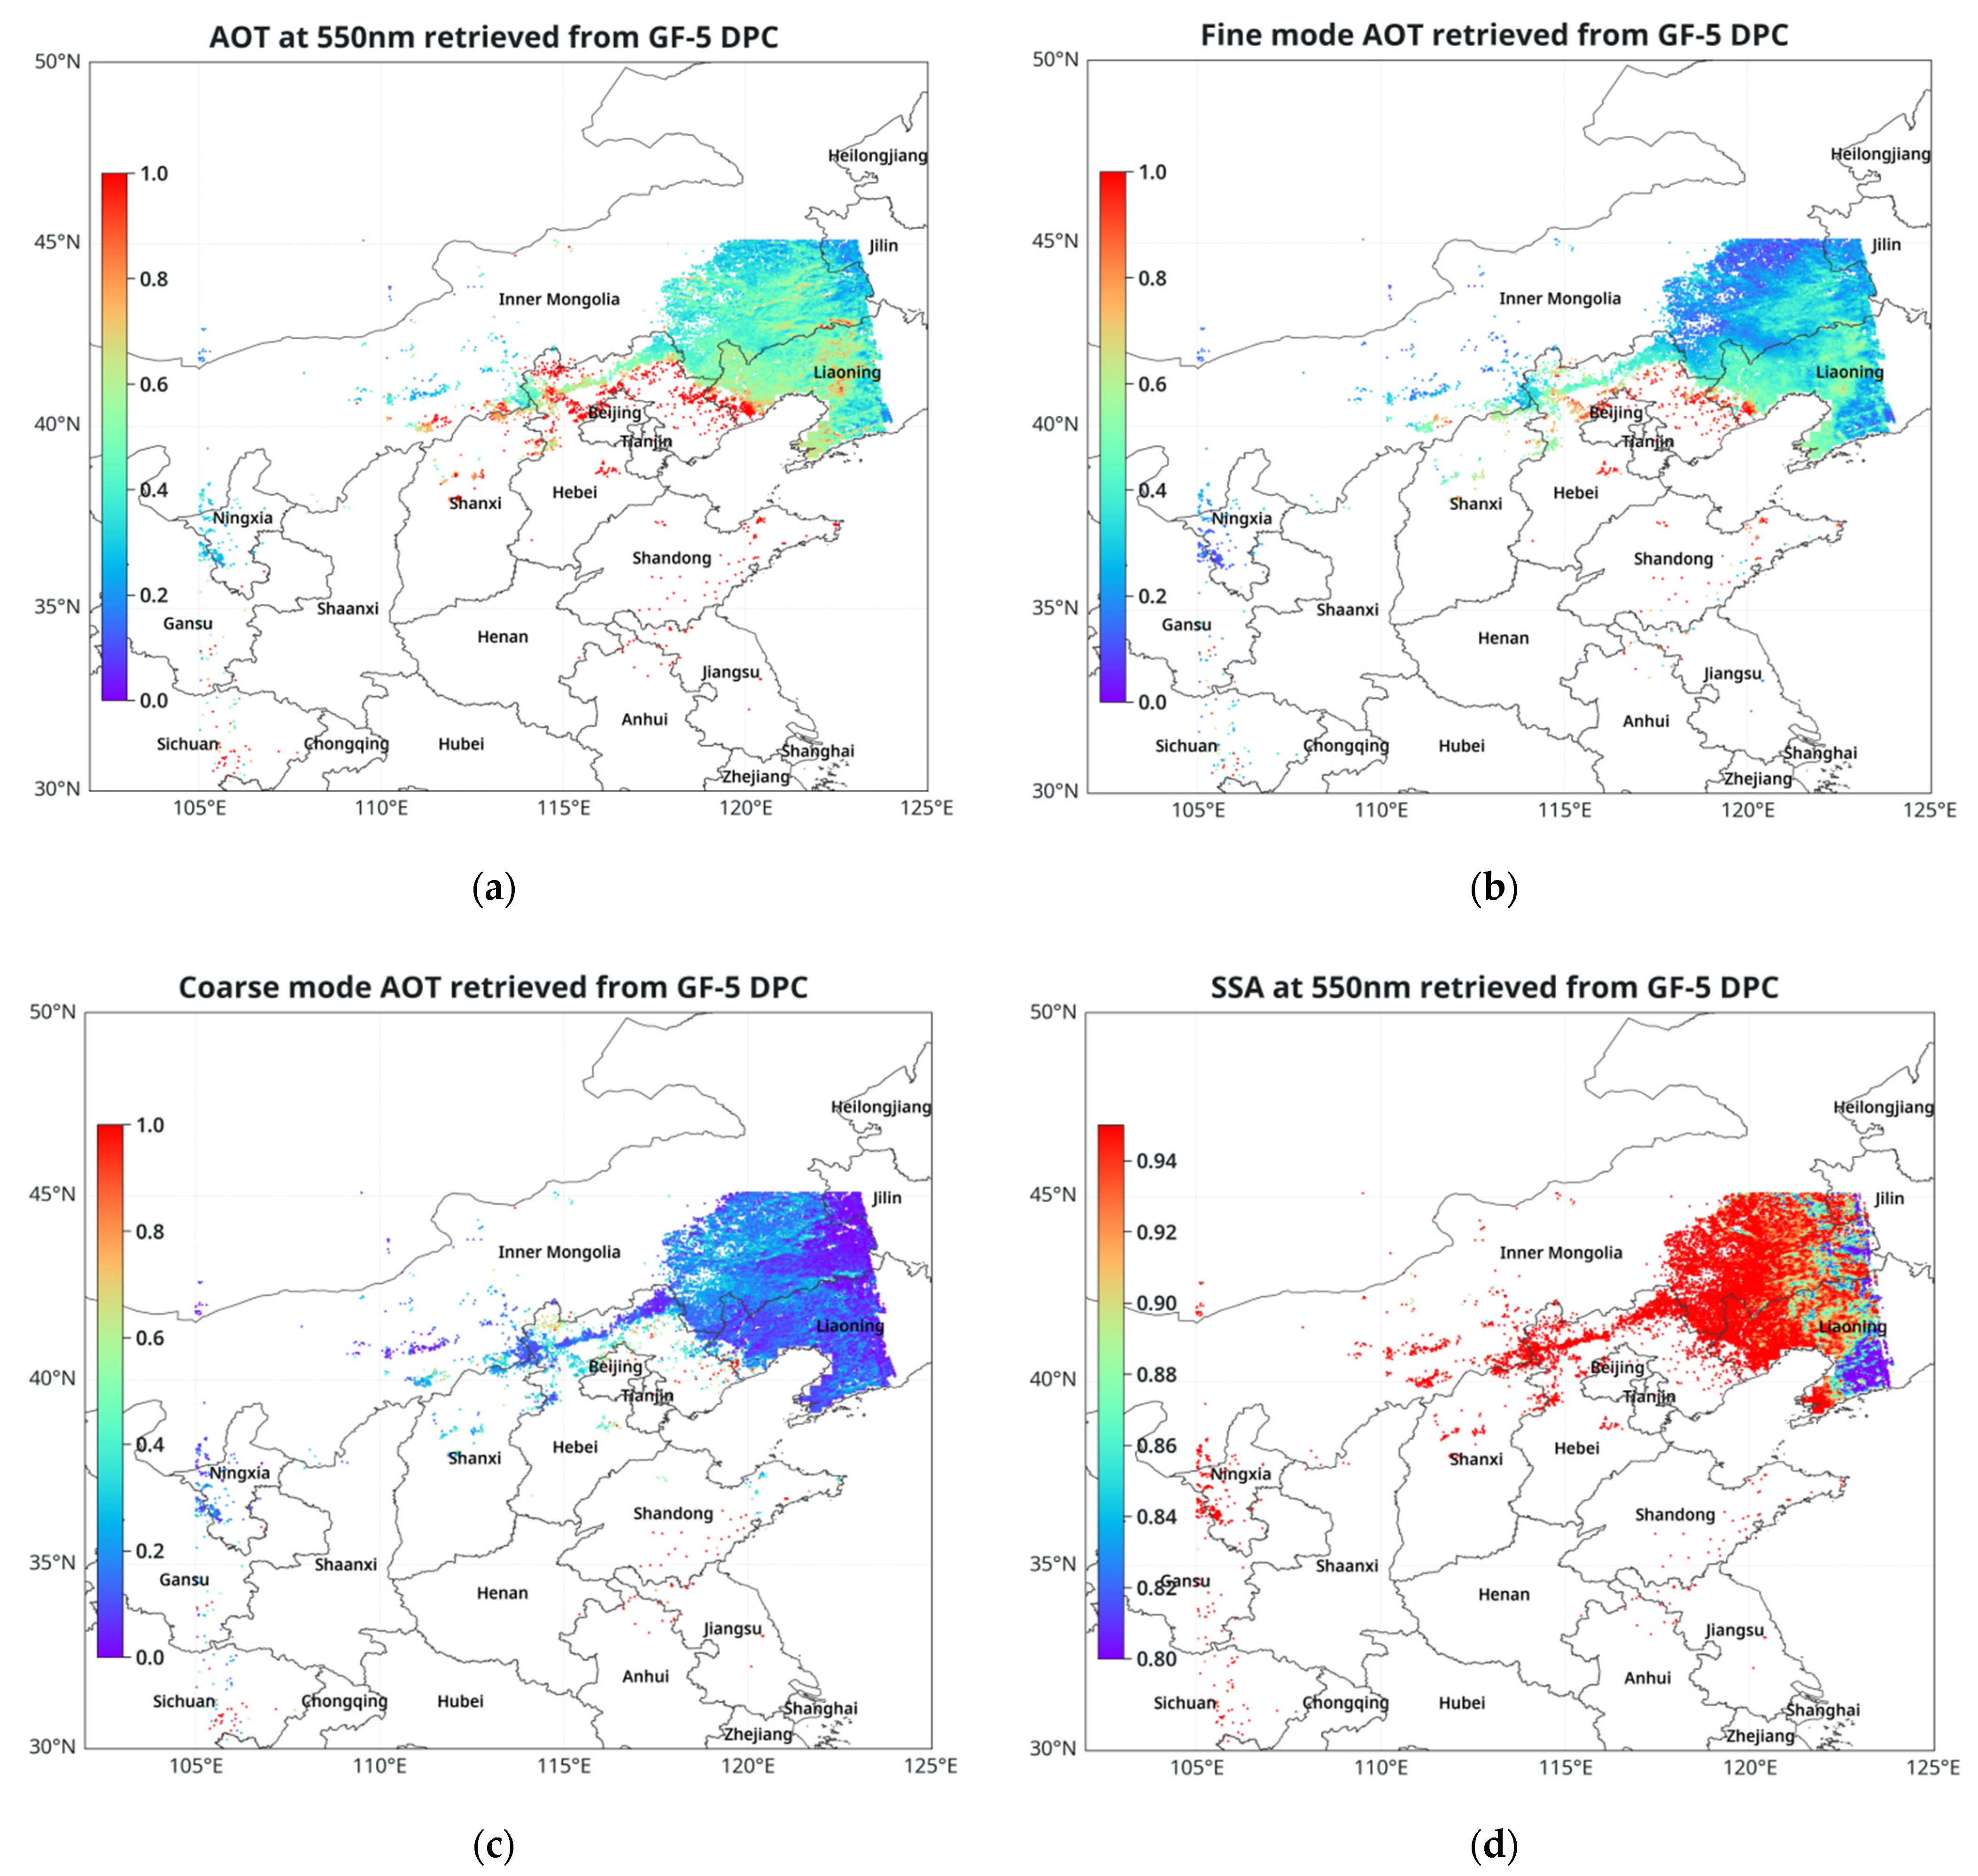
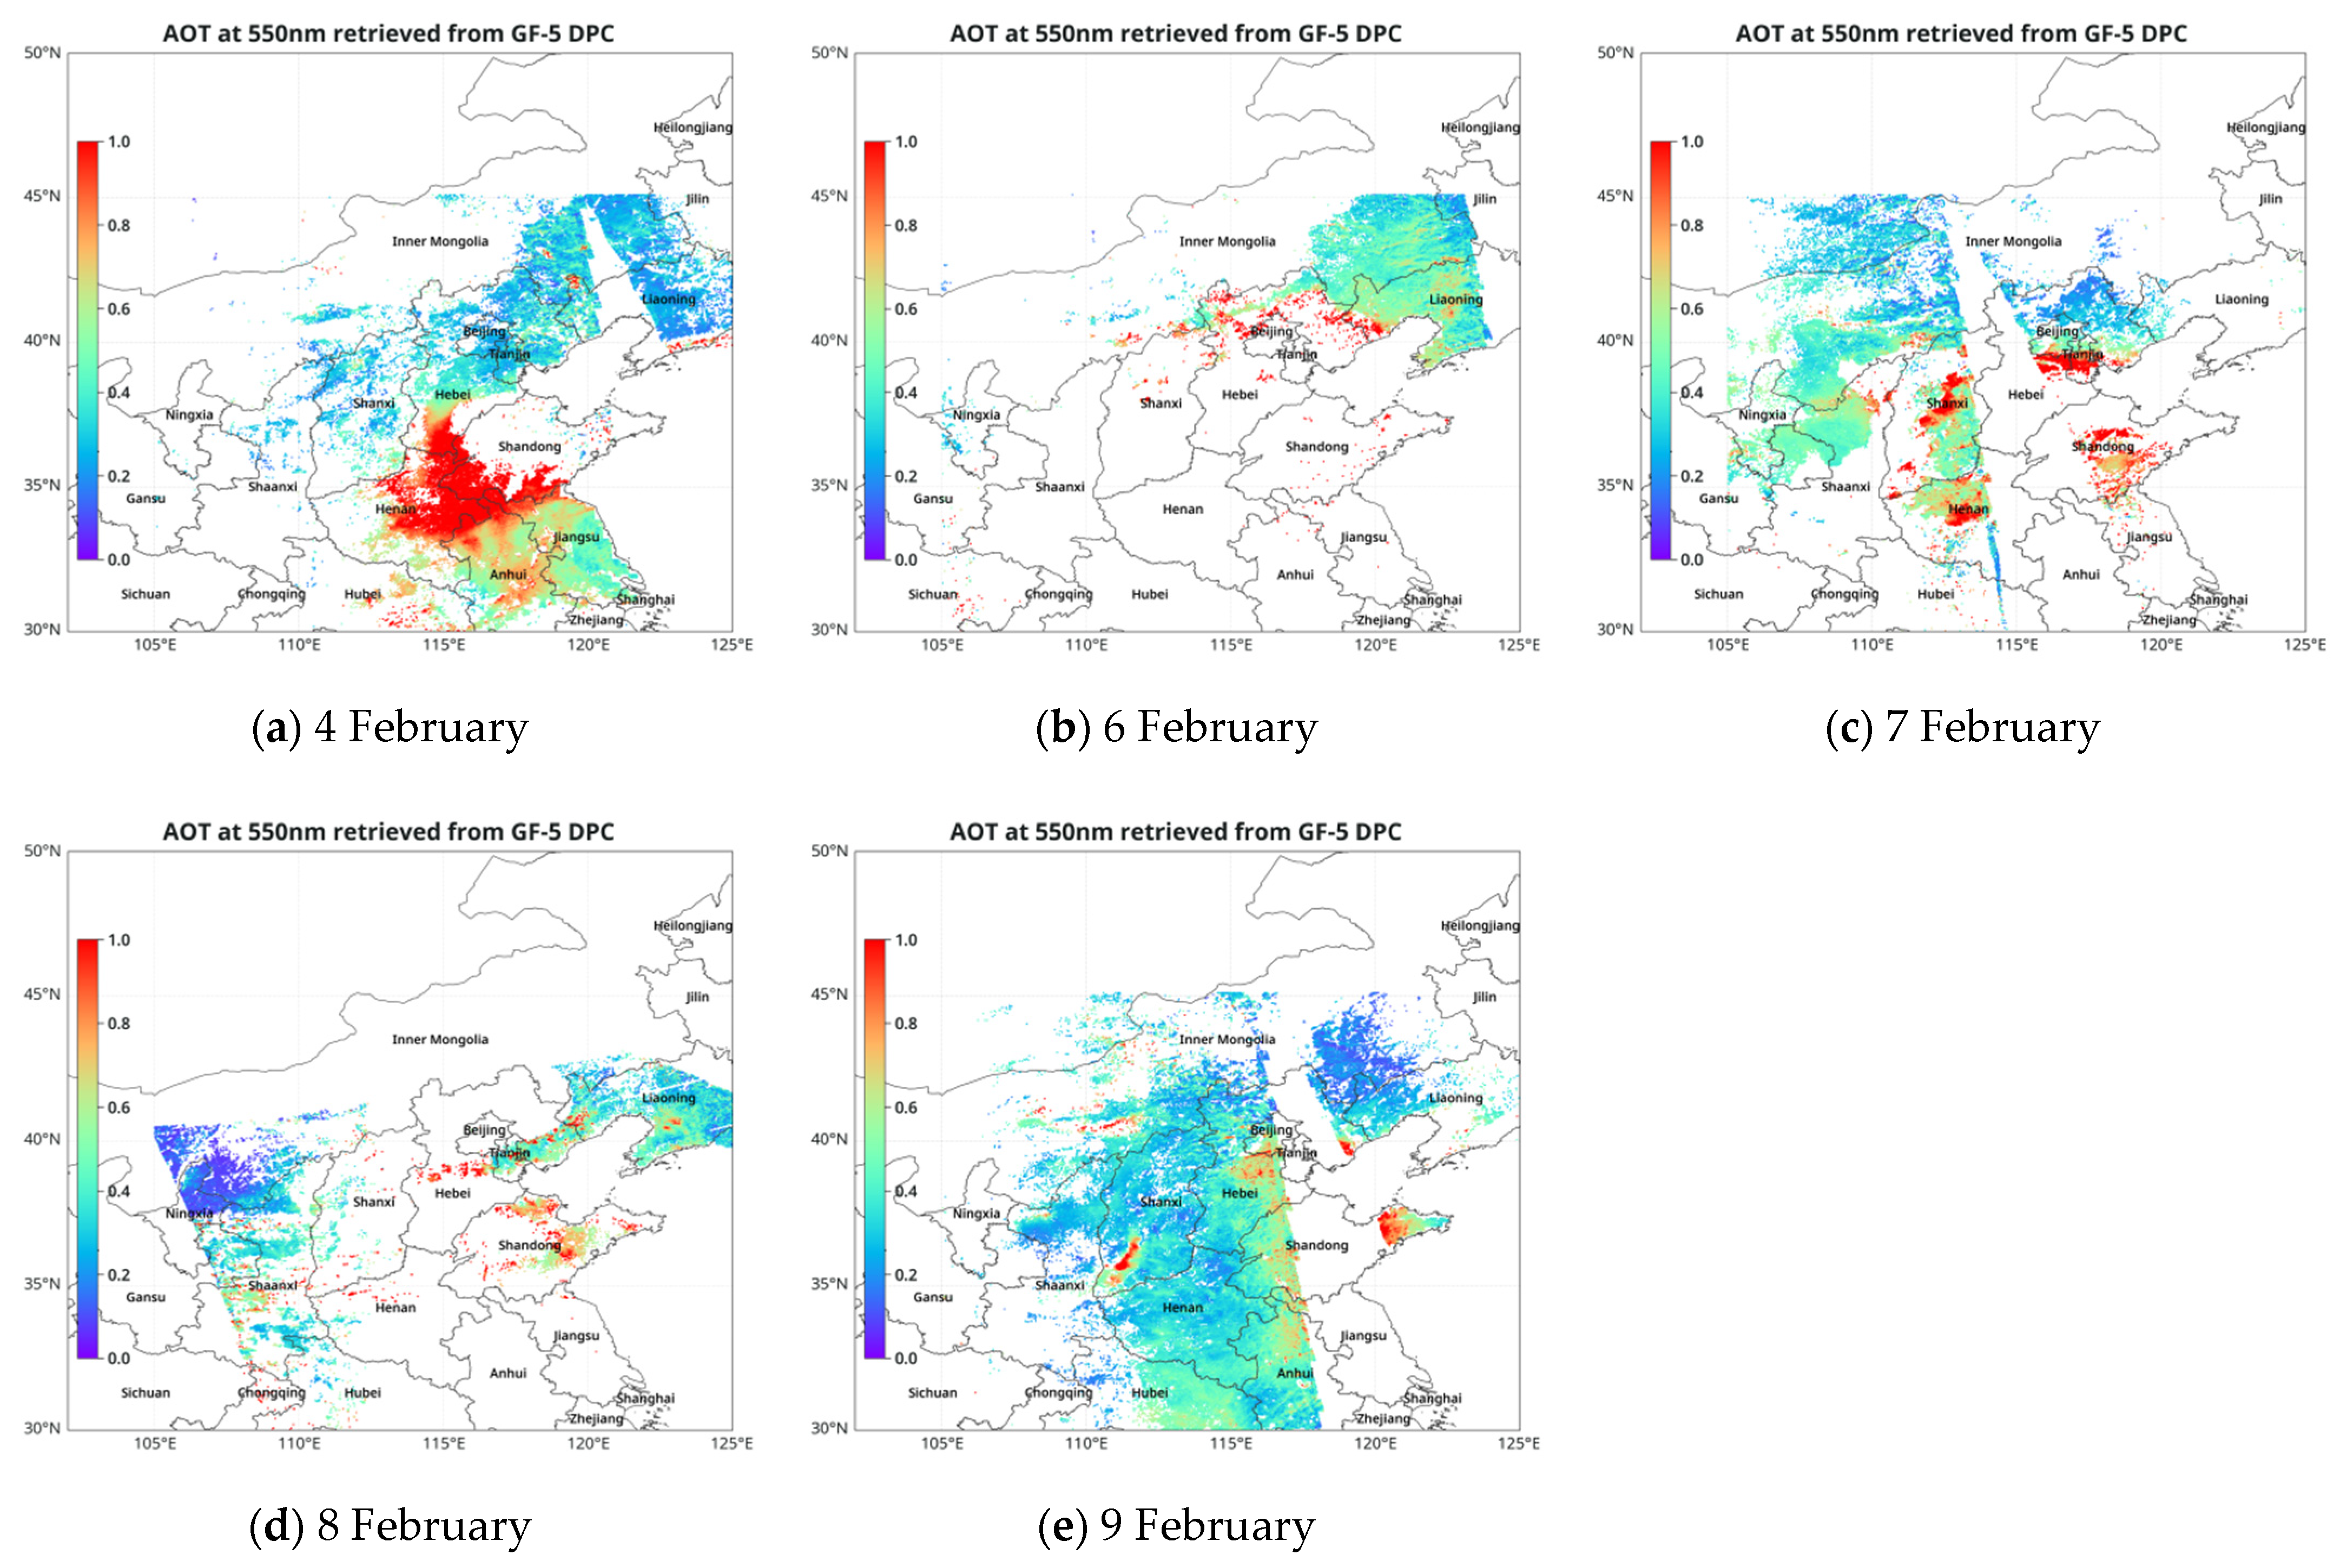
5. Case Studies
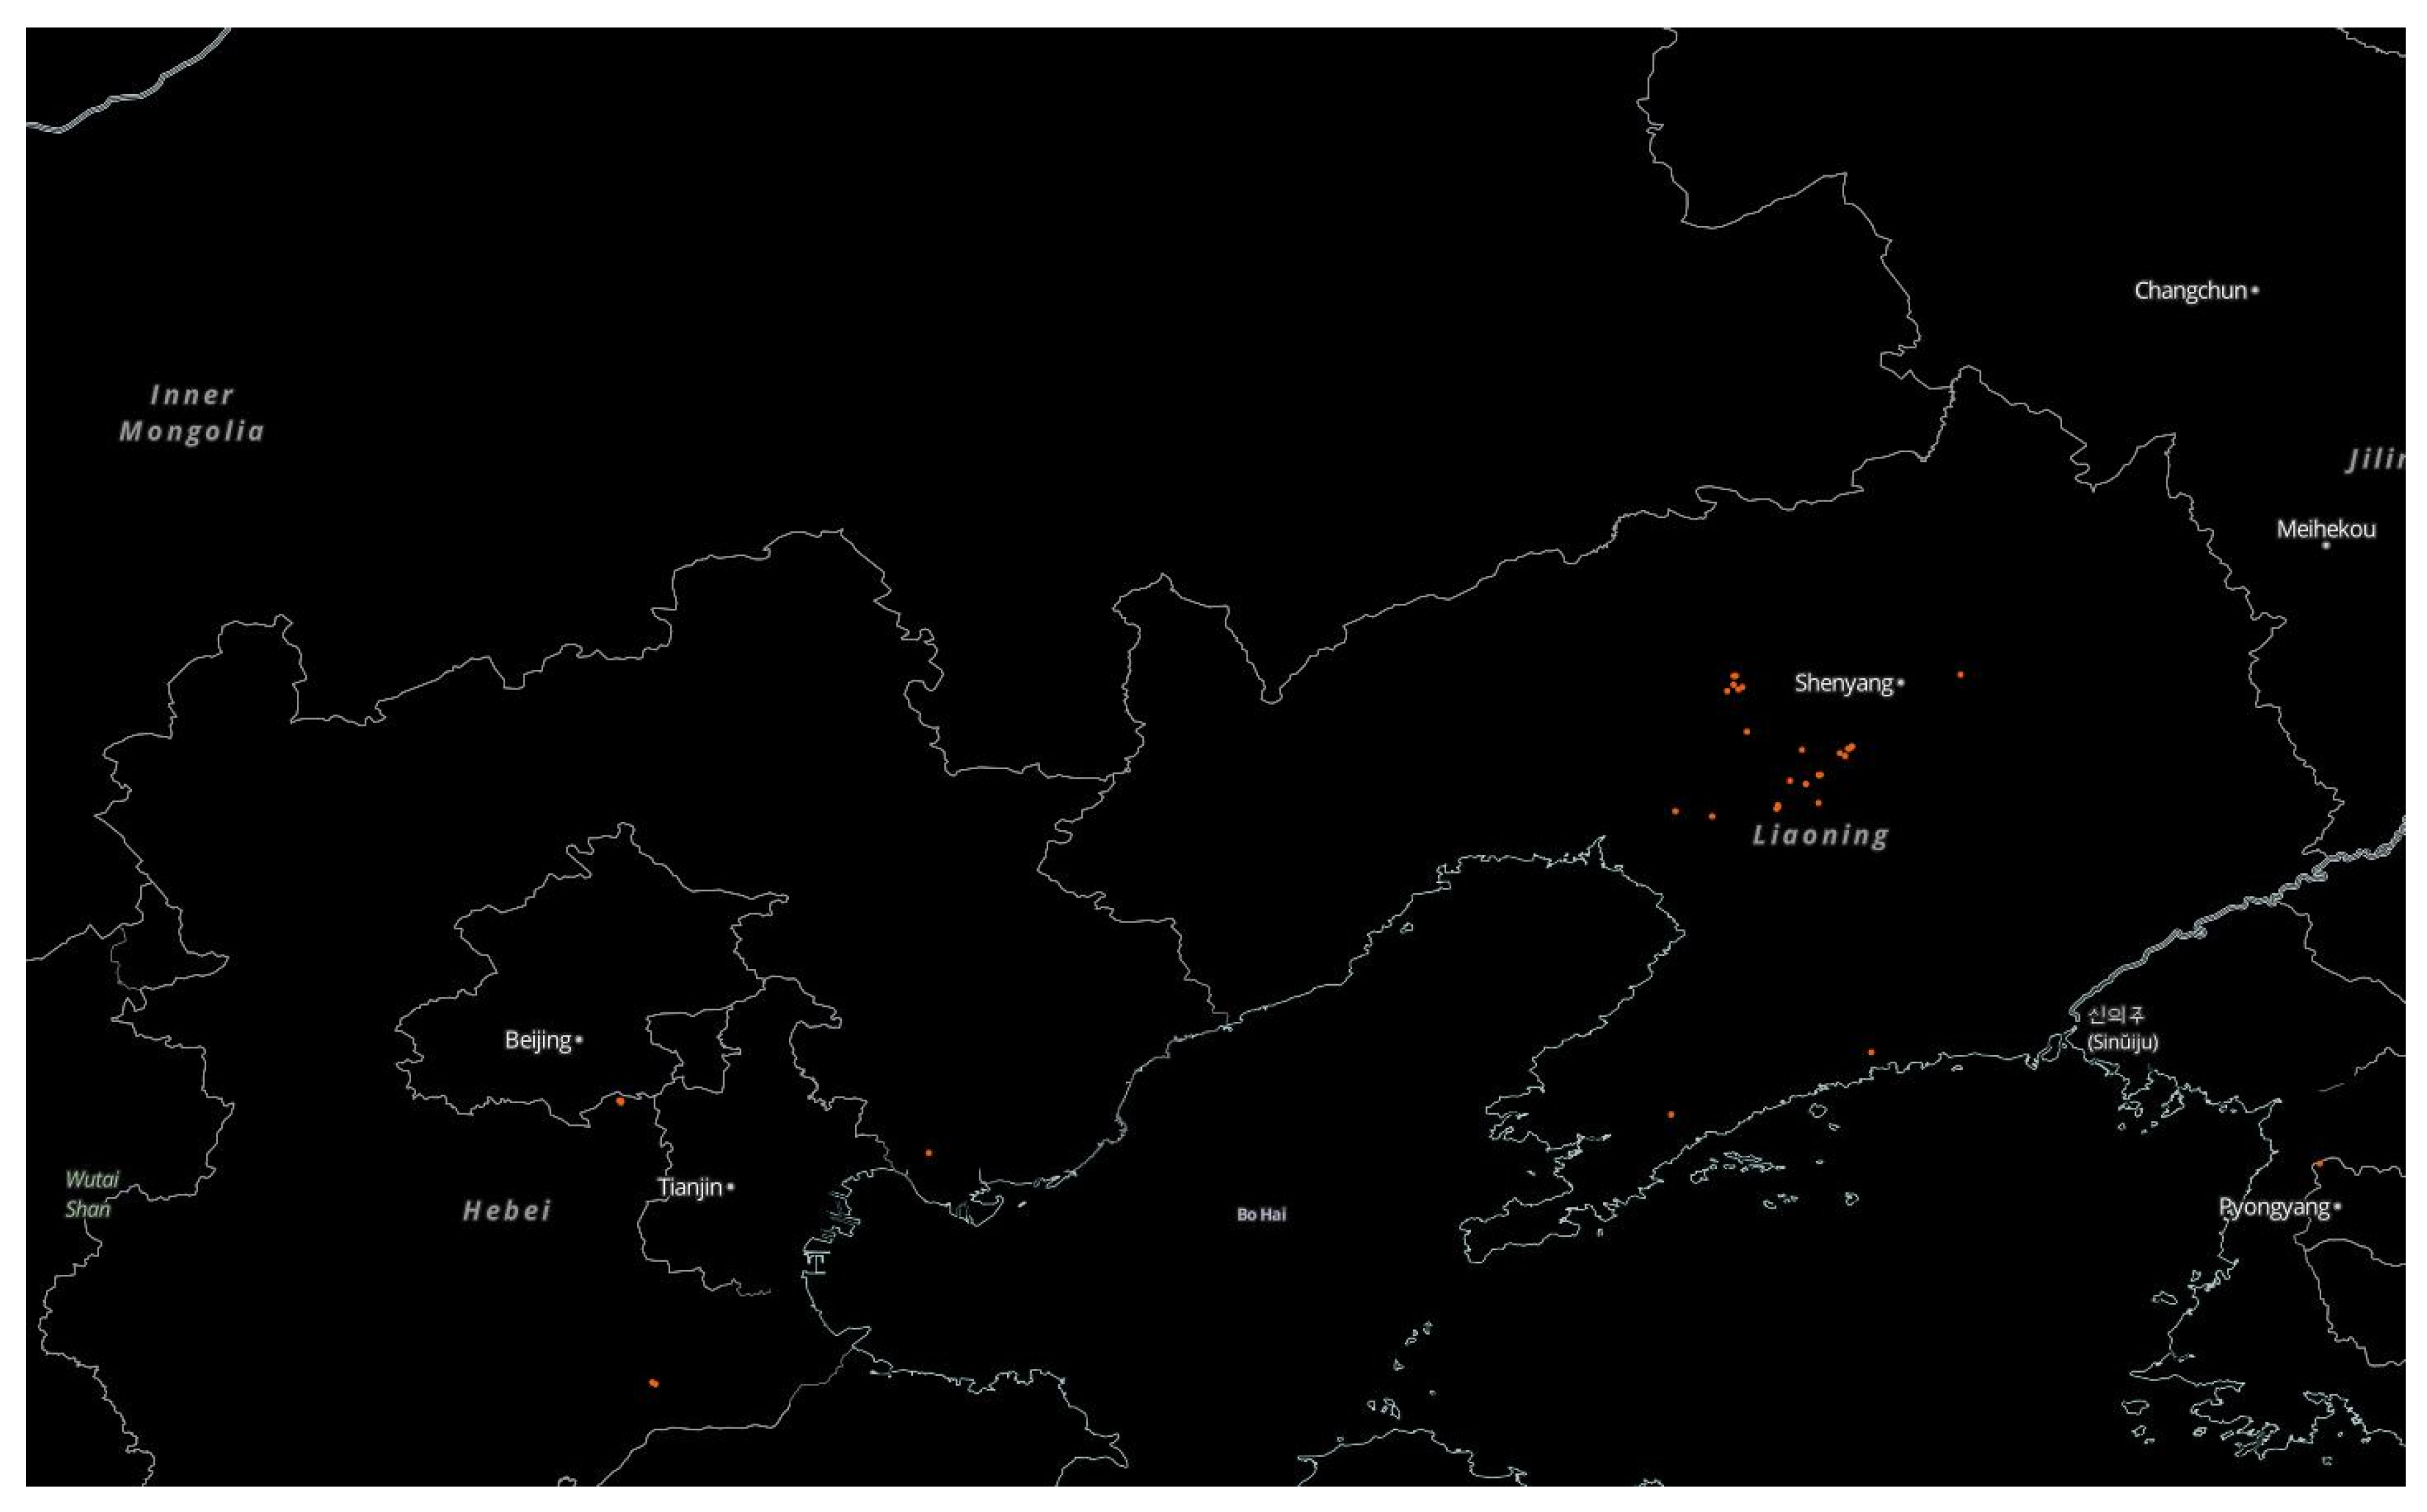
5.1. Fire and Dust
5.2. Fire Only
5.3. Discussion
6. Conclusions
Author Contributions
Funding
Data Availability Statement
Acknowledgments
Conflicts of Interest
References
- Sano, I.; Mukai, S. Investigation of air pollution and regional climate change due to anthropogenic aerosols. In Remote Sensing Technologies and Applications in Urban Environments; SPIE: Bellingham, WA, USA, 2016; pp. 305–310. [Google Scholar]
- Degrendele, C.; Okonski, K.; Melymuk, L.; Landlová, L.; Kukučka, P.; Čupr, P.; Klánová, J. Size specific distribution of the atmospheric particulate PCDD/Fs, dl-PCBs and PAHs on a seasonal scale: Implications for cancer risks from inhalation. Atmos. Environ. 2014, 98, 410–416. [Google Scholar] [CrossRef]
- Mishchenko, M.; Cairns, B.; Kopp, G.; Schueler, C.F.; Fafaul, B.; Hansen, J.; Hooker, J.; Itchkawich, T.; Maring, H.; Travis, L.D. Accurate monitoring of terrestrial aerosols and total solar irradiance: Introducing the Glory Mission. Bull. Am. Meteorol. Soc. 2007, 88, 677–691. [Google Scholar] [CrossRef]
- Hasekamp, O.P.; Gryspeerdt, E.; Quaas, J. Analysis of polarimetric satellite measurements suggests stronger cooling due to aerosol-cloud interactions. Nat. Commun. 2019, 10, 5405. [Google Scholar] [CrossRef] [PubMed]
- Mishchenko, M.I.; Travis, L.D. Satellite retrieval of aerosol properties over the ocean using polarization as well as intensity of reflected sunlight. J. Geophys. Res. 1997, 102, 16989–17013. [Google Scholar] [CrossRef]
- Hasekamp, O.P.; Landgraf, J. Retrieval of aerosol properties over land surfaces: Capabilities of multiple-viewing-angle intensity and polarization measurements. Appl. Opt. 2007, 46, 3332–3344. [Google Scholar] [CrossRef]
- Kokhanovsky, A.A. The modern aerosol retrieval algorithms based on the simultaneous measurements of the intensity and polarization of reflected solar light: A review. Front. Environ. Sci. 2015, 3, 4. [Google Scholar] [CrossRef]
- Fougnie, B.; Bracco, G.; Lafrance, B.; Ruffel, C.; Hagolle, O.; Tinel, C. PARASOL in-flight calibration and performance. Appl. Opt. 2007, 46, 5435–5451. [Google Scholar] [CrossRef]
- Tanré, D.; Bréon, F.M.; Deuzé, J.L.; Dubovik, O.; Ducos, F.; Francois, P.; Goloub, P.; Herman, M.; Lifermann, A.; Waquet, F. Remote sensing of aerosols by using polarized, directional and spectral measurements within the A-Train: The PARASOL mission. Atmos. Meas. Tech. 2011, 4, 1383–1395. [Google Scholar] [CrossRef]
- Li, Z.; Hou, W.; Hong, J.; Zheng, F.; Luo, D.; Wang, J.; Gu, X.; Qiao, Y. Directional Polarimetric Camera (DPC): Monitoring aerosol spectral optical properties over land from satellite observation. J. Quant. Spectrosc. Radiat. Transf. 2018, 218, 21–37. [Google Scholar]
- Huang, C.; Chang, Y.Y.; Xiang, G.F.; Han, L.; Chen, F.; Luo, D.G.; Li, S.; Sun, L.; Tu, B.H.; Meng, B.H.; et al. Polarization measurement accuracy analysis and improvement methods for the directional polarimetric camera. Opt. Express 2020, 28, 38638–38666. [Google Scholar] [CrossRef]
- Marbach, T.; Riedi, J.; Lacan, A.; Schlüssel, P. The 3MI mission: Multi-viewing-channel-polarisation imager of the EUMETSAT polar system: Second generation (EPS-SG) dedicated to aerosol and cloud monitoring. In Polarization Science and Remote Sensing VII; International Society for Optics and Photonics: Bellingham, WA, USA, 2015; Volume 9613, p. 961310. [Google Scholar]
- Fougnie, B.; Marbach, T.; Lacan, A.; Lang, R.; Schlüssel, P.; Poli, G.; Munro, R.; Couto, A.B. The multiviewing multi-channel multi-polarisation imager—Overview of the 3MI polarimetric mission for aerosol and cloud characterization. J. Quant. Spectrosc. Radiat. Transf. 2018, 219, 23–32. [Google Scholar] [CrossRef]
- Hasekamp, O.P.; Fu, G.; Rusli, S.P.; Wu, L.; Di Noia, A.; aan de Brugh, J.; Landgraf, J.; Martijn Smit, J.; Rietjens, J.; van Amerongen, A. Aerosol measurements by SPEXone on the NASA PACE mission: Expected retrieval capabilities. J. Quant. Spectrosc. Radiat. Transf. 2019, 227, 170–184. [Google Scholar] [CrossRef]
- Werdell, P.J.; Behrenfeld, M.J.; Bontempi, P.S.; Boss, E.; Cairns, B.; Davis, G.T.; Franz, B.A.; Gliese, U.B.; Gorman, E.T.; Hasekamp, O.; et al. The Plankton, Aerosol, Cloud, ocean Ecosystem (PACE) mission: Status, science, advances. Bull. Am. Meteorol. Soc. 2019, 100, 1775–1794. [Google Scholar] [CrossRef]
- Snik, F.; Karalidi, T.; Keller, C.U. Spectral modulation for full linear polarimetry. Appl. Opt. 2009, 48, 1337–1346. [Google Scholar] [CrossRef]
- Dubovik, O.; Li, Z.; Mishchenko, M.I.; Tanré, D.; Karol, Y.; Bojkov, B.; Cairns, B.; Diner, D.J.; Espinosa, W.R.; Goloub, P.; et al. Polarimetric remote sensing of atmospheric aerosols: Instruments, methodologies, results, and perspectives. J. Quant. Spectrosc. Radiat. Transfer 2019, 224, 474–511. [Google Scholar] [CrossRef]
- Herman, M.; Deuzé, J.L.; Devaux, C.; Goloub, P.; BréOn, F.M.; Tanré, D. Remote sensing of aerosols over land surfaces including polarization measurements and application to POLDER measurements. J. Geophys. Res. 1997, 102, 17039–17049. [Google Scholar] [CrossRef]
- Deuzé, J.L.; Goloub, P.; Herman, M.; Marchand, A.; Perry, G.; Susana, S.; Tanré, D. Estimate of the aerosol properties over the ocean with POLDER. J. Geophys. Res. 2000, 105, 15329–15346. [Google Scholar] [CrossRef]
- Deuzé, J.L.; BréOn, F.M.; Devaux, C.; Goloub, P.; Herman, M.; Lafrance, B.; Maignan, F.; Marchand, A.; Nadal, F.; Perry, G.; et al. Remote sensing of aerosols over land surfaces from POLDER-ADEOS-1 polarized measurements. J. Geophys. Res. 2001, 106, 4913–4926. [Google Scholar] [CrossRef]
- Dubovik, O.; Herman, M.; Holdak, A.; Lapyonok, T.; Tanré, D.; Deuzé, J.L.; Ducos, F.; Sinyuk, A.; Lopatin, A. Statistically optimized inversion algorithm for enhanced retrieval of aerosol properties from spectral multi-angle polarimetric satellite observations. Atmos. Meas. Tech. 2011, 4, 975–1018. [Google Scholar] [CrossRef]
- Hasekamp, O.P. Capability of multi-viewing-angle photopolarimetric measurements for the simultaneous retrieval of aerosol and cloud properties. Atmos. Meas. Tech. 2010, 3, 839–851. [Google Scholar] [CrossRef]
- Fu, G.; Hasekamp, O. Retrieval of aerosol microphysical and optical properties over land using a multimode approach. Atmos. Meas. Tech. 2018, 11, 6627–6650. [Google Scholar] [CrossRef] [Green Version]
- Xu, F.; van Harten, G.; Diner, D.J.; Kalashnikova, O.V.; Seidel, F.C.; Bruegge, C.J.; Dubovik, O. Coupled retrieval of aerosol properties and land surface reflection using the Airborne Multiangle SpectroPolarimetric Imager. J. Geophys. Res. Atmos. 2017, 122, 7004–7026. [Google Scholar] [CrossRef]
- Wu, L.H.; Hasekamp, O.P.; van Diedenhoven, B.; Cairns, B. Aerosol retrieval from multiangle, multispectral photopolarimetric measurements: Importance of spectral range and angular resolution. Atmos. Meas. Tech. 2015, 8, 2625–2638. [Google Scholar] [CrossRef]
- Kang, Q.; Yuan, Y.L.; Li, J.J.; Zhai, W.C.; Wu, H.Y.; Hong, J.; Zheng, X.B. Effect of divergence angle of polarization calibration source on DPC polarization calibration: Analysis and validation. J. Remote Sens. 2018, 22, 203–210. (In Chinese) [Google Scholar]
- Huang, C.; Xiang, G.F.; Chang, Y.Y.; Han, L.; Zhang, M.M.; Li, S.; Tu, B.H.; Meng, B.H.; Hong, J. Pre-flight calibration of a multi-angle polarimetric satellite sensor directional polarimetric camera. Opt. Express 2020, 28, 13187–13215. [Google Scholar] [CrossRef] [PubMed]
- Hagolle, O.; Goloub, P.; Deschamps, P.Y.; Cosnefroy, H.; Briottet, X.; Bailleul, T.; Nicolas, J.M.; Parol, F.; Lafrance, B.; Herman, M. Results of POLDER in-flight calibration. IEEE Trans. Geosci. Remote Sens. 1999, 37, 1550–1566. [Google Scholar] [CrossRef]
- Huang, C.; Zhang, M.; Chang, Y.; Chen, F.; Han, L.; Meng, B.; Hong, J.; Luo, D.; Li, S.; Sun, L.; et al. Directional polarimetric camera stray light analysis and correction. Appl. Opt. 2019, 58, 7042–7049. [Google Scholar] [CrossRef]
- Holben, B.N.; SmirnovA, T.; Eck, T.F.; Slutsker, I.; Abuhassan, N.; Newcomb, W.W.; Schafer, J.S.; Chatenet, B.; Lavenu, F.; Kaufman, Y.J.; et al. An emerging ground-based aerosol climatology: Aerosol optical depth from AERONET. J. Geophys. Res. 2001, 106, 12067–12098. [Google Scholar] [CrossRef]
- Giles, D.M.; Sinyuk, A.; Sorokin, M.G.; Schafer, J.S.; Smirnov, A.; Slutsker, I.; Eck, T.F.; Holben, B.N.; Lewis, J.R.; Campbell, J.R.; et al. Advancements in the Aerosol Robotic Network (AERONET) Version 3 database—Automated near-real-time quality control algorithm with improved cloud screening for Sun photometer aerosol optical depth (AOD) measurements. Atmos. Meas. Tech. 2019, 12, 169–209. [Google Scholar] [CrossRef]
- Eck, T.F.; Holben, B.N.; Reid, J.S.; Dubovik, O.; Smirnov, A.; O’Neill, N.T.; Slutsker, I.; Kinne, S. Wavelength dependence of the optical depth of biomass burning, urban, and desert dust aerosols. J. Geophys. Res. 1999, 104, 31333–31349. [Google Scholar] [CrossRef]
- O’Neill, N.T.; Eck, T.F.; Smirnov, A.; Holben, B.N.; Thulasiraman, S. Spectral discrimination of coarse and fine mode optical depth. J. Geophys. Res. 2003, 108, 4559. [Google Scholar] [CrossRef]
- Dubovik, O.; Holben, B.N.; Lapyonok, T.; Sinyuk, A.; Mishchenko, M.I.; Yang, P.; Slutsker, I. Non-spherical aerosol retrieval method employing light scattering by spheroids, Geophys. Res. Lett. 2002, 29, 54-1–54-4. [Google Scholar] [CrossRef] [Green Version]
- Fu, G.; Hasekamp, O.; Rietjens, J.; Smit, M.; Di Noia, A.; Cairns, B.; Wasilewski, A.; Diner, D.; Seidel, F.; Xu, F.; et al. Aerosol retrievals from different polarimeters during the ACEPOL campaign using a common retrieval algorithm. Atmos. Meas. Tech. 2020, 13, 553–573. [Google Scholar] [CrossRef]
- Landgraf, J.; Hasekamp, O.P.; Box, M.A.; Trautmann, T. A linearized radiative transfer model for ozone profile retrieval using the analytical forward-adjoint perturbation theory approach. J. Geophys. Res. 2001, 106, 291–306. [Google Scholar] [CrossRef]
- Hasekamp, O.P.; Landgraf, J. A linearized vector radiative transfer model for atmospheric trace gas retrieval. J. Quant. Spectrosc. Radiat. Transf. 2002, 75, 221–238. [Google Scholar] [CrossRef]
- Hasekamp, O.P.; Landgraf, J. Retrieval of aerosol properties over the ocean from multispectral single-viewing-angle measurements of intensity and polarization: Retrieval approach, information content, and sensitivity study. J. Geophys. Res. 2005, 110, D20207. [Google Scholar] [CrossRef]
- Schepers, D.; Aan de Brugh, J.M.J.; Hahne, P.; Butz, A.; Hasekamp, O.P.; Landgraf, J. LINTRAN v2.0: A linearised vector radiative transfer model for efficient simulation of satellite-born nadir-viewing reflection measurements of cloudy atmospheres. J. Quant. Spectrosc. Radiat. Transf. 2014, 149, 347–359. [Google Scholar] [CrossRef]
- Bucholtz, A. Rayleigh-scattering calculations for the terrestrial atmosphere. Appl. Opt. 1995, 34, 2765–2773. [Google Scholar] [CrossRef]
- Hill, S.C.; Hill, A.C.; Barber, P.W. Light scattering by size/shape distributions of soil particles and spheroids. Appl. Opt. 1984, 23, 1025–1031. [Google Scholar] [CrossRef]
- Mishchenko, M.I.; Travis, L.D.; Kahn, R.A.; West, R.A. Modeling phase functions for dust-like tropospheric aerosols using a shape mixture of randomly oriented polydisperse spheroids. J. Geophys. Res. 1997, 102, 16831–16847. [Google Scholar] [CrossRef]
- Dubovik, O.; Sinyuk, A.; Lapyonok, T.; Holben, B.N.; Mishchenko, M.; Yang, P.; Eck, T.F.; Volten, H.; Muñoz, O.; Veihelmann, B.; et al. Application of spheroid models to account for aerosol particle nonsphericity in remote sensing of desert dust. J. Geophys. Res. 2006, 111, D11208. [Google Scholar] [CrossRef]
- Fan, C.; Fu, G.; Di Noia, A.; Smit, M.; HH Rietjens, J.; Ferrare, A.R.; Burton, S.; Li, Z.; Hasekamp, P.O. Use of A Neural Network-Based Ocean Body Radiative Transfer Model for Aerosol Retrievals from MultiAngle Polarimetric Measurements. Remote Sens. 2019, 11, 2877. [Google Scholar] [CrossRef] [Green Version]
- D’Almeida, G.A.; Koepke, P.; Shettle, E.P. Atmospheric Aerosols: Global Climatology and Radiative Characteristics; A Deepak Pub: Hampton, VA, USA, 1991. [Google Scholar]
- Li, X.; Strahler, A.H. Geometric-optical bidirectional reflectance modeling of the discrete crown vegetation canopy: Effect of crown shape and mutual shadowing. IEEE Trans. Geosci. Remote Sens. 1992, 30, 276–292. [Google Scholar] [CrossRef]
- Ross, J. The Radiation Regime and Architecture of Plant Stands; Dr, W. Junk Publishers: The Hague, The Netherlands, 1981. [Google Scholar] [CrossRef]
- Litvinov, P.; Hasekamp, O.; Cairns, B. Models for surface reflection of radiance and polarized radiance: Comparison with airborne multi-angle photopolarimetric measurements and implications for modeling top-of-atmosphere measurements. Remote Sens. Environ. 2011, 115, 781–792. [Google Scholar] [CrossRef]
- Maignan, F.; Bréon, F.-M.; Fédèle, E.; Bouvier, M. Polarized reflectances of natural surfaces: Spaceborne measurements and analytical modeling. Remote Sens. Environ. 2009, 113, 2642–2650. [Google Scholar] [CrossRef]
- Hasekamp, O.P.; Litvinov, P.; Butz, A. Aerosol properties over the ocean from PARASOL multiangle photopolarimetric measurements. J. Geophys. Res. 2011, 116, D14204. [Google Scholar] [CrossRef]
- Stap, F.A.; Hasekamp, O.P.; Röckmann, T. Sensitivity of PARASOL multi-angle photopolarimetric aerosol retrievals to cloud contamination. Atmos. Meas. Tech. 2015, 8, 1287–1301. [Google Scholar] [CrossRef]
- Stap, F.A.; Hasekamp, O.P.; Emde, C.; Röckmann, T. Multiangle photopolarimetric aerosol retrievals in the vicinity of clouds: Synthetic study based on a large eddy simulation. J. Geophys. Res.-Atmos. 2016, 121, 12–914. [Google Scholar] [CrossRef]
- Bréon, F.M.; Vermeulen, A.; Descloitres, J. An evaluation of satellite aerosol products against sunphotometer measurements. Remote Sens. Environ. 2011, 115, 3102–3111. [Google Scholar] [CrossRef]
- Tan, Y.H.; Li, E.G.; Zhang, Z.Y.; Lin, X.W.; Chi, Y.G.; Zhou, L.; Wu, C.F.; Wang, Q. Validation of POLDER-3/GRASP aerosol products using AERONET measurements over China. Atmos. Environ. 2019, 215, 116893. [Google Scholar] [CrossRef]
- Lacagnina, C.; Hasekamp, O.P.; Bian, H.; Curci, G.; Myhre, G.; van Noije, T.; Schulz, M.; Skeie, R.B.; Takemura, T.; Zhang, K. Aerosol single-scattering albedo over the global oceans: Comparing PARASOL retrievals with AERONET, OMI, and AeroCom models estimates. J. Geophys. Res.-Atmos. 2015, 120, 9814–9836. [Google Scholar] [CrossRef] [Green Version]
- Lacagnina, C.; Hasekamp, O.P.; Torres, O. Direct radiative effect of aerosols based on PARASOL and OMI satellite observations. J. Geophys. Res.-Atmos. 2017, 122, 2366–2388. [Google Scholar] [CrossRef]
- Waquet, F.; Péré, J.C.; Peers, F.; Goloub, P.; Ducos, F.; Thieuleux, F.; Tanré, D. Global detection of absorbing aerosols over the ocean in the red and near-infrared spectral region. J. Geophys. Res.-Atmos. 2016, 121, 10902–10918. [Google Scholar] [CrossRef]
- Chen, C.; Dubovik, O.; Fuertes, D.; Litvinov, P.; Lapyonok, T.; Lopatin, A.; Ducos, F.; Derimian, Y.; Herman, M.; Tanré, D.; et al. Validation of GRASP algorithm product from POLDER/PARASOL data and assessment of multi-angular polarimetry potential for aerosol monitoring. Earth Syst. Sci. Data 2020, 12, 3573–3620. [Google Scholar] [CrossRef]

| Items | DPC | POLDER |
|---|---|---|
| Swath(km) | 1850 | 1600 |
| FOV | ±50° (Along track/Across track) | ±51° (Along track) ±43° (Across track) |
| Spatial resolution | 3.3 km (nadir) | 6 km × 7 km (nadir) |
| pixel number on the CCD | 512 × 512 | 274 × 242 |
| bands (nm, P stands for polarization) | 443, 490 (P), 565, 670 (P), 763, 765, 865 (P), 910 | 443, 490 (P), 565, 670 (P), 763, 765, 865 (P), 910 |
| Bandwidth(nm) | 20, 20, 20, 20, 10, 40, 40, 20 | 20, 20, 20, 20, 10, 40, 40, 20 |
| Polarization direction | 0°, 60°, 120° | 0°, 60°, 120° |
| Radiance calibration accuracy | ≤5% | 2% for shorter wavelength (≤565 nm), 3% for longer wavelength (≥565 nm) |
| Laboratory calibration accuracy | DoLP: 0.0043, 0.0046, and 0.0037 | 1% |
| Mode 1 | Mode 2 | Mode 3 | Mode 4 | Mode 5 | |
|---|---|---|---|---|---|
| reff (μm) | 0.094 | 0.163 | 0.282 | 0.882 | 1.759 |
| veff | 0.130 | 0.130 | 0.130 | 0.284 | 1.718 |
| Parameters in the State Vector | 5-Mode Retrieval | |
|---|---|---|
| Aerosol properties | Aerosol loading | N j, (j = 1, 2, …, 5) |
| Fraction of spheres | ||
| Mode component coefficients | , (k = 1, 2) | |
| Aerosol layer height | z | |
| Surface properties | Scaling parameter for BPDF model | |
| Coefficient of Li sparse kernel | ||
| Coefficient of Ross thick kernel | ||
| BRDF scaling parameters for wavelength bands | , (iw = 1, 2, nwave) | |
| Number of aerosol parameters | nmode + 6 | |
| Number of surface parameters | nwave + 3 | |
| Length of the state vector | nmode + nwave + 9 |
Publisher’s Note: MDPI stays neutral with regard to jurisdictional claims in published maps and institutional affiliations. |
© 2022 by the authors. Licensee MDPI, Basel, Switzerland. This article is an open access article distributed under the terms and conditions of the Creative Commons Attribution (CC BY) license (https://creativecommons.org/licenses/by/4.0/).
Share and Cite
Fang, L.; Hasekamp, O.; Fu, G.; Gong, W.; Wang, S.; Wang, W.; Han, Q.; Tang, S. Retrieval of Aerosol Optical Properties over Land Using an Optimized Retrieval Algorithm Based on the Directional Polarimetric Camera. Remote Sens. 2022, 14, 4571. https://doi.org/10.3390/rs14184571
Fang L, Hasekamp O, Fu G, Gong W, Wang S, Wang W, Han Q, Tang S. Retrieval of Aerosol Optical Properties over Land Using an Optimized Retrieval Algorithm Based on the Directional Polarimetric Camera. Remote Sensing. 2022; 14(18):4571. https://doi.org/10.3390/rs14184571
Chicago/Turabian StyleFang, Li, Otto Hasekamp, Guangliang Fu, Weishu Gong, Shupeng Wang, Weihe Wang, Qijin Han, and Shihao Tang. 2022. "Retrieval of Aerosol Optical Properties over Land Using an Optimized Retrieval Algorithm Based on the Directional Polarimetric Camera" Remote Sensing 14, no. 18: 4571. https://doi.org/10.3390/rs14184571