Article

RaftNet: A New Deep Neural Network for Coastal Raft Aquaculture Extraction from Landsat 8 OLI Data

Key Laboratory of Spatial Data Mining and Information Sharing of Ministry of Education, National & Local Joint Engineering Research Center of Satellite Geospatial Information Technology, Fuzhou University, Fuzhou 350108, China
*
Author to whom correspondence should be addressed.
Remote Sens. 2022, 14(18), 4587; https://doi.org/10.3390/rs14184587
Submission received: 2 August 2022 / Revised: 6 September 2022 / Accepted: 10 September 2022 / Published: 14 September 2022
(This article belongs to the Section Ocean Remote Sensing)

Abstract

:
The rapid development of marine ranching in recent years provides a new way of tackling the global food crisis. However, the uncontrolled expansion of coastal aquaculture has raised a series of environmental problems. The fast and accurate detection of raft will facilitate scientific planning and the precise management of coastal aquaculture. A new deep learning-based approach called RaftNet is proposed in this study to extract the coastal raft aquaculture in Sansha Bay using Landsat 8 OLI images accurately. To overcome the issues of turbid water environments and varying raft scales in aquaculture areas, we constructed the RaftNet by modifying the UNet network with dual-channel and residual hybrid dilated convolution blocks to improve the extraction accuracy. Meanwhile, we adopted the well-known semantic segmentation networks (FCN, SegNet, UNet, UNet++, and ResUNet) as the contrastive approaches for the extraction. The results suggested that the proposed RaftNet model achieves the best accuracy with a precision of 84.5%, recall of 88.1%, F1-score of 86.30%, overall accuracy (OA) of 95.7%, and intersection over union (IoU) of 75.9%. We then utilized our RaftNet to accurately extract a raft aquaculture area in Sansha Bay from 2014 to 2018 and quantitatively analyzed the change in the raft area over this period. The results demonstrated that our RaftNet is robust and suitable for the precise extraction of raft aquaculture with varying scales in turbid coastal waters, and the Kappa coefficient and OA can reach as high as 88% and 97%, respectively. Moreover, the proposed RaftNet will unleash a remarkable potential for long time-series and large-scale raft aquaculture mapping.

Graphical Abstract

1. Introduction

Marine aquaculture is one of the fastest-growing food production sectors and has enormous potential to meet the increasing demand for food [1]. In the last two decades, the marine ranching and aquaculture industries have rapidly developed in China. The vigorous development of coastal aquaculture has substantially contributed to the rapid development of the marine economy in China [2]. A raft, which comprises driftwood, bamboo, and rope and is mainly used for algae culture, is the most common approach to coastal aquaculture. Adequate algae farming can balance out excess nutrients in fish farming and contribute to carbon neutrality via carbon dioxide fixation through photosynthesis [3,4,5]. Coastal raft aquaculture faces serious crises and challenges due to ocean warming and acidification [5]. By contrast, raft aquaculture introduces a series of marine environmental issues, such as coastal water quality deterioration and frequent red tide disasters, due to the disorderly expansion [6]. Thus, accurately extracting raft aquaculture extent for scientific aquaculture management and planning is essential. Compared with the traditional ship-based in situ survey, remote sensing observation has the advantages of wide coverage, high resolution, and low cost and has been widely utilized in the monitoring and extraction of coastal aquaculture over large scales [7].
The automatic extraction techniques of marine aquaculture based on remote sensing images have been substantially advanced with the development of satellite sensors [8,9]. Common technical methods for aquaculture extraction mainly include threshold segmentation, machine learning classification, object-based image classification, and deep learning semantic segmentation [10]. Threshold segmentation generally amplifies the contrast between the raft and background based on techniques such as constructing feature indexes and then selecting a suitable classification threshold [8,11]. However, constructed feature indexes are only applicable to specific sensor data due to the different band designs of each satellite image dataset. Some studies have used random forests to extract coastal aquaculture [12,13]; the integration-enhanced gradient descent algorithm has also been proposed to further improve extraction accuracy [14]; and studies that combine machine learning and Google Earth Engine to extract large-scale aquaculture are available [9,13]. Some studies have extracted aquaculture in water with different turbidity levels based on object-based image classification [15], and others have even constructed the first national-scale coastal aquaculture map of China based on this method [16]. However, accurately extracting aquaculture either by machine learning or object-based image classification is difficult due to the high concentrations of suspended matter and chlorophyll in coastal water [17].
Semantic segmentation is a common feature extraction method in deep learning, and has been widely used in coastal environment detection and achieved good accuracy [18,19]. Compared with the above methods, semantic segmentation has high extraction accuracy and strong generalization capability and can meet the extraction requirements in coastal raft aquaculture [20]. Fully convolutional networks (FCN) enable end-to-end semantic segmentation and show remarkable potential for remote sensing feature extraction [21]. A couple of studies have extracted coastal aquaculture based on improved FCN, achieving relatively good accuracy [22,23,24]. The DeepLab series of semantic segmentation networks introduce the dilated convolution concept into the model [25,26], enhancing the accuracy of feature extraction and effectively mitigating the multiscale problem of raft extraction. The improved dilated convolution is also widely used for aquaculture extraction [10,27]. UNet is one of the most classical semantic segmentation network structures with a symmetric encoding and decoding structure [28]; it is also one of the most commonly used models for aquaculture area extraction. HDCUNet is constructed on the basis of the UNet model and hybrid dilated convolution to extend the perceptual field to improve the accuracy of raft extraction [29]. The addition of PSE structures to UNet significantly reduces the “adhesion phenomenon” of raft aquaculture extraction [30]. Adding the shape constraint module to the UNet model can also enhance the extraction accuracy of coastal raft aquaculture [31]. The hierarchical cascade structure was used to enhance the multiresolution analysis capability of the UNet model for coastal aquaculture extraction [32]. Some other experiments have also extracted aquaculture based on the improved UNet model and obtained good results [20,33].
Semantic segmentation has realized a series of remarkable achievements in coastal aquaculture extraction. However, most of the above studies were conducted on the basis of high-resolution remote sensing images. Extracting large-scale raft aquaculture is difficult because of the high price and the small coverage width of satellite scanning despite the advantages of high-resolution images in spatial resolution. It has been demonstrated that high classification accuracy can be achieved using medium-resolution remote sensing images combined with deep learning [34]. Therefore, extracting raft aquaculture on large scales based on medium-resolution remote sensing images is essential and achievable. Two key issues emerge in raft extraction based on medium-resolution images. The first issue is the improvement of the model performance to achieve the accurate extraction of aquaculture areas in turbid coastal waters; the second issue lies in the improvement of the model to address the problem of varying raft scales. The structure of the UNet network is simple with minimal parameters, and the UNet family has a consistently good performance. Therefore, we plan to improve on UNet for accurately extracting coastal raft aquaculture. We adopt DCUNet as the feature extraction network to overcome the challenges of multiscale problems in raft aquaculture zones and build the upsampling structure based on the proposed residual hybrid dilated convolution (ResHDC) block to improve the extraction performance of the model. The main contribution of this study is that we proposed a new network called RaftNet for more accurate extraction of coastal aquaculture areas from medium-resolution remote sensing images by overcoming the issues of turbid water environments and varying raft scales in coastal aquaculture areas. Moreover, we applied the RaftNet to produce the Sansha Bay raft aquaculture dataset from 2014 to 2018 and quantitatively analyzed the change over these years.
The rest of the paper proceeds as follows. Section 2 briefly presents a description of the study area, the data utilized in this experiment, and the data preprocessing. Section 3 introduces the RaftNet, contrastive methods, experimental setup, and accuracy evaluation indicators. We present the results and discussions in Section 4. Section 5 then concludes the paper.

2. Study Area and Data
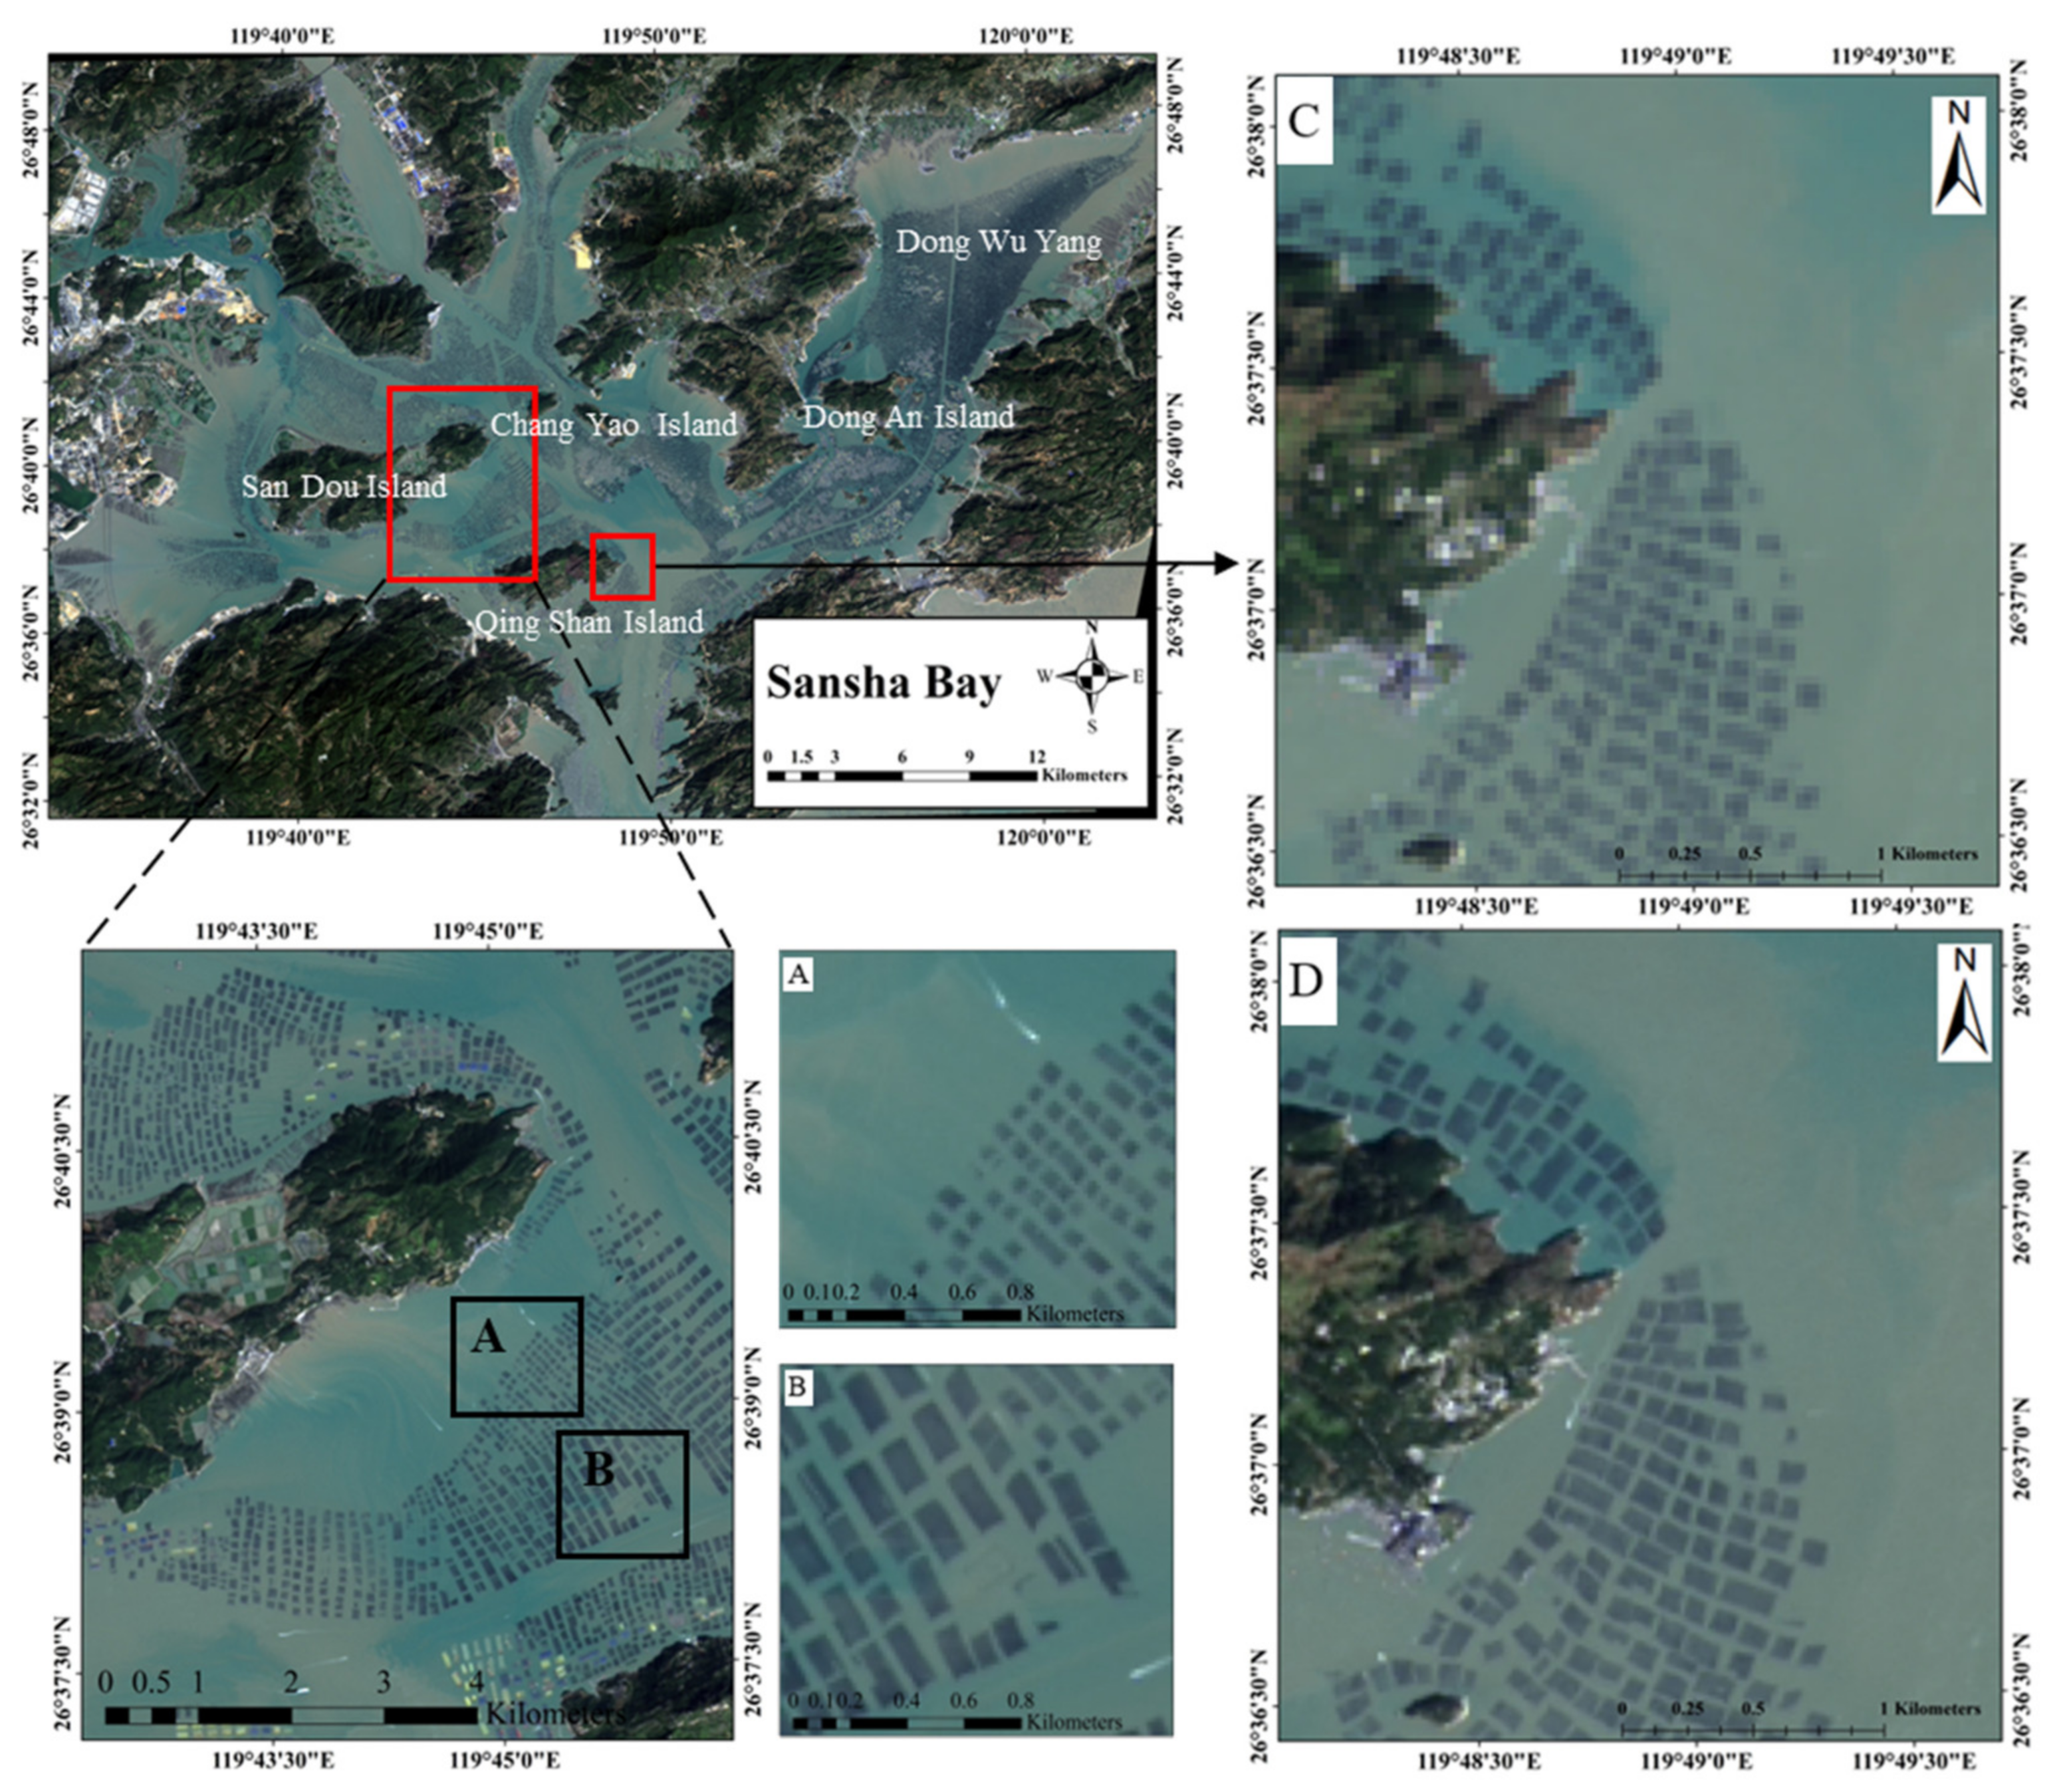
2.1. Study Area

Sansha Bay is located in the northeastern region of Fujian Province. It is a typical semi-enclosed bay that is not easily affected by typhoons and waves because it is surrounded by mountains and only connected to the East China Sea through the gulf of Dongchong. The bay has several rivers injecting into it, bringing rich nutrients and providing superior conditions for the development of aquaculture. These excellent geographical conditions have increased the importance of Sansha Bay as an aquaculture base, known as “the home of seaweed” in China. The cultivation of kelp and other algae is generally based on a rectangular raft. Differences are found in the scale of the raft, and their optical features on remote sensing images appear as dark tones, which are difficult to extract accurately when using traditional methods in areas with high chlorophyll and suspended matter concentrations, as shown in Figure 1.

2.2. Data and Preprocessing

In this study, we selected Landsat 8 OLI imagery as the data source, which has been in production since 2013 and has a highest resolution of 15 m [35]. This data source has a higher spatial resolution and a longer time than other medium-resolution remote sensing imagery data. A description of the OLI sensor bands is shown in Table 1. This study used the Google Earth Engine (GEE) platform for data selection and preprocessing (https://developers.google.com/earth-engine/datasets, (accessed on 1 June 2021)) [36]. We used Gram–Schmidt, Brovey, IHS, and simpleMean for pansharpening [37] and chose RMSE to evaluate the accuracy of the fusion results. The expression of RMSE is presented as follows:
RMSE = i = 1 M j = 1 N R i , j F i , j 2 M × N
where M and N represent the image size, R is the reference image, and F is the fused image.
Table 2 shows that the Gram–Schmidt algorithm has the highest accuracy; therefore, we chose the result obtained using this method. Figure 1 shows that the image resolution is significantly enhanced after the Gram–Schmidt pansharpening. Afterward, the fused images were cropped in accordance with the vector data of the study area to reduce the influence of land to improve the extraction accuracy of the raft aquaculture.

3. Methods

3.1. Structure of RaftNet

UNet has a simple structure with clear principles and achieves remarkable success in remote sensing feature extraction. However, the accurate extraction of raft aquaculture in coastal areas is challenging due to the complex coastal environment and varying raft scales, and the extraction accuracy still has considerable room for improvement. We improve the upsampling and downsampling structures of the UNet by adopting the dual-channel and ResHDC blocks, respectively, to address the above issues. This modified model is named RaftNet, and its structure is shown in Figure 2. The encoding structure in the upper part consists of five dual-channel (DC) blocks. We set the number of output channels of these five dual-channel blocks to 32, 64, 128, 256, and 512, respectively. The lower part shows the decoding structure of the model, which consists of convolution layers and ResHDC modules. Here, we set the number of output channels of these convolution layers to 512, 256, 128, and 64, respectively. We used the same network parameters for all ResHDC modules in RaftNet, and the number of output channels of the nine convolution layers in each ResHDC were 64, 128, 256, 64, 128, 256, 64, 128, and 256, respectively. We constructed a multilevel residual structure using the established ResHDC module and the convolution layers in the upsampling structure of UNet to enrich the feature information. Figure 2 shows the gray and green lines, which respectively indicate long and medium-length residual connections. The two aforementioned residual connections and the short residual connections inside the ResHDC module constitute an upsampling structure comprising multiscale residuals.

3.1.1. Dual-Channel Block for Downsampling Structures

The most common method to improve the multiresolution analysis capability of a convolutional network is to replace the original convolutional layer with an inception-like block, which uses 3 × 3, 5 × 5, and 7 × 7 convolutional filters in parallel and concatenates the generated feature maps. Convolutional blocks with different receptive field sizes are used to perform multiscale operations on objects, thus improving the multiresolution analysis performance of the model. However, this method is computationally intensive and inefficient. Ibtehaz proposes an architecture to improve the multiresolution capability of the UNet model by using the MultiRes module instead of normal convolution [38]. The MultiRes module is shown in Figure 3a. This module uses a series of light 3 × 3 convolutional modules instead of the computationally intensive 5 × 5 and 7 × 7 convolutional modules, thereby enhancing computation efficiency. Compared with the UNet model, the MultiResUNet structure can solve most of the problems of varying scales of the objects and obtains improved accuracy. However, the extraction accuracy of the MultiResUNet will be degraded to varying degrees under the blurred background of coastal raft; thus, meeting the need of practical applications is difficult. The MultiRes module should be improved to perform the task of extracting coastal raft aquaculture areas effectively to address this situation. In the MultiRes structure, the authors wanted to use the addition of a 1 × 1 convolutional layer to obtain additional spatial information. However, this convolution provides minimal information based on experimental demonstration. Therefore, we used the upper part of the MultiRes structure instead of the 1 × 1 convolutional layer to further improve the multiscale feature enhancement performance of the model. This improved structure is called dual-channel block [39], which is shown in Figure 3b.

3.1.2. The ResHDC Block

We propose the ResHDC block to extract additional feature information from the raft aquaculture areas in turbid water. The structure of the ResHDC block is shown in Figure 4. Each ResHDC module consists of nine convolution layers, and a BatchNormalization layer is adopted after each convolution layer to speed up the training and improve the accuracy. ReLU can alleviate overfitting and optimize the network, so we choose it as activation function. To reduce information loss, we divide every three adjacent convolution layers in the ResHDC modules into one group, and each ResHDC module has three groups. The features input to each group of modules and the features output from the group are concatenated. The optimal dilation rates of the three convolution layers in the first group are (1, 1, 1), the second group are (1, 2, 1), and the third group are (1, 3, 1), respectively. This structure is essentially a combination of residual structure and hybrid dilated convolution, which can solve the problem of gradient disappearance due to network depth enhancement. We can increase the depth of the network to enhance its performance based on this improvement [40]. In addition, we use dilated convolution in this structure to enhance the receptive field, thus allowing the structure to obtain rich information [41]. Previous studies have combined UNet and ResNet to achieve good results by merging the advantages of short residual connections and long skip connections. The improvement of UNet++ [42] and UNet 3+ [43] achieved excellent results in medical image processing by demonstrating that different residual connection lengths can provide various contributions to semantic segmentation.

3.2. Contrastive Methods

As mentioned above, FCN is a classic semantic segmentation network. The original fully connected layer is replaced by a convolutional layer in this network. FCN-8s utilizes a means of mesoscale feature information fusion in the decoding process, which is essentially an idea of residuals. The SegNet network is an image segmentation network proposed by the Cambridge University team [44]. The network structure mainly comprises two symmetrical parts: encoding and decoding. The main function of the former part is tantamount to analyzing and extracting image features. In the latter, the feature image information restores the geometric shape of the object by using the unpooling. UNet, which was proposed in 2015, is a classic variant of the FCN network. UNet mainly comprises the following three parts: the encoding structure, the decoding structure, and the skip connection part. The encoding and decoding structures are symmetrically distributed. The skip connection in UNet is used to connect the encoding structure to the corresponding decoding part, fusing the low features with the high-level ones to provide rich spatial information to facilitate the reduction in the resolution of the segmentation results. UNet++ improves the topology of the UNet network by including additional skip connections to the UNet model and integrates additional low- and high-feature information. ResNet effectively attenuates the degradation problem of deep networks through the residual module. In this experiment, we designed a model using ResNet and UNet called ResUNet as a comparison network. We similarly chose DCUNet as the backbone of ResUNet to verify the performance of our improved upsampling structure, and used ResNet101 in its decoding part to replace the upsampling structure of UNet.

3.3. Experimental Setup

3.3.1. Construction of the Training Dataset

In this study, we selected the OLI image of Sansha Bay on 15 February 2021 for the dataset production. Based on the fused image with higher resolution, we adopted a visual interpretation to obtain the corresponding ground truth. Considering the computational efficiency, we cropped the fused images and the corresponding labels into 64 × 64 pixels and then obtained a total of 820 pairs of sample data. The acquired sample datasets were also allocated: 500 pairs of data were randomly selected to form the training sample set, while the 320 remaining pairs of sample data formed the test dataset for accuracy evaluation. We took a series of measures to augment the data of the training sample set to minimize overfitting of the model as much as possible. The measures included adding Gaussian noise and impulse noise, brightening, blurring, darkening, rotating 90°, rotating 180°, and mirroring [45,46]. Notably, we also mixed the above methods (such as adding noise to the data rotated by 90°) to augment the training set in this research. The training set was expanded to 10,500 pairs of pictures after these operations. We also adopted simple random sampling to randomly select 30% of the training data as the validation data for the optimization of the model.

3.3.2. Implementation Details

As mentioned above, two types of classical semantic segmentation networks were selected for the comparison: one is a general semantic segmentation model comprising FCN and SegNet, and the other is the UNet family, mainly including UNet, UNet++, ResUNet, and our RaftNet. This experiment builds the models based on the Tensorflow and Keras deep learning framework and uses NVIDIA GeForce RTX1080 GPU to accelerate the model training and prediction.
As shown in Table 3, the training batch size is set to 5 and the number of iterations is set to 50 in this experiment. The experiment adopts the Adam optimizer, and the initial learning rate is set to 0.0001. The training is stopped when the loss of the validation data is no longer reduced for ten consecutive iterations, and the learning rate is halved when the loss of the model validation set does not decrease for five consecutive iterations. We set the dropout rate to 0.3 during training to improve the robustness of the model. The hyperparameters of the comparison models are the same as RaftNet, and all models were trained and tested under the same hardware and software conditions. The model construction mainly includes the construction of data sets, model training and testing (Figure 5).
Figure 6 shows the training graph of RaftNet. The red line is the training accuracy and the blue line is the validation accuracy. The training accuracy and validation accuracy are both high and the validation accuracy is higher than the training accuracy (Figure 6). The main reasons for this phenomenon are that we augmented the original data and added dropout layers to improve the robustness of the model in the training. The result suggests that there was no overfitting in the training.

3.4. Accuracy Evaluation Indicators

We used the actual raft distribution of the test data as a benchmark for quantitative evaluation to compare the extraction accuracy of different algorithms and obtain a reasonable evaluation and analysis of the extraction results of each model. The evaluation indicators used mainly include precision, recall, F1-score, overall accuracy (OA), and intersection over union (IoU). Precision indicates the proportion of correctly classified raft in all extracted raft. Recall indicates the proportion of correctly extracted raft to actual raft. F1-score is the harmonic mean of precision and recall and it takes into account both the precision and recall, which can more objectively evaluate the performance of the model. IoU is usually used to measure the similarity between the ground truth and extracted results. Overall accuracy is the percentage of pixels in the image that are correctly classified. These metrics are common and well used in semantic segmentation. Meanwhile, we adopted OA and Kappa coefficients to evaluate the classification accuracy of the extracted raft aquaculture areas in Sansha Bay from 2014 to 2018. The expression of these indicators is respectively presented as follows:
Precision = TP/(TP + FP),
Recall = TP/(TP + FN),
F1-score = 2 × (precision × recall)/(precision + recall),
OA = (TN + TP)/(TN + FN + TP + FP),
IoU = TP/(TP + FN + FP),
Kappa = ( P o P e ) / ( 1 P e )
where TP is true positive, TN is true negative, FP is false positive, and FN is false negative; P o , P e are all calculated according to the confusion matrix.

4. Results and Discussion

4.1. Comparison with Various Deep Learning Methods

4.1.1. Typical Area Extraction Comparison

The test dataset was fed into the completed training RaftNet as well as the comparison models, and typical scenarios were selected for qualitative comparison, as shown in Figure 7. Each column in the figure represents a different scenario, and a total of eight typical scenarios were selected. The first row shows the true color images, the second row shows the ground truth of raft for each scenario, and the remaining rows show the predicted results of each model. The comparison in Figure 7 reveals the occurrence of a few misclassifications in the RaftNet result. The solid rectangular line represents the scene in which coastal vegetation is misclassified as raft. In this scene, each model has different degrees of incorrect classification, among which FCN and RaftNet have minimal misclassification. The rectangular dotted lines in scenes (c) and (d) represent the scene where a building is misconceived as raft aquaculture, in which RaftNet and the SegNet model perform best. The elliptical solid line in the remaining images represents the scene where the raft is missed. In these scenarios, SegNet and ResUNet have the most evident omissions and RaftNet performs successfully. Figure 7e,f show that RaftNet, FCN, UNet, and ResUNet incorrectly divided the cages into raft. The misclassifications of the SegNet and UNet++ are prominent in the aforementioned scenarios. Moreover, the figure shows that the extraction results of the FCN and SegNet models demonstrate the “adhesion phenomenon”. In particular, the boundary information of the extracted raft is substantially fragmented and the texture features of the raft remain unclear based on the extraction result of SegNet. The extraction results will be evaluated for quantitative accuracy in the following experiments due to the limited selection of scenes and the highly subjective nature of the qualitative analysis based on manual visual interpretation to facilitate further research and analysis.

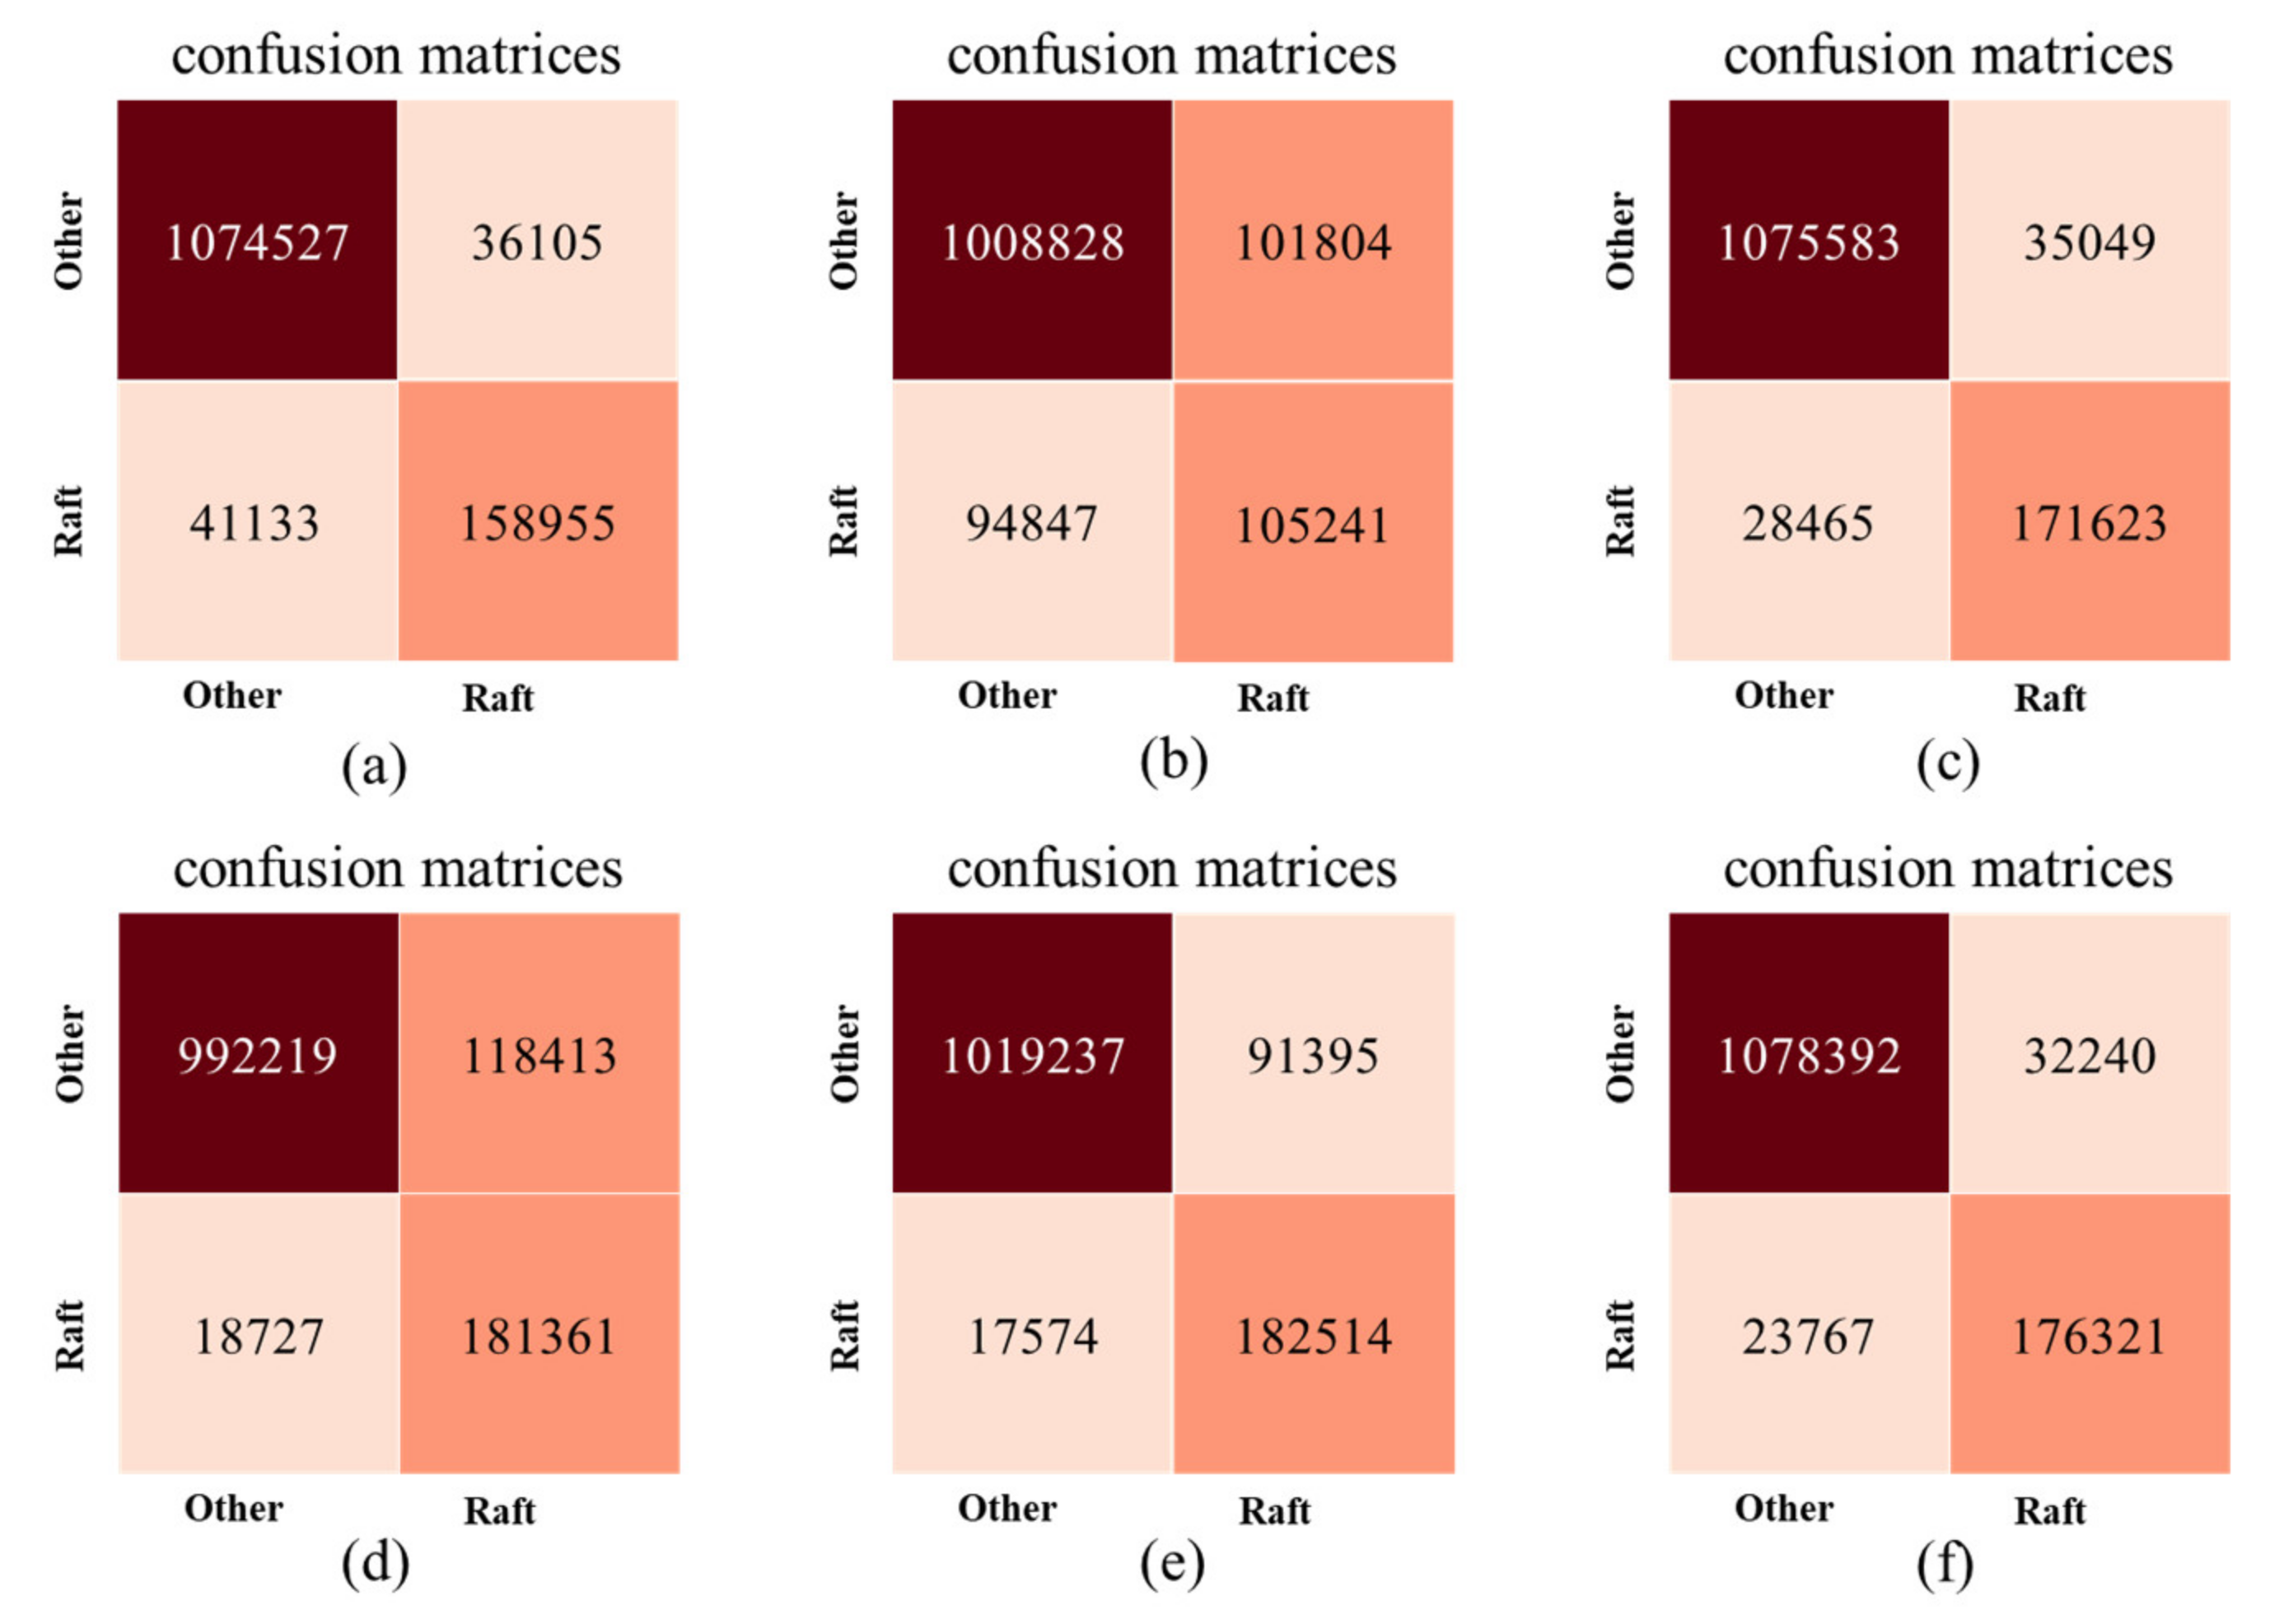
4.1.2. Extraction Accuracy Evaluation

The confusion matrix of the accuracy evaluation is shown in Figure 8. The RaftNet extraction results have the highest TN value and the third highest TP value next to ResUNet and UNet++. However, the TN values of ResUNet and UNet++ are smaller compared to RaftNet, and the reason may be that ResUNet and UNet++ misclassify some coastal vegetation as raft. We then adopted the confusion matrix to evaluate the extraction accuracy of each model quantitatively. The accuracy evaluation results of each model are presented in Table 4, where the underlined part represents the best accuracy level of the indicator. The following models can be divided into two groups: the first group includes FCN and SegNet and the second group contains UNet, the improved ResUNet, UNet++, and RaftNet. A comparison of the results in Table 4 reveals that the best results are in the second group, even eliminating the results of the RaftNet model. This shows that the UNet structure has remarkable advantages in the extraction of raft in coastal areas. An analysis of Table 4 shows that considering precision, RaftNet achieved the best result of 84.5% and the lowest accuracy of SegNet was only 50.8%. The results of the recall rate reveal that the ResUNet has the highest value (91.2%), followed by UNet++ and RaftNet with recall rates of 90.6% and 88.1%, respectively, and SegNet has the lowest recall rate of 52.6%. The recall of ResUNet and UNet++ is higher than RaftNet, while their precision is lower. This phenomenon may be related to the stronger spatial analysis and feature learning capability of the RaftNet network, which is less likely to misclassify buildings and vegetation as raft. However, this may also make the model classify some irregular raft with unclear boundaries as vegetation or buildings, and thus the recall value is a little lower relative to ResUNet and UNet++. Moreover, the extraction results of RaftNet achieve the highest accuracy in both IoU and OA. The IoU can reach 75.9% and the OA is up to 95.7%. Comparing the F1-score, RaftNet also achieves the best results, revealing an F1-score reaching 86.3%. This finding is followed by UNet, FCN, ResUNet, UNet++, and SegNet with values of 84.4%, 80.5%, 77.0%, 72.6%, and 51.7%, respectively. The result suggests that RaftNet is the best model for raft extraction. Comparing the SegNet with other models, adding a residual structure to the neural network structure is beneficial to the extraction of raft aquaculture zones. The comparison of the extraction results of RaftNet, UNet++, and ResUNet revealed that only increasing the complexity and depth of the network does not improve the extraction performance. The extraction performance of raft aquaculture can be improved through the rational design of the residual structure of the model. The comparison of RaftNet and ResUNet shows that our improvements to the upsampling structure of the model are effective, and the construction of residual connections at different scales in the model is beneficial to its performance improvement.

4.2. Ablation Study

To better understand how different modules influence the performance of the RaftNet, we deliberately conducted an ablation study. We can understand the contribution of each component of the network to the overall performance improvement by studying the part of the model. In this study, we used UNet as the base framework and then the DC block as the backbone to build DCUNet. UNet, DCUNet, and RaftNet form the comparison experiment. The three models were trained and validated on the same dataset, and the experiments were performed under the same software and hardware conditions. Figure 9 shows that DCUNet has better performance than UNet in the following scenarios. First, DCUNet shows minimal misclassification for large shoals and small vessels. At low raft aquaculture densities, the accuracy performance of both is broadly consistent, but the adhesion phenomenon of DCUNet is smaller than that of UNet as the raft aquaculture density increases. Table 5 shows that the precision of the original UNet and DCUNet structures is 83.1% and 87.4%, respectively. This suggests that DCUNet rarely misclassifies rafts as vegetation or buildings compared to UNet, which may be caused by the stronger multi-resolution analysis capability of DCUNet. RaftNet demonstrated better performance considering recall, reaching 88.1%, and it also performed best in precision. This indicates that the extraction accuracy increases gradually when the dual-channel blocks and ResHDC modules are gradually added on the basis of UNet. Compared with the F1-score, the value of the UNet model is 84.4%, the F1-score of DCUNet is slightly improved by 84.7%, and RaftNet can reach 86.3%. The IoU and OA of RaftNet is the highest, followed by DCUNet and UNet. The results indicated that the improvements made to the various parts of the model are effective.

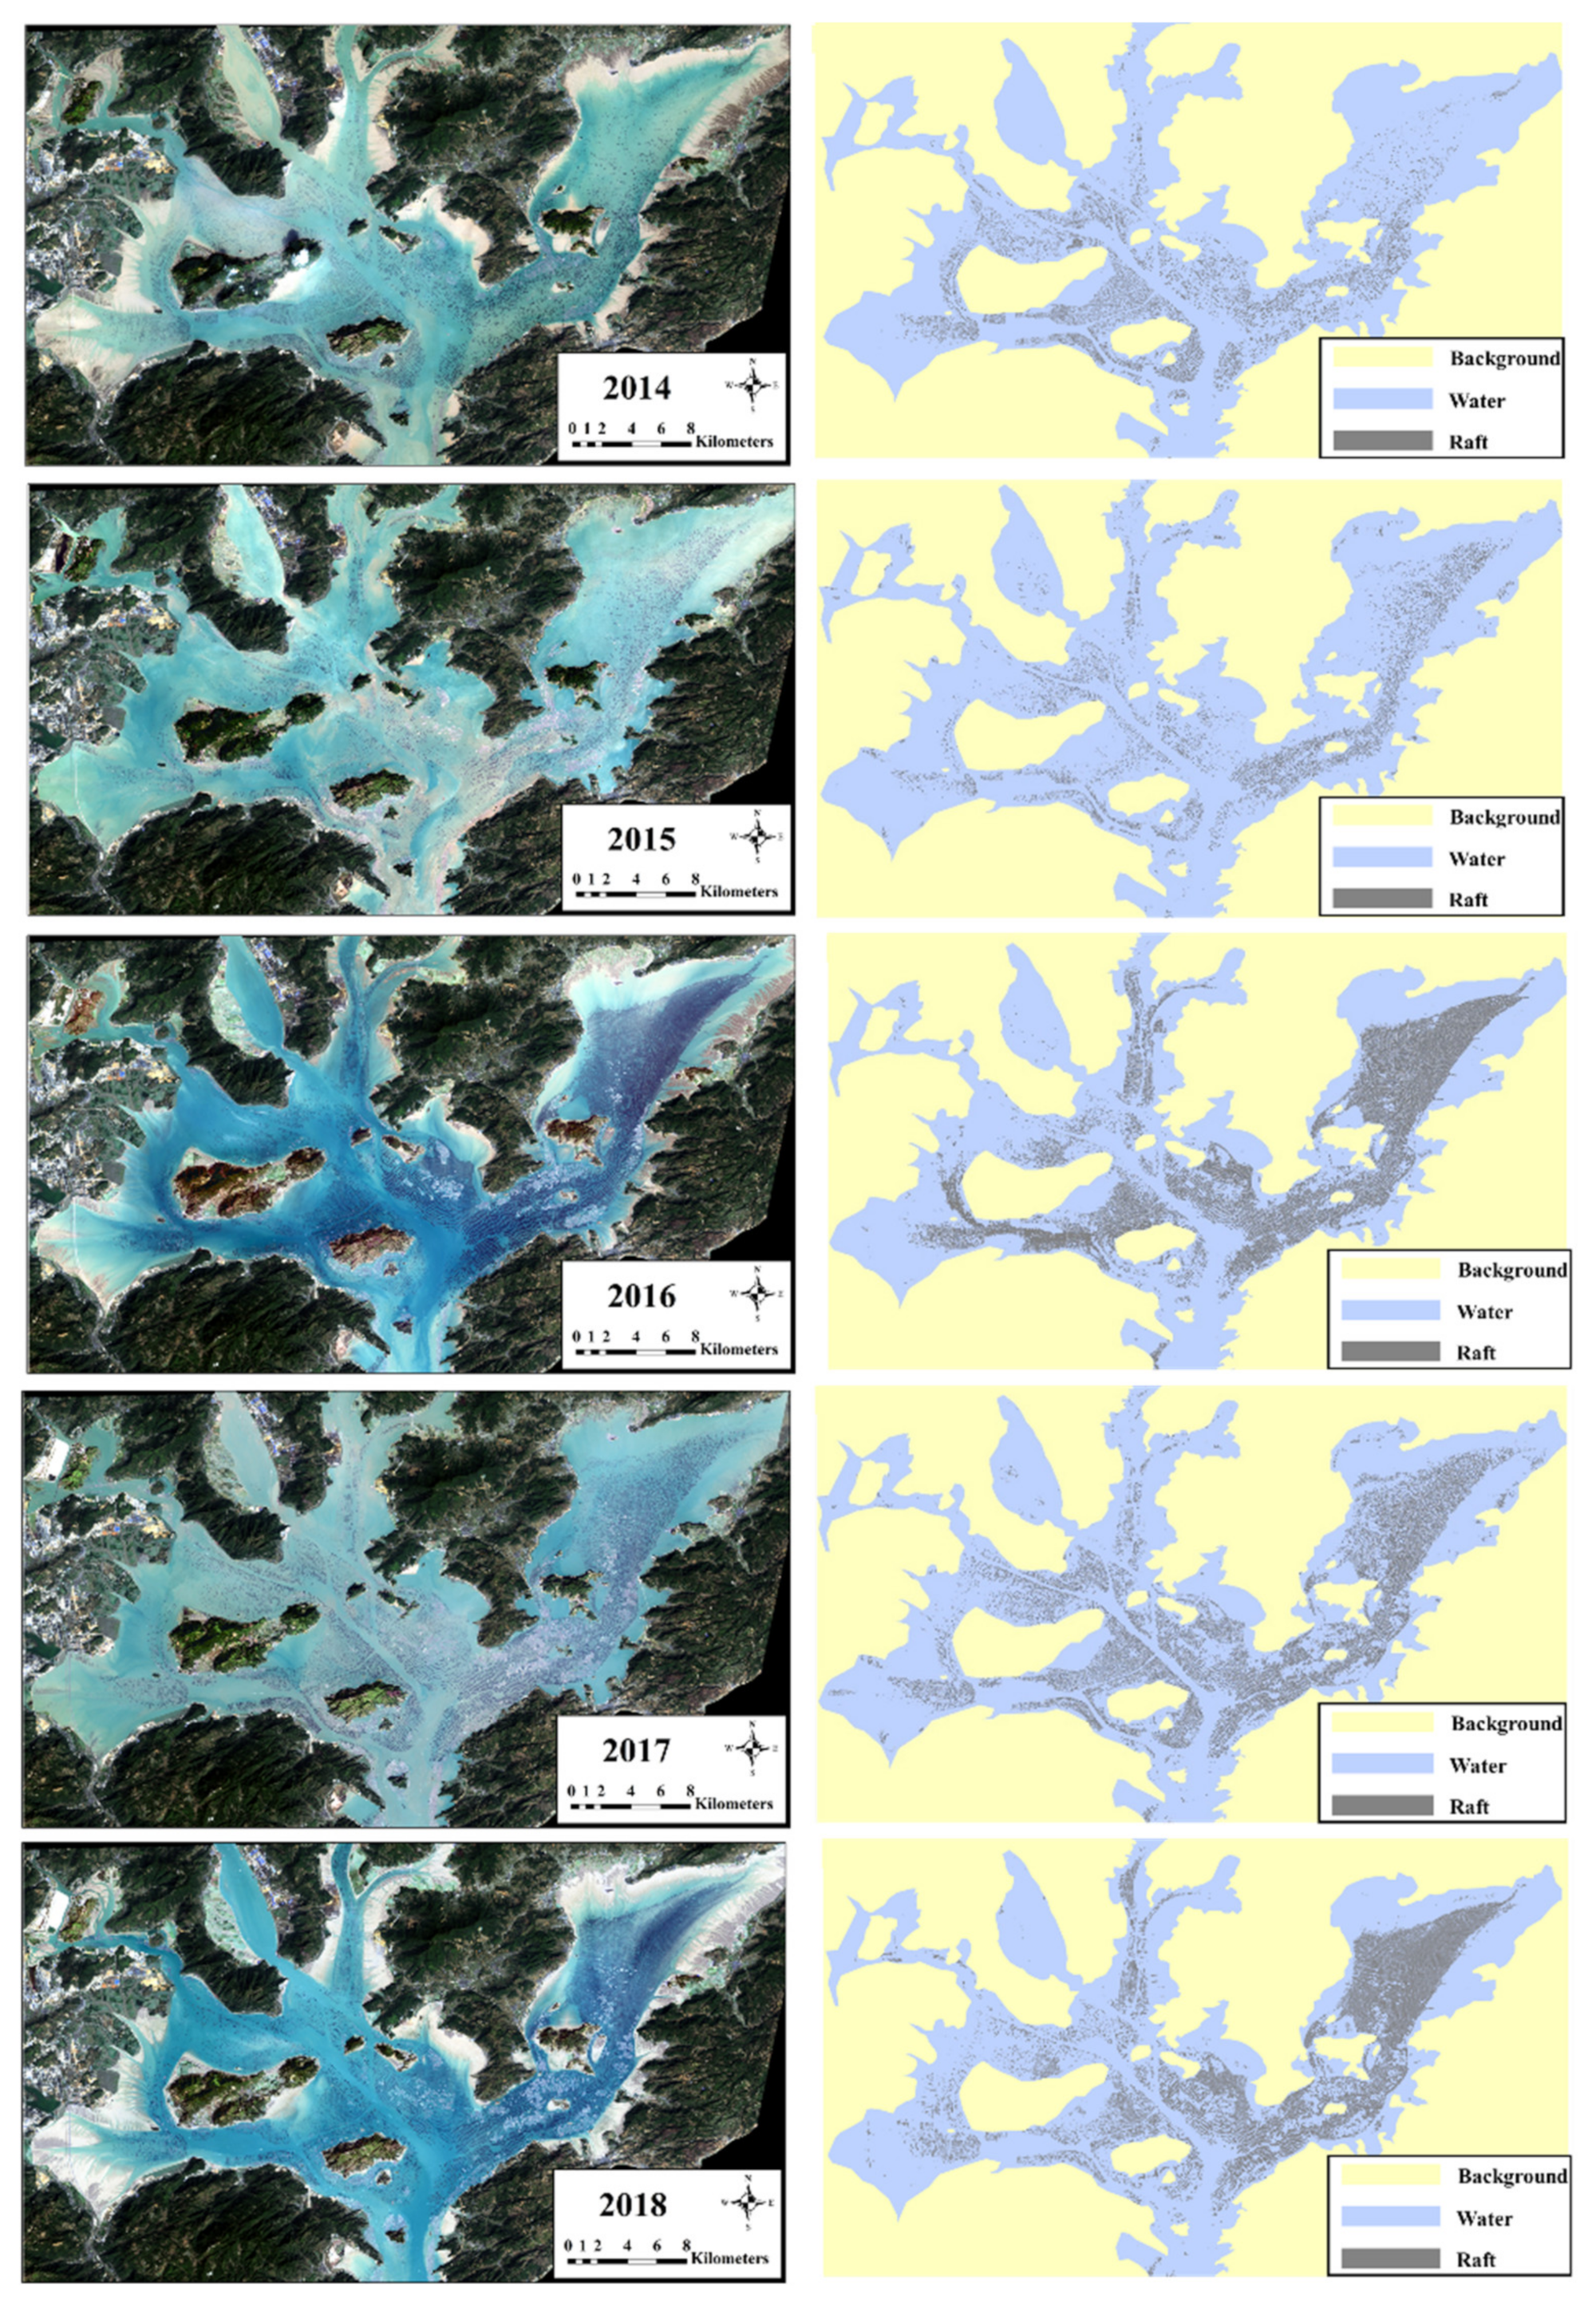
4.3. Spatiotemporal Change in Raft Aquaculture

We applied our model for the raft aquaculture extraction in Sansha Bay from 2014 to 2018 based on migration learning prediction. First, we obtained the OLI images with the lowest cloud coverage between 2014 and 2018 through the GEE platform. The proposed model was then used to extract the aquaculture area accurately for the five-year period. The results showed that the raft aquaculture is widely distributed throughout Sansha Bay, with the overall spatial distribution showing a pattern of more in the east than in the west. Figure 10 reveals that the aquaculture area was the largest in 2016 and its distribution was the least in 2015. Spatially, raft aquaculture is mainly distributed around Sandu, Qingshan, and Dong’an Islands and the northern areas of Dongwuyang and Changyao Islands. The raft aquaculture area near Dongwuyang and Changyao Islands significantly increased from 2015 to 2016. We used random stratified sampling for the evaluation of the results to verify the extraction accuracy for five years. The data from a total of 1000 validation points were sampled, and 200 validation points were randomly selected for each image. We obtained the ground truth of the selected points by the visual interpretation method using high-resolution images from Google Earth Engine and OLI images as auxiliary data. We also used the OA and Kappa coefficient to evaluate the accuracy of the five-year overall extraction accuracy and the extraction accuracy of each year, respectively. OA is the percentage of pixels that are correctly classified. The Kappa coefficient is usually used to measure the agreement between the predicted and actual results. The higher OA and Kappa coefficients indicate better classification performance. Figure 11 shows that the Kappa coefficients of the extraction results for each year are above 70% and the OA is more than 90%. The Kappa coefficient shows a trend from upward to downward over the period 2014–2018, reaching a high of 88% in 2017 and a low of 71% in 2014, with an overall Kappa coefficient of 81%. The OA is relatively stable from 2014 to 2018, with an overall accuracy of 95%. Afterward, we performed statistical analysis of the raft aquaculture areas for each year based on the results of the raft aquaculture extraction. Figure 12 shows that from 2014 to 2018, the raft aquaculture area in Sansha Bay demonstrated an upward trend and reached its peak in 2016, followed by 2018, 2017, 2014, and 2015. The aquaculture raft area in 2016, 2017, and 2018 was more than 100 km2, and in 2014 and 2015 was less than 50 km2.
In addition to extra-human factors, we must consider the seasonal characteristics of raft aquaculture to analyze the reasons for the changes in the aquaculture areas between years. The specific time for obtaining remote sensing images in each year is as follows: 13 December 2014, 27 September 2015, 5 March 2016, 3 November 2017, and 11 March 2018. According to the investigation, the planting of aquaculture, such as kelp, seaweed, and other algae, generally starts in September, and the harvest season is generally concentrated around May in Fujian Province. Therefore, the possible reason for the higher raft aquaculture area in 2016 and 2018 than in other years may be related to the growth of algae. Similar months of image acquisition in 2014, 2015, and 2017 reveal a dramatic increase in the aquaculture area. Figure 12 shows that the aquaculture area in 2016 is more than the raft aquaculture area in 2017 and 2018; compared with 2016, the aquaculture area of raft in 2018 decreased by 18 km2. This phenomenon may be related to marine environmental management in Ningde City, Fujian Province, in early 2017.

5. Conclusions

Coastal raft aquaculture has made an enormous contribution to many aspects of China’s economic development and food security. In this study, we proposed a new deep neural network model called RaftNet for accurate raft aquaculture extraction by modifying the UNet structure based on Landsat 8 OLI images. In the RaftNet model, we employed DCUNet as the feature extraction network and improved the upsampling of UNet by the ResHDC module for the extraction of varying scale raft in coastal aquaculture. Furthermore, the model was applied to raft aquaculture extraction in Sansha Bay of Fujian Province, and achieved high accuracy. The precise extraction of raft aquaculture is helpful for the scientific and rational planning of coastal aquaculture.
In comparison with other deep learning networks (FCN, SegNet, UNet, UNet++, and ResUNet), our model has the best performance and achieves the highest accuracy, and the F1-score reaches 86.3% and OA up to 95.7%, which is higher than the other well-known models. We then applied the model to accurately extract the raft aquaculture area in Sansha Bay from 2014 to 2018 and analyzed its spatiotemporal change. The results showed that the accuracy of the raft extraction in these years achieved a high level, with OA above 90% and Kappa coefficients above 70%. The raft aquaculture area has considerably increased and then remained stable in recent years—the maximum area was 133.5 km2 in 2016, and the minimum aquaculture area was 41.5 km2 in 2014.
With the significant and continuous increase in ocean warming during recent global climate change [47,48], the coastal environment for marine ranching is changing and coastal aquaculture faces great challenges. The changes to the ocean environment during recent decades will pose a long-term threat to the marine ecosystems and their sustainable development. The RaftNet proposed in this study has great potential to be extended to a larger scale and to other coastal regions, and accurate aquaculture extraction will support the UN’s Sustainable Development Goals. In the future, we will utilize multisource remote sensing data (such as Sentinel-2 and GF series satellites) to update our RaftNet and monitor raft aquaculture with higher spatial and temporal resolutions to further understand the spatiotemporal distribution characteristics of raft aquaculture.

Author Contributions

Conceptualization, H.S. and S.W.; methodology, S.W. and J.Q.; validation, S.W. and J.Q.; formal analysis, H.S. and S.W.; investigation, H.S. and W.W.; resources, H.S.; data curation, S.W. and J.Q.; writing—original draft preparation, H.S. and S.W.; writing—review and editing, H.S. and W.W.; visualization, S.W.; supervision, H.S. and W.W.; funding acquisition, H.S. All authors have read and agreed to the published version of the manuscript.

Funding

This research was funded by the National Natural Science Foundation of China (41971384), and the Natural Science Foundation for Distinguished Young Scholars of Fujian Province of China (2021J06014).

Data Availability Statement

The data presented in this study are available on request from the corresponding author.

Acknowledgments

The authors would like to thank four anonymous reviewers for their helpful comments and suggestions, which significantly improved the quality of our paper.

Conflicts of Interest

The authors declare no conflict of interest.

References

  1. Gentry, R.R.; Froehlich, H.E.; Grimm, D.; Kareiva, P.; Parke, M.; Rust, M.; Gaines, S.D.; Halpern, B.S. Mapping the global potential for marine aquaculture. Nat. Ecol. Evol. 2017, 1, 1317–1324. [Google Scholar] [CrossRef] [PubMed]
  2. Wang, Y.; Wang, N. Exploring the role of the fisheries sector in China’s national economy: An input–output analysis. Fish. Res. 2021, 243, 106055. [Google Scholar] [CrossRef]
  3. Visch, W.; Kononets, M.; Hall, P.O.; Nylund, G.M.; Pavia, H. Environmental impact of kelp (Saccharina latissima) aquaculture. Mar. Pollut. Bull. 2020, 155, 110962. [Google Scholar] [CrossRef] [PubMed]
  4. Gao, G.; Gao, L.; Jiang, M.; Jian, A.; He, L. The potential of seaweed cultivation to achieve carbon neutrality and mitigate deoxygenation and eutrophication. Environ. Res. Lett. 2021, 17, 14018. [Google Scholar] [CrossRef]
  5. Hu, Z.M.; Shan, T.F.; Zhang, J.; Zhang, Q.S.; Critchley, A.T.; Choi, H.G.; Yotsukura, N.; Liu, F.L.; Duan, D.L. Kelp aquaculture in China: A retrospective and future prospects. Rev. Aquacult. 2021, 13, 1324–1351. [Google Scholar] [CrossRef]
  6. Liu, J.; Xia, J.; Zhuang, M.; Zhang, J.; Yu, K.; Zhao, S.; Sun, Y.; Tong, Y.; Xia, L.; Qin, Y. Controlling the source of green tides in the Yellow Sea: NaClO treatment of Ulva attached on Pyropia aquaculture raft. Aquaculture 2021, 535, 736378. [Google Scholar] [CrossRef]
  7. Gernez, P.; Palmer, S.C.; Thomas, Y.; Forster, R. remote sensing for aquaculture. Front. Mar. Sci. 2021, 7, 1258. [Google Scholar] [CrossRef]
  8. Yewei, L.; Qiangzi, L.; Du Xin, W.H.; Jilei, L. A method of coastal aquaculture area automatic extraction with high spatial resolution images. Remote Sens. Technol. Appl. 2015, 30, 486–494. [Google Scholar]
  9. Xia, Z.; Guo, X.; Chen, R. Automatic extraction of aquaculture ponds based on Google Earth Engine. Ocean Coast. Manag. 2020, 198, 105348. [Google Scholar] [CrossRef]
  10. Fu, Y.; Deng, J.; Wang, H.; Comber, A.; Yang, W.; Wu, W.; You, S.; Lin, Y.; Wang, K. A new satellite-derived dataset for marine aquaculture areas in China’s coastal region. Earth Syst. Sci. Data 2021, 13, 1829–1842. [Google Scholar] [CrossRef]
  11. Hou, T.; Sun, W.; Chen, C.; Yang, G.; Meng, X.; Peng, J. Marine floating raft aquaculture extraction of hyperspectral remote sensing images based decision tree algorithm. Int. J. Appl. Earth Obs. 2022, 111, 102846. [Google Scholar] [CrossRef]
  12. Yan, J.; Zhao, S.; Su, F.; Du, J.; Feng, P.; Zhang, S. Tidal Flat Extraction and Change Analysis Based on the RF-W Model: A Case Study of Jiaozhou Bay, East China. Remote Sens. 2021, 13, 1436. [Google Scholar] [CrossRef]
  13. Xu, Y.; Hu, Z.; Zhang, Y.; Wang, J.; Yin, Y.; Wu, G. Mapping Aquaculture Areas with Multi-Source Spectral and Texture Features: A Case Study in the Pearl River Basin (Guangdong), China. Remote Sens. 2021, 13, 4320. [Google Scholar] [CrossRef]
  14. Zhong, Y.; Liao, S.; Yu, G.; Fu, D.; Huang, H. Harbor Aquaculture Area Extraction Aided with an Integration-Enhanced Gradient Descent Algorithm. Remote Sens. 2021, 13, 4554. [Google Scholar] [CrossRef]
  15. Zhang, X.; Ma, S.; Su, C.; Shang, Y.; Wang, T.; Yin, J. Coastal oyster aquaculture area extraction and nutrient loading estimation using a GF-2 satellite image. IEEE J.-Stars. 2020, 13, 4934–4946. [Google Scholar] [CrossRef]
  16. Liu, Y.; Wang, Z.; Yang, X.; Zhang, Y.; Yang, F.; Liu, B.; Cai, P. Satellite-based monitoring and statistics for raft and cage aquaculture in China’s offshore waters. Int. J. Appl. Earth Obs. 2020, 91, 102118. [Google Scholar] [CrossRef]
  17. Su, H.; Lu, X.; Chen, Z.; Zhang, H.; Lu, W.; Wu, W. Estimating coastal chlorophyll-a concentration from time-series OLCI data based on machine learning. Remote Sens. 2021, 13, 576. [Google Scholar] [CrossRef]
  18. Arellano-Verdejo, J.; Santos-Romero, M.; Lazcano-Hernandez, H.E. Use of semantic segmentation for mapping Sargassum on beaches. PeerJ. 2022, 10, e13537. [Google Scholar] [CrossRef]
  19. Arellano-Verdejo, J.; Lazcano-Hernandez, H.E.; Cabanillas-Terán, N. ERISNet: Deep neural network for Sargassum detection along the coastline of the Mexican Caribbean. PeerJ. 2019, 7, e6842. [Google Scholar] [CrossRef]
  20. Lu, Y.; Shao, W.; Sun, J. Extraction of Offshore Aquaculture Areas from Medium-Resolution Remote Sensing Images Based on Deep Learning. Remote Sens. 2021, 13, 3854. [Google Scholar] [CrossRef]
  21. Long, J.; Shelhamer, E.; Darrell, T. Fully convolutional networks for semantic segmentation. In Proceedings of the IEEE Conference on Computer Vision and Pattern Recognition, Boston, MA, USA, 7–12 June 2015; pp. 3431–3440. [Google Scholar]
  22. Pan, X.; Jiang, T.; Zhang, Z.; Sui, B.; Liu, C.; Zhang, L. A New Method for Extracting Laver Culture Carriers Based on Inaccurate Supervised Classification with FCN-CRF. J. Mar. Sci. Eng. 2020, 8, 274. [Google Scholar] [CrossRef]
  23. Cui, B.; Zhong, Y.; Fei, D.; Zhang, Y.; Liu, R.; Chu, J.; Zhao, J. Floating Raft Aquaculture Area Automatic Extraction Based on Fully Convolutional Network. J. Coast. Res. 2019, 90, 86–94. [Google Scholar] [CrossRef]
  24. Shi, T.; Xu, Q.; Zou, Z.; Shi, Z. Automatic raft labeling for remote sensing images via dual-scale homogeneous convolutional neural network. Remote Sens. 2018, 10, 1130. [Google Scholar] [CrossRef]
  25. Chen, L.; Papandreou, G.; Kokkinos, I.; Murphy, K.; Yuille, A.L. Deeplab: Semantic image segmentation with deep convolutional nets, atrous convolution, and fully connected crfs. IEEE Trans. Pattern Anal. 2017, 40, 834–848. [Google Scholar] [CrossRef]
  26. Chen, L.; Zhu, Y.; Papandreou, G.; Schroff, F.; Adam, H. Encoder-decoder with atrous separable convolution for semantic image segmentation. In Proceedings of the European Conference on Computer Vision (ECCV), Munich, Germany, 8–14 September 2018; pp. 801–818. [Google Scholar]
  27. Sui, B.; Jiang, T.; Zhang, Z.; Pan, X.; Liu, C. A modeling method for automatic extraction of offshore aquaculture zones based on semantic segmentation. ISPRS Int. J. Geo-Inf. 2020, 9, 145. [Google Scholar] [CrossRef]
  28. Ronneberger, O.; Fischer, P.; Brox, T. U-net: Convolutional networks for biomedical image segmentation. In Proceedings of the International Conference on Medical Image Computing and Computer-Assisted Intervention, Munich, Germany, 5–9 October 2015; pp. 234–241. [Google Scholar]
  29. Cheng, B.; Liang, C.; Liu, X.; Liu, Y.; Ma, X.; Wang, G. Research on a novel extraction method using Deep Learning based on GF-2 images for aquaculture areas. Int. J. Remote Sens. 2020, 41, 3575–3591. [Google Scholar] [CrossRef]
  30. Cui, B.; Fei, D.; Shao, G.; Lu, Y.; Chu, J. Extracting raft aquaculture areas from remote sensing images via an improved U-net with a PSE structure. Remote Sens. 2019, 11, 2053. [Google Scholar] [CrossRef]
  31. Zhang, Y.; Wang, C.; Chen, J.; Wang, F. Shape-Constrained Method of Remote Sensing Monitoring of Marine Raft Aquaculture Areas on Multitemporal Synthetic Sentinel-1 Imagery. Remote Sens. 2022, 14, 1249. [Google Scholar] [CrossRef]
  32. Fu, Y.; Ye, Z.; Deng, J.; Zheng, X.; Huang, Y.; Yang, W.; Wang, Y.; Wang, K. Finer resolution mapping of marine aquaculture areas using worldView-2 imagery and a hierarchical cascade convolutional neural network. Remote Sens. 2019, 11, 1678. [Google Scholar] [CrossRef]
  33. Wang, J.; Fan, J.; Wang, J. MDOAU-Net: A Lightweight and Robust Deep Learning Model for SAR Image Segmentation in Aquaculture Raft Monitoring. IEEE Geosci. Remote Sens. 2022, 19, 1–5. [Google Scholar] [CrossRef]
  34. Arellano-Verdejo, J. Moderate resolution imaging spectroradiometer products classification using deep learning. In Proceedings of the International Congress of Telematics and Computing, Merida, Mexico, 4–8 November 2019; pp. 61–70. [Google Scholar]
  35. Roy, D.P.; Wulder, M.A.; Loveland, T.R.; Woodcock, C.E.; Allen, R.G.; Anderson, M.C.; Helder, D.; Irons, J.R.; Johnson, D.M.; Kennedy, R. Landsat-8: Science and product vision for terrestrial global change research. Remote Sens. Environ. 2014, 145, 154–172. [Google Scholar] [CrossRef] [Green Version]
  36. Kumar, L.; Mutanga, O. Google Earth Engine applications since inception: Usage, trends, and potential. Remote Sens. 2018, 10, 1509. [Google Scholar] [CrossRef]
  37. Zhang, Y.; Mishra, R.K. A review and comparison of commercially available pan-sharpening techniques for high resolution satellite image fusion. In Proceedings of the 2012 IEEE International Geoscience and Remote Sensing Symposium, Munich, Germany, 22–27 July 2012; pp. 182–185. [Google Scholar]
  38. Ibtehaz, N.; Rahman, M.S. MultiResUNet: Rethinking the U-Net architecture for multimodal biomedical image segmentation. Neural Netw. 2020, 121, 74–87. [Google Scholar] [CrossRef] [PubMed]
  39. Lou, A.; Guan, S.; Loew, M.H. DC-UNet: Rethinking the U-Net architecture with dual channel efficient CNN for medical image segmentation. In Proceedings of the International Society for Optics and Photonics, Online, 15 February 2021; p. 115962T. [Google Scholar]
  40. He, K.; Zhang, X.; Ren, S.; Sun, J. Deep residual learning for image recognition. In Proceedings of the IEEE Conference on Computer Vision and Pattern Recognition, Las Vegas, NV, USA, 27–30 June 2016; pp. 770–778. [Google Scholar]
  41. Yu, F.; Koltun, V.; Funkhouser, T. Dilated residual networks. In Proceedings of the IEEE Conference on Computer Vision and Pattern Recognition, Honolulu, HI, USA, 21–26 July 2017; pp. 472–480. [Google Scholar]
  42. Zhou, Z.; Siddiquee, M.M.R.; Tajbakhsh, N.; Liang, J. Unet++: Redesigning skip connections to exploit multiscale features in image segmentation. IEEE Trans. Med. Imaging 2019, 39, 1856–1867. [Google Scholar] [CrossRef]
  43. Huang, H.; Lin, L.; Tong, R.; Hu, H.; Zhang, Q.; Iwamoto, Y.; Han, X.; Chen, Y.; Wu, J. Unet 3+: A full-scale connected unet for medical image segmentation. In Proceedings of the ICASSP 2020-2020 IEEE International Conference on Acoustics, Speech and Signal Processing (ICASSP), Barcelona, Spain, 4–8 May 2020; pp. 1055–1059. [Google Scholar]
  44. Badrinarayanan, V.; Kendall, A.; Cipolla, R. Segnet: A deep convolutional encoder-decoder architecture for image segmentation. IEEE Trans. Pattern Anal. 2017, 39, 2481–2495. [Google Scholar] [CrossRef]
  45. Shorten, C.; Khoshgoftaar, T.M. A survey on image data augmentation for deep learning. J. Big Data 2019, 6, 1–48. [Google Scholar] [CrossRef]
  46. Chlap, P.; Min, H.; Vandenberg, N.; Dowling, J.; Holloway, L.; Haworth, A. A review of medical image data augmentation techniques for deep learning applications. J. Med. Imag. Radiat. Oncol. 2021, 65, 545–563. [Google Scholar] [CrossRef]
  47. Su, H.; Qin, T.; Wang, A.; Lu, W. Reconstructing ocean heat content for revisiting global ocean warming from remote sensing perspectives. Remote Sens. 2021, 13, 3799. [Google Scholar] [CrossRef]
  48. Su, H.; Jiang, J.; Wang, A.; Zhuang, W.; Yan, X. Subsurface temperature reconstruction for the global ocean from 1993 to 2020 using satellite observations and deep learning. Remote Sens. 2022, 14, 3198. [Google Scholar] [CrossRef]
Figure 1. Location of the study area. (A) Landsat 8 OLI image of the study area is shown in true color; the lower figure shows a zoomed view of the region around San Dou Island, with (A,B) showing small- and large-scale rafts, respectively. The images on the right are zoomed views of the east side of Qingshan Island, with (C,D) showing the image before pansharpening and after pansharpening, respectively.
Remotesensing 14 04587 g001
Figure 2. A simplified structure of RaftNet. The upper part represents the encoding structure, and the lower one represents the decoding structure.
Remotesensing 14 04587 g002
Figure 3. Structure to enhance the multiresolution analysis capabilities of the model. (a) MultiRes block, (b) dual-channel block.
Remotesensing 14 04587 g003aRemotesensing 14 04587 g003b
Figure 4. Structure of the ResHDC block. Every three adjacent convolution layers in the structure are a group, and the features input to each group of modules and the features output from the group are concatenated.
Remotesensing 14 04587 g004
Figure 5. Raft aquaculture area extraction model construction process. The upper, middle, and lower parts of the figure represent the sample making and data augmentation, model training, and prediction, respectively.
Remotesensing 14 04587 g005
Figure 6. Training graph of RaftNet. The red line indicates the training accuracy and the blue line indicates the validation accuracy. The validation accuracy is higher than the training accuracy.
Remotesensing 14 04587 g006
Figure 7. Classification results of raft areas comparing the proposed model with other approaches. (ad) represent scenarios containing coastal vegetation or buildings, (eh) indicate scenarios containing cages. The yellow rectangular solid outlined area indicates coastal vegetation incorrectly classified as raft. The rectangular dotted line indicates artificial constructions misclassified as raft. The oval solid line indicates missing extraction. The oval dotted outlined area indicates cages misclassified as raft.
Remotesensing 14 04587 g007
Figure 8. Confusion matrices of accuracy evaluation. (af) represent the results of FCN, SegNet, UNet, UNet++, ResUNet, and RaftNet, respectively. The columns represent the true label and the rows represent the extracted label. The first column of the first row indicates TN, the second column of the first row indicates FP, the first column of the second row indicates FN, and the second column of the second row indicates TP.
Remotesensing 14 04587 g008
Figure 9. Comparative results of ablation experiments. (a) represents scenario containing coastal vegetation, (b) represents scenario containing islands, (c) represents scenario containing cage, (d) represents high density aquaculture areas.
Remotesensing 14 04587 g009
Figure 10. Sansha Bay raft extraction map from 2014 to 2018. The left plots are the original images, and the right plots are the corresponding extraction results. The yellow color indicates the background, blue color indicates the sea water, and gray color indicates the raft.
Remotesensing 14 04587 g010
Figure 11. Accuracy assessment of the extraction results in Sansha Bay based on visual interpretation. The blue column represents the overall accuracy, and the red line represents the Kappa coefficient.
Remotesensing 14 04587 g011
Figure 12. Statistical results of raft extraction in Sansha Bay from 2014 to 2018. (a) Area of raft culture in Sansha Bay from 2014 to 2018. (b) Change in area of raft culture during 2014–2018.
Remotesensing 14 04587 g012
Table 1. Landsat 8 OLI band descriptions.
Band NameBandwidth (nm)Resolution (m)
Band 1 Coastal Aerosol430–45030
Band 2 Blue450–51030
Band 3 Green530–59030
Band 4 Red640–67030
Band 5 Near-Infrared850–88030
Band 6 SWIR 11570–165030
Band 7 SWIR 22110–229030
Band 8 Panchromatic500–68015
Band 9 Cirrus1360–138030
Table 2. Comparison of the accuracy of different pansharpening methods (the best results are bolded).
MethodsRMSEMean RMSE
B2B3B5
GS0.0045340.0035350.0026540.003574
Brovey0.0088430.0102370.0120030.010361
IHS0.0172460.0214160.0255060.021389
simpleMean0.0060090.0045800.0127610.007783
Table 3. Network parameters and the optimal values of RaftNet.
Network ParametersOptimal Parameters
Loss functionbinary_crossentropy
OptimizerAdam
Activationsigmoid
Initial learning rate0.0001
Epoch50
Batch Size5
Dropout0.3
Table 4. Accuracy evaluation table of extraction results of different models (the best value is underlined).
GroupMethodsPrecisionRecallF1-ScoreOAIoU
First GroupFCN81.5%79.4%80.5%94.1%67.3%
SegNet50.8%52.6%51.7%85.0%34.9%
Second GroupUNet83.1%85.7%84.4%95.2%73.0%
ResUNet70.8%91.4%79.8%92.3%66.4%
UNet++60.5%90.6%72.6%89.5%72.4%
RaftNet84.5%88.1%86.3%95.7%75.9%
Table 5. Accuracy evaluation table of ablative analysis (the best value is underlined).
MethodsPrecisionRecallF1-ScoreOAIoU
UNet83.1%85.7%84.4%95.2%73.0%
DCUNet87.4%82.1%84.7%95.4%73.3%
RaftNet84.5%88.1%86.3%95.7%75.9%
Publisher’s Note: MDPI stays neutral with regard to jurisdictional claims in published maps and institutional affiliations.

