Article

Selection of Whole-Moon Landing Zones Based on Weights of Evidence and Fractals

1
College of Geoexploration Science & Technology, Jilin University, Changchun 130061, China
2
Institute of Integrated Information for Mineral Resources Prediction, Jilin University, Changchun 130061, China
3
Institute of Geochemistry, Chinese Academy of Sciences, Guiyang 550081, China
*
Author to whom correspondence should be addressed.
Remote Sens. 2022, 14(18), 4623; https://doi.org/10.3390/rs14184623
Submission received: 11 August 2022 / Revised: 7 September 2022 / Accepted: 13 September 2022 / Published: 16 September 2022
(This article belongs to the Section Satellite Missions for Earth and Planetary Exploration)

Abstract

:
At present, the selection of lunar landing areas is mostly determined by experts’ argumentation and experience. Generally, it is artificially limited to a small zone, and there are few effective quantitative models for landing areas. Under the premise that big data, artificial intelligence, and other technologies are becoming increasingly mature, with in-depth analysis and the mining of lunar-related digital data, it is possible to automatically optimize the landing zones in the whole moon. Factors such as engineering constraints, scientific goals, and resource requirements are comprehensively considered. This paper proposes a new method that strategically applies the weights of evidence (WoE) and fractals to optimize the landing area of the detector in the whole moon. The method takes the thickness of the lunar crust, roughness, slope, digital elevation model, gravity gradient, iron oxide distribution, and lunar soil optical maturity as evidence layers, and known landing sites as the target layer. After all moon data are divided into grids, the prior probability of each evidence factor, the in-cell weight of each evidence factor, and the Bayesian posterior probability are calculated. According to the semi-parabolic distribution in the fuzzy distribution, the fuzzy membership degree of the impact crater radius is presented and the complexity of the number of impact craters in a cell is calculated. The distribution complexity of impact craters in each cell is calculated according to the fractal. The result of the weights of evidence is further constrained by the complexity of the number of cells and the complexity of the distribution, and the posterior probability map of suitable landings is finally obtained. When comparing and analyzing the posterior probability map of the landing zones with the known landing points and the artificially preferred landing zones, it is found that 84% and 82.6% fall within the suitable landing zones, respectively. Among them, the first gradient is 58% and 58.7%, and the second gradient is 26% and 23.9%. The results at different resolutions are relatively stable and are consistent with the distribution of craters or basins in the lunar mantle and the spatial distribution of olivine, which proves the effectiveness and feasibility of this method. This method is a typical application of lunar big-data-driven knowledge discovery and will help promote the transformation of lunar landing area selection from traditional qualitative analyses to automated intelligence optimization.

Graphical Abstract

1. Introduction

As a celestial body revolving around the Earth, human exploration on the moon has never stopped. As early as the 1950s, many countries proposed plans for lunar exploration and resource utilization [1,2,3], and the United States achieved manned moon landings through the Apollo program [3]. In the 21st century, the US NASA Artemis mission also focuses on lunar resources and related research on probe landing (https://www.nasa.gov/specials/artemis/ (accessed on 20 March 2022)). In recent years, with China’s successful landing on the lunar surface and scientific exploration and sampling through the “Chang’E (CE) Project” [4], a new upsurge in lunar resource development has been set off internationally [1,5]. China has designed a three-phase development plan for lunar exploration of “circling”, “falling”, and “returning” [2,6,7] from unmanned lunar soft landing to manned lunar soft landing [8]. From the probe landing to the base site selection [9,10], it is necessary to break through various technical indicators such as scientific goals and engineering constraints [11,12]. The proper selection of lunar surface landing areas directly affects the safety of the implementation of engineering missions and the scientific research objectives [13]; hence, choosing the proper landing zones is an important way to ensure the success of the lunar exploration mission.
The choice of landing zones is mainly constrained by three factors: engineering, science, and resources. The engineering constraints often consider factors such as impact craters, topography (such as slope, DEM) [14,15,16,17], etc., often starting from the safety of the lander, which involves the design of the lander’s structure size and safety parameters [18,19,20], the coupling relationship between the lunar soil and the lander [21], the landing uncertainty of the probe, etc. [22]. Science and resource constraints focus on the geological background of the landing area, regolith, lunar surface rocks and lunar soil, and other geological features [23,24,25,26,27]. In addition, the polar region may contain a variety of minerals and other potentially valuable resources (such as water ice in the permanently shadowed region of the Antarctic), which has high scientific detection value [28,29]. Therefore, polar region exploration has also become one of the new hot spots in international lunar exploration [30]. However, the environment in the polar region is more severe than that in the middle and low latitudes, and the landing difficulty is higher.
At present, some of the landing zone methods are only analyzed through engineering or scientific methods. For example, Liang He’s vision-based hazard detection realizes safe site selection and the real-time dynamic addressing of spacecraft on the lunar surface [19]. J. Flahaut uses integrated remote sensing observations to identify and characterize scientifically rich landing sites [23]. In addition, many landing zone methods focus on analyzing a local area (North and South Poles, and impact craters). For example, Zhang He preliminarily selected 4 regions and 10 landing sites in the lunar South Pole region after comparing, discussing, and analyzing the environment around the impact crater under the premise of meeting the needs of scientific goals and engineering achievability [31].
It has always been the goal of landing zone selection to select a region with a flat surface and concentrated scientific research content as the location of the lunar landing. To achieve this goal, it is necessary to pay attention to engineering constraints and science and resource constraints at the same time. At present, although there are methods that consider the above two aspects together [31], there are few methods for an automatic comprehensive analysis of the whole moon and optimization of landing areas.
This paper proposes a new method to select the suitable landing space range of the whole moon by combining the weights of evidence and fractals. It aims to scientifically optimize the lunar landing prospect area with minimal human intervention. Drawing on the idea of selecting favorable metallogenic areas by the method of weights of evidence [32,33], the whole moon is divided into several grid units. The prior probability of each evidence factor, the intra-cell weight of each evidence factor, and the Bayesian posterior probability are calculated using the weights of evidence. According to the automatically calculated posterior probability results, the suitable landing areas within the whole moon can be effectively delineated. The nonlinear impact craters (taking different crater radii as a threshold, the distribution of the total number of lunar craters with radii larger than the threshold is nonlinear) all over the moon greatly affect the safety of landing on the lunar surface, and the fractal can effectively deal with the nonlinear field [34,35]. Therefore, using fractals to calculate the distribution complexity of impact craters and further optimizing the suitable lunar landing area can effectively improve the safety of lunar probe landing.

2. Materials and Methods

2.1. Relevant Work

At present, the main method of landing zone selection at home and abroad is the mutual iteration of engineering constraints and scientific needs. From the analyses of key links, such as scientific research and application value, scientific goals and tasks, aircraft constraints, lunar resident, activity support capabilities, etc., experts have put forward suggestions on the selection of lunar landing areas [6]. Xiao Long focused on the composition of the deep lunar crust and mantle, volcanic activity and thermal history, early and present lunar impact fluxes, the size of the lunar core and the structure of the lunar mantle, the distribution of water and volatiles, the properties of lunar soil and lunar dust, lunar resources and environment, etc., and 18 alternative landing areas are recommended (five on the back side, five on the front side, and eight in the polar area) [36]. Meng et al. briefly analyzed the topography, composition, deep structure, and brightness temperature distribution of the Von Karman impact crater located in the middle of the South Pole–Aiken Basin on the far side of the moon and its scientific significance, and proposed three pre-selected landing areas [37]. Ma Zexiang proposed a multi-mode obstacle detection and identification method for lunar soft landings, which uses the data collected by CCD cameras and LIDAR sensors at different heights to perform helical search-style lunar obstacle identification to ultimately select a safe landing point [38]. Wei Ruoyan proposed a method for selecting the landing area on the star surface based on a single image and avoiding a closed environment and selecting an area with few obstacles to avoid the lander from falling into a closed environment [39]. Eckart demonstrated the elements of lunar landing zone site selection based on scientific objectives, system capabilities, and empirical data [10]. Li Zhijie conducted a systematic study on the Apollo lunar landing program and proposed four basic principles for the location of lunar bases: strategic goals, scientific goals, operational constraints, and resource development [11].
The weights of evidence method is an effective method commonly used in the field of mineral prediction to delineate prospects [32,33]. The Hongtoushan massive sulfide copper deposit in Fushun–Qingyuan area was predicted based on the MRAS weights of evidence method [40]. Quantitative prediction of lead–zinc mineralization was used in the Hongluoshan–Wuzhishan area [41]. A good forecast is given for any future exploration of the gold deposit in the middle section of Xuefeng Mountain and so on [42]. No studies have been identified using the weights of evidence approach to the siting of the lunar landing zones.

2.2. Selecting Whole-Moon Landing Zones Based on Weights of Evidence

2.2.1. General Framework

Figure 1 shows the overall framework of the whole-moon landing area selection based on the weights of evidence and fractals, which mainly includes data input, data preprocessing, calculation of the weights of evidence, fractal calculation, and result output. These five items are explained as follows.
(1)
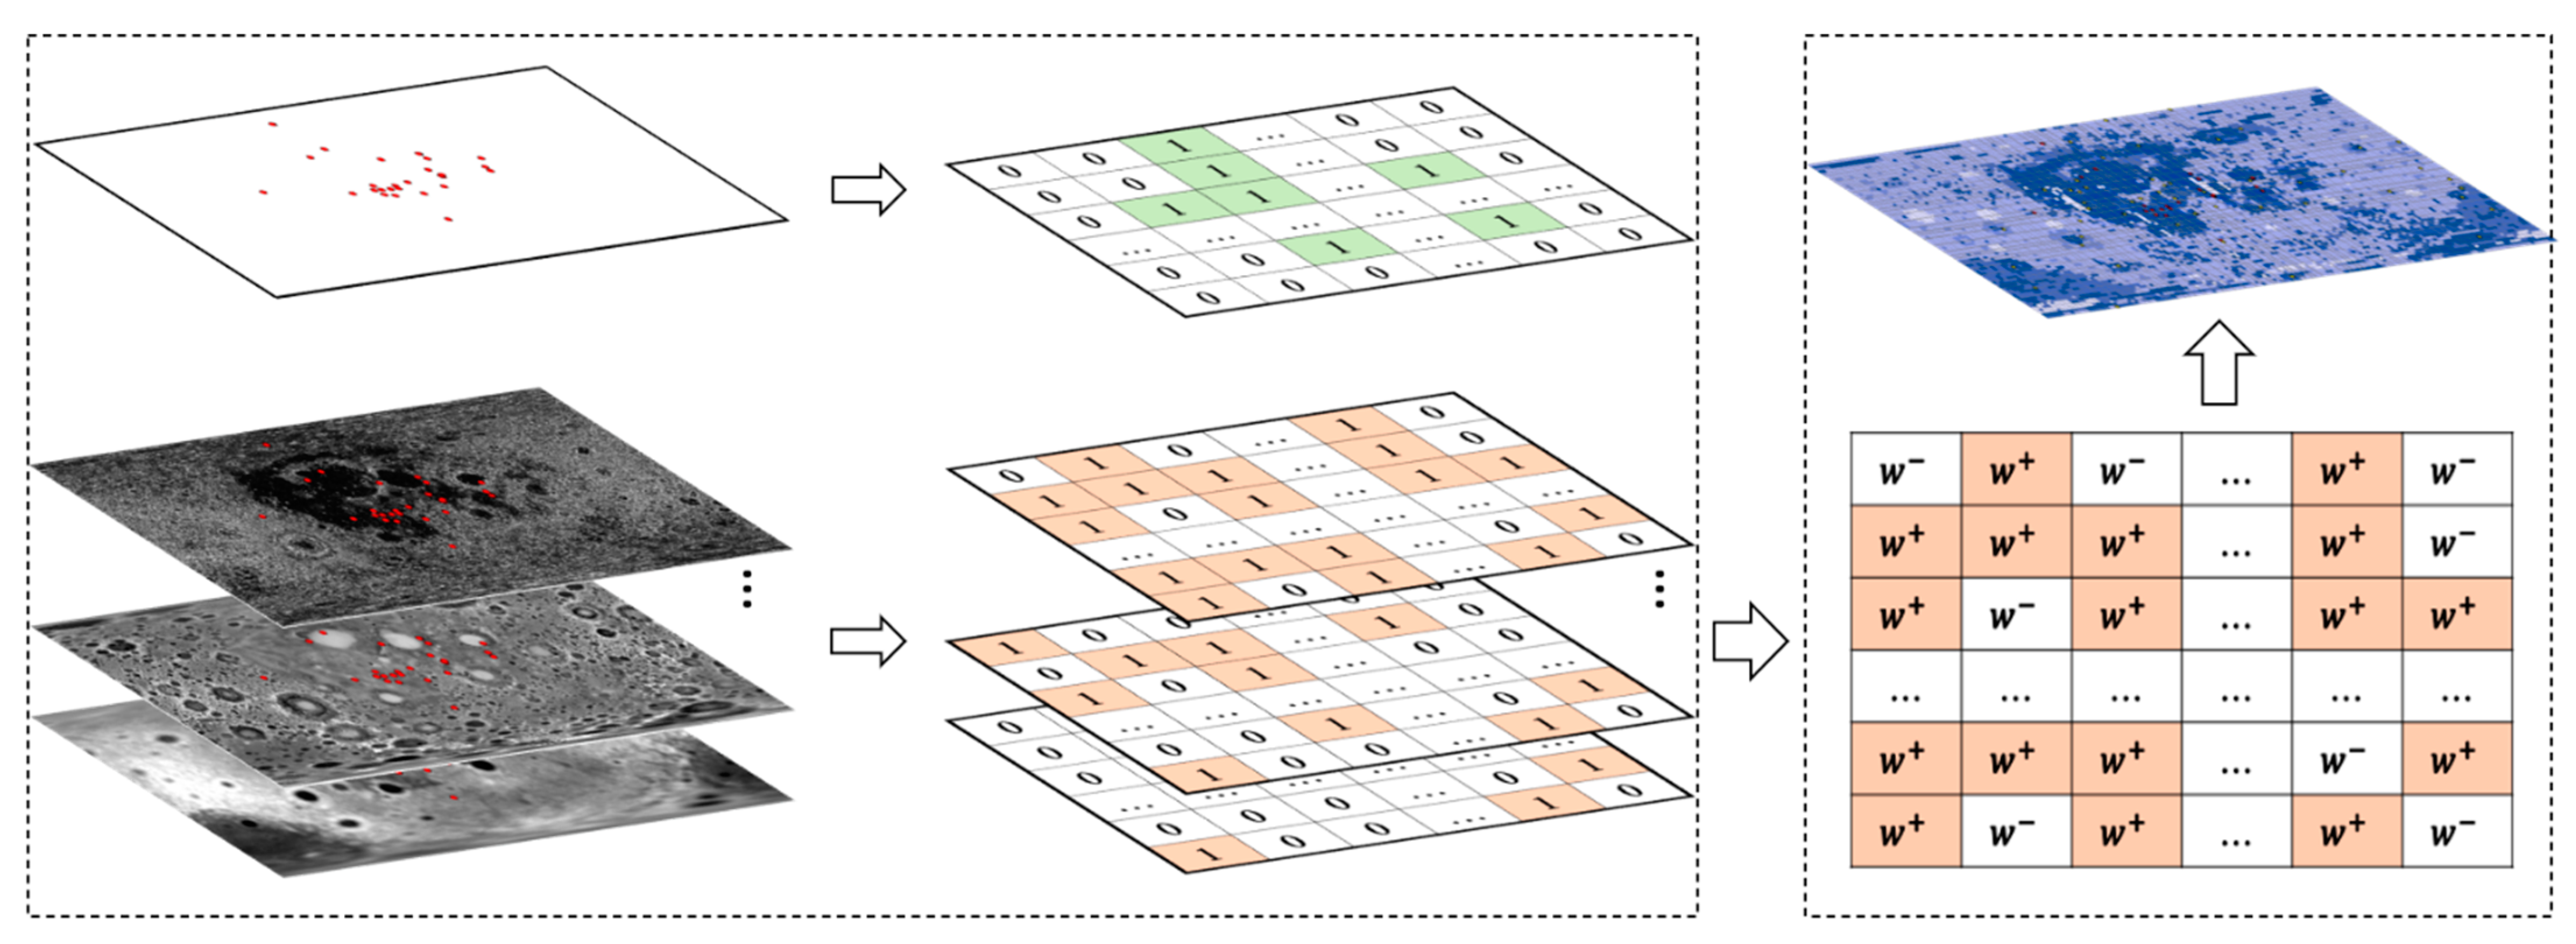
Data input mainly includes two types of data: the evidence layer and the target layer. Since our theme is to screen suitable landing zones for the whole moon, we need to ensure that the resolution and accuracy of the selected data are acceptable for the whole moon. Evidence layers mainly include lunar crust thickness, roughness, slope, digital elevation model, gravity gradient, impact crater radius being iron oxide distribution, and lunar soil optical maturity. Target layers are Apollo (Nos. 11–17), Luna (Nos. 16, 17, 20, 21, 23, 24), Surveyor (Nos. 1, 2, 3, 5, 6, 7), Chang’E 3, Ranger (No. 6–9), CRAIL, and LADEE. There are a total of 50 potential human landing sites in the target layer.
(2)
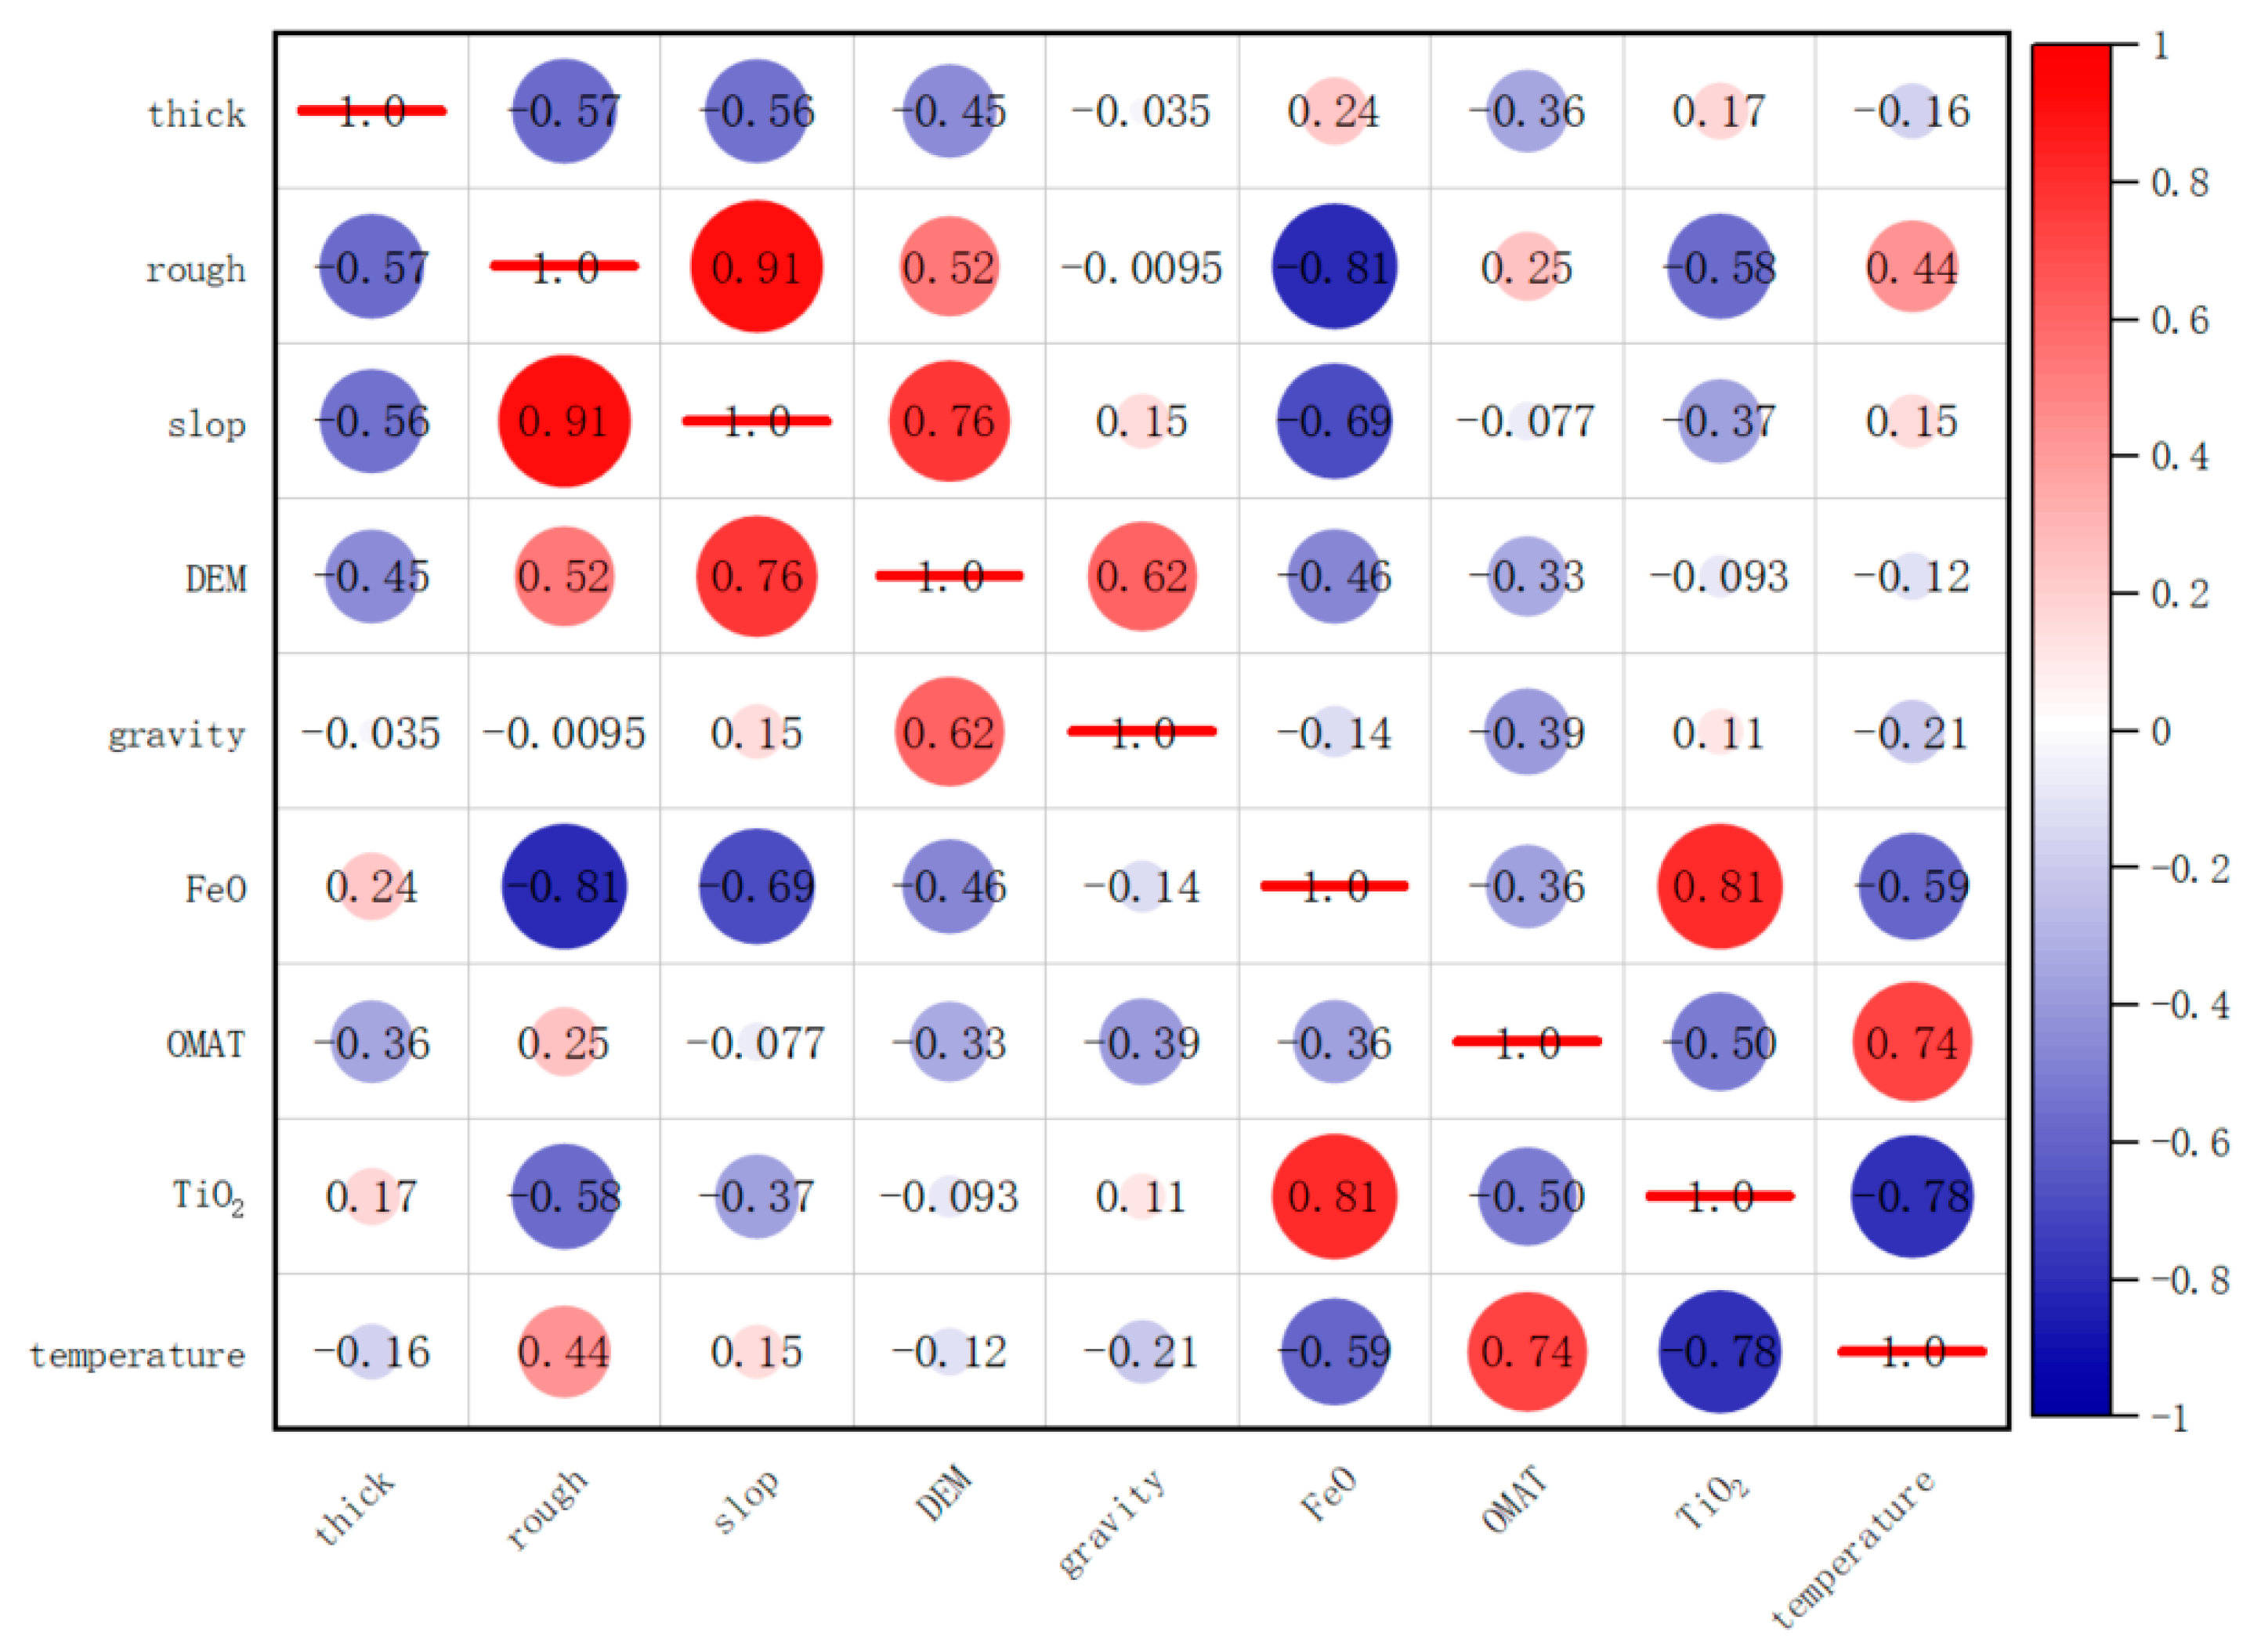
Data preprocessing: grid division on the evidence layer data for the whole moon is performed. After cropping the edge pixels, the mean value of the pixels in each cell is calculated and the correlation coefficient test is carried out on the evidence layer. Then, each evidence layer and the landing point layer are represented by two-state variables, respectively.
(3)
Calculation of the weights of evidence: calculate the prior probability of each evidence factor, the weight in each evidence factor cell, and the Bayesian posterior probability and judge the landing suitability of the area according to the final posterior probability in each cell.
(4)
Fractal calculation: according to the semi-parabolic distribution in the fuzzy distribution, the complexity of the number of impact craters in each cell is determined by the fuzzy membership degree. According to the total number of cells containing more than the number of impact craters in the cells, the linear regression fitting of the double logarithmic plot is used to determine the threshold, and then the distribution complexity of impact craters in each cell is calculated by the threshold. According to the number complexity and distribution complexity of each cell, the posterior probability calculated by the weights of evidence is changed subsequently.
(5)
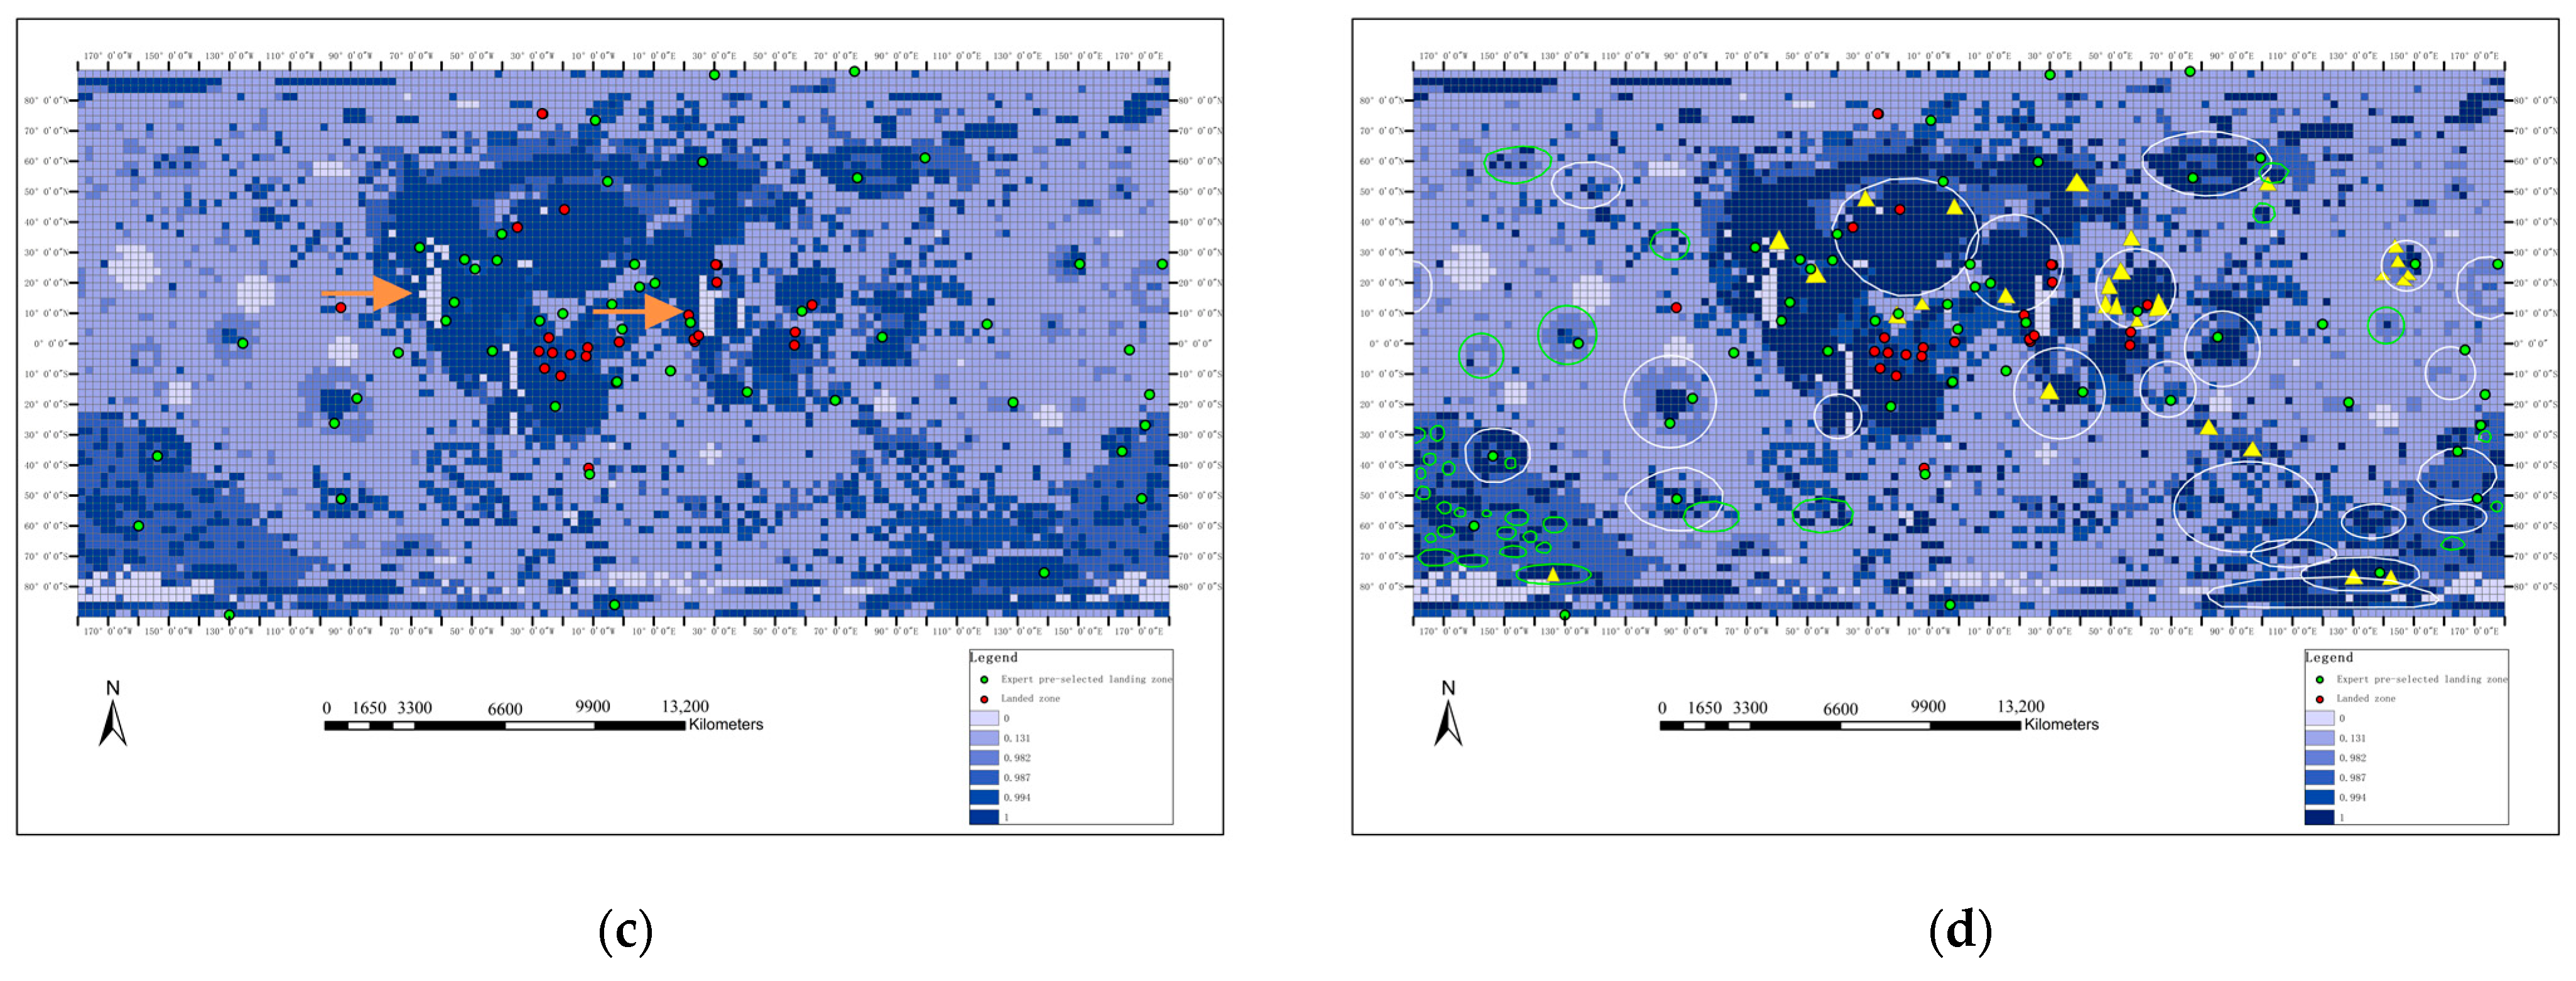
Result output: the final result is a posterior probability map based on weights of evidence and fractal calculations, which represents the whole-moon landing zones suitability. The manually preselected landing zones and impact crater data are superimposed on it to verify the correctness of the results.

2.2.2. Datasets Introduction

The input dataset is whole-moon geological data in tiff format, mainly including whole-moon roughness [43], slope [44], lunar soil optical maturity (OMAT) [45], lunar crust thickness [46], digital elevation model (DEM) (https://astrogeology.usgs.gov/search/details/Moon/LRO/LOLA/Lunar_LRO_LOLA_Global_LDEM_118m_Mar2014/cub (accessed on 2 February 2021)), gravity gradient (https://pgda.gsfc.nasa.gov/products/50 (accessed on 10 February 2021)) and FeO content distribution [47], TiO2 [47], and temperature [48]. These data reflect the changes in topography and stratum materials throughout the moon and can constrain the selection of landing areas from an engineering and scientific perspective. It has important reference significance for the selection of landing areas, so it is used as the evidence layer. Fifty human landing sites such as Apollo and Chang E in SHP format are considered. These sites mainly include Apollo 11, 12, 13, 14, 15, 16, and 17, Luna 16, 17, 20, 21, 23, and 24, Surveyor 1, 2, 3, 5, 6, and 7, Chang’E-3, Ranger 6, 7, 8, and 9, CRAIL, and LADEE. These are areas that have had successful landings throughout human history, which make them a good choice for the target layer.

2.2.3. Evidence Factor Selection Based on Correlation Coefficient

The application of the weights of evidence method must first ensure that the evidence factors are independent of each other. The correlation coefficient was first proposed by statistician Carl Pearson. It is a measure of the degree of linear correlation between variables and is commonly used to test the independence of variables. This relationship is represented by the letter ρ :
ρ ( X , Y ) = c o v ( X , Y ) σ X σ Y = E [ ( X μ X ) ( Y μ Y ) ] i = 1 n ( X i μ X ) 2 i = 1 n ( Y i μ Y ) 2 ,
where c o v ( X , Y ) is the covariance of X and Y , σ X is the variance of X , and σ Y is the variance of Y . The correlation coefficient ρ of Pearson defines the degree of correlation between two variables. The closer it is to 1, the stronger the degree of correlation between the variables; the closer it is to 0, the weaker the degree of correlation between the two variables. Correlation tests were performed on the nine pieces of candidate evidence data mentioned in the dataset introduction. The calculated correlation coefficient results are shown in Figure 2.
The correlation coefficient between FeO and TiO2 is 0.93, indicating that the correlation coefficient between the two is very high, and FeO is used to present these two pieces of data. The correlation coefficient between temperature and lunar soil optical maturity is 0.63. The correlation between the two is relatively high and the connotation is very close in nature. The lunar soil optical maturity layer is retained. The slope and roughness have a correlation coefficient of 0.74, which indicates a strong relationship between the two. However, both are retained because they characterize two different important factors that are of interest to the probe during landing. From the original nine options for evidence layers, seven layers of lunar crust, thickness, roughness, slope, digital elevation model, gravity gradient, iron oxide content distribution, and lunar soil optical maturity, were selected as evidence layers.

2.2.4. Site Selection Method Based on Weights of Evidence

The WoE method adopts the Bayesian statistical analysis mode to calculate the prior probability and posterior probability of each evidence factor, and then divides the prospect areas of I, II, and III [32,33,40,41,42]. For the definition of the I, II, and III levels, it can be divided artificially according to the size of the posterior probability value from large to small.
Figure 3 shows a schematic diagram of a simulation of suitable landing zones calculated using the weights of evidence. First, we calculate the average value of the pixel points in the cell after the whole-moon data are divided into grids. Then, we use the two-state variable divide to represent each evidence layer and landing point layer. Next, we calculate the prior probability of each evidence factor and the weight in each evidence factor cell to obtain the Bayesian posterior probability map. Therefore, applying the weights of evidence method to the selection of the landing zones can delineate favorable areas for landing. In short, it is a method of performing statistical operations on the selected evidence layer, and of ultimately obtaining the posterior probability value at each point on the divided grid and inferring whether it meets the requirements according to the posterior probability.

2.2.5. Calculate the Posterior Probability of a Single Evidence Factor

In the data preprocessing, the edge pixel points of each layer are clipped and the independence test is performed, and the mean value layer of each grid and the human landing point layer are expressed as binary variables. The prior probability P ( D ) is determined according to the total number of divided cells and the number of cells with landing sites, and the conversion to prior odds is O ( D ) .
P ( D ) = D N ,
O ( D ) = P ( D ) ( 1 P ( D ) ) ,
where N is the total number of cells divided into the prediction area, and D is the number of cells containing the landing point. P ( D ) is the probability that any unit contains a landing site, and O ( D ) is another form of P(D), which is convenient for subsequent calculations.
The presence and absence of evidence factors are represented by A and A ¯ , respectively, and the presence and absence of the cell is represented by D and D ¯ , respectively. The cell situation is divided into evidence factor and landing site co-existence, which is represented by P ( D | A ) .   P ( D ¯ | A ¯ ) indicates that the evidence factor and the landing point do not exist at the same time. P ( D ¯ | A ) indicates that the evidence factor exists but the landing point does not exist. P ( D | A ¯ ) indicates that the evidence factor does not exist but the landing point exists. The following compute the conditional probabilities for the four cases:
P ( D | A ) = P ( A D ) P ( A ) ,
P ( D ¯ | A ) = P ( A D ¯ ) P ( A ) ,
P ( D | A ¯ ) = P ( A ¯ D ) P ( A ¯ ) ,
P ( D ¯ | A ¯ ) = P ( A ¯ D ¯ ) P ( A ¯ ) ,
where P ( A D ) = N ( A D ) / N . N ( A D ) is the total number of cells with both evidence factors and landing sites. The posterior probability can be understood as the probability that there is a landing point in the presence of the evidence factor A  P ( D | A ) and the prior odds O ( D | A ) . Similarly, the probability P ( D | A ¯ ) when the evidence factor does not exist can be obtained and the prior odds O ( D | A ¯ ) .
P ( D | A ) = P ( A | D ) P ( A ) P ( D ) ,
P ( D | A ¯ ) = P ( A ¯ | D ) P ( A ¯ ) P ( D ) ,
O ( D | A ) = P ( D | A ) P ( D ¯ | A ) = O ( D ) P ( A | D ) P ( A | D ¯ ) ,
O ( D | A ¯ ) = P ( D | A ¯ ) P ( D ¯ | A ¯ ) = O ( D ) P ( A ¯ | D ) P ( A ¯ | D ¯ ) ,
Take the natural logarithm on both sides of the equations O ( D | A ) and O ( D | A ¯ ) :
l n ( D | A ) = l n ( D ) + l n P ( A | D ) P ( A | D ¯ ) ,
l n ( D | A ¯ ) = l n ( D ) + l n P ( A ¯ | D ) P ( A ¯ | D ¯ ) ,
Computing weights for a single evidence factor:
W + = l n P ( A | D ) P ( A | D ¯ ) ,
W = l n P ( A ¯ | D ) P ( A ¯ | D ¯ ) ,
where W + and W   represent the weight values in the presence and absence of the evidence factor in the evidence weights model, respectively.   C = W + W , C represents the landing favorable degree, a positive value of C means favorable landing, and a negative value of C means unfavorable landing.
Converted to a posterior probability linear model:
l n ( D | A ) = l n ( D ) + W + ,
l n ( D | A ¯ ) = l n ( D ) + W ,
In the case of synthesizing multiple evidence factors, the metallogenic factors are set to be A 1 , A 2 , , A n , and similarly, it is calculated according to the single evidence factor calculation steps. Assuming that the evidence factors A 1 , A 2 , , A n are conditionally independent, the posterior probability of whether it is suitable for landing can be obtained when the evidence factors A 1 , A 2 , , A n exist.
P ( D | A 1 A 2 A n ) = P ( A 1 A 2 A n | D ) P ( A 1 A 2 A n ) P ( D ) ,
P ( D ¯ | A 1 A 2 A n ) = P ( A 1 A 2 A n | D ¯ ) P ( A 1 A 2 A n ) P ( D ¯ ) ,
l n ( D | A 1 k A 2 k A n k ) = l n ( D ) + j = 1 n W j k ,
P ( D | A 1 k A 2 k A n k ) = e x p ( l n ( D | A 1 k A 2 k A n k ) ) 1 + e x p ( l n ( D | A 1 k A 2 k A n k ) ) ,

2.2.6. Data Preprocessing

The grid pixel average layer of the seven evidence layers after correlation coefficient screening is expressed as a 0–1 variable. Traverse the mean gird layer of each evidence layer. For some layers where the larger the pixel value is, the better; if it is greater than the threshold, set it to “1”. If it is less than the threshold, set to “0”. On the contrary, for some layers whose pixel value is as small as possible, if it is less than the threshold, it is set to “1”, and if it is greater than the threshold, it is set to “0”. Since the set grid subscript starts from 0, change the coordinate range of the lunar landing point from −90° to 90°, −180° to 180° to 0° to 180°, 0° to 360°. According to the coordinate information of the landing point on the moon, traverse the divided grid to determine whether the unit grid contains a landing point. This cell is set to “1” if it contains one or more landing points, otherwise it is set to “0”. In this way, the coordinates of the landing points are represented by two-state variables, and the grid layer of the landing points is output.
Traverse the divided grid to determine whether the unit grid contains a landing point. Traverse the coordinates of the landing site in binary variables. Counting the total number of cells with landing sites is to calculate the total number of cells in the grid layer of the landing sites denoted as “1”. Calculate m/n to obtain a priori probability of suitable landing for any cell, where n is the total number of cells divided in the whole moon. Get the prior odds based on the prior probability.
Traverse the divided grids to determine the state of the grid pixel mean layer at the corresponding position of the cell and the grid layer of the landing point. There are a total of four cases: (1) the grid’s mean value layer and the grid layer of the landing point are both “1”; (2) the grid’s mean value layer and the grid layer of the landing point are both “0”; (3) the grid pixel mean layer is “1” and the grid layer of the landing point is “0”; and (4) the mean layer of grid pixels is “0”, and the grid layer of the landing sites is “1”. Calculate the total number of cells in the four cases and obtain w + when the number of cells at the landing site appears in the evidence layer and obtain w when the number of cells at the landing site does not appear in the evidence layer. Calculate the sum of the superimposed weights of each cell, add them to the prior probability, and obtain the anti-value, which is recorded as Q , and then calculate Q / ( 1 + Q ) to obtain the posterior probability.
Determine the prior probability based on the total number of cells divided and the number of cells with landing sites. Use the weights of evidence method to calculate the prior probability of each evidence factor. Then, the weight of each cell of each evidence factor is calculated, and the Bayesian posterior probability is ultimately calculated. The higher the probability, the better the landing. The more evidence layers and the larger the volume of statistical data, the better the statistical results will be. The addition of sufficient evidence layers can make the landing zones selection calculate a more accurate posterior probability. With the addition of sufficient evidence layers, more accurate posterior probabilities can be calculated to delineate possible landing zones.

2.3. Optimizing Whole-Moon Landing Zones Based on Fractals

2.3.1. Impact Crater Distribution Complexity Determination

Impact craters are the most common and significant geomorphological units and geological structures on the lunar surface and are important objects for planetary geology research (such as impact crater dating, lunar performance history, the process of lunar soil impact transformation, etc.) [49]. These craters also have a great impact on the safety of landing on the lunar surface. When the number or size distribution of impact craters in an area is complex, it means that that area has a relatively complex terrain, and the landing difficulty will increase. Conversely, it is relatively easy to land in an area with flat terrain and a simple surface. In general, the size of an impact crater largely determines the relief and slope of the terrain near it. In addition, if the larger impact crater is flat in the middle, but the surrounding terrain is high, the lighting, communication, and temperature conditions will also be poor. These conditions would make it difficult for the probe to survive for a long time if it landed in the impact crater [37]. In short, the lunar probe should avoid terrain with a complex distribution of impact craters and seek to land in areas with a less complex distribution of impact craters.

2.3.2. Fuzzy Membership to Determine the Complexity of Impact Crater Number Distribution

In fuzzy weights of evidence, fuzzy membership is used to classify variables, instead of directly using binary variables in the weights of evidence method, to achieve multi-classification [50]. The fuzzy membership function is introduced into the weights of evidence to form the fuzzy weights of evidence method [33]. The posterior probability is more accurate than the ordinary weights of evidence method, and the influence of the non-independence of the evidence factors is reduced. The fuzzy membership degree is calculated by the number of impact craters, and it can be seen from the analysis that the distribution trend is that the semi-paraboloid is smaller (Figure 4a).
First, determine the set A 1 with a high degree of correlation between the evidence factor and the training point (membership function value μ A = 1 ); second, determine the set A 2 with a low degree of correlation (membership function value μ A = 0 ). The function value of 0 < μ A < 1 can be obtained through the membership function.
μ A ( x ) = C m i n x A 2 C m i n x A 1 C m i n x A 2 C ,
The fuzzy membership degree is introduced into the data processing of impact craters to characterize the distribution complexity of the number of impact craters in the grid divided by the whole moon. The higher the number of impact craters that are in the cell, the more complex the terrain is, and the higher risk that area is for landing. The fewer the number of impact craters that are present in a cell, the simpler the terrain is, and the safer that area is for landing. Figure 5 shows the 10 selected area samples, and Figure 5a shows the distribution of impact craters. The lighter the background color, the lower the posterior probability. Furthermore, the distribution of impact craters is becoming more and more complex, which helps to verify the accuracy of the obtained posterior probability. As shown in Figure 5b, as the distribution of impact craters shown in Figure 5a becomes more complex, the geological properties of each evidence layer (such as roughness, slope, etc.) are more complex, and the area becomes more challenging for landing. At the same time, Figure 5c also quantifies the changes of other evidence layers caused by the complex distribution of impact craters. The abscissa of the line graph in Figure 5c is the average pixel value of each evidence layer, and the ordinate is the serial number of the corresponding point. It can be observed from the line chart that as the distribution of impact craters becomes more complex, slope, roughness, and DEM values in the cell gradually increase, while the FeO content and the thickness of the lunar crust decrease. The OMAT increases variably and the gravity value decreases variably. The layers of evidence that reflect a strong correlation with crater complexity are slope, roughness, DEM, FeO content, and lunar crust thickness.
The concept of fuzzy membership is introduced to indicate whether the distribution of impact craters in a cell is “complex” or “simple”. Figure 4 shows the statistical results of the total number of cells containing more than the number of impact craters in the cells under different conditions. The segment nodes are obtained by fitting the second half of the semi-parabolic distribution with a smaller size. In Figure 4b, when the number of impact craters is nine, it corresponds to the fitting inflection point y in Figure 4a. Similarly, when the number of impact craters is close to zero, it corresponds to the fitting point x in Figure 4a. Based on this fitting idea, the size and complexity of the impact crater can be determined according to the inflection point. After this, the posterior probability map can be generated.

2.3.3. Using the Fractal Method to Determine the Complexity of Impact Crater Size Distribution

The process of local high enrichment and continuous superposition of metallogenic elements such as Au and Cu can form a multifractal field. The element concentration-area C-A fractal model is good at dealing with such nonlinear fields [51]. The area of the area where the element content A is greater than a certain content threshold c is expressed as:
A ( ρ > c ) c β ,
where β is the singularity index—that is, the fractal dimension of the element in a scale-free region. Transform Equation (23) and take the logarithm to get:
l n ( A ( ρ > c ) ) = β l n ( c ) + l n ( K ) ,
where K is the proportional coefficient. In the double logarithmic coordinate, when the element concentration is greater than a certain threshold, the area value has a linear relationship with this concentration. The resulting slope β is known as the fractal dimension. In the synthesis of multi-metallogenic element geochemical anomalies, different thresholds obtained by least squares fitting can be used to determine the lower limit of the anomaly and then effectively delineate the range of the corresponding geochemical anomaly [52].
The spectral density-area (S-A) is an extension of the C-A model in the frequency domain, and the multifractal theory proves that the exponential relationship of the fractal field of a geological body with self-similarity is [53]:
A ( S ) S α ,
where A ( S ) is the area occupied by the energy greater than the threshold S in the frequency domain and α is the fractal dimension.
The threshold of the double logarithmic plot is usually calculated by linear regression, polynomial regression, neural network, and other methods [54,55]. Using a linear regression method for machine learning, the threshold is automatically calculated by fitting one or more segments [56]. The essence of the linear regression fitting algorithm is the least squares method. Let the original dataset be { ( x i ,   y i ) } ; when the threshold of the lower limit of abnormality is set, this should make the sum of squared of the fitting differences become the smallest:
δ 2 2 = m i n ( i = 0 n δ i 2 ) = m i n ( i = 0 n ( s ( x i ) y i ) 2 ) ,
where the s ( x ) polynomial is:
s ( x ) = a 0 φ 0 ( x ) + a 1 φ 1 ( x ) + + a j φ j ( x ) + b ( i < n ) ,
where δ is the fitting difference, x i and y i are each data point in the dataset, s ( x ) is the fitting line polynomial, φ j ( x ) is the piecewise fitting line, and a j is the piecewise fitting line slope. b is the piecewise fitted line intercept.
Due to the continuous formation of all-moon impact craters, the process is similar to the superposition of fields in geology. The distribution complexity of impact craters in each cell is determined according to the fractal—that is, the total number of impact craters containing larger than different impact crater radii under different circumstances is calculated by fractals. In this paper, the database of impact craters with a radius of 5–20 km is used [57], and the total number of impact craters S larger than the radius threshold is counted with different radius A as the threshold. Figure 6 shows the l o g ( S ) l o g ( A ) double logarithmic plot linear regression fitting results. The threshold is determined by calculating the inflection point value, and the lower limit of complexity can be determined by taking the threshold as the demarcation point. The fractal calculation result can be roughly divided into three segments and the absolute value of the slope of the fitting straight line of the three segments is the fractal dimension α . The size distribution complexity of the impact crater in the cell is judged with the threshold as the limit, and the probability of the cell with the more complex impact crater is reduced. Conversely, raising the probability that the crater situation in the cell is simpler changes the posterior probability calculated by weights of evidence. When the fractal dimension α is small, it indicates that the distribution of impact craters in the cell is relatively simple, and the posterior probability should therefore be larger. When the fractal dimension α is large, it indicates that the distribution of impact craters in the cell is complex, and the posterior probability should be smaller.

3. Results

3.1. The Optimized Method of Lunar Zones Based on Weights of Evidence and Fractal

After the correlation coefficient selection and preprocessing, the dataset used in this paper is shown in Table 1. The resolution, range and source of the data used are listed in the table. We conducted experiments with these datasets, according to which the whole moon is divided into 72 × 144 grids, and the width of the cells is 278.3 km. We considered factors such as slope and roughness in engineering constraints and iron oxide, OMAT and other factors in scientific constraints, and conducted experiments with two, five, and seven evidence layers, respectively. Based on the weight of evidence method and the fractal method, the posterior probability indicating the suitability of the full lunar landing area is automatically calculated quantitatively. The specific results and analysis are as follows.
Figure 7 shows that with the gradual increase in the evidence layer, the selection of the suitable landing area is more accurate, which fully proves the mathematical characteristics of the weights of evidence algorithm. That is, when the volume of statistical data is sufficient, better statistical results can be obtained.
Figure 7a shows the posterior probability results obtained by the participation of two evidence layers of thickness and roughness of the lunar crust. Since only two evidence layers are selected, the constraints that play a role are relatively small, so the demarcated suitable landing area is large. The central region of the moon is more suitable for landing, which is more consistent with the general knowledge that the middle of the moon is flatter.
Figure 7b shows the posterior probability results of five layers of evidence including thickness, roughness, slope, DEM, and gravity anomalies of the lunar crust. Comparing with the results in Figure 7a, after adding the evidence layers of slope, DEM, and gravity anomaly, the demarcated area is more accurate. At the same time, a clearer landing zones level is further divided into categories such as suitable landing zones, more suitable landing zones, and unsuitable landing zones.
Figure 7c shows the posterior probability results for seven layers of evidence. The change in results is not particularly large compared to Figure 7b, but still excludes some regions in the middle of the moon (indicated by the orange arrows).
Figure 7a–c show the mathematical characteristics of the weights of evidence algorithm by increasing the number of evidence layers layer by layer. That is, when the volume of statistical data is sufficient, better statistical results can be obtained. For the selection of the landing zones, with the addition of sufficient evidence layers, a more accurate posterior probability can be calculated to provide a quantitative basis for site selection.
Figure 7d shows the superimposed effect of the distribution of impact craters/basins that may have excavated and exposed the lower lunar crust or mantle material and the posterior probability map. The green circled area is the impact basin where the lunar mantle material is exposed, the white circled area is the impact basin where the lower lunar crust material is exposed, and the yellow triangle is the olivine detected by “Moon Goddess”. By comparison, white circles and yellow triangles are distributed in the central part of the low-latitude area (the lunar sea area), indicating that there may be a lower lunar crustal material impact basin and olivine here. At the same time, the posterior probability here is higher, which is more suitable for landing to carry out scientific research related to impact. The lunar mantle material and the lower lunar crust material are distributed in the high and middle latitudes. These delineated areas have certain scientific research value, and the calculated posterior probability is high, which is suitable for landing. The suitable landing zones for the whole-moon posterior probability map—the dark blue cell—is roughly delineated, especially in the South Pole region.

3.2. Landing Zones Analysis Results of Grids with Different Granularities

To make the results more intuitive, the calculated posterior probability is rendered in color, and the attached drawing is rendered in blue. The darker the shade of blue, the more suitable the landing. Figure 8 shows the superposition result of the posterior probability map and the artificial expert screening layer for a total of 50 points and the impact crater database. The red points in the figure are the landing points, and the green points are the landing areas manually selected by experts. The data range of the whole moon is 20,037.396 km × 40,074.968 km, and the common divisor of the number of rows and columns of the pixel matrix of each layer is taken as the divided grid size. If the pixel value of some layers cannot be divisible by the grid size, the edge pixels need to be cropped. When the whole moon range is divided into 72 × 144 cells, each cell size is 278.30 × 278.30 km (Figure 8a). When divided into 288 × 576 cells, the size of each cell is 69.57 km × 69.57 km (Figure 8b). Comparing Figure 8a,b, it can be clearly seen that the smaller the divided cells, the finer the determined posterior probability map, and the more accurate the area suitable for landing. After increasing the number of grid divisions, the general shape of the posterior probability results does not change significantly, indicating that the calculation results of the weights of evidence method are generally stable.
Table 2 shows the statistical results of the posterior probability statistics of the optimal landing zones for the whole moon based on the weights of evidence and fractal when the whole moon range is divided into 288 × 576 cells. Landing sites (red dots) are distributed in the first gradient (posterior probability 1.000), with statistical probability 0.58 distributed in the second gradient (posterior probability 0.999), and statistical probability 0.26 distributed in the third gradient (posterior probability 0.999). The statistical probability is 0.16 (with a posterior probability of 0.112) and there are no landing sites distributed on the fourth gradient (with a posterior probability of 0.000). The expert manually selected the landing zones (green points) with a statistical probability of 0.587 for the distribution in the first gradient (posterior probability 1.000) and a statistical probability of 0.239 for the distribution in the second gradient (posterior probability 0.999). The statistical probability of distribution in the third gradient (posterior probability 0.112) and the statistical probability of distribution on the fourth gradient (posterior probability 0.21) are both 0.086. It can be observed that the statistical probability of distribution in the first two levels exceeds 80%, which again verifies the effectiveness of the method. In addition, it is found that when the accuracy is higher (when more cells are divided), the landing area and the expert’s manually selected landing area are better dispersed in different cells, and the statistical probability of the landing area distributed in the first two levels improves significantly.

3.3. Analysis of Suitable Landing Zones in the Pole Region

In recent years, scientists at home and abroad have developed a strong interest in polar landings on the moon. To better understand the possible landing areas in the polar regions, the polar slope and the posterior probability are compared and displayed. Figure 9a shows the Antarctic slope data under polar projection, and the calculated posterior probability is shown in Figure 9b. It can be seen from the figure that where the gray value of Figure 9a is higher (that is, where the slope is lower), the posterior probability in Figure 9b corresponding to the posterior probability is larger. The area delineated by the red fan-shaped box in Figure 9b has a relatively dense distribution of cells with a large posterior probability. This area also forms a continuous sector locally, which can be used as a candidate area for future lunar probe landings. Similarly, Figure 9c shows the arctic slope data under polar projection, and the calculated posterior probability is shown in Figure 9d.

4. Discussion

Although the proposed method in this paper can automatically select the space areas suitable for landing on the whole moon, it is relatively simple and various assessment indicators still need to be further refined and optimized.
(1)
The whole-moon landing area optimization method based on the weights of evidence and fractals can delineate the range of suitable landing areas for the whole moon, but its accuracy is limited by the resolution of the original data involved in the calculation, so data with higher precision are required to initiate the calculation.
(2)
At present, this method can only use the data of the whole moon for calculation, and this limitation will need to be improved in the future. It needs to be able to calculate any area and select the area that meets the landing conditions within the selected space.
(3)
At present, the calculations of the landing areas have not been carried out for specific scientific targets, and only involves a small amount of content such as iron and gravity anomalies. In the future, it is necessary to integrate the 1:2.5 million lunar geological map completed in 2021 [58] and other datasets for further lunar geological scientific research. Future researchers may carry out one or more in-depth scientific research assignments that consider the moon’s geological structure and mineral resources.

5. Conclusions

Since engineering constraints, science, and resource constraints should be considered in the selection of landing areas, a new method based on the weights of evidence and fractals is proposed to select suitable landing areas for probes throughout the moon.
Seven types of data such as lunar crust thickness, roughness, slope, digital elevation model, gravity gradient, iron oxide content distribution, and lunar soil optical maturity were selected as evidence layers, and existing landing sites were used as the target layer. First, all evidence layers and the target layer as original data are preprocessed. Next, the weights of evidence method is used to calculate the posterior probability that characterizes the suitability of the landing zones. Finally, the distribution complexity of impact crater data is calculated by fractal to further limit the posterior probability calculated by the weights of evidence. A technical route is implemented: from data entry, to data preprocessing, to weights of evidence and fractal calculations, and finally to obtaining the suitability of the landing zone results.
By comparing and analyzing the posterior probability map of the landing areas with the landing points and manual optimal landing areas, most of the landing points or areas reflecting the optimal knowledge of the landing areas fall within the suitable landing areas, and the calculation results of different resolutions are relatively low. It is stable and is aligned with the scientific research area of the distribution of impact craters/basins of the lower lunar crust or mantle material, which proves the feasibility of this method.
The method of quantitatively and automatically calculating and delineating suitable landing areas for the whole moon can greatly reduce artificial pressure and subjective factors, which is conducive to changing the traditional experts’ qualitative selection of landing areas. The intelligence optimization of landing areas has been beneficially explored.

Author Contributions

Writing—original draft preparation, data curation and visualization, Y.C.; methodology and funding acquisition, Y.W.; resources, J.L. and J.W.; formal analysis, X.Z. All authors have read and agreed to the published version of the manuscript.

Funding

This research has been supported by national key R&D program of China (2021YFC2901801), the National Natural Science Foundation of China (41941003), the Strategic Priority Research Program of Chinese Academy of Sciences (XDB41000000), the Key Research Program of Frontier Sciences, CAS (QYZDY-SSW-DQC028) and the Beijing Municipal Science and Technology Commission (Z181100002918003).

Data Availability Statement

The roughness: from the thesis [43]. The slope: from the thesis [44]. The optical maturity of the lunar soil: from the thesis [45]. The thickness of the lunar crust: from the thesis [46]. The distribution of FeO content: from the thesis [47]. The gravity gradient: https://pgda.gsfc.nasa.gov/products/50 (accessed on 10 February 2021). DEM: https://astrogeology.usgs.gov/search/details/Moon/LRO/LOLA/Lunar_LRO_LOLA_Global_LDEM_118m_Mar2014/cub (accessed on 2 February 2021). The distribution of TiO2 content: from the thesis [47]. The distribution of temperature: from the thesis [48]. The database of impact craters with a radius of 5–20 km: from the thesis [57].

Acknowledgments

Thank you to the anonymous review experts and editors for their comments.

Conflicts of Interest

The authors declare no conflict of interest.

References

  1. Sutton, R.L. Preliminary Geologic Investigation of the Landing Site: Appendix A: Lunar Surface Orientations of Apollo 17 Rock Samples; National Aeronautics and Space Administration: Washington, DC, USA, 1973. [Google Scholar]
  2. Zhang, H.; Wang, Q.; Zou, Y.; Ma, J.; Kang, Y.; Zhang, Y.; Liu, J.; Yang, R.; Pei, Z.; He, H.; et al. Overview of lunar exploration and International Lunar Research Station. J. Chin. Sci. Bull. 2020, 65, 2577–2586. [Google Scholar]
  3. Schaber, G.G.; Sutton, R.L. Lunar locations and orientations of rock samples from Apollo missions 11 and 12. In Proceedings of the Second Lunar Science Conference, Houston, TX, USA, 11–14 January 1971. [Google Scholar]
  4. Ye, P.; Huang, J.; Sun, Z.; Yang, M.F.; Meng, L.Z. The process and experience in the development of Chinese lunar probe. Sci. Sin. 2014, 44, 543. [Google Scholar] [CrossRef]
  5. The Lunar Sample Preliminary Examination Team. Preliminary examination of lunar samples from apollo 14. Science 1971, 173, 681–693. [Google Scholar] [CrossRef]
  6. Liu, J.; Zeng, X.; Li, C.; Ren, X.; Yan, W.; Tan, X.; Zhang, X.; Chen, W.; Zuo, W.; Liu, Y.; et al. Landing Site Selection and Overview of China’s Lunar Landing Missions. Space Sci Rev. 2021, 217, 6. [Google Scholar] [CrossRef]
  7. Li, C.L.; Liu, J.J.; Zuo, W.; Su, Y.; Ouyang, Z. Progress of China’s Lunar Exploration (2011–2020). Chin. J. Space. Sci. 2021, 41, 68–75. [Google Scholar] [CrossRef]
  8. Wang, X.H.; Mao, L.H.; Yue, Y.X.; Zhao, J.W. Manned lunar landing mission scale analysis and flight scheme selection based on mission architecture matrix. Acta Astronaut. 2018, 152, 385–395. [Google Scholar] [CrossRef]
  9. Emmanouil, D.; Ondrej, D.; Aliakbar, E. Location selection and layout for LB10, a lunar base at the Lunar North Pole with a liquid mirror observatory. Acta Astronaut. 2013, 85, 61–72. [Google Scholar]
  10. Eckart, P.; Aldrin, B. The Lunar Base Handbook: An Introduction to Lunar Base Design, Development, and Operations, 2nd ed.; McGraw-Hill: New York, NY, USA, 1999; pp. 23–64. [Google Scholar]
  11. Li, Z.J.; Guo, L.L.; Peng, K. Research on Site Selection of Manned Lunar Base. Manned Spacefl. 2015, 21, 158–162. [Google Scholar]
  12. Yuan, Y.; Zhao, C.; Hu, Z.Y. Prospect of lunar base construction scheme. J. Deep. Space Exploration 2018, 5, 374–381. [Google Scholar]
  13. Kim, K.J.; Whler, C.; Ju, G.H.; Lee, S.; Rodriguez, A.P.; Berezhnoy, A.A.; Gasselt, S.; Grumpe, A.; Aymaz, R. Korean lunar lander—Concept study for landing-site selection for lunar resource exploration. Int. Arch. Photogramm. Remote Sens. Spat. Inf. Sci. 2016, XLI-B4, 417–423. [Google Scholar]
  14. Wu, B.; Li, F.; Ye, L.; Qiao, S.; Huang, J.; Wu, X.Y.; Zhang, H. Topographic modeling and analysis of the landing site of Chang’E-3 on the Moon. Earth Planet. Sci. Lett. 2014, 405, 257–273. [Google Scholar] [CrossRef]
  15. Li, B.; Yue, Z.Y.; Zhang, J.; Fu, X.H.; Ling, Z.C.; Cheng, S.B.; Chen, J.; Yao, P.W. High-Resolution Terrain Analysis for Lander Safety Landing and Rover Path Planning Based on Lunar Reconnaissance Orbiter Narrow Angle Camera Images: A Case Study of China’s Chang’e-4 Probe. Earth Space Sci. 2019, 6, 398–410. [Google Scholar] [CrossRef]
  16. Jiang, H.K.; Tian, X.L.; Xu, A.A. A new segmentation algorithm for lunar surface terrain based on CCD images. Res. Astron. Astrophys. 2015, 15, 1604–1612. [Google Scholar] [CrossRef]
  17. Ding, M.; Cao, Y.F.; Wu, Q.X. Passive Image-based Safe Landing Site Searching and Slop Estimation in Probe Landing. J. Astronaut. 2009, 30, 2258–2264. [Google Scholar]
  18. Liu, S.; Huang, X.F. Design and verification of telecommunication system for Chang’E-4 Lander. Signal and Information Processing, Networking and Computers. In Proceedings of the 7th International Conference on Signal and Information Processing, Networking and Computers (ICSINC), Noida, India, 27–28 February 2020; pp. 527–534. [Google Scholar]
  19. He, L.; Ren, Q.H.; Feng, Y.J.; Zhang, J.H.; Liu, S.; Chen, S.Y. Real-time Dynamic Addressing for Spacecraft Soft Landing in the Lunar Surface. In Proceedings of the 2015 IEEE International Conference on Information and Automation, Lijiang, China, 8–10 August 2015; pp. 987–992. [Google Scholar]
  20. Su, Q.H.; Zhao, Y. Analysis method for lunar landers landing safety. J. Beijing Univ. Aeronaut. Astronaut. 2012, 38, 1522–1526. [Google Scholar]
  21. Liang, S.M.; Wang, Y.B.; Wang, L.W.; Wu, S.; Ji, S. Landing Process of Lunar Lander Simulated with Couple DEM-FEM Model. Chin. J. Solid Mech. 2019, 40, 39–50. [Google Scholar]
  22. Chen, Z.Y.; Liu, L.; Chen, S.L.; Cui, Y. Interval Uncertainty Analysis of Soft-landing Dynamics of Lunar Lander. Acta Armamentarii 2019, 40, 442–447. [Google Scholar]
  23. Flahaut, J.; Blanchette-Guertin, J.-F.; Jilly, C.; Sharma, P.; Souchon, A.; van Westrenen, W.; Kring, D.A. Identification and characterization of science-rich landing sites for lunar lander missions using integrated remote sensing observations. Adv. Space Res. 2012, 50, 1647–1665. [Google Scholar] [CrossRef]
  24. Qian, Y.Q.; Xiao, L.; Yin, S.; Zhang, M.; Zhao, S.Y.; Pang, Y.; Wang, J.; Wang, G.X.; Head, J.W. The regolith properties of the Chang’e-5 landing region and the ground drilling experiments using lunar regolith simulants. Icarus 2020, 337, 113508. [Google Scholar] [CrossRef]
  25. Lu, Y.; Wu, Y.Z.; Gregory, G.; Ma, J.S.; Cai, W.; Qin, N. Chronological sequence of Ch’ng’E-4 landing zones within Von Kármán crater. Icarus 2021, 354, 114086. [Google Scholar] [CrossRef]
  26. Di, K.C.; Xu, B.; Peng, M.; Yue, Z.Y.; Liu, Z.Q.; Wan, W.H.; Li, L.C.; Zhou, J.L. Rock size-frequency distribution analysis at the Chang’E-3 landing site. Planet. Space Sci. 2016, 120, 103–112. [Google Scholar] [CrossRef]
  27. Qiao, L.; Liu, X.Q.; Zhao, J.N.; Yu, W.; Long, X. Geological investigation of Luna 17, Apollo 15 and Chang’E-3 landing sites at Mare Imbrium of Moon. Sci. Sin.-Phys. Mech. Astron. 2016, 46, 029603. [Google Scholar]
  28. Li, F.; Zhang, H.; Wu, X.Y.; Dong, J. Analysis of Key Characteristics of Lunar South Pole for Landing. Spacecr. Eng. 2015, 24, 103–110. [Google Scholar]
  29. Wu, W.R.; Yu, D.Y.; Wang, C.; Liu, J.Z.; Tang, Y.H.; Zhang, G.; Zou, Y.L.; Ma, J.N.; Zhou, G.D.; Zhang, Z.; et al. Research on the main scientific and technological issues on lunar polar exploration. J. Deep. Space Explor. 2020, 7, 223–231. [Google Scholar]
  30. Jennifer, L.; Anthony, C.; Richard, C.; Bussey, B.; McGovern, A.; Beyer, R.; Lees, D.; Deans, M. Site selection and traverse planning to support a lunar polar rover mission: A case study at Haworth Crater. Acta Astronaut. 2016, 127, 308–320. [Google Scholar]
  31. Zhang, H.; Du, Y.; Li, F.; Zhang, H.; Ma, J.N.; Sheng, L.Y.; Wu, K. Proposals for lunar south polar region soft landing sites selection. J. Deep Space Explor. 2020, 7, 232–240. [Google Scholar]
  32. Agterberg, F.P.; Bonham-Carter, G.F. Weights of evidence modeling and weighted logistic regression for mineral potential mapping. In Computers in Geology; Davis, J.C., Herzfeld, U.C., Eds.; Oxford University Press: New York, NY, USA, 1993; pp. 3–32. [Google Scholar]
  33. Cheng, Q.M.; Agterberg, F.P. Fuzzy Weights of evidence method and its application in mineral potential mapping. Nat. Resour. Res. 1999, 8, 27–35. [Google Scholar] [CrossRef]
  34. Mandelbrot, B. How long is the coast of Britain? Statistical self-similarity and fractional dimension. Science 1967, 156, 636–638. [Google Scholar] [CrossRef]
  35. Cheng, Q. The perimeter-area fractal model and its application to geology. Math. Geol. 1995, 27, 69–82. [Google Scholar] [CrossRef]
  36. Xiao, L.; Qiao, L.; Xiao, Z.Y.; Huang, Q.; Qi, H.; Zhao, J.N.; Xue, Z.Q.; Huang, J. Major scientific objectives and candidate landing sites suggested for future lunar explorations. Sci. Sin. Phys. Mech. Astron. 2016, 46, 029602. [Google Scholar]
  37. Meng, Z.G.; Li, C.; Ping, J.S.; Huang, J.; Cai, Z.C.; Alexander, G. Analysis about landing site selection and prospective scientific objectives of the Von Karman crater in Moon farside. J. Deep Space Explor. 2018, 5, 3–11. [Google Scholar]
  38. Ma, Z.X. Multi-Pattern Obstacle Detection and Recognition Methods for Lunar Soft Landing; Harbin Institute of Technology: Harbin, China, 2018. [Google Scholar]
  39. Wei, R.Y.; Ruan, X.G.; Xiao, Y.; Li, J.K. Planetary surface landing area selection based on single image and closed environment avoidance. Syst. Eng. Electron. 2015, 37, 2809–2879. [Google Scholar]
  40. Liu, C.C. The MRAS evidence weight-based ore prediction for Hongtoushan-type massive sulfide copper deposit in Fushun-Qingyuan area in Liaoning Province. Contrib. Geol. Miner. Resour. Res. 2017, 32, 468–475. [Google Scholar]
  41. Yao, Y.L. Application of the weight evidence method of lead-zinc metallogenetic prospection prediction in Hongluoshan-Wuzhishan region. World Nonferrous Met. 2018, 2018, 266–268. [Google Scholar]
  42. Kong, X.; Mi, W.T.; Xin, J.; Chi, H.T.; Hu, J.; Yang, Z.Y. The gold metallogenic prognosis based on the weighting method of evidence in the middle Xuefeng mountain area. Comput. Tech. Geophys. Geochem. Explor. 2019, 41, 832–842. [Google Scholar]
  43. Kreslavsky, M.A.; Head, J.W.; Neumann, G.A.; Rosenburg, M.A.; Aharonson, O.; Smith, D.E.; Zuber, M.T. Lunar topographic roughnesss from Lunar Orbiter Laser Altimeter (LOLA) data: Scale dependence and correlation with geologic features and units. Icarus 2013, 226, 52–66. [Google Scholar] [CrossRef]
  44. Barker, M.K.; Mazarico, E.; Neumann, G.A.; Zuber, M.T.; Haruyama, J.; Smith, D.E. A new lunar digital elevation model from the Lunar Orbiter Laser Altimeter and SELENE Terrain Camera. Icarus 2015, 273, 346–355. [Google Scholar] [CrossRef]
  45. Lucey, P.G.; Blewett, D.T.; Taylor, G.J.; Hawke, B.R. Imaging of lunar surface maturity. J. Geophys. Res. 2000, 105, 20377–20386. [Google Scholar] [CrossRef]
  46. Wieczorek, M.A.; Neumann, G.A.; Nimmo, F.; Kiefer, W.S.; Taylor, G.J.; Melosh, H.J.; Phillips, R.G.; Solomon, S.C.; Andrews, J.C.; Asmar, S.W.; et al. The crust of the Moon as seen by GRAIL. Science 2013, 339, 671–675. [Google Scholar] [CrossRef]
  47. Ling, Z.C.; Zhang, J.; Liu, J.Z.; Li, B.; Wu, Z.C.; Ni, Y.H.; Sun, L.Z.; Chen, J. Lunar global FeO and TiO2 mapping based on the recalibrated Chang’ E-1 dataset. Acta Pet. Sin. 2016, 32, 87–98. [Google Scholar]
  48. Williams, J.P.; Paige, D.A.; Greenhagen, B.T.; Sefton, E. The global surface temperatures of the Moon as measured by the Diviner Radiometer Experiment. Icarus 2017, 283, 300–325. [Google Scholar] [CrossRef] [Green Version]
  49. Zhang, C.; Chen, J.P. Advances in the study of automatic identification and classification of lunar impact craters. J. Geol. 2019, 43, 514–522. [Google Scholar]
  50. Cheng, Q.M.; Chen, Z.J.; Ali, K. Application of Fuzzy Weights of Evidence Method in Mineral Resource Assessment for Gold in Zhenyuan District, Yunnan Province, China. Earth Sci. 2007, 2007, 175–184. [Google Scholar]
  51. Cheng, Q.; Agterberg, F.P.; Ballantyne, S.B. The separation of geochemical anomalies from background by fractal methods. J. Geochem. Explor. 1994, 51, 109–130. [Google Scholar] [CrossRef]
  52. Cao, L.; Cheng, Q.M.; Chen, Z.J. Generalized self-Similarity theory and models. J. Earth Sci. 2009, 34, 270–274. [Google Scholar]
  53. Cheng, Q.M. Spatial self-similarity and geophysical and geochemical anomaly decomposition. Prog. Geophys. 2001, 16, 8–17. [Google Scholar]
  54. Wu, W.; Mao, C.J.; Zhang, X.C.; Liu, H.L.; Zhang, F.; Wang, H.F.; Li, H.N. Improvement of saturation correction method based on linear regression. Prog. Geophys. 2020, 35, 1888–1893. [Google Scholar]
  55. Liu, G.Z.; Wei, W.; Fu, L.Y.; Sun, W.J. Seismic resolution analysis based on least squares migration. Program Geophys. 2020, 35, 2171–2180. [Google Scholar]
  56. Cao, Y.Q.; Wang, Y.Z.; Lu, P.Y. Research on automatic evaluation for key parameter of anomaly decomposition of metallogenic background based on machine learning. Prog. Geophys. 2021, 36, 1226–1235. [Google Scholar]
  57. Stuart, J.R. A New Global Database of Lunar Impact Craters >1–2 km: 1. Crater Locations and Sizes, Comparisons with Published Databases, and Global Analysis. J. Geophys. Res. Planets Sect. 2019, 124, 871–892. [Google Scholar]
  58. Ji, J.; Guo, D.; Liu, J.; Chen, S.; Ling, Z.; Ding, X.; Han, K.; Chen, J.; Cheng, W.; Zhu, K.; et al. The 1:2,500,000-scale geologic map of the global Moon. Sci. Bull. 2022, 67, 1544–1548. [Google Scholar] [CrossRef]
Figure 1. The overall framework of the whole-moon landing zones selection based on the weights of evidence and fractals.
Remotesensing 14 04623 g001
Figure 2. Using nine pieces of candidate evidence data of lunar crust thickness, roughness, slope, digital elevation model, gravity gradient, iron oxide content distribution, lunar soil optical maturity, titanium dioxide, temperature, and rock abundance, we calculated correlation coefficient for the whole moon.
Remotesensing 14 04623 g002
Figure 3. Schematic diagram of simulating landing zones calculations using the weights of evidence. (The red dots in the picture represent the landing zones).
Remotesensing 14 04623 g003
Figure 4. Semi-parabolic distribution curve in fuzzy distribution and the statistical results of the total number of cells containing more than the number of impact craters in the cells under different conditions. (a) Semi-parabolic distribution curve in fuzzy distribution; (b) the statistical results of the total number of cells containing more than the number of impact craters in the cells under different conditions.
Remotesensing 14 04623 g004
Figure 5. The distribution and statistical law of impact craters in 10 cells randomly selected from the whole moon. (a) The distribution of impact craters in 10 cells randomly selected in the whole moon and the change of the posterior probability (the background color is the posterior probability, the lighter the blue, the higher the posterior probability); (b) data for seven layers of evidence in 10 cells randomly selected across the moon; (c) quantitative line graph of the pixel mean of the data of seven layers of evidence in 10 cells randomly selected over the whole moon.
Remotesensing 14 04623 g005
Figure 6. Fractal fitting of impact crater size (The black dots present the l o g ( S ) l o g ( A ) double logarithmic plot results).
Remotesensing 14 04623 g006
Figure 7. Posterior probability results from the weights of evidence applied to whole-moon landing zones selection. (a) Posterior probability results from two evidence layers (lunar crust thickness and roughness); (b) five evidence layers (thickness, roughness, slope, DEM, and gravity anomalies of the lunar crust); (c) the posterior probability results of the seven evidence layers; and (d) the posterior probability map overlays the distribution of impact craters/basins that may have excavated and exposed the lower lunar crust or lunar mantle material.
Remotesensing 14 04623 g007aRemotesensing 14 04623 g007b
Figure 8. Posterior probability results of different cell grid ranges. (a) 72 × 144 cells; (b) 288 × 576 cells.
Remotesensing 14 04623 g008
Figure 9. Antarctic and Arctic slope and posterior probability map. (a) Antarctic slope data; (b) Antarctic posterior probability result; (c) Arctic slope data; (d) Arctic posterior probability result.
Remotesensing 14 04623 g009
Table 1. Display of relevant parameters of the dataset used.
Evidence LayersResolutionRangeData Sources
Slope60 mWhole moon[44]
Roughness1.8 kmWhole moon[43]
DEM60 mWhole moonUSGS
Gravity gradient1200 aWhole moonNASA
FeO400 mPartially[47]
Lunar crust thickness60 kmWhole moon[46]
OMAT200 mWhole moon[45]
Database of 5–20 m impact craters5–20 mWhole moon[57]
Table 2. The statistical results of the posterior probability statistics of the whole-moon landing zone selection based on weights of evidence and fractals. (288 × 576).
Posterior ProbabilityNumber of Occurrences of Landing Sites (Red Points)Statistical ProbabilityNumber of Occurrences of Expert Pre-Selected Points (Green Points)Statistical Probability
1.000290.580270.587
0.999130.260110.239
0.11280.16040.086
0.00000.00040.086
Publisher’s Note: MDPI stays neutral with regard to jurisdictional claims in published maps and institutional affiliations.

