Article

Comprehensive Remote Sensing Technology for Monitoring Landslide Hazards and Disaster Chain in the Xishan Mining Area of Beijing

1
Beijing Institute of Geological Hazard Prevention, Beijing 100120, China
2
School of Land Science and Technology, China University of Geosciences, Beijing 100083, China
*
Author to whom correspondence should be addressed.
Remote Sens. 2022, 14(19), 4695; https://doi.org/10.3390/rs14194695
Submission received: 2 August 2022 / Revised: 7 September 2022 / Accepted: 16 September 2022 / Published: 20 September 2022
(This article belongs to the Special Issue Geodetic Monitoring for Land Deformation)

Abstract

:
The Xishan coal mine area in Beijing, China has a long history of mining. Many landslide hazards, in addition to collapses and ground fractures, have occurred in this area. This study used multi-temporal satellite images to extract this region’s deformation information, identify landslides and analyze the deformation evolution process of these landslides. Taking the Anzigou ditch as an example, we investigate the “Quarry–Landslide–Mudslide” disaster chain model. We found that the landslide evolution process is closely related to the geological conditions, and usually goes through four stages: initial deformation, slope front swelling and collapsing, rear part connecting and rupturing, and landslide creeping. The surface deformation can be identified and tracked by high-resolution optical images and InSAR monitoring. Under the combined effects of rainfall and topographic conditions, medium and large landslides may occur and trigger a “Quarry–Landslide–Mudflow” disaster chain. The identification and analysis of these landslide hazards and the disaster chain help with geological disaster prevention, and provide reference for early identification and research of similar disasters.

1. Introduction

Underground mining causes ground subsidence, inducing ground cracks, ground collapse and other disasters, which lead to great damages and losses for the local people. The Xishan coal mines in Beijing, China, had been exploited underground for about a thousand years, until 2008, when all coal mines in Beijing were shut down. After such a long period of underground exploration, many ground fractures and ground collapse events occurred. Presently, 22 regions have recorded densely distributed collapse pits and fractures. The total affected area is about 2000 hectares. The Beijing Institute of Geological Disaster Prevention and Control has conducted several rounds of surveys in the Xishan area. They noted the distribution of the collapses, analyzed the deformation and metamorphic characteristics of each coal formation, and summarized the geohazard development characteristics. They also predicted the ground collapse hazards in the mining area [1,2,3,4,5].
In recent years, the government performed sudden geological disaster monitoring and provided early warnings for the collapse areas. The results showed that after the mines were closed, the growth of ground fractures and collapse pits in the collapse area gradually slowed. From 2015 to 2021, only two new small-scale collapses of coal mining lanes occurred, both in 2016. However, underground mining, especially the operation of some small coal companies that featured shallow mining depth, high mining intensity and high disturbance, destroyed the stability of the mountain; therefore, landslides and other geohazards began to appear.
In mountainous areas, landslides and their induced disaster chains are destructive, but hard to spot, due to strong concealment [6,7]. Much research has been done on the failure modes and monitoring methods of landslides [8,9,10,11,12,13,14,15]. Beijing is the political and cultural center of China, and the Xishan mining area is densely populated. Therefore, the identification of geological and other potential hazards is of great importance. However, few studies have examined the landslides in the Xishan mining area.
The Xishan coal mine area has been exploited since the Liao dynasty (907 AD). Due to historical wars, no useful exploration data were recorded. Besides, there were a lot of private mines, which roughly dug out coal without any regulatory oversight. Thus, we cannot get precise information regarding the underground mining in this region. In recent years, remote sensing observations have become increasingly abundant, and related technologies, such as multi-temporal high resolution optical image analysis technology, unmanned aerial vehicle (UAV) photography and oblique photogrammetry, interformetric synthetic aperture radar (InSAR) and 3D laser scanning, have been widely applied for geological hazard detection [16,17,18,19,20,21,22,23,24,25]. Multi-temporal high spatial resolution optical images have wide spatial coverage and abundant storage, thus, they are suitable for detecting geological hazards with obvious deformation. UAV photography and tilt photography can obtain high spatial resolution images and high precision 3D models. They are flexible and convenient, and have high recognition efficacy for geological hazards with signs of deformation. InSAR technology performs well at recognizing geological disasters in areas with high surface coherence and moderate deformation rates. It is suitable for large-scale geological disaster detection. 3D laser scanning can reduce the influence of surface vegetation and directly obtain a 3D model of the target area, which has a better recognition effect for geological disasters with relatively obvious features in the vegetated area.
This study collects multi-temporal remote sensing data from the Xishan mine area, and extracts deformation information from optical images and time-series InSAR, by which we identify landslides. On this basis, we classify the landslide evolution stages and analyze the triggering factors and disaster patterns of the disaster chain. This study provides a reference for regional geological hazard research and prevention.

2. Study Area and Data Sources

2.1. Geological Background

The study area is in Fangshan District, Beijing, China, and is geologically located in the south-east flank of the Baihuashan Oblique. The fracture structures are small, with a general north-east orientation and a dip angle of 50° to 80°. Figure 1 shows the geological background of the study area. The coal resources are abundant, mainly distributed in two stratigraphic units: the Lower Permian Shanxi Formation and the Lower Jurassic Yaopo Formation. There are also coal seams in the Longmen Formation.

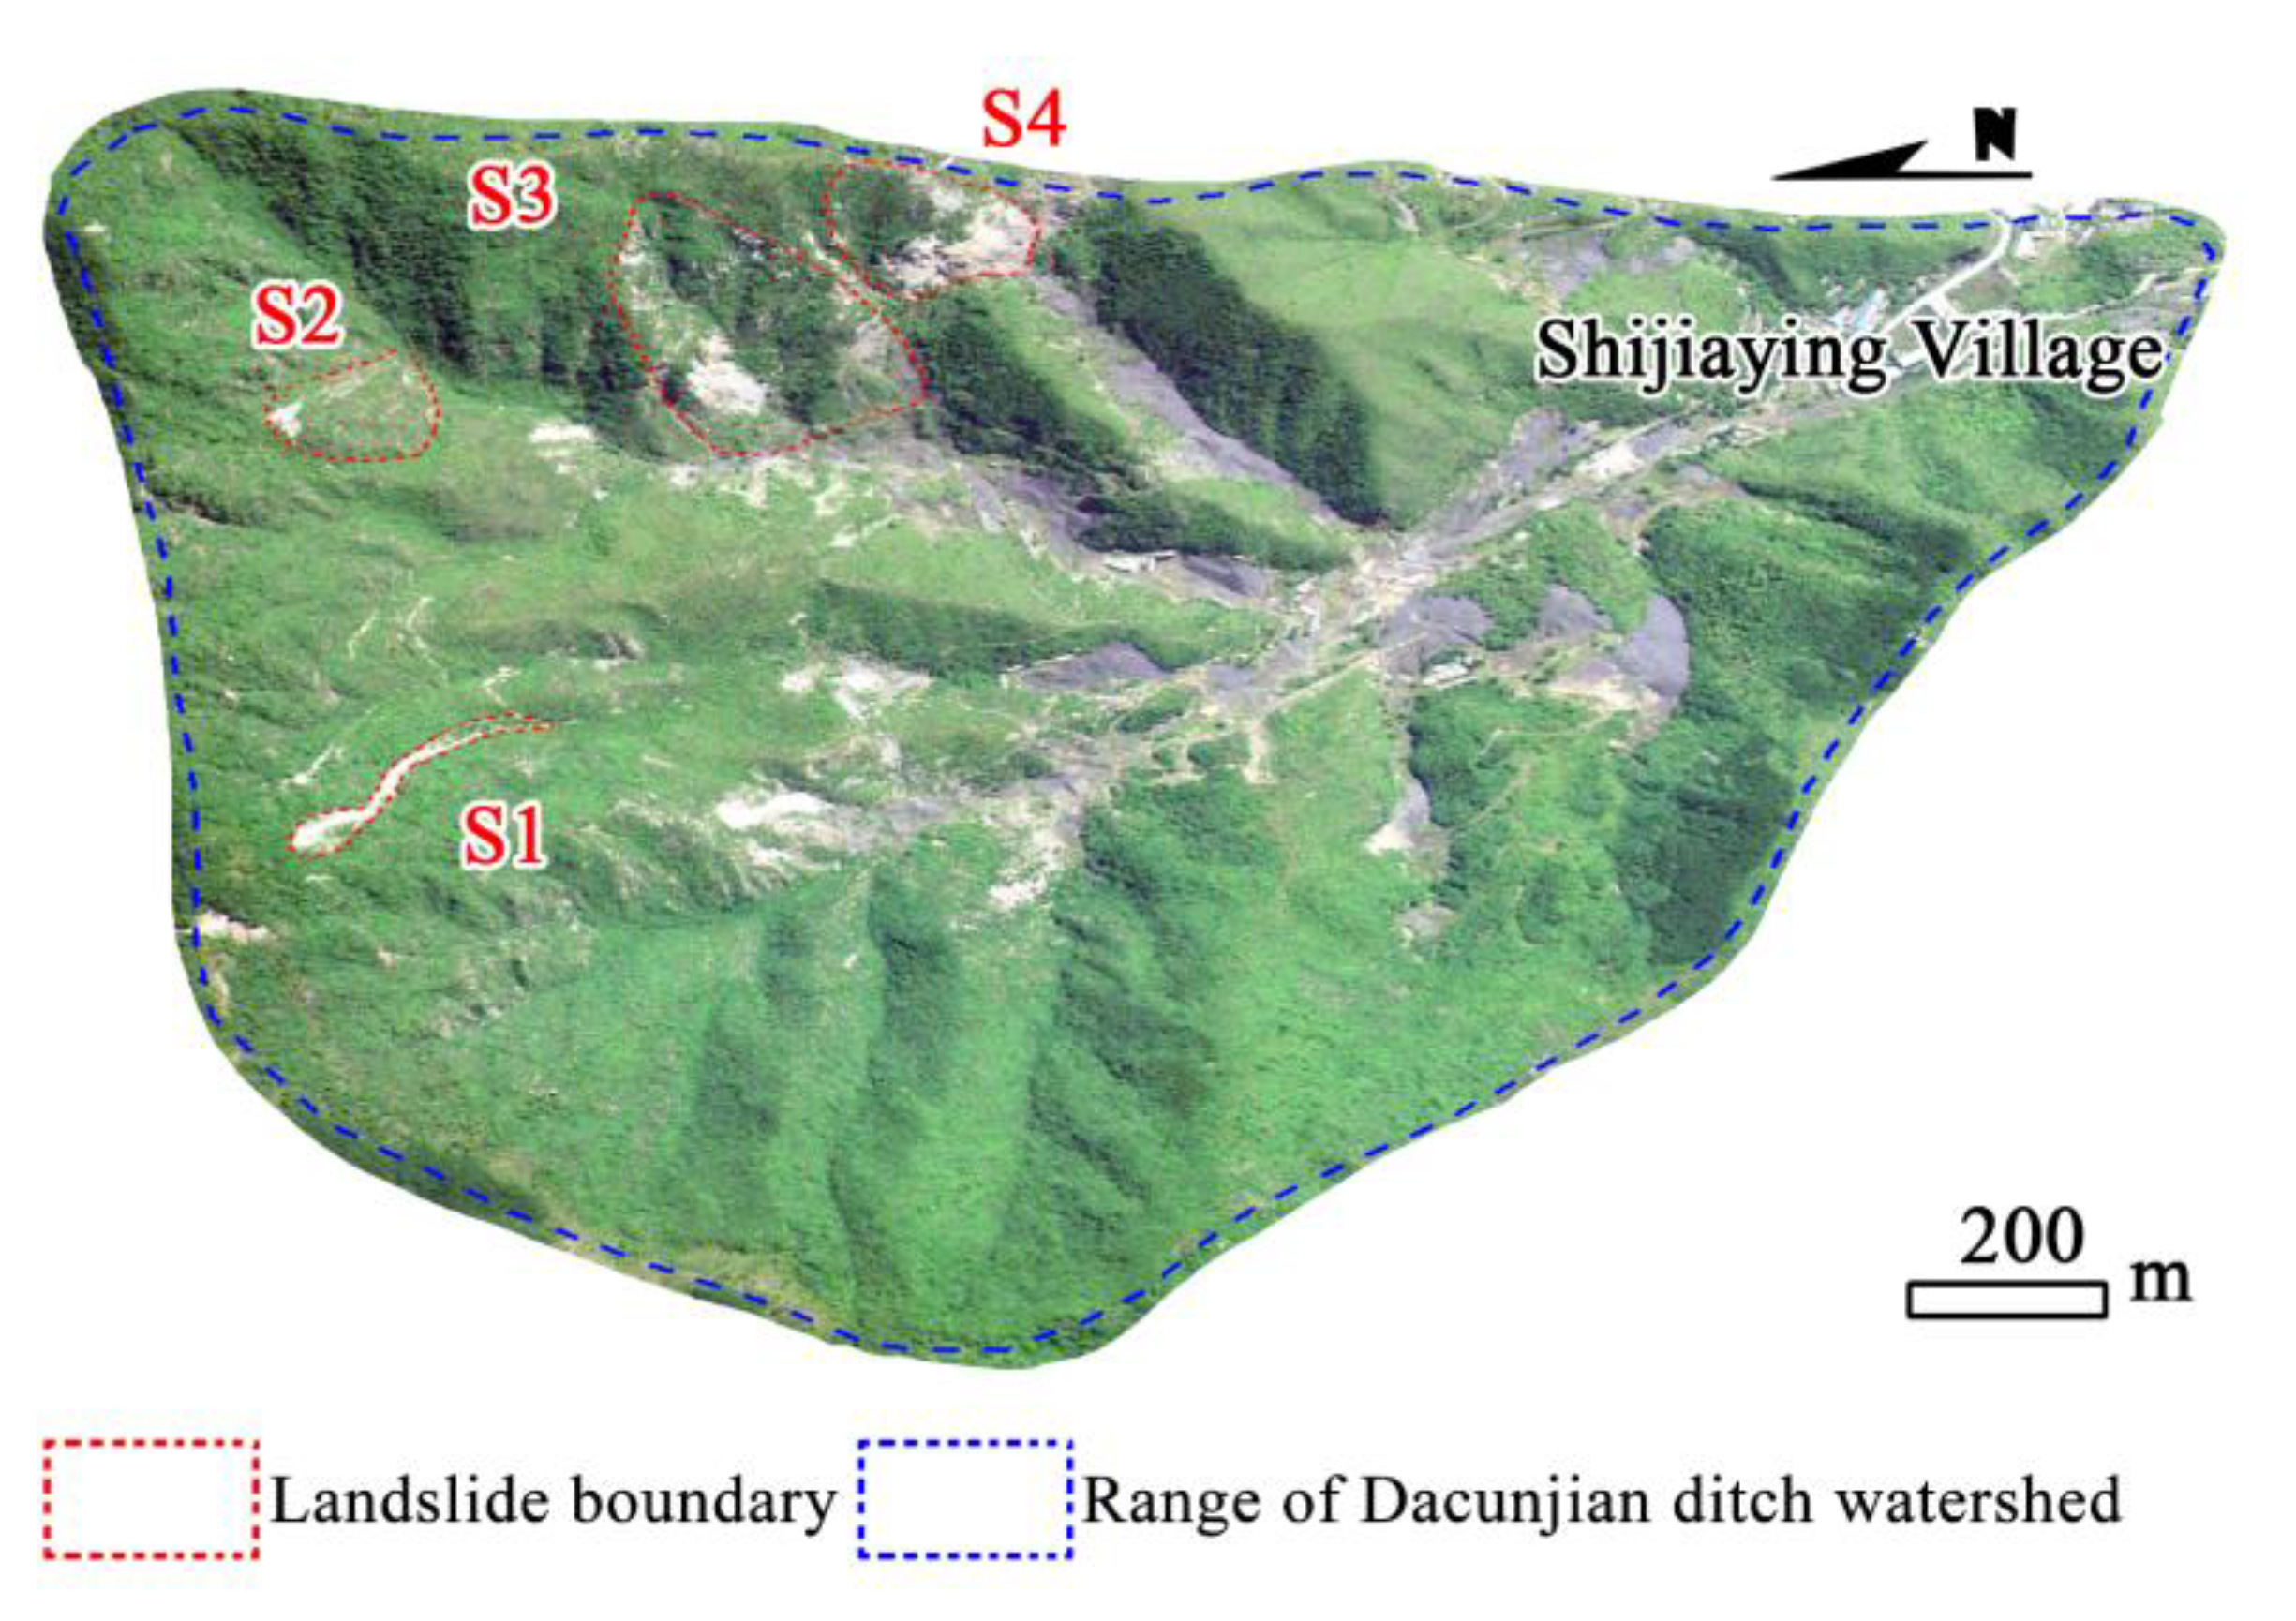
2.2. Status of the Disaster

The mining activities in the study area destructed the ground surface and forest resources, and induced many geological hazards, such as collapses and debris flows. According to the geological disaster list for Beijing, published in 2021, there were four collapses, nine subsidence areas and seven debris flows in the study area.

2.3. Data Sources

In this paper, 12 optical satellite images and 65 RadarSat-2 images of the study area acquired between 2003 and 2021 were collected for the slope hazard identification experiment (see Table 1).

3. Research Methodology

3.1. Optical Remote Sensing Landslide Interpretation Approach

Presently, optical images are manually interpreted for identifying landslide hazards. This method has high reliability for areas with complex geological conditions, as it incorporates the expertise and experience of interpreters. Object-oriented classification, DNVI change detection and deep learning have shown high aptitude for landslide identification from remote sensing images [26,27,28,29,30], but their identified objects should have obvious deformation. However, landslides usually have small deformations, which are not obvious on optical images. Thus, optical-based automatic identification methods have limited accuracy for landslide identification.
This paper compares multi-temporal optical remote sensing images to find the differences in tone and texture between landslides and the surrounding areas, extracts the specific location of tension cracks and collapses caused by the swell of the lower slope, and obtains the changes of vegetation, geomorphology and slope (Figure 2).

3.2. InSAR Time-Series Analysis

In this paper, InSAR, the time-series analysis process, is as follows: firstly, the master image is selected to register the SAR data. Then, we select the PS points using a combination of amplitude departure index and correlation coefficient. We construct a triangular network for the PS points. After getting the interferometric pairs, differential interference is applied to the PS points. The linear deformation rate of the PS points is obtained by the solution space. Considering the different frequencies of the atmospheric delay phase, nonlinear deformation phase and noise in the time and space domains, different filtering methods are used to obtain the nonlinear deformation rate. Finally, the deformation information of PS points is obtained.

4. Results

The interpretation results of the remote sensing images show 32 collapses and 19 landslides in the study area (see Figure 3 and Table 2).
We compare the interpretation results with the geological disaster list for Beijing, published in 2021 (hereafter referred to as the hazard list), and conduct field checks on those not included in the list. We find that the above 51 collapses and landslides are correct. The collapses are small and widely distributed at the slope feet. Their locations coincide with the mining caves or old collapse pits/fissures. A few collapses occurred along new roads or the front edge of a slope. The landslides are medium-sized and concentrated in mountainous areas. The height differences of the landslide bodies are larger than 100 m each. Some landslide rear edges are close to the crests.
In 2003, some collapses and landslide hazards occurred in the Shijiaying mine area, but they did not get public attention at that time, nor were they included in the hazard list. After the mines were closed in 2009, new collapses and landslides occurred in the study area. Presently, 16 landslides of medium size (1 × 10⁵ m3) were identified in the area (see Figure 4 and Table 3), and the time-series InSAR results show that all of these 16 landslides had continuous deformation since 2016.

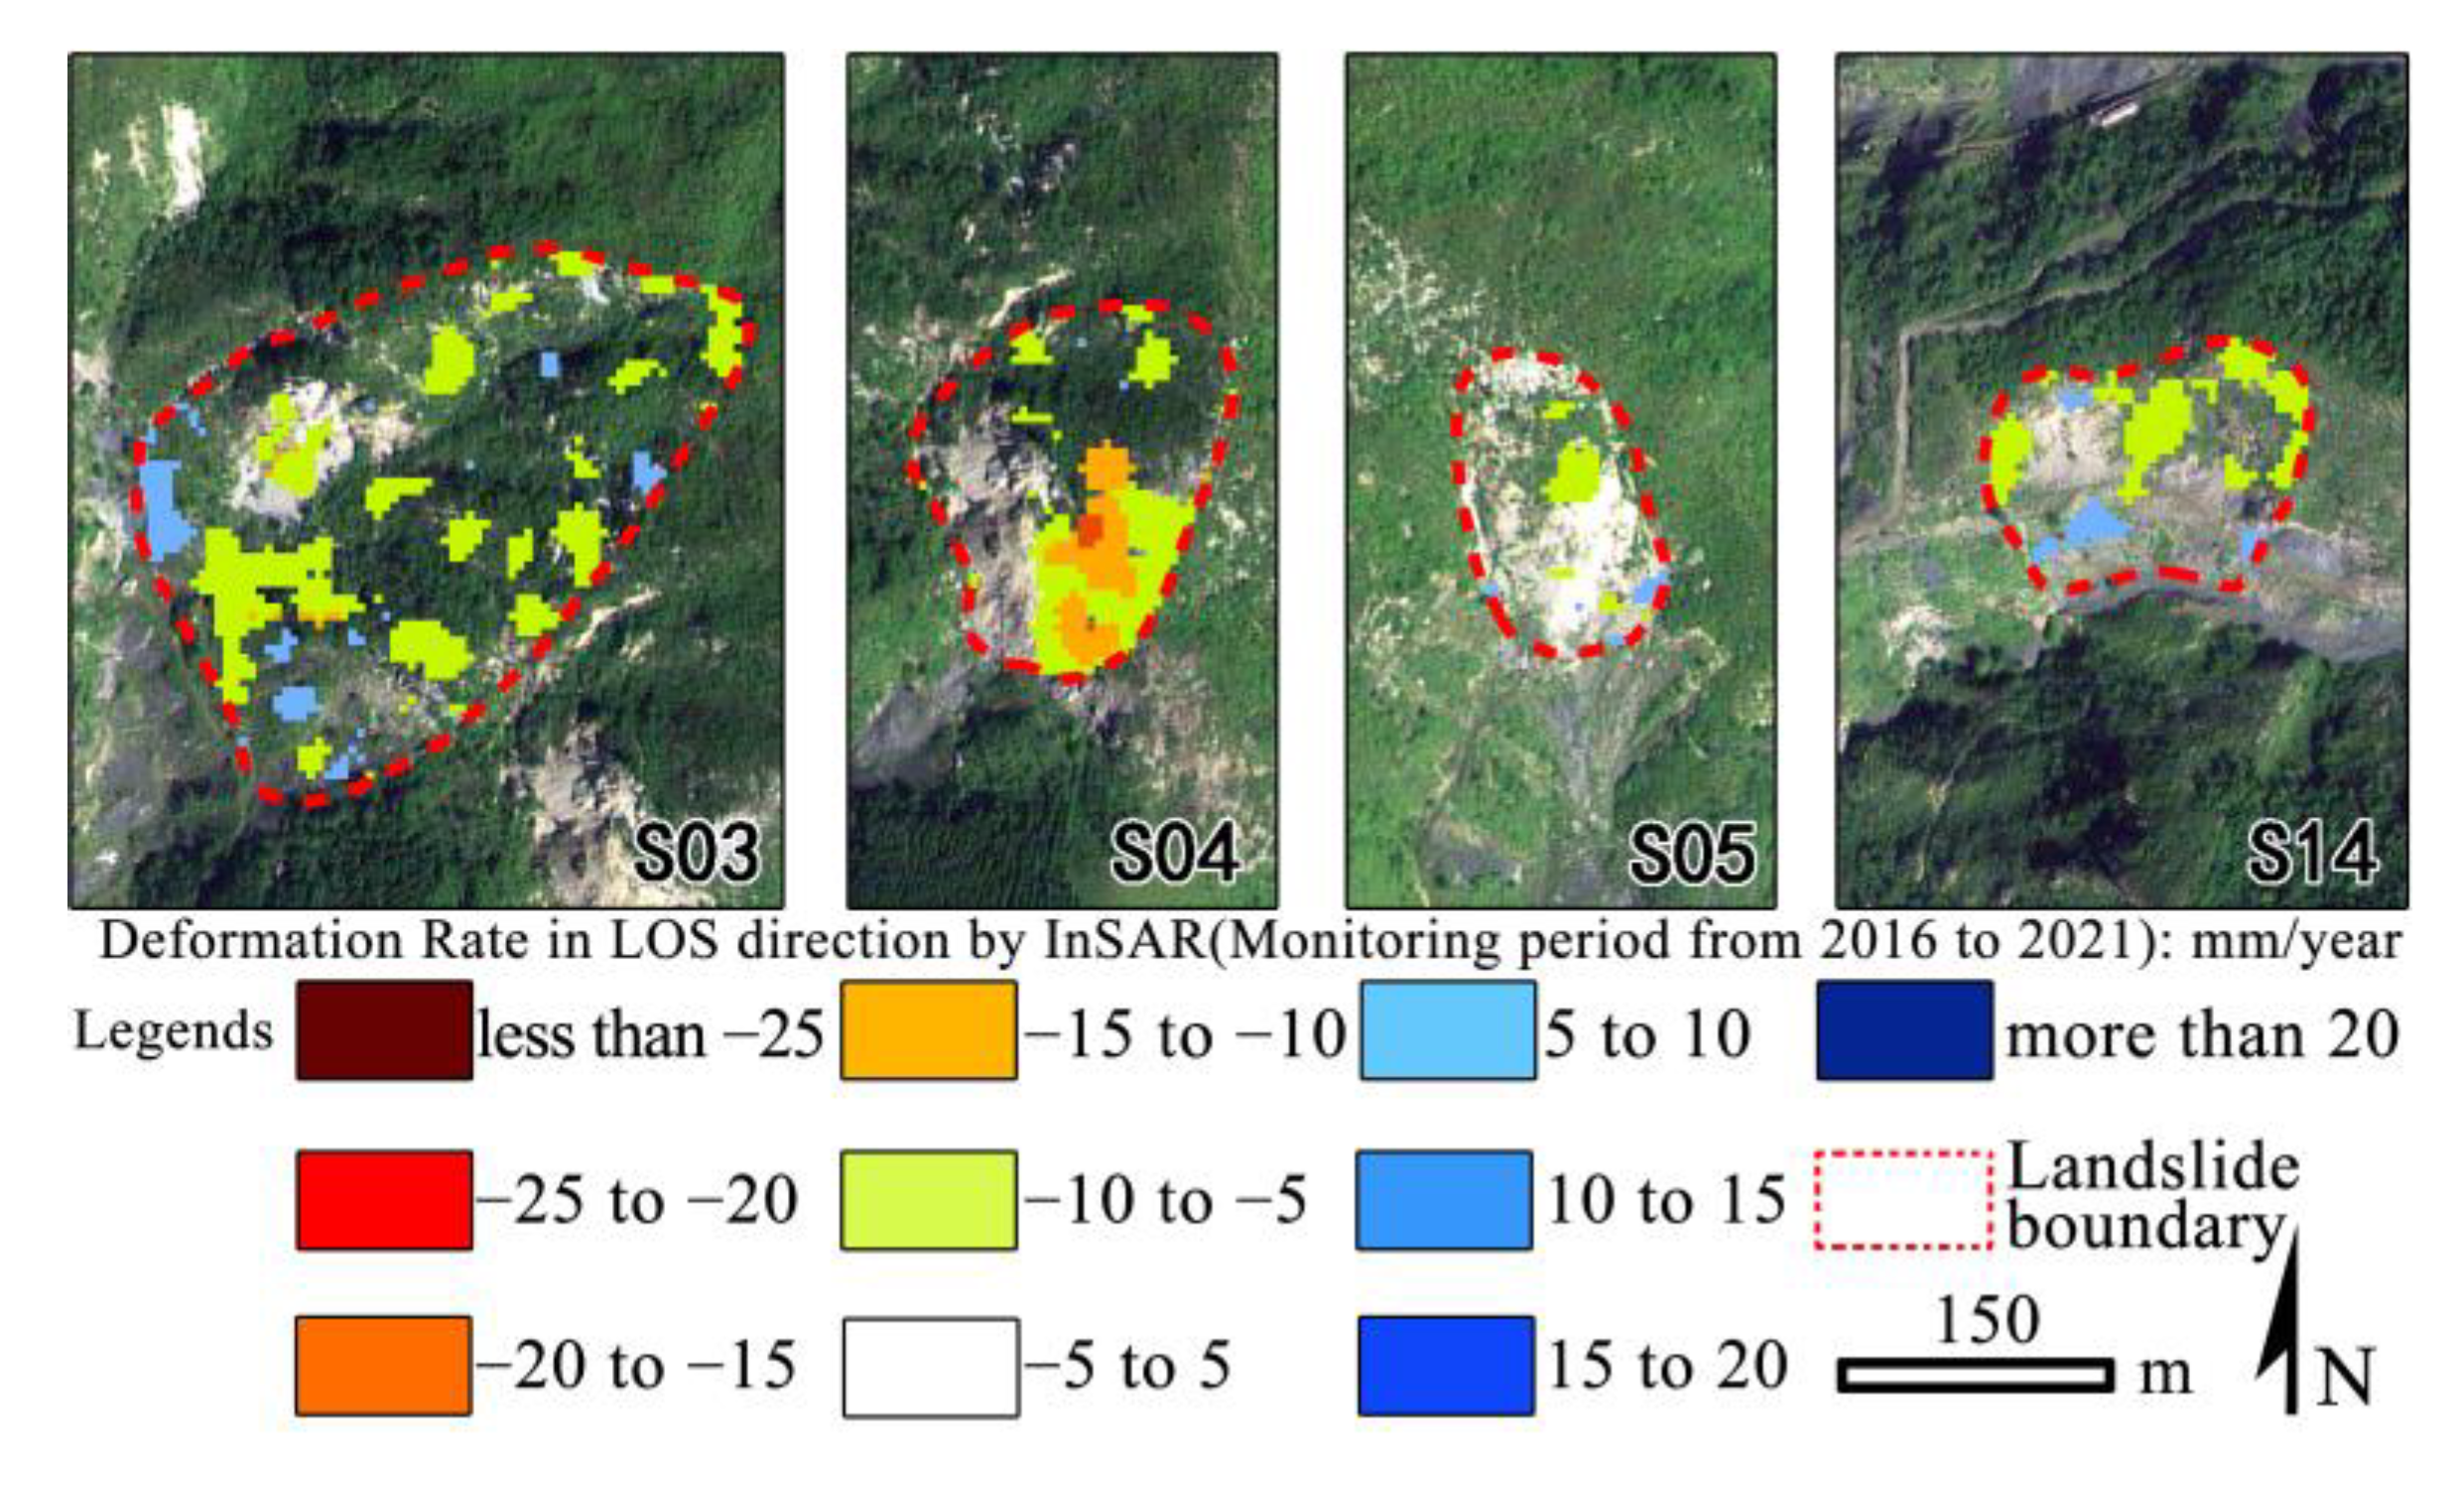
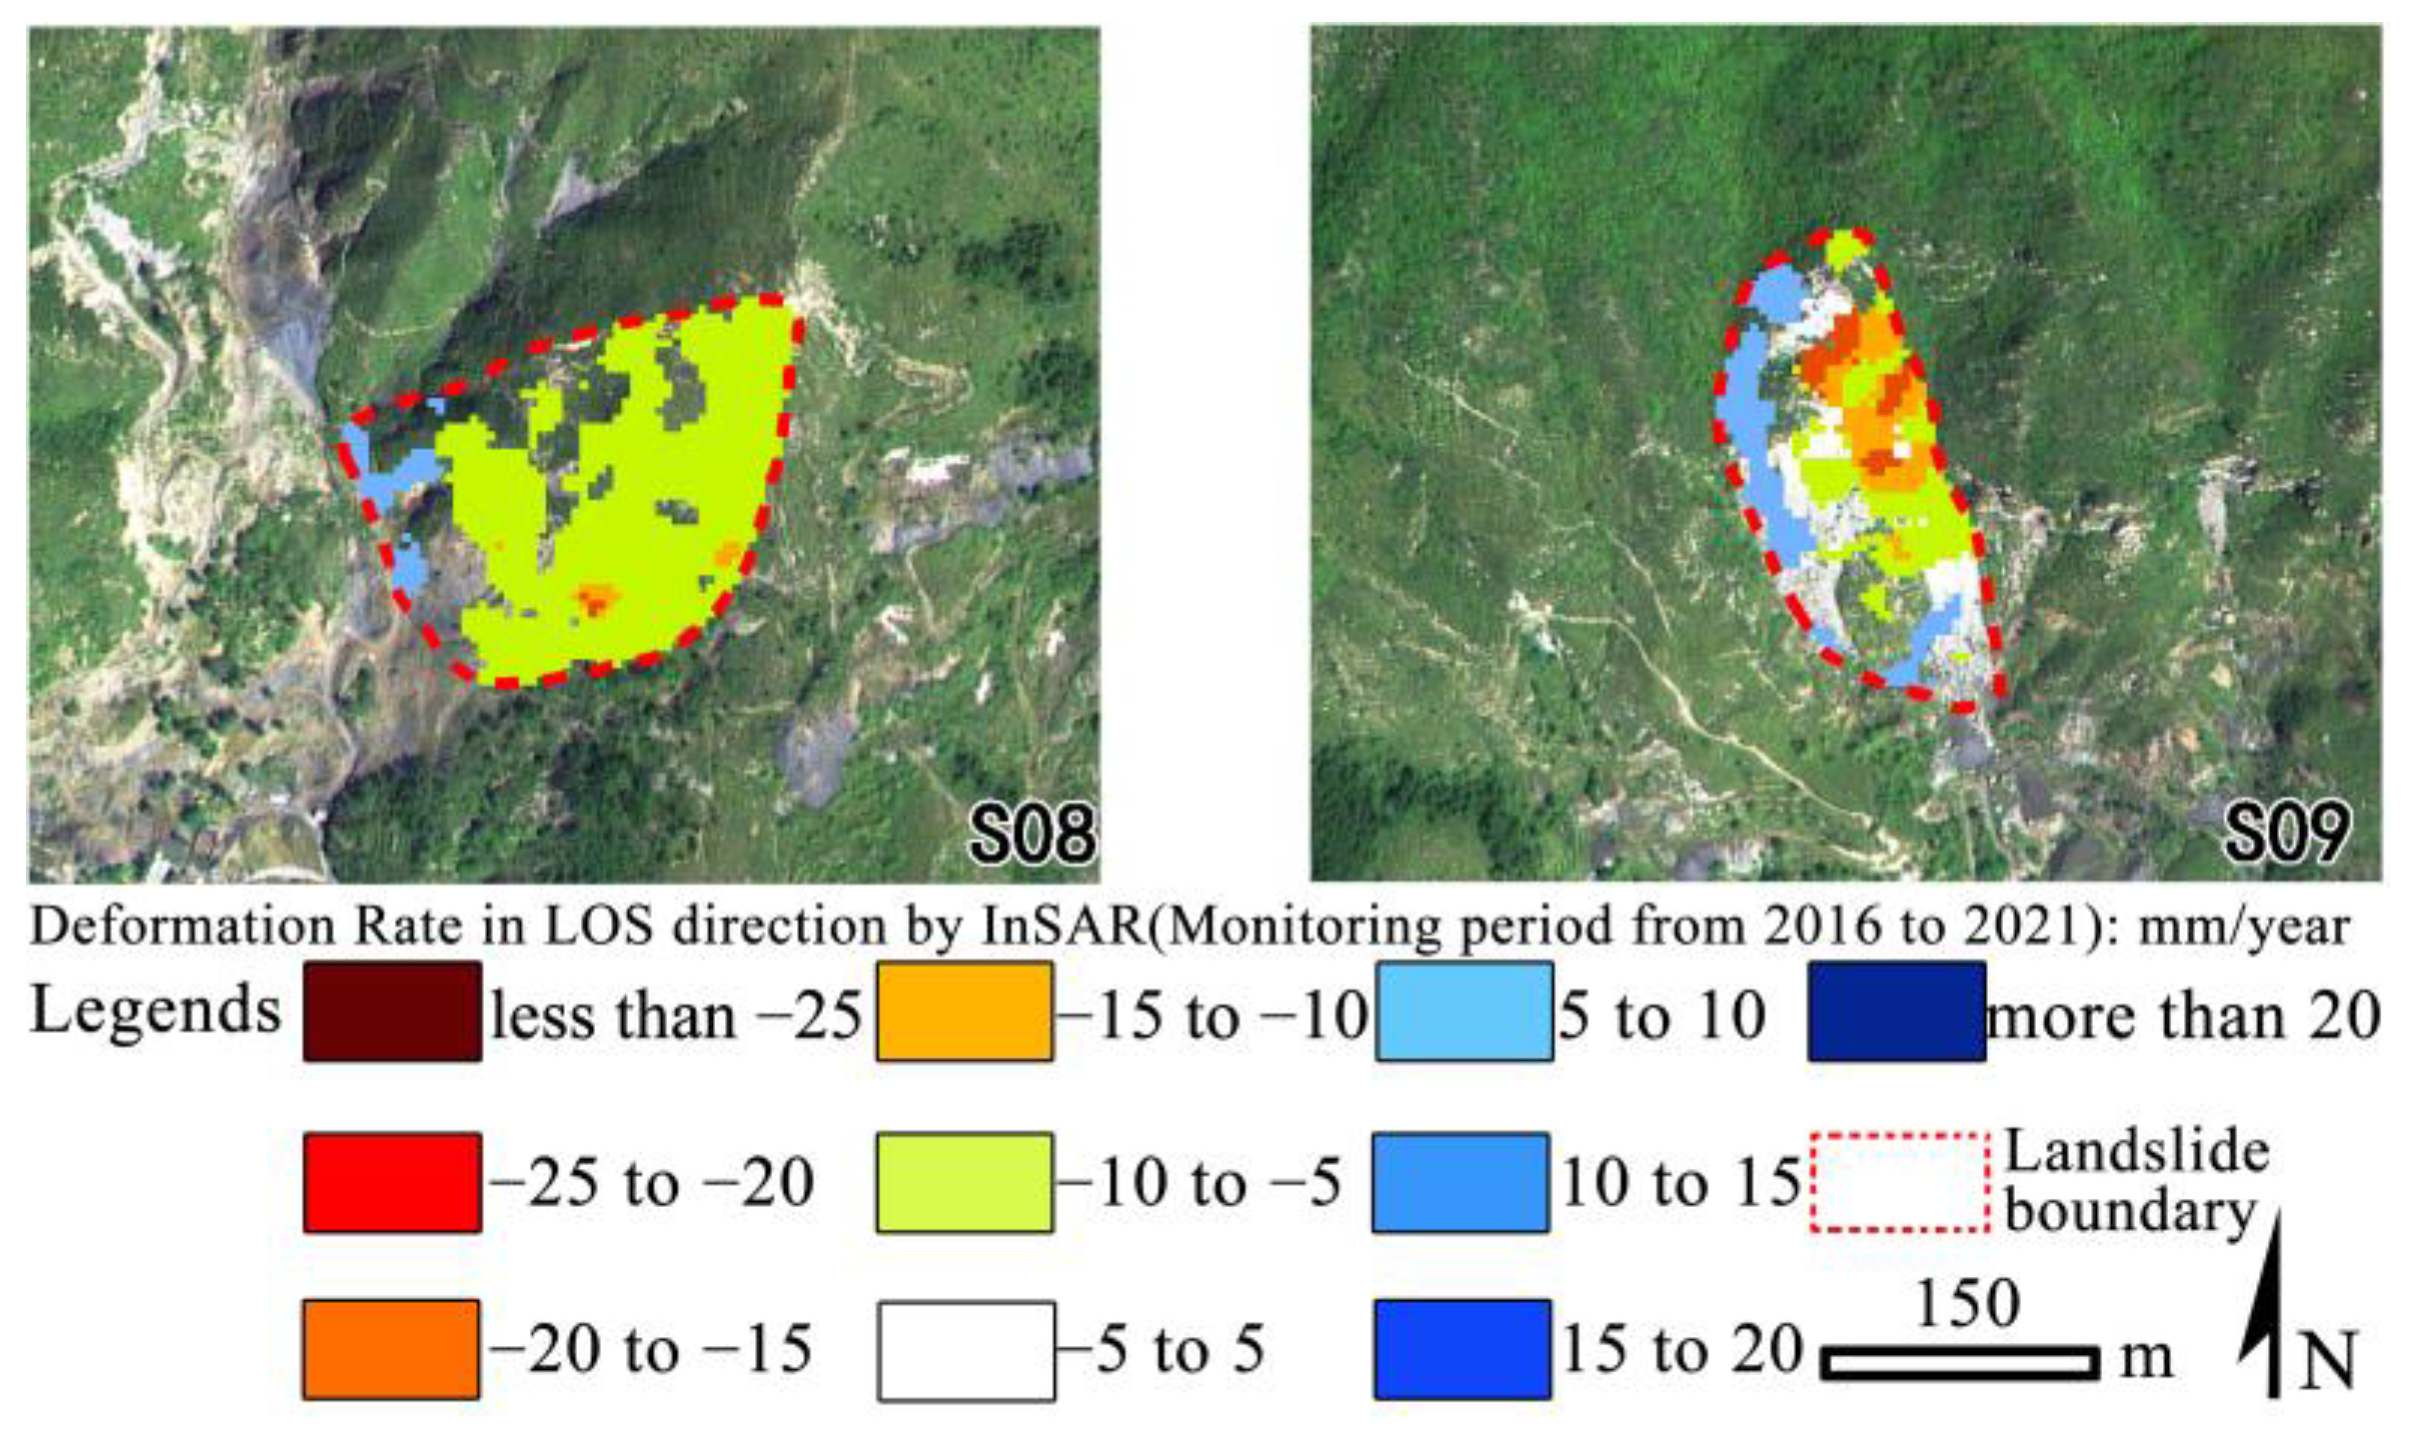
4.1. Deformation Characteristics of the Landslides Extracted from the Remote Sensing Images

In Table 3, except for S01 and S11, the remaining 14 landslides have the same characteristics: obvious fissures in the rear edge and widespread collapses on the front edge and the body of the landslide.
Figure 5 shows the remote sensing images and deformation evolution process of three points in landslide S02. The images from 2009 show that fissures appeared on the rear edge of the landslide, and small-scale depressions were formed. In 2012, the fissures developed further, extending about 100 m. In 2017, the cracks on the rear edge were further developed, the depression was enlarged, and cracks appeared on the eastern boundary. In 2019, the cracks on the rear edge and those on the eastern boundary connected, forming a long crack with a total length of about 270 m. Additionally, the crack on the western boundary appeared, with a length of 100 m. The remote sensing measurement showed that the landslide had the maximum height difference of 174 m, slope of 48°, and the estimated mass volume of 4.5 × 10⁵ m3. The 2016–2021 InSAR time series (Figure 5) show that the deformation rates vary significantly over different parts of the landslide body. Point1, point2 and point3 are the positions with large deformations on the landslide. The maximum LOS deformation is about 40 mm, and the deformation rate is close to 10 mm/year.
The above analysis indicates that landslide S02 body is developing, and the sliding surface has not connected yet. The developmental stages and developmental characteristics of the S03, S04, S05, and S14 landslides are basically the same as those of the S02 landslide. The InSAR time series results show that these landslides have experienced some deformation since 2016, with a deformation rate of about 10 mm/year (see Figure 6).
Figure 7 shows the remote sensing images and deformation evolution process of landslide S06. Satellite images in 2003 showed that the slope had not started sliding, and only two collapses were observed near the hill foot. In 2009, the size of the two collapses increased significantly, but there were no signs of failure. In 2017, satellite images showed that the two collapses grew larger, and large tensile fissures and slip cliffs appeared in the upper mountain. The sliding surface of the landslide had merged. In 2019, the collapse at the slope foot and the deformation of the rear edge increased further, resulting in a landslide body with a maximum height difference of 107 m, a slope of 37° and an estimated volume of 5 × 10⁵ m3.
The above analysis shows that the deformation of landslide S06 developed from 2003 to 2016. In 2016, the rear part of the slope suddenly cracked and slid downward. After the failure, the landslide continued to creep. The InSAR results show that the whole landslide had obvious deformation during 2016–2021. Point1, point2 and point3 are the positions with large deformations on the landslide. The maximum cumulative LOS deformation is about 110 mm, and the velocity exceeds 20 mm/year.
Similarly, S07, S10, S15, and S16 also experienced the process from initial deformation to failure from 2003 to 2021. The InSAR time series results show that since 2016, these landslides have had continuous deformation, and the deformation rate is significantly higher than that of landslide S02. (See Figure 8).
In Figure 9, satellite images in 2003 showed that landslides S12 and S13 developed fissures at the rear edge. S12 had obvious slip cliff and platform on the rear part. The tension cracks and boundary are clear. Three rockslides occured at S12-1, S13-1 and S13-2 (Figure 9). In 2019, no obvious deformation was observed on the rear edge of the two landslide bodies, but the rockslides at S12-1, S13-1 and S13-2 expanded, and new collapses appeared at S12-2, S13-3 and S13-4. The maximum height difference, slope and estimated volume of landslides S12 and S13 are 175 m, 156 m, 35°, 33°, 5 × 10⁵ m3 and 2.6 × 10⁴ m3, respectively.
The 2016–2021 InSAR time series results show that the landslide body has obvious deformation. Point1, point2, point3, point4 and point5 are the positions with large deformations on the landslide. The maximum LOS deformation rate exceeds 20 mm/year, and the cumulative LOS deformation is about 110 mm. This indicates that the slope is creeping. Landslides S08 and S09 have basically the same deformation patterns as those of landslides S12 and S13 (see Figure 10).
Among the above 14 landslides, S06, S07 and S12 were developed in coal-bearing strata, with small goaf depth. But S02, S03, S04, S05 and S14 were developed in the strata above the coal-bearing strata, with deep goaf. Cracks develop faster on the rear edge of the former landslides.

4.2. Remote Sensing Characteristics of Landslide Caused by High-Level Collapse

Among the 16 landslides (Table 3), the bodies of S01 and S11 are composed of the rock mass from the upper part of the slope, due to rockfall. In Figure 11, the areas A1 and A2 are the rockfall, B1 and B2 are the shoveled mountain range, and C1 and C2 areas are the accumulation range.
In 2006, cracks and collapses appeared in landslide S01. The maximum height difference of the sliding body is 244 m, the slope is 43° and the estimated volume is 5 × 10⁴ m3. In the same year, cracking and rock sliding also occurred in landslide S11. The high-level collapse areas gradually expanded, and the size of the sliding mass also gradually increased (see Figure 12).
In 2006, the upper part of S11 (A1-1 rock mass) collapsed, scraped off part of the mountain mass and disintegrated. The loose mass composed the early landslide body. In 2009, the A1-1 rock mass collapsed further. On its southwest side, a part of A1-2 rock mass collapsed. The mass loosely piled on the west side of the slide. Images from 2012 to 2019 showed that A1-1 and A1-2 continued collapsing. The landslide body gradually enlarged, with a maximum height difference of 314 m, a slope of 39° and an estimated volume of 3 × 10⁵ m3. The landslide mass had continuous deformation from 2016 to 2021, and the maximum accumulative LOS deformation is nearly 100 mm.

4.3. Evolution of the Landslides in the Goaf

This study identified 16 landslides in the study area. Except for S01 and S11 that were induced by high-level collapse, the remaining 14 landslides were induced by underground goafs and have similar evolution processes. The satellite images collected in this study completely recorded the evolution process of landslides S06 and S07; therefore we use the time series of the two landslides, combined with the regional coal mining background to discuss the problems caused by coal mining.
Landslides S06 and S07 are mainly developed in the Yaopo Formation and Longmen Formation, which are the two major coal-measure strata in Xishan. The lithology is mainly dark siltstone, with multiple layers of mineable coal and gravel-bearing medium-coarse sandstone. When the coal is mined out, the roof of the goaf will bend and sink due to gravity, then crack and break down. Due to the shallow burial depth and multiple layers of coal, the goaf range is large. The deformation of the overlying rock mass leads to cracks on the surface, which further leads to the deformation of the whole slope, and finally, causes a landslide [31,32,33,34,35]. According to the optical images of the study area from 2003 to 2021, the formation process can be divided into four stages.
Stage 1: initial deformation
In this stage, ground fissures and collapse pits appeared on the mountain surface, due to the goaf. At that time, the stability of the mountain had been destroyed, but the deformation degree is relatively small. Figure 13 shows the satellite image of landslides S06 and S07 in 2003. L1 and L2 are the ground fissures developed on the slope. Many collapse pits can be found at the slope foot (red arrows). The overall deformation of the slope is not obvious.
Stage 2: slope front swelling and collapsing
In this stage, the deformation of the overlying rock mass in the goaf developed. Some rock mass fell down and squeezed the surrounding rock. The lower part of the slope bore greater force, so the deformation was larger. The mountain began to swell. After the deformation had developed for some time, partial collapses occurred. Figure 14 shows the satellite images of S06 and S07 in 2009. The cracks on the rear part of the slopes had not merged, but many collapses occurred at the slope toe (Figure 14), indicating that the two slides had started rapid deformation.
Stage 3: Rear part connecting and rupturing
As the collapses in the lower part of the mountain developed, the stability of the slope was reduced and the deformation increased. The accumulated deformation increased the cracks on the rear part of the slope. These cracks extended, connected and eventually led to the occurrence of failure. As Figure 15 and Figure 16 show, the fissures at the rear parts of the S06 and S07 connected in 2012 and 2016, respectively. According to the field investigation, the failure of landslide S07 occurred on 21 July 2012 after a heavy rain, forming a cliff with a height of 9–12 m. The failure of landslide S06 occurred on 20 July 2016 after a heavy rain as well, forming a cliff with a height of 30–35 m.
Stage 4: Landslide creeping
After the failure, the internal forces of the landslide body reached a state of equilibrium. The landslide entered a "relatively quiet period." In the absence of external interference, the deformation of the landslide in this stage was only caused by its own gravity. The deformation was slow, and the slope crept. Under the effects of external interference, such as an earthquake and extreme weather, the landslide was reactivated.
The InSAR time series results show that between 2016 and 2021, landslides S06 and S07 both had continuous deformation. The cumulative deformation exceeded 40 mm. Some parts deformed quickly, with the accumulation exceeding 100 mm. But the deformation rate of most parts remained stable, without obvious acceleration. The landslide body showed no signs of disaster (Figure 17).
The InSAR technology has limitations in monitoring the deformation of the areas with large height differences and high vegetation coverage [36,37,38,39,40,41,42,43]. Besides, sudden and large magnitude deformation leads to severe decoherence. However, it can still be used for the identification of landslides in the creep stage, which have slow deformations but are large in size.
The above analysis shows that the goaf-induced landslide has a long development period, which can be divided into four stages. In the first stage, the slope is stable. If there are no drastic changes to the external environment, the hazard risk is small. In the second stage, the lower part of the slope bulges and collapses, but the possibility of failure is still small. The hazard risk mainly comes from rockfall in the lower part of the slope. In the forth stage, if the deformation rate is stable, the slope body is temporarily stable. If the deformation accelerates, the hazard risk increases, and corresponding preventive measures should be taken. According to these features, the deformation stages of the landslide can be determined, to guide the prevention and control measures.

4.4. The Disaster Chain of Goaf-Landslide-Debris Flow

A total of 16 landslides were identified in the study area. All these landslides were developed in the coal mining area. Besides large-scale goafs, a large amount of coal gangue and other materials were loosely piled in the ditches. There were floods and debris flow disasters in this area [44]. Once these landslides become unstable during heavy rainfall, the transported material, together with coal gangue, may block the channel, form a dam, and then form a debris flow.

4.4.1. Mode of the Disaster Chain

We take landslides S06, S07 and S08 as examples to analyze the disaster chain mode. The three landslides are concentrated in the middle reaches of Anzigou ditch. S06 and S07 are located on the west side, and S08 is located on the east side (Figure 18). The three landslides have an estimated total volume of about 2 million m3. They are located on a Jurassic coal-bearing stratum, which is relatively soft. At present, the landslide bodies are creeping.
According to the monitoring data of the Beijing Institute of Geological Hazard Prevention and Control, heavy rainfall occurs frequently in the flood season in the study area. S06 and S07 experienced heavy rainfall in 2016 (daily rainfall of 176 mm) and 2012 (daily rainfall of 234 mm), respectively, and they slid downward for 30 m and 10 m, respectively. The deformation of the landslide is increasing, and the stability of the slope mass continues decreasing. In the case of heavy rain, a large-scale slide may occur.
A large amount of coal gangue accumulated in Anzigou ditch, with a total volume of about 7 × 10⁵ m3. No debris flow has occurred yet. The channel is V-shaped. The width of the channel section, where the three landslide bodies are located, is less than 100 m. Once the failure occurs, a mass as large as 2 million m3 will be washed down, which will block the channel and form a dam. If the dam breaks, debris flow will occur.

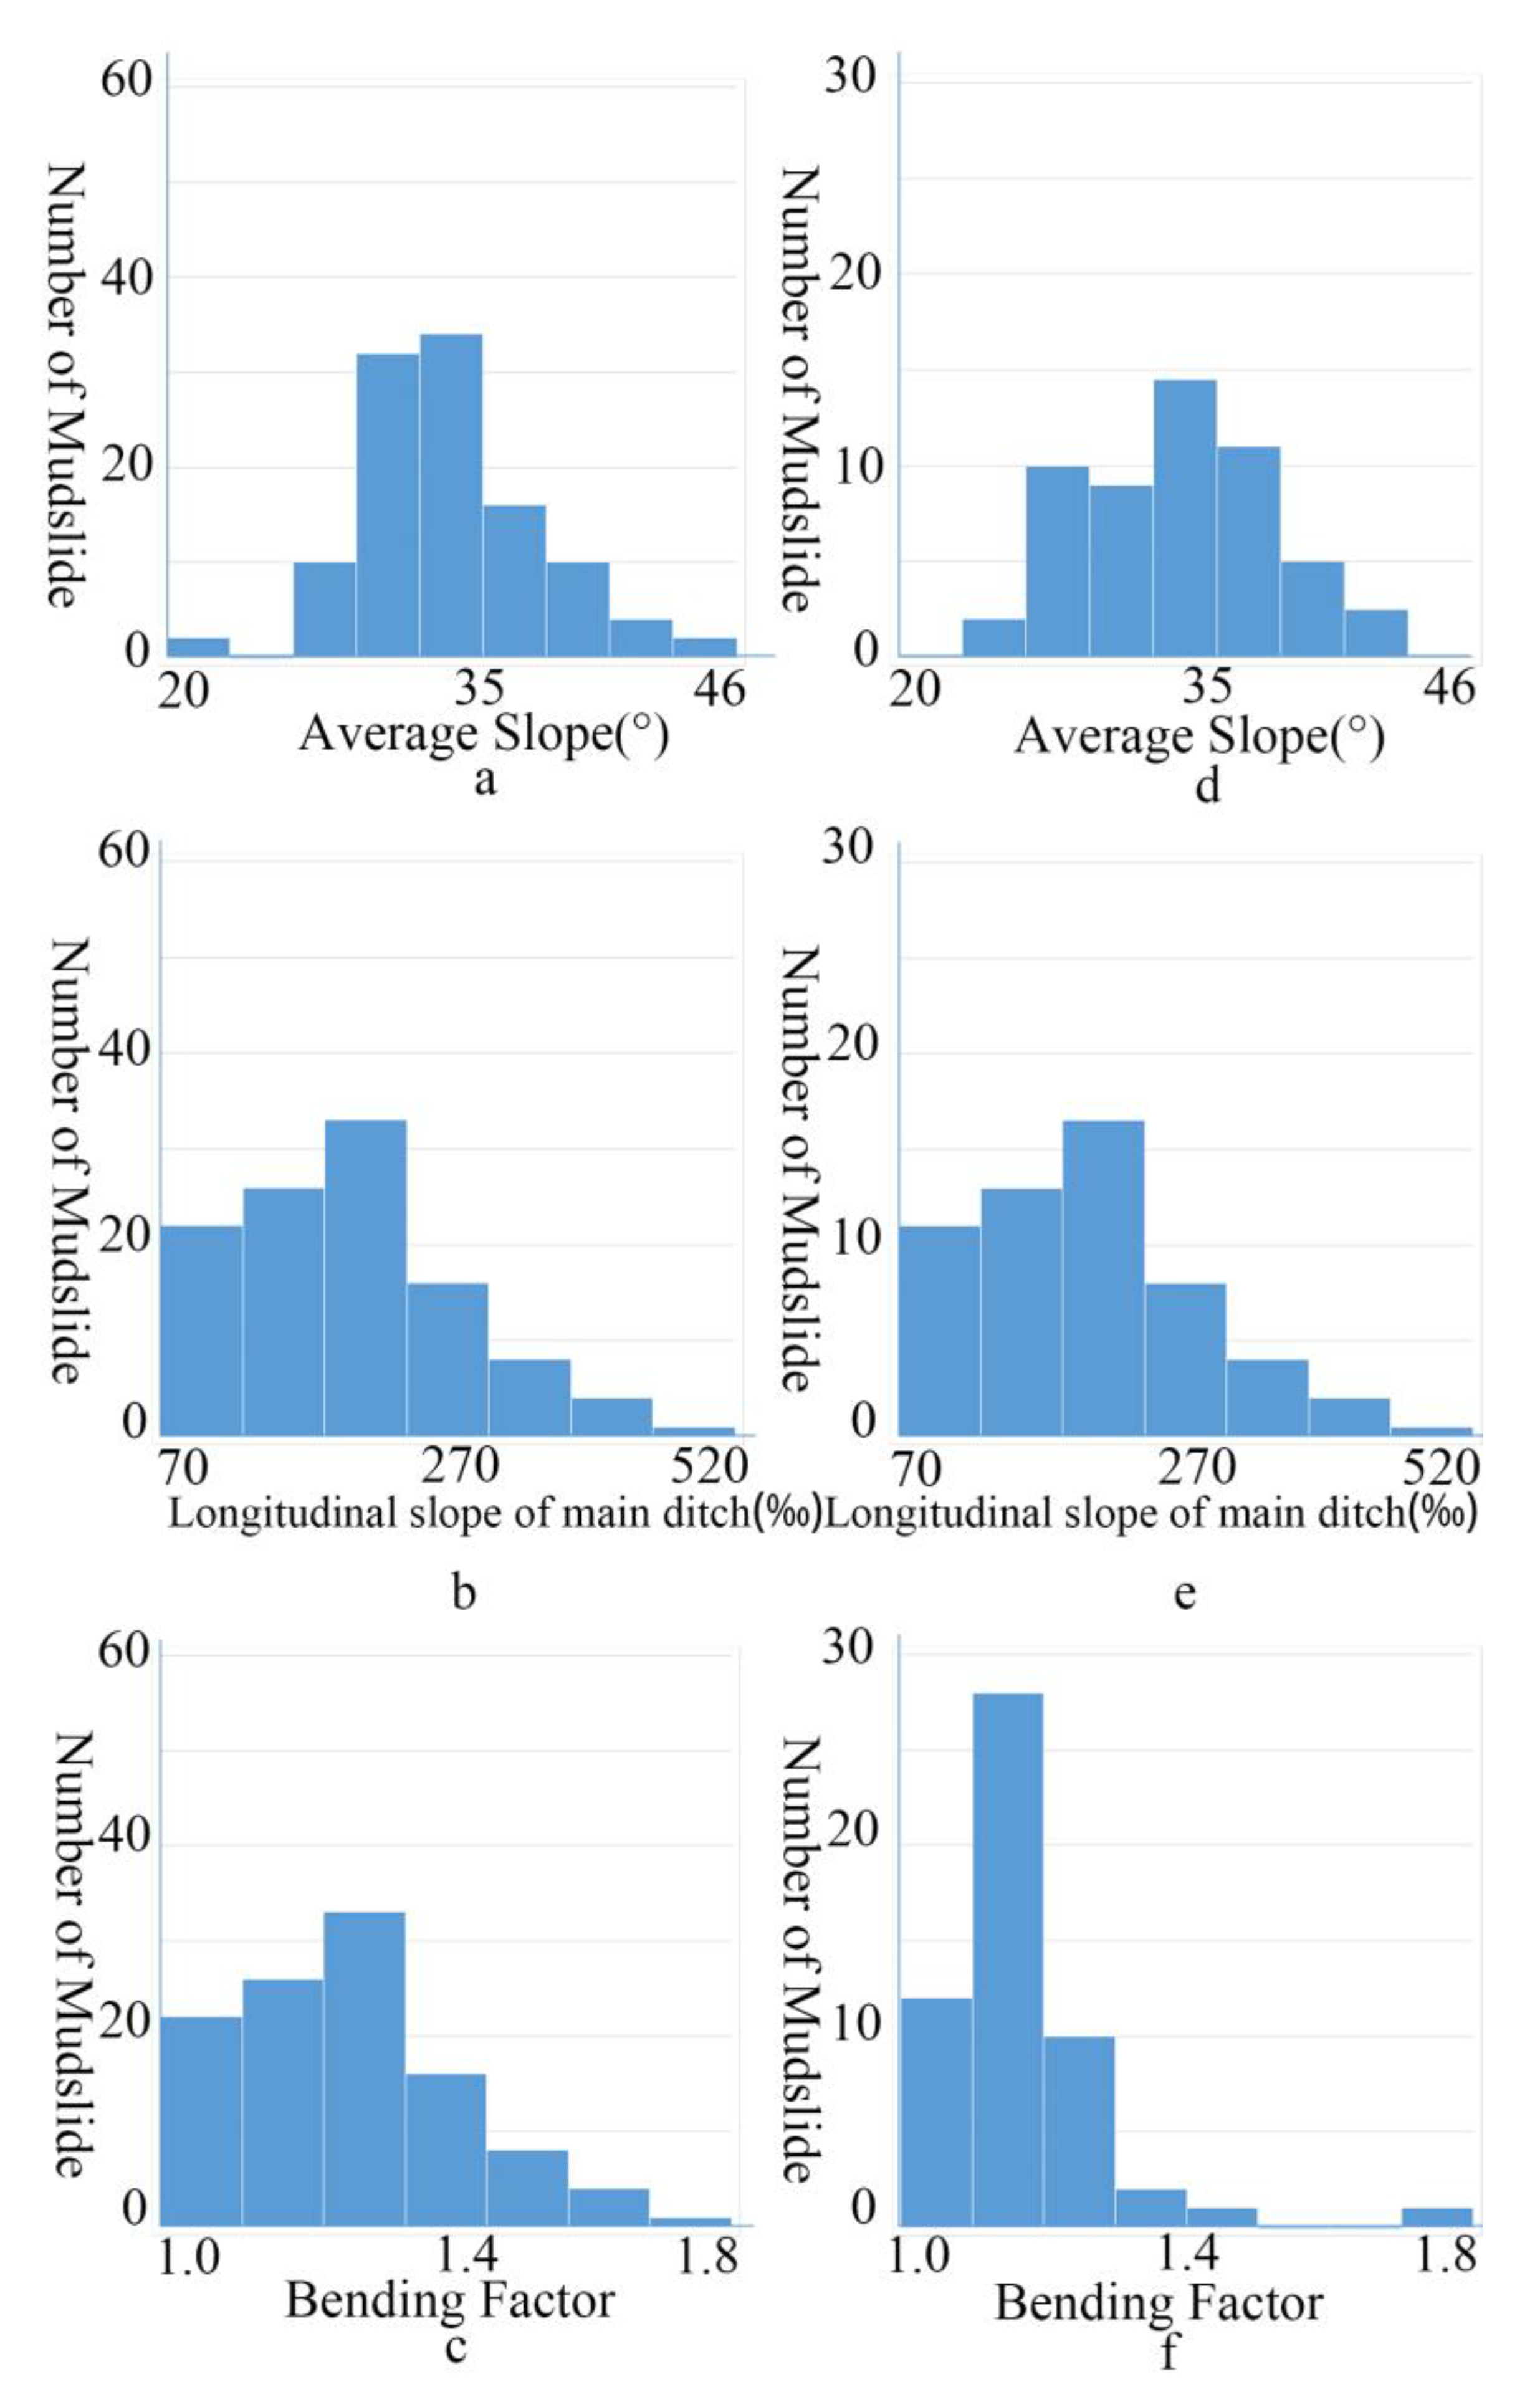
4.4.2. Terrain Condition

In addition to precipitation and material, topography also affects the occurrence of debris flows. We combined historic records and field investigations and found that 110 debris flows have occurred in Beijing since 1920. Among them, 53 ditches are distributed in the coal mining area. Using high-precision remote sensing images and DEM, we calculated the channel slope, the average slope of the hillside and the main channel bending coefficient of these ditches (Figure 19).
The results show that, if the rainfall and mass sources are not considered, in the Beijing area, debris flows are most likely to occur in the ditches with a slope gradient of 130–250‰, an average slope of 29–38°, or a main channel curvature coefficient less than 1.3. The debris flow ditches in the coal mining area of Beijing have the same average slope and longitudinal slope as those of the Beijing area, but the bending coefficient is around 1.1 (d–f in Figure 19).
The Anzigou ditch watershed area is 2.04 km2, the slope gradient is 221.19‰, the average slope is 31.65° and the curvature coefficient of the main channel is 1.12. Such terrain is favorable for the occurrence of debris flow.
Landslides S06, S07 and S08, together with the Anzigou ditch, form a potential “goaf–landslide–debris flow” disaster chain.
Landslide S10, S11, S12, and S13 developed in the Dongjiang ditch of Jinjitai Village (Figure 20). S12 and S13 are located downstream of the ditch, and their estimated total volume is about 7.6 × 10⁵ m3. The current deformation stage of the landslides, rainfall, mass source and topographic conditions of the channel all are favorable for the formation of a “goaf–landslide–debris flow” chain disaster, posing a threat to Jinjitai Village (Figure 20).
Upstream from the Dacunjian ditch (Figure 21), landslides S03 and S04 are currently in the second deformation stage, when the slope front swells and collapses. Additionally, landslide S01 and S02 have continuous deformation as well. As the deformation develops, the fissures on the rear edges will expand. The landslide body gradually grows, and may cause chain disasters.
Considering the size, location and topography, the remaining landslides cannot currently cause chain disasters.

5. Conclusions

In this paper, the multi-temporal high spatial resolution optical satellite images and RadarSat-2 data are used to identify the geological hazards, such as landslides, in the Xishan mining area, Beijing, China. We also discuss the possibility of a “goaf–landslide–debris flow” chain disaster in the study area. The following conclusions are drawn.
(1) The landslides in the Xishan mining area show obvious surface deformation during their development, which consists of the following four stages: initial deformation, slope front swelling and collapsing, rear part connecting and rupturing, and landslide creeping. The entire evolution process takes longer than ten years. The deformation process can be identified and quantified using optical remote sensing monitoring and time series InSAR technology.
(2) A total of 32 collapses and 19 landslides were identified in the study area. The distribution of collapses is related to topography and mining activity. The landslides are concentrated. There are 16 medium sized landslides, and they are divided into three types according to the development strata, the sliding features and the deformation stage. The first type is caused by high-level rock mass collapse. It develops in the overlying strata of the coal-bearing stratum. After failure, the landslide continues to deform. The other two types are caused by the rupture of goaves. The second type is mostly developed in the overlying strata of coal-bearing strata. The depth of the goaf is large, and the sliding surfaces are not connected. These landslides are mostly in either the initial deformation stage or the slope front swelling and collapsing stage. The third type is developed in coal-bearing strata. The depth of the goaf is small, and the sliding surfaces are all connected. These landslides are in the stage of creeping, and the deformation rate is significantly higher than that of the second type.
(3) The topography and precipitation of the Anzigou ditch and the Dongjianggou ditch are favorable for the occurrence of debris flows. In case of heavy rain, landslides S06, S07, S08, the Anzigou ditch, S10, S11, S12, S13 and the Dongjianggou ditch, as well as S01, S02, S03, S04 and the Dacunjiangou ditch all have the risk of a “goaf–landslide–debris flow” disaster chain.
(4) In a goaf, surface and underground disturbances can be serious, and their underground structures are complex. In those areas, besides ground fissures and ground subsidence, landslides and chain disasters may occur. To prevent and reduce the damage caused by geological disasters in those areas, we can identify areas with geohazard risks using multi-platform and multi-sensory remote sensing technologies, and build a comprehensive monitoring system for geological disasters using ground, airborne and spaceborne observations.

Author Contributions

All authors contributed to the study conception and design. Material preparation, data collection and analysis were done by R.J., S.W., H.Y., X.G., J.H., X.P. and C.Y. The first draft of the manuscript was written by R.J. and all authors commented on previous versions of the manuscript. All authors have read and agreed to the published version of the manuscript.

Funding

This research was funded by Beijing Institute of Geology and Mineral Exploration: Project of Beijing sudden geological disaster monitoring and early warning system (stage I) (11000022T000000439502), Beijing sudden geological disaster monitoring and early warning system (stage 2) (11000022T000000439510), Early identification and early warning of typical geological disasters in Xishan, Beijing Demonstration study (11000022T000001362678).

Data Availability Statement

The datasets presented in this study are available public datasets.

Conflicts of Interest

The authors declare no conflict of interest.

References

  1. Shan, Q.; Hu, R.; Deng, Y.; Ji, Y. Study on the surface collapse disasters of Xishan region, Beijing. Geol. Inst. Beijing Manicipality 1994, 5, 124–129+165. [Google Scholar]
  2. Ji, Y. The hazard and Origin of the Well-bore type collapse in the coal mined-out area of Western Hills, Beijing. Beijing Geol. 2002, 14, 28–33. [Google Scholar]
  3. Ji, Y. Deformation and metamorphic characteristics of Carboniferous Permian coal bearing formation and related geological hazards in Xishan (Western Hills)Beijing. Beijing Geol. 2004, 16, 1–17. [Google Scholar]
  4. Li, J. Applications of Geophysical Techniques in Preventing Surface Collapse in the Western Hills of Beijing. Urban Geol. 2008, 3, 30–33. [Google Scholar]
  5. Li, X.; Qi, G.; Zhang, C. Hazard Prediction of Mining Subsidence. Jiangxi Coal Sci. Technol. 2016, 3, 57–59. [Google Scholar]
  6. Xu, Q.; Li, W.; Dong, X.; Xiao, X.; Fan, X.; Pei, X. The Xinmocun Landslide on June 24,2017 in Maoxian, Sichuan: Characteristics and Failure Mechanism. Chin. J. Rock Mech. Eng. 2017, 36, 2612–2628. [Google Scholar]
  7. Li, W.; Xu, Q.; Lu, H.; Dong, X.; Zhu, Y. Tracking the Deformation History of Large-Scale Rocky Landslide and Its Enlightenment. Geomat. Inf. Sci. Wuhan Univ. 2019, 44, 1043–1053. [Google Scholar]
  8. Conte, E.; Pugliese, L.; Troncone, A. Post-failure stage simulation of a landslide using the material point method. Eng. Geol. 2019, 253, 149–159. [Google Scholar] [CrossRef]
  9. Szafarczyk, A. Stages of Geological Documentation on the Example of Landslides Located on the Slopes of the Dam Reservoir “Swinna Poreba” (Poland). IOP Conf. Series Earth Environ. Sci. 2019, 221, 012037. [Google Scholar] [CrossRef]
  10. Szafarczyk, A. Kinematics of mass phenomena on the example of an active landslide monitored using gps and gbinsar technol. J. Appl. Eng. Sci. 2019, 17, 107–115. [Google Scholar] [CrossRef]
  11. Meng, X.; Guo, Z. Susceptibility assessment of the precursor stage of a landslide threatening Haivan Railway Station, Vietnam. Landslides 2018, 15, 309–325. [Google Scholar]
  12. Deng, L.; Yuan, H.; Chen, J.; Sun, Z.; Fu, M.; Wang, F.; Yan, S.; Li, K.; Yu, M.; Chen, T. Correlation between Acoustic Emission Behaviour and Dynamics Model during Three-Stage Deformation Process of Soil Landslide. Sensors 2021, 21, 2373. [Google Scholar] [CrossRef] [PubMed]
  13. Miao, F.; Wu, Y.; Trk, A.; Li, L.; Xue, Y. Centrifugal model test on a riverine landslide in the Three Gorges Reservoir induced by rainfall and water level fluctuation. Geosci. Front. 2022, 13, 14. [Google Scholar] [CrossRef]
  14. Miao, F.; Zhao, F.; Wu, Y.; Li, L.; Xue, Y.; Meng, J. A novel seepage device and ring-shear test on slip zone soils of landslide in the Three Gorges Reservoir area. Eng. Geol. 2022. [Google Scholar] [CrossRef]
  15. Miao, F.; Wu, Y.; Xie, Y.; Li, Y. Prediction of landslide displacement with step-like behavior based on multialgorithm optimization and a support vector regression model. Landslides 2018, 15, 475–488. [Google Scholar] [CrossRef]
  16. Xu, Q.; Dong, X.; Li, W. Integrated Space-Air-Ground Early Detection, Monitoring and Warning System for Potential Catastrophic Geohazards. Geomat. Inf. Sci. Wuhan Univ. 2019, 44, 957–966. [Google Scholar]
  17. Zhao, C.; Liu, X.; Zhang, Q.; Peng, J.; Xu, Q. Research on Loess Landslide Identification, Monitoring and Failure Mode with InSAR Technique in Heifangtai, Gansu. Geomat. Inf. Sci. Wuhan Univ. 2019, 44, 996–1007. [Google Scholar]
  18. Lu, H.; Li, W.; Xu, Q.; Dong, X.; Dai, C.; Wang, D. Early Detection of Landslides in the Upstream and Downstream Areas of the Baige Landslide, the Jinsha River Based on Optical Remote Sensing and InSAR Technologies. Geomat. Inf. Sci. Wuhan Univ. 2019, 44, 1342–1354. [Google Scholar]
  19. Zhang, M.; Jia, J.; Wang, Y.; Niu, Q.; Mao, Y.; Dong, Y. Construction of Geological Disaster Prevention and Control System Based on AI. Northwest. Geol. 2019, 52, 103–116. [Google Scholar]
  20. Li, M.; Zhang, L.; Shi, X.; Liao, M.; Yang, M. Monitoring active motion of the Guobu landslide near the Laxiwa Hydropower Station in China by time-series point-like targets offset tracking. Remote Sens. Environ. 2018, 221, 80–93. [Google Scholar] [CrossRef]
  21. Tang, Y.; Wang, L.; Ma, G.; Jia, H.; Li, H.; Yin, H. Disaster Monitoring and Application Prospect Analysis of the Jinsha River Landslide Based on “Gaofen+”. Geomat. Inf. Sci. Wuhan Univ. 2019, 44, 1082–1092. [Google Scholar]
  22. Ge, D. Application of Remote Sensing in Early Recognition and Monitoring and Early Warning of Geological Hazards. City Disaster Reduction 2018, 6, 53–60. [Google Scholar]
  23. Lai, Z.; Chen, J.; Xiang., J.; Xu, B. Landslide extraction based on fractal theory and LiDAR data. Sci. Surv. Mapp. 2018, 43, 112–117. [Google Scholar]
  24. Ma, X.; Wu, Z.; Li, J. LiDAR Technology and Its Application and Prospect in Geological Environment. J. Geomech. 2016, 22, 93–103. [Google Scholar]
  25. Dai, K.; Li, Z.; Tomás, R.; Liu, G.; Yu, B.; Wang, X.; Cheng, H.; Chen, J.; Stockamp, J. Monitoring Activity at the Daguangbao Mega-Landslide(China) Using Sentinel-1 TOPS Time Series Interferometry. Remote Sens. Environ. 2016, 186, 501–513. [Google Scholar] [CrossRef]
  26. Liu, Z.; Song, Y.; Ye, R. An analysis of rainstorm-induced landslides in northeast Chongqing on August 31, 2014 based on interpretation of remote sensing images. Remote Sens. Nat. Resour. 2021, 33, 192–199. [Google Scholar]
  27. Ding, Y.; Zhang, Q.; Yang, C.; Wang, M.; Ding, H. Landslide identification in Jinsha River basin based on high-resolution remote sensing:taking Wangdalong village of Batang county as an example. Bull. Surv. Mapp. 2022, 25, 51–55. [Google Scholar]
  28. Guo, Q.; Zhu, L.; Li, A.; Gu, L. Landslide Identification Method based on NDVI Change Detection. Remote Sens. Technol Appl. 2022, 27, 17–23. [Google Scholar]
  29. Hu, Z.; Xu, H.; Wang, C.; Zhou, Z.; Li, Z. A Landslides Detection Method Based on Time Series Remote Sensing Images. Spacecr. Recovery Remote Sens. 2018, 39, 104–114. [Google Scholar]
  30. Huang, J.; Li, X.; Chen, F.; Cui, R.; Li, H.; Du, B. A deep learning recognition model for landslide terrain based on multi-source data fusion. Chin. J. Geol. Hazard Control. 2022, 33, 33–41. [Google Scholar]
  31. Wang, Y.; Ju, N.; Zhao, J.; Xiang, X. Formation Mechanism of Landslide Above the Mined Out Area in Gently Inclined Coal Bens. J. Eng. Geol. 2013, 21, 61–68. [Google Scholar]
  32. Li, B.; Wang, G.; Feng, Z.; Wang, W. Failure Mechanism of Steeply Inclined Rock Slope Induced by Undergroound Mining. Chin. J. Rock Mech. Eng. 2015, 34, 1148–1161. [Google Scholar]
  33. Cristina, R.; Jorge, P.; Marcos, M.; Adrián, R.; Patricia, R.; Agustín, M.; Teresa, T.; Roberto, S.; José, V.; Anna, B.; et al. Rapid Characterisation of the Extremely Large Landslide Threatening the Rules Reservoir (Southern Spain). Landslides 2021, 18, 3781–3798. [Google Scholar]
  34. Paolo, M.; Paolo, C.; Alessandro, B.; Francesco, I.; Francesca, B. Short-term Geomorphological Evolution of the Poggio Baldi Landslide Upper Scarp Via 3D Change Detection. Landslides 2021, 18, 2367–2381. [Google Scholar]
  35. Deepak, R.; Janusz, V.; Matylda, T. Extended Residual-State Creep Test and Its Application for Landslide Stability Assessment. Materials 2021, 14, 1968. [Google Scholar]
  36. Ge, D.; Dai, K.; Guo, Z.; Li, Z. Early Identification of Serious Geological Hazards with Integrated Remote Sensing Technologies: Thoughts and Recommendations. Geomat. Inf. Sci. Wuhan Univ. 2019, 44, 949–956. [Google Scholar]
  37. Zhu, J.; Yang, Z.; Li, Z. Recent Progress in Retrieving and Predicting Mining-induced 3D Displacements Using InSAR. Acta Geod. Et Cartogr. Sinica. 2019, 48, 135–144. [Google Scholar] [CrossRef] [Green Version]
  38. Yusuke, S.; Taro, U.; Ikushi, H.; Kazunari, T.; Yasumasa, F. Interrelated Impacts of Seismic Ground Motion and Topography on Coseismic Landslide Occurrence Using High-resolution Displacement SAR Data. Landslides 2022, 19, 2329–2345. [Google Scholar]
  39. Roy, P.; Martha, T.R.; Khanna, K.; Jain, N.; Kumar, K.V. Time and Path Prediction of Landslides Using InSAR and Flow Model. Remote Sens. Environ. 2022, 271, 112899. [Google Scholar]
  40. Lorenzo, S.; Matteo, D.; Federico, R.; Anna, B.; Silvia, B.; Pierluigi, C.; Nicola, C.; Michele, C. Review of Satellite Interferometry for Landslide Detection in Italy. Remote Sens. 2020, 12, 1351. [Google Scholar]
  41. Paolo, M.; Paolo, C.; Riccardo, M. Sliding Time Master Digital Image Correlation Analyses of CubeSat Images for landslide Monitoring: The Rattlesnake Hills Landslide (USA). Remote Sens. 2020, 12, 592. [Google Scholar]
  42. Varvara, T.; Athanassios, G.; Ioannis, K.; Eirini, E.; Ioannis, K.; Efthimios, S. Kinematics of Active Landslides in Achaia (Peloponnese, Greece) through InSAR Time Series Analysis and Relation to Rainfall Patterns. Remote Sens. 2022, 14, 844. [Google Scholar]
  43. Liu, Y.; Yang, H.; Wang, S.; Xu, L.; Peng, J. Monitoring and Stability Analysis of the Deformation in the Woda Landslide Area in Tibet, China by the DS-InSAR Method. Remote Sens. 2022, 14, 532. [Google Scholar] [CrossRef]
  44. Liu, L.; Wei, J.; Ye, C.; Zhang, C.; Zhao, Z.; Liu, Y.; Zhang, L.; Jia, S.; Wang, D.; Sun, X.; et al. Geological Hazards in Beijing; China Dadi Press: Beijing, China, 2008; pp. 22–27. [Google Scholar]
Figure 1. Geological Map of the Study Area.
Remotesensing 14 04695 g001
Figure 2. Flowchart of the proposed landslide interpretation method of optical images.
Remotesensing 14 04695 g002
Figure 3. Collapses and landslides distributed in the study area. The base map is shaded relief map.
Remotesensing 14 04695 g003
Figure 4. Medium-sized landslides in the Study Area. The base map is shaded relief map.
Remotesensing 14 04695 g004
Figure 5. Optical images of landslide S02 acquired in 2009, 2012, 2017 and 2019 (the upper five panels). Deformation velocity of landslide S02 got by InSAR (left lower panel). The deformation in LOS direction of the three points during 2016–2021 are shown in the right lower panel.
Remotesensing 14 04695 g005
Figure 6. InSAR time series results of landslide S03, S04, S05 and S14.
Remotesensing 14 04695 g006
Figure 7. Optical images of landslide S06 acquired in 2003, 2009, 2017 and 2019 (the upper five panels). Deformation velocity of landslide S06 got by InSAR (left lower panel). The deformation in LOS direction of the three points during 2016–2021 are shown in the right lower panel.
Remotesensing 14 04695 g007
Figure 8. InSAR time series results of landslide S07, S10, S15 and S16.
Remotesensing 14 04695 g008
Figure 9. Optical images of landslide S12 and S13 acquired in 2003, and 2019 (the upper two panels). Deformation velocity of landslide S12 and S13 got by InSAR (left lower panel). The deformation in LOS direction of the five points during 2016–2021 are shown in the right lower panel.
Remotesensing 14 04695 g009
Figure 10. InSAR time series results of landslide S08 and S09.
Remotesensing 14 04695 g010
Figure 11. Optical images of landslide S01 (left) and S11 (right) acquired in 2019. The red dotted line delineates the landslide boundary. A1 and A2 are the rockfall, B1 and B2 are the shoveled mountain range, and C1 and C2 areas are the accumulation range.
Remotesensing 14 04695 g011
Figure 12. Optical images of landslide S11 acquired in 2006, 2009, 2012 and 2019 (the upper four panels). Deformation velocity of landslide S11 got by InSAR (left lower panel). The deformation in LOS direction of the three points during 2016–2021 are shown in the right lower panel.
Remotesensing 14 04695 g012
Figure 13. Optical image of landslides S06 and S07 in 2003. L1, L2 denotes ground fissures. P1, P2, P3, P4, P5 and P6 denote collapsed pits.
Remotesensing 14 04695 g013
Figure 14. Optical image of Landslide S06 and S07 in 2009. P1, P2, P3, P4, P5 and P6 denote collapses that occurred on the toe.
Remotesensing 14 04695 g014
Figure 15. Optical image of landslides S06 and S07 in 2012.
Remotesensing 14 04695 g015
Figure 16. Optical image of landslides S06 and S07 in 2017. F1 denotes the rear part fissure of landslide S07. F1 denotes the rear part fissure of landslide S06.
Remotesensing 14 04695 g016
Figure 17. Deformation velocity of landslides S06 and S07 found by InSAR (left panel). The deformation in LOS direction of the six points during 2016–2021 are shown in the right panel.
Remotesensing 14 04695 g017
Figure 18. 3D map of Anzi Ditch.
Remotesensing 14 04695 g018
Figure 19. Average slope, longitudial slope of main ditch, and bending factor information of 110 debris flows in Beijing (Panel ac in the left side). Average slope, longitudial slope of main ditch, and bending factor information of 53 debris flows in the coal mining area (Panel df in the right side).
Remotesensing 14 04695 g019
Figure 20. 3D Map of Dongjiang Ditch.
Remotesensing 14 04695 g020
Figure 21. 3D map of Dacunjian Ditch.
Remotesensing 14 04695 g021
Table 1. Information of the images used in this study.
DataResolution/mYearsNumber
Quickbird0.6120031
Quickbird0.6120061
Aerial Photo0.520091
GeoEye-10.4120111
GeoEye-10.4120121
Aerial Photo0.520131
Worldview-20.520141
Worldview-20.520161
Pleiades0.520171
Pleiades0.520181
BJ-20.820191
BJ-20.820201
RadarSat-2 (descending)5.02016-202165
Table 2. Information of collapses and landslides in the study area.
DisasterNumber of Small SizeNumber of Medium SizeSubtotal
Collapse32032 (11)
Landslide31619 (3)
Total 51
The numbers in parentheses are the number of disasters that have been included in the geological disaster list for Beijing, published in 2021. Small-sized collapse: volume is less than 10,000 m3; Small-sized landslides: volume is less than 100,000 m3; Medium-sized landslide: volume is between 100,000 m3 and 1,000,000 m3.
Table 3. Basic information of landslides.
No.Developmental FormationEstimated Volume/10,000 m3Features
S01Jiulongshan Formation10.00Type A
S02Jiulongshan Formation45.00Type B
S03Jiulongshan Formation30.00Type B
S04Jiulongshan Formation15.00Type B
S05Jiulongshan Formation10.00Type B
S06Yaopo Formation50.00Type C
S07Yaopo Formation
& Longmen
Formation
100.00Type C
S08Yaopo Formation55.00Type C
S09Jiulongshan Formation16.00Type C
S10Longmen
Formation
34.00Type C
S11Jiulongshan Formation30.00Type A
S12Yaopo Formation50.00Type C
S13Yaopo Formation26.00Type C
S14Yaopo Formation15.00Type B
S15Shanxi
Formation
25.00Type C
S16Shanxi
Formation
33.00Type C
Type A: High-locality landslide, with continuous deformation since 2016. Type B: landslide with initial deformation or slope front swells and collapses since 2016. The deformation is small. Type C: landslide after failure, since 2016.
Publisher’s Note: MDPI stays neutral with regard to jurisdictional claims in published maps and institutional affiliations.

