Article

Landscape Ecological Risk Assessment and Impact Factor Analysis of the Qinghai–Tibetan Plateau

1
School of Environmental Science and Engineering, Tianjin University, Tianjin 300350, China
2
School of Science, Tibet University, Lhasa 850000, China
3
School of Geography, South China Normal University, Guangzhou 510631, China
4
The Joint Laboratory of Plateau Surface Remote Sensing, Tibet University, Lhasa 850000, China
*
Author to whom correspondence should be addressed.
Remote Sens. 2022, 14(19), 4726; https://doi.org/10.3390/rs14194726
Submission received: 29 June 2022 / Revised: 20 August 2022 / Accepted: 16 September 2022 / Published: 21 September 2022

Abstract

:
The Qinghai–Tibetan Plateau (QTP) is one of the most vulnerable ecosystems worldwide. Over the last few decades, the QTP has been subjected to increasing external pressures, such as climate change, human activity, and natural hazards. Therefore, ecological risk assessment is vital for the environmental protection and sustainable development of the QTP. A landscape ecological risk (LER) assessment based on landscape disturbance and vulnerability was performed to explore the spatiotemporal characteristics associated with LER in the QTP from 1990 to 2020. Furthermore, the impact of LER was quantitatively evaluated with a boosted regression tree model. Results showed that more than 70% of the locations in the QTP exhibited below-medium LER. The LER for the QTP demonstrated downward trends from 1990 to 2020. The LER presented downward trends during the periods from 1990 to 2001 and from 2012 to 2020 and no significant trend during the period from 2002 to 2011. Additionally, high-LER areas were concentrated in the northwestern QTP, whereas low-LER areas were mainly in the southeastern QTP. The LER displayed clustering characteristics across the QTP. Changes in climate, topographic distribution, and human activity influenced the ecological stability of the study area. Precipitation and temperature had the strongest effects on the LER, followed by elevation and grazing intensity. Lower precipitation and temperatures were associated with higher LER. Our results provide precise and specific support for the environmental protection and ecological management of the QTP and other ecologically fragile areas.

1. Introduction

The Qinghai–Tibetan Plateau (QTP), also referred to as the third pole and roof of the world, is the highest and largest plateau in the world [1]. Its unique geographical location and rich natural resources make it an ecological barrier to the surrounding areas [2]. The QTP plays fundamental roles in climatic regulation, water and soil retention, biodiversity conservation, and carbon balance [3]. However, this plateau is highly sensitive to anthropogenic activity and climate change [4,5]. As one of the most fragile areas worldwide, the QTP has received increasing attention because of unprecedented changes in its ecological conditions [6]. In recent decades, the QTP has faced more significant increases in surface temperatures than other global regions [7]. Global warming is altering the ecological environment of the QTP, including glacier and permafrost changes, grassland ecosystem changes, and desertification [8,9,10,11]. Although the effects of human activities on the QTP are limited because of its sparse population, the increasing human footprint, including urbanization, mining, and the construction of infrastructure, has subjected the ecosystem of the QTP to various pressures, such as those caused by changing ecosystems, increasing levels of pollutants, and altering surface temperatures [12,13,14,15]. Changes in the QTP further influence the global climate, as well as the water and energy cycles [16]. Therefore, ecological risk assessments across the QTP have become essential for sustainable development, both regionally and globally.
Ecological risk is the possible effects of uncertainties faced by the ecosystem and its constituents, indicating the adverse effects of elements outside the ecosystem [17]. It indicates the ability of an ecosystem to preserve its fundamental structure and function when subjected to external interferences [18]. An ecological risk assessment can be performed to identify potential adverse impacts within ecosystems at a regional scale, in response to human activity and environmental change [19,20], as well as to support environmental protection and ecosystem management [21].
Landscape ecological risk (LER) is the adverse effects of landscape pattern change on ecological processes under the interferences of natural and human factors [22]. Recently, landscape ecological risk (LER) assessments based on landscape patterns have been extensively adopted to analyze ecological risks in different fields owing to the broad application of landscape ecology theories and corresponding methods [23,24,25,26,27]. The landscape pattern indices reflect the structure and spatial relationship between units in landscape patterns. These indices can reflect landscape heterogeneity, indicating disturbances to ecological processes at different scales. Landscape ecological risk assessment can reveal the influences on landscape components and structures due to natural changes or human interferences in a region. It also allows the comprehensive evaluation of the impacts of various risk factors in the area [24,25,27,28]. This method not only accounts for the degree of damage from specific risk receptors, but also explores the impact of ecological risks on a regional scale [29]. The LER assessment has yielded good results for regional ecological risk assessments, including watersheds, wetlands and lakes, administrative regions, urban areas, coastal cities and regions, and mining areas [20,30,31,32,33,34,35]. Most studies involving ecological risk assessment of the QTP have focused on cities, basins, wetlands, or areas undergoing infrastructure construction [24,26,27,36,37]. However, ecological risk assessments of the whole QTP have not been systematically performed [38]. Some studies [12,24,38] have reported that the overall ecological risk of the QTP is decreasing, although the ecological risks of some specific regions are increasing. However, the changes in ecological risk have not been revealed at the annual scale. An analysis of the annual LER can reflect the trends in ecological risk more precisely. Moreover, the elements that influenced these ecological risk assessment outcomes were not evaluated; thus, the directivity of the terminal points of the evaluation results was unclear, preventing policymakers from using these results to make decisions regarding regional development.
Analyses of the factors impacting LER can help to identify the direction of environmental protection and support landscape planning and ecological management for sustainable development in the region [39]. Many recent studies have focused on exploring the impact factors of LER. Li [40] analyzed the impacts of landscape multifunctionality on LER using a geographically-weighted regression model. Ai [41] and Li [42] studied the effects of various natural factors and human activities on LER using the geodetector method and found the main LER-influencing factors in a specific area. Mo [43] adopted maximum covariance analysis to study the relationship between road networks and LER. Zhao [44] explored the driving factors on LER using the Pearson correlation analysis method. However, the quantitative effects of impact factors on LER cannot be revealed using these methods. The boosted regression tree (BRT) model is a method used to analyze impact factors. The BRT model can manage complex and various formats of data while explaining the potential impacts of independent variables on the dependent variable and present the relative contributions of each variable [45,46]. BRTs have been successfully used to analyze factors impacting diseases, ecological modeling, and urbanization [47,48,49]. Therefore, the BRT was employed to identify the impact factors of LER.
In this study, we assessed the LER of the QTP over the 31 years at the annual scale. We further explored the risk mechanisms based on the BRT model. The specific objectives of this study are to (1) quantitatively evaluate the LER of the QTP from 1990 to 2020; (2) explore the spatiotemporal evolution patterns of the LER over the 31 years; and (3) apply the BRT model to determine the effects on the LER of various impact factors (topographical, meteorological, and socioeconomic factors).

2. Materials and Methods

2.1. Overview of the Study Area

The QTP (Figure 1) encompasses regions in Central and East Asia and is surrounded by the massive mountain ranges of high-mountain Asia [50]. It begins at the northern foot of the West Kunlun–Qilian Mountains and reaches the southern foot of the Himalayas, with a maximum width of 1560 km from north to south; it begins from the Hindu Kush Mountains and the western edge of the Pamir Plateau and reaches the Hengduan Mountain, with a maximum length of 3360 km from east to west. With an average altitude of >4000 m, the QTP is the highest and largest plateau in the world. Also known as the Asian Water Tower, it is the source of most of the surrounding rivers, including the Yangtze, Mekong, and Salween [51]. The Chinese territory of the QTP is between 26–39°N and 73–104°E, covering an area of approximately 2.6 million km2, including the Qinghai, Gansu, Sichuan, and Yunnan Provinces, in addition to Tibet (Tibet Autonomous Region) and Xinjiang (Xinjiang Uygur Autonomous Region) [50,51].

2.2. Data Sources

Land-use/land cover (LULC) data from 1990 to 2020 were retrieved from the annual China land cover dataset (CLCD; https://doi.org/10.5281/zenodo.5210928 (accessed on 8 April 2022)), with a resolution of 30 m [52]. This database includes information for a longer time span than other land-use databases, with an overall accuracy of 79.31% [52]. The LULC of the QTP was classified as croplands, forests, grasslands (i.e., hilly, forest, and shrub grasslands), water bodies, settlements, barren lands, and glaciers/permanent snow [53]. The digital elevation model (DEM) and temperature, precipitation, gross domestic product (GDP), and population data at 1 km spatial resolution were retrieved from the Resources and Environmental Sciences and Data Center, Chinese Academy of Sciences (http://www.resdc.cn/ (accessed on 8 April 2022)). The grazing intensity data at 1 km spatial resolution were acquired from Sun et al. (2021; https://doi.org/10.11922/sciencedb.00171 (accessed on 18 Augest 2022)) [54]. The slope data were generated using the raster surface with a resolution of 1 km in ArcGIS (version 10.8, ESRI Inc., California, USA software).
Figure 2 shows the general framework used for the LER assessment and impact factor analysis. First, the study area was classified into seven types based on the LULC data. Second, the study area was divided into 3058 (30 × 30 km2) LER assessment units. The LER assessment method was generated with the landscape disturbance and landscape vulnerability index (defined later). Finally, the impact factors identified based on the LER assessment results were analyzed from topography, climate, and socioeconomic status data using the BRT model.

2.3. Landscape Ecological Risk Index

To demonstrate the LER spatially, the landscape ecological risk index (LERI) was calculated in the assessment unit; the values were then applied to the central point of each unit [55,56]. The LERI of the QTP was established using the disturbance index (Ei) and vulnerability index (Fi); Ei reflects the interference level of different landscapes related to natural and human activities [57]. A higher disturbance value leads to a higher ecological risk. Fi can be used to measure the vulnerability of an ecosystem to external disturbance(s) [30]. A smaller value indicates a decreased ecosystem risk and a more stable ecosystem. The LERI was calculated using the Ei and Fi as follows [58]:
L E R I k = i = 1 n A k i A k F i × E i
where LERIk is the LERI of assessment unit k, n is the number of landscape types, Aki is the area of landscape, i, in assessment unit k, and Ak is the area of unit k. According to previous studies [56,59,60] and considering the QTP ecosystem, after consulting experts, the Fi values for the seven LULC types were assigned as follows: 7 for glaciers/permanent snow, 6 for barren lands, 5 for waterbodies, 4 for farmlands, 3 for grasslands, 2 for forests, and 1 for settlements. The values were obtained after normalization. The Ei was calculated as follows:
E i = a C i + b N i + c D i
where Ci represents the landscape fragmentation, revealing changes in the structure, function, and ecological processes of a landscape; Ni denotes the landscape separation, which reflects the extent of segmentation among individual patches in a landscape type; Di represents the landscape dominance, which indicates the dominance of patches in a particular landscape type [61,62]; and a, b, and c refer to the contribution rates of interferences on the ecosystem (i.e., the weights of Ci, Ni, and Di, respectively), which add up to 1. These indices were calculated as follows:
C i = n i A i
N i = A 2 A i n i A
D i = Q i + M i 4 + L i 2
where ni represents the total patches in landscape i, Ai is the area of landscape i, A is the areas of all landscapes, Qi represents the ratio of the units of landscape i to the total units, Mi represents the ratio of patches in landscape i to all patches, and Li represents the ratio of the area of landscape i to the total study area [63]. According to previous studies [41,43,64] and our analysis, the importance of the indices from high to low was as follows: Ci, Ni, and Di. The values of a, b, and c were 0.5, 0.3, and 0.2, respectively.
Based on the LERI of each assessment unit, an LER spatial distribution map of the QTP was determined using the Kriging interpolation method. According to the actual conditions and previous studies [26,55,64], the natural break classification, which groups similar values and maximizes differences between classes, was adopted to divide the LER into [24,27]: extremely high risk level (LERI ≥ 0.02), high risk level (0.0175 < LERI ≤ 0.02), medium risk level (0.015 < LERI ≤ 0.0175), low risk level (0.012 < LERI ≤ 0.015), and extremely low risk level (LERI ≤ 0.012).

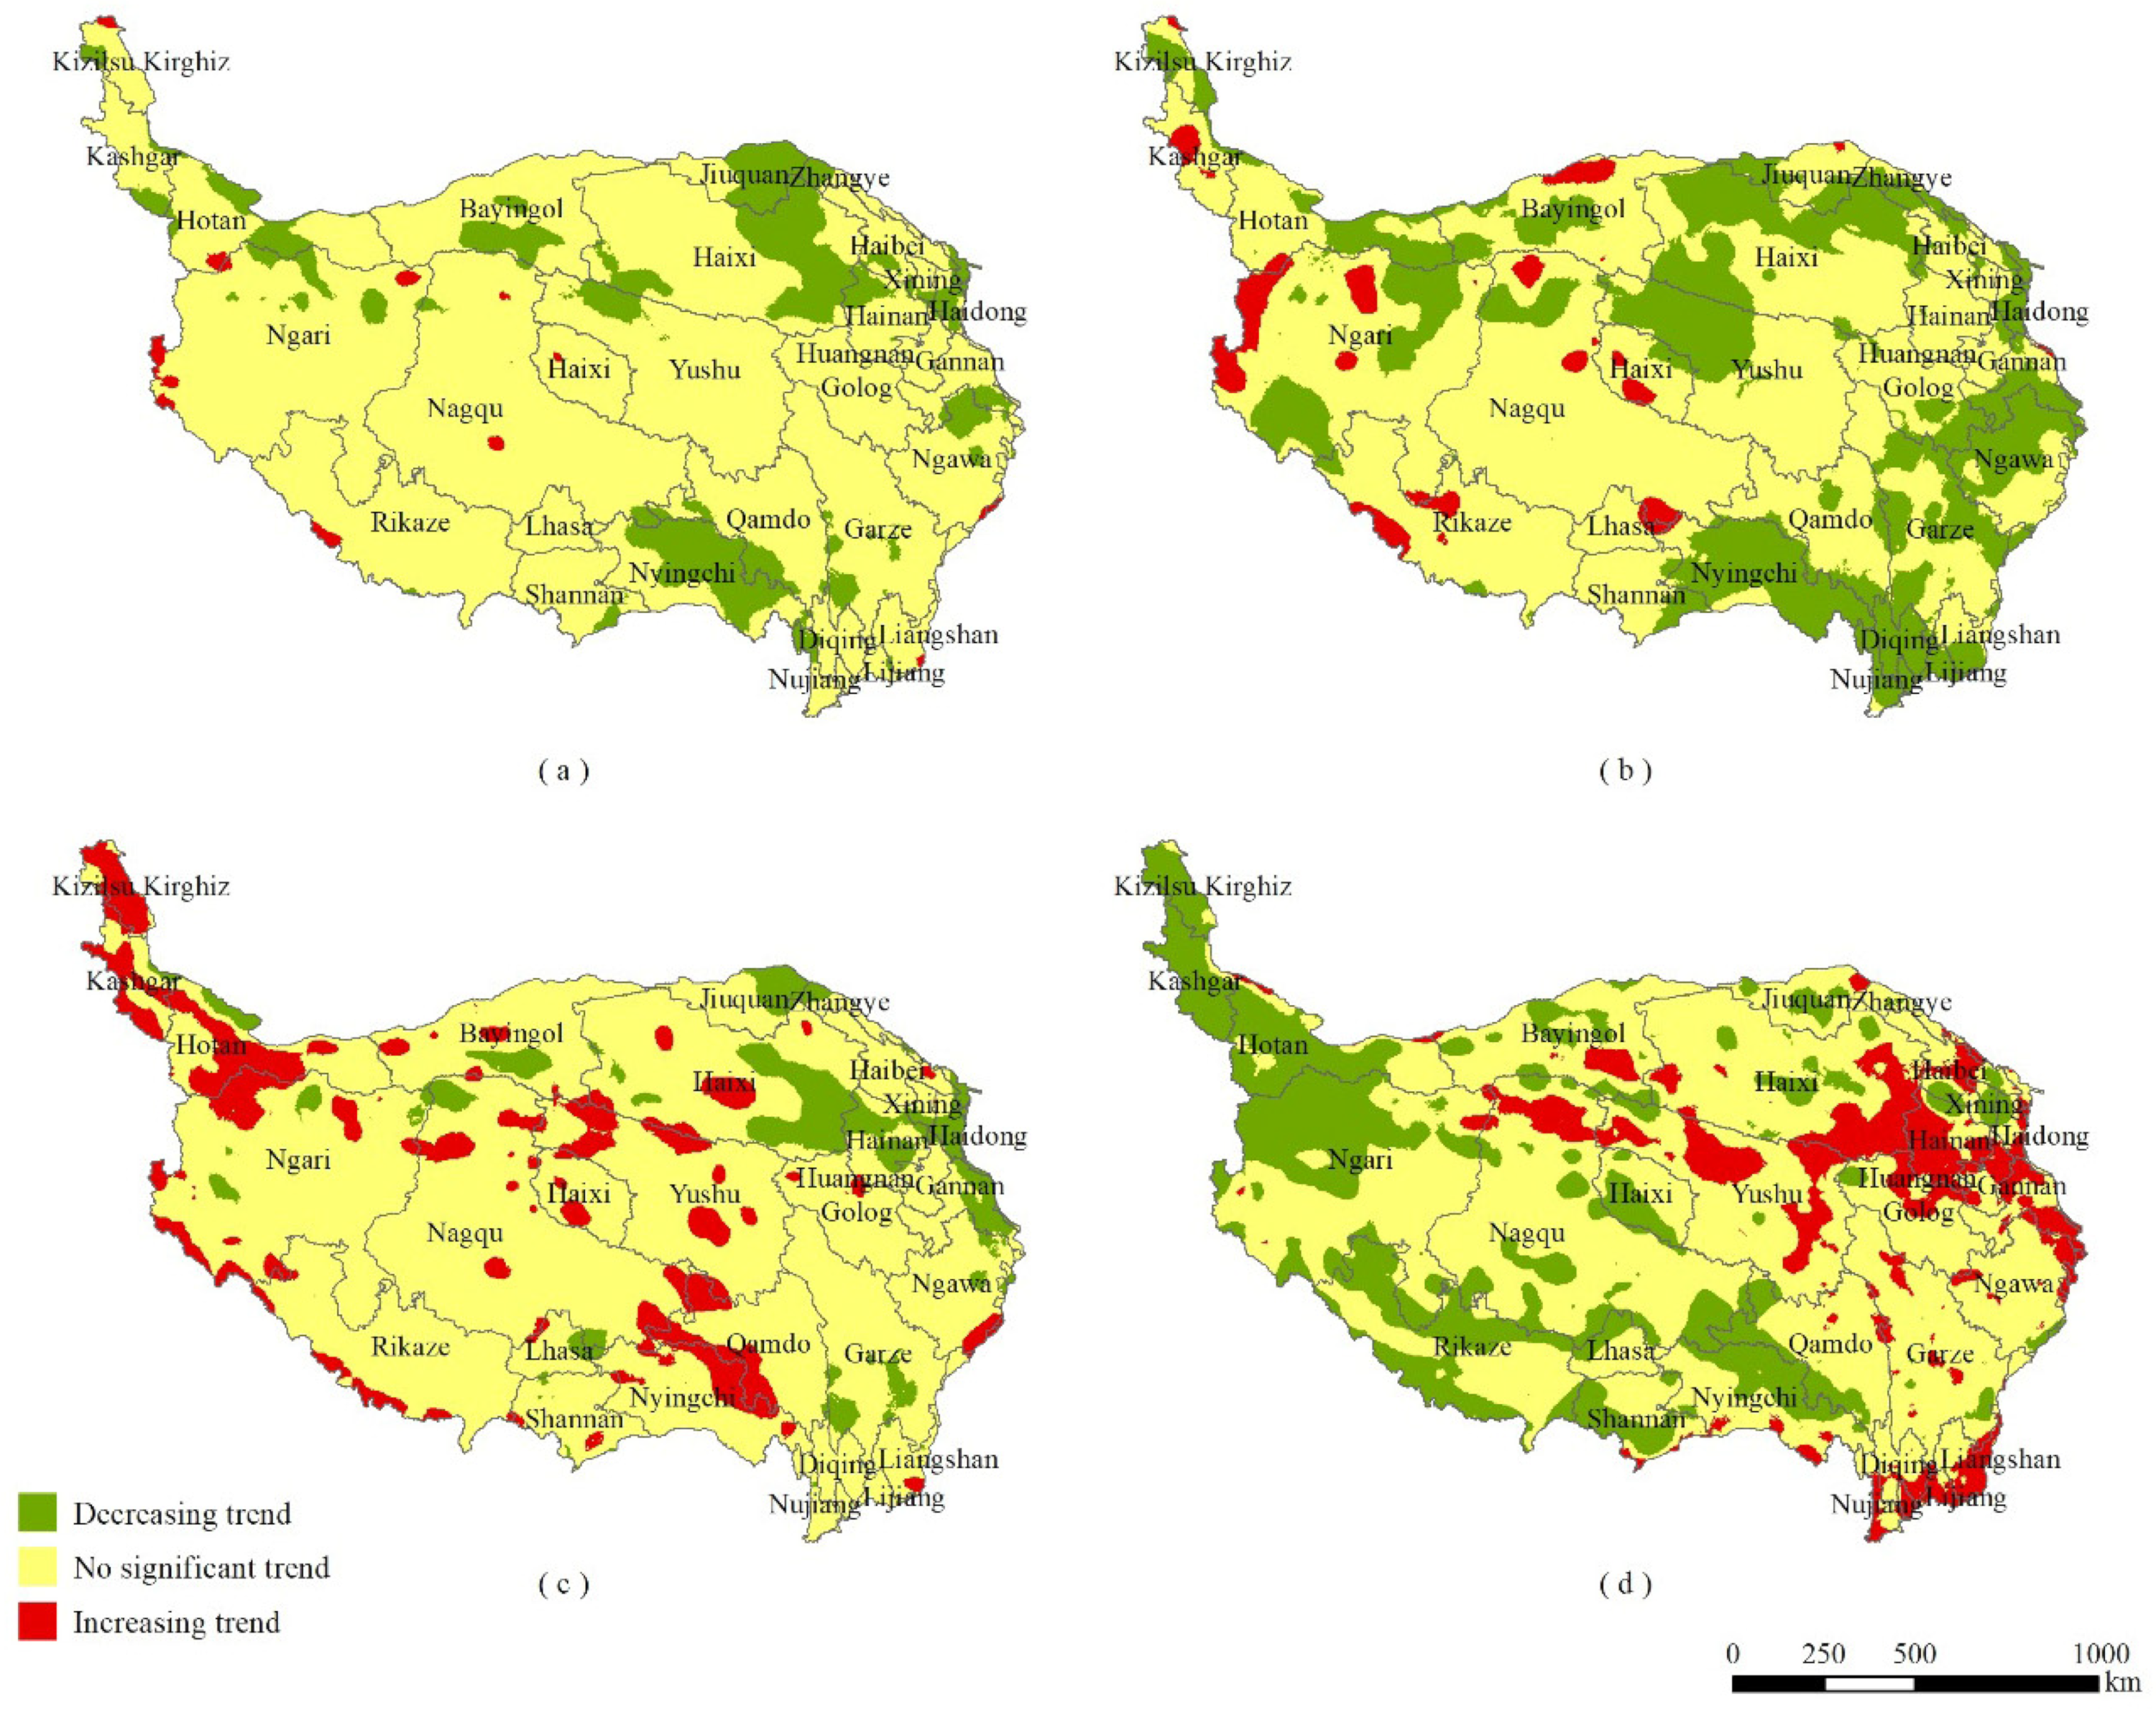
2.4. Sen’s Solpe and Mann–Kendall Test

The combination of a Sen’s Slope and the Mann–Kendall (MK) test is an effective way for discovering the significant trend of a time series. This combination can reflect the variation in trends of each pixel in a time series and have been widely used in many fields [10,65,66,67].
The Sen’s slope is a non-parametric method [68] estimating the magnitude of trends in a time series. A positive slope suggests the increasing trends, while a negative slope presents the decreasing trends. The slope was used to represent the increasing or decreasing trend in the LER during the study period on a pixel scale. The formula is as follows:
S l o p e = M e d i a n x j x i   j i ,   i < j  
where xi and xj are the values of year i and j, respectively.
The MK test is a non-parametric method used to identify the significance of a trend. The data are not required as certain distributions and is free from the interference of outliers [69,70]. The formula is as follows:
S = i = 1 n 1 j = i + 1 n s g n x j x i  
s g n x j x i = + 1 ,   i f   x j x i > 0 0 ,   i f   x j x i = 0 1 ,   i f   x j x i < 0  
where n is the length of a time series, and xi and xj are the values of year i and j, respectively. If n ≥ 10, the statistic S is approximately standard normal distribution. The standardized test statistic, Z, is computed as follows:
Z = S 1 V a r S ,   i f   S > 0 0 ,   i f   S = 0 S + 1 V a r S ,   i f   S < 0  
V a r S = n n 1 2 n + 5 18  
The null hypothesis is rejected if |Z| > Z1α/2, which means the time series presents a significant trend. In this study, α = 0.05 (|Z| > 1.96) are defined as the given significance levels.

2.5. Spatial Analysis

Spatial autocorrelation analysis reveals the degree of correlation between an assessment unit and its adjacent units [71], providing information on regional changes and the characteristics of spatial patterns [72]. The global Moran’s I and local Moran’s I (LISA) are statistical indices measuring spatial autocorrelation, both globally and locally [73,74]. The global Moran’s I reveals whether a space has clusters, and the local Moran’s I presents where clusters occur. The spatial autocorrelation of LER in the QTP was measured using the global and local Moran’s I, generated in GeoDa software (version 1.18.0, Center for Spatial Data Science, University of Chicago, Chicago, USA). The value of global Moran’s I ranges between −1 and 1. At a significance level of p < 0.05, a Moran’s I > 0 indicates spatially clustered ecological phenomena, whereas a value <0 indicates spatially discrete ecological phenomena; a value equal to 0 indicates a spatially random distribution of ecological phenomena [75]. The formula of global Moran’s I is [64]:
Global   Moran s   I = i = 1 n j = 1 m w i j x i x ¯ x j x ¯ S 2 i = 1 n j = 1 m w i j
S 2 = 1 n i = 1 n x i x ¯ 2
x ¯ = 1 n i = 1 n x i
where x is the observation value; x ¯ is the mean of x; and wij is the spatial weight matrix. If unit i is a neighbor of unit j, wij = 1; otherwise, wij = 0 (i = 1, 2, …, n; j = 1, 2, …, m).
The local Moran’s I presents the distribution state of local heterogeneity [76]. We obtained a clustering map of LISA, reflecting spatial heterogeneity in the LER, estimating the local clusters and scope of clusters (Table 1). LISA was calculated as follows:
Local   Moran s   I i = z i j = 1 n w i j z j   i j
where z represents the standardized observation value and wij represents the spatial weight matrix.

2.6. Boosted Regression Tree Model

The BRT model, a machine learning technique combining regression trees and a boosting method, was used to study the impact of factors on the LER. The regression tree algorithm uses recursive binary splits to relate responses to its predictors. The boosting algorithm is an adaptive technique that combines numerous simple regression trees to increase the forecast accuracy [77]. The BRT model enhances the stability and precision of the calculated outcomes, showing great flexibility and learning ability when managing different types or complex predictors; it automatically handles the interaction/correlation between independent variables. Additionally, this method has been extensively implemented in many fields and is advantageous for examining predictors between complex relationships and making predictions [27,47,78,79].
We used the LERI values of each year as dependent variables. There were nine independent variables, including the elevation, slope, annual precipitation, average annual temperature, distance from residential areas, distance from roads, population, GDP, and grazing intensity. Figure 3 shows the nine driving factors. The data shown in (a), (b), (e), and (f) are static variables, whereas those in (c), (d), (g), (h), and (i) are dynamic variables.
The “gbm”, “rgdal”, and “brt” packages developed by Elith [77] in R (x64 4.1.0) were used to implement the model. The BRT model was adopted to investigate the influence of different factors on the LER with a Gaussian distribution. Three parameters must be specified in the BRT: bag fraction, learning rate (LR), and tree complexity (TC). The bag fraction is the percentage of training data chosen at each step used to build the model [80]. LR reflects each tree’s contribution to the final model. TC controls whether the interaction between variables should be considered.
In the model, the number of trees was automatically set through internal cross-validation. The number of trees was optimal when the predictive error reached a minimum. Additionally, the LR, TC, and bag fraction were confirmed using a trial-and-error approach [77]. Generally, a bag fraction value of 0.2 is considered reasonable [80]. To determine the optimal parameter combination, the model was tested with LR = 0.01, 0.05, 0.001, and 0.005 and TC = 1, 5, and 10. To achieve the highest accuracy and avoid model overfitting, 10-fold cross-validation was adopted to determine the optimal model and best parameters with the lowest cross-validation (CV) deviance and standard error (SE), where LC = 0.001, TC = 10, and ntree = 10,000 [81,82].

3. Results

3.1. LULC Changes

Figure 4 shows the LULCs on the QTP in 1990 and 2020. Figure 5 illustrates the percentages of the LULC types across the QTP from 1990 to 2020. The dominant LULC type was grasslands, accounting for >60% of the total QTP. Barren lands were distributed mostly in the northern QTP, accounting for approximately 22% of the total QTP. Forests mainly occupied the southeastern QTP, accounting for 8% of the total QTP. Glaciers and snow areas, wetlands, and farmlands accounted for approximately 2.5%, 2%, and 0.5% of the QTP, respectively.
For 31 years (1990–2020), the land-use structure across the QTP was stable. LULC changes were characterized by a decrease in grasslands (from 64.60% in 1990 to 62.63% in 2020), an increase in barren lands (from 22.16% in 1990 to 23.31% in 2020), an increase in forest lands (from 8.45% in 1990 to 9.11% in 2020), a significant increase in wetlands (from 1.67% in 1990 to 2.22% in 2020), slight decreases in farmlands (from 0.45% in 1990 to 0.40% in 2020) and glaciers/permanent snow areas (from 2.66% in 1990 to 2.33% in 2020), and a remarkable increase in settlement areas (from 0.001% in 1990 to 0.002% in 2020).

3.2. Spatiotemporal Pattern of Landscape Ecological Risk

The spatial distributions of the LER from 1990 to 2020 and the classification maps are shown in Figure 6. Generally, the spatial distributions of the LER in the QTP revealed an increasing LER from the southeastern to the northwestern regions. High LER regions were concentrated along the northwestern QTP, whereas low LER regions were mainly observed in the southeast.
Figure 7 shows detailed information regarding the LER levels for each year from 1990 to 2020. Table 2 presents the transfer matrix of the LER between 1990 and 2020 on the QTP. From 1990 to 2020, the risk level did not change in approximately 85% of the areas. The area of risk below the medium risk level accounted for approximately 70% of the QTP; the ratios of areas below medium risk showed upward trends with a decrease in the LERI. The results suggest that the LER in the QTP during the study period was not serious. In particular, the proportion of extremely low-risk-level areas increased over the 31 years from 9.68% in 1990 to 11.09% in 2020; these areas were primarily derived from low-risk areas. The percentage of low-risk-level areas also increased from 29.79% in 1990 to 34.37% in 2020; these areas were primarily derived from medium-risk areas. The percentage of medium-, high-, and extremely high-risk areas showed decreasing trends during the study period (i.e., 28.70% to 26.00%, 10.59% to 10.29%, and 21.87% to 18.25%, respectively).
Figure 8 presents annual average LERI values from 1990 to 2020. The Sen’s Slope and MK test were adopted to explore the variation in the trend in the LER. From 1990 to 2020, the average LERI of QTP demonstrated downward trends. The downward trends in LER were discovered during the period of 1990 to 2001 and 2012 to 2020, and there was no significant trend during the period of 2002 to 2011. Therefore, the years 2001 and 2011 were selected as a break point, and the study period were divided to three periods to explore the changes in LER of QTP. Therefore, MK trend analysis was performed respectively from 1990 to 2001, from 2002 to 2011, and from 2012 to 2020 to discover the temporal change patterns of LER (Figure 9).
From 1990 to 2020 (Figure 9a), regions with no significant trend in LER occupied 85.22% of the study area. Regions with a decreasing trend in LER were mostly in the southeastern and northeastern QTP, comprising 14.03% of the study area, and regions with an increasing trend in LER only occupied 0.75% of the total area, mostly in central Nagqu, western and northeastern Ngari, and western Rikaze. From 1990 to 2001 (Figure 9b), regions with no significant trend in LER occupied 65.62% of the study area. Regions with a decreasing trend in LER were mostly in the eastern, central, southeastern, and northeastern QTP, comprising 30.56% of the study area, and regions with an increasing trend in LER occupied 3.81% of the total area, mostly in southern and northern Nagqu, western and northeastern Ngari, and western and central Rikaze.
From 2002 to 2011 (Figure 9c), regions with no significant trend in LER occupied 80.03% of the study area. Regions with a decreasing trend in LER were mostly in the northeastern QTP, comprising 7.76% of the study area, and regions with an increasing trend in LER occupied 12.21% of the total area, mostly in northwestern, southwestern, and central QTP.
From 2012 to 2020 (Figure 9d), regions with no significant trend in LER occupied 61.97% of the study area. Regions with a decreasing trend in LER were mostly in northwestern, southwestern, and central QTP, comprising 26.1% of the study area, and regions with an increasing trend in LER occupied 11.93% of the total area, mostly in the eastern and southeastern QTP.

3.3. Global Spatial Autocorrelation of LER

Moran’s I scatter plots were obtained using the spatial distribution data on LER in the QTP from 1990 to 2020 (Figure 10). The Moran’s I values in 1990, 2000, 2010, and 2020 reached 0.858, 0.860, 0.851, and 0.873, respectively, which were relatively high. This result indicates that the LER in the QTP shows significant clustering characteristics and a positive spatial correlation. Thus, areas with a high LER had a high LER in the surrounding areas, whereas areas with a low LER had a low LER in the surrounding areas.

3.4. Local Spatial Autocorrelation of LER

The local spatial autocorrelation of the LER was dominated by HH and LL types, as shown in Figure 11. HH and LL indices imply that the area and neighboring areas have high and low LER values, respectively. HH regions were primarily in the northwestern QTP and characterized by a wide distribution of barren lands. This land-use type is the most ecologically fragile and exhibits high disturbance and vulnerability indices, resulting in high LER values. LL regions were mainly in the southeastern QTP, where the dominant LULC types are grasslands and forests. These LULC types had low vulnerability, with relatively low LER values.

3.5. Analysis of LER Impact Factors

Figure 12 shows the BRT results, presenting the relative importance of the nine impact factors on the LER in the QTP. Annual precipitation contributed the most to the LER, having a relative importance of 56.21%. The other impact factors of relative importance, in descending order, were the average temperature (10.82%), elevation (9.36%), grazing intensity (8.88%), distance from residential areas (5.97%), population (4.46%), slope (2.42%), distance from roads (1.13%), and GDP (0.75%).
Figure 13 illustrates the relative influences of various factors on LER, showing how the impact factors vary with different values. A relative influence value > 0 positively affects LER, whereas a value < 0 adversely affects LER. A value = 0 means that the relationship is not significant. Relative effects analysis showed that the relative influence on LER was positive when precipitation was <800 mm, and the influence decreased gradually with increasing precipitation. The influence on LER became negative when precipitation exceeded 800 mm. When the temperature was <−6 °C, the impact on LER was positive; its effect gradually weakened with rising temperature. The influence on LER became negative when the temperature was >−6 °C and increased with rising temperature. When the elevation was <4200 m, the LER had a positive influence, reaching the highest level at 2200 and 3100 m. When the elevation was >4200 m, the impact on LER was negative and became stronger as the elevation increased. When the grazing intensity was <4 sheep units/km2, its impact on LER was positive, gradually decreasing with increasing grazing intensity. When the grazing intensity was within 4–45 sheep units/km2, the impact on LER was negative. The impact of the distance from residential areas on LER was first negative and subsequently became positive at a 100 km threshold. When the population was <6 people/km2, its impact on LER was positive, gradually decreasing with increasing population. When the population density was within 6–58 people/km2, the impact on LER was negative. As the slope increased, the LER initially increased and then decreased at a 26° threshold. The impact of the distance from roads on LER was positive and then became negative as the distance increased, with a 38 km threshold. When the GDP was <58,000 yuan/km2, its impact on LER was positive, gradually decreasing with increasing GDP. When the GDP was within 58,000–380,000 yuan/km2, its effect on LER was negative. The impact on the LER became positive when the GDP was >380,000 yuan/km2.

4. Discussion

4.1. The Spatiotemporal Changes in LER

The overall LER from 1990 to 2020 of the QTP was “low”, as more than 70% of the region was below the medium risk level. The spatial distributions of the LER in the QTP revealed increasing LER from the southeastern to northwestern regions. The LER for the QTP demonstrated downward trends from 1990 to 2020. The analysis of the annual LER data revealed LER changes during different periods.
Spatially, the LER of the QTP presented significant heterogeneity. High-LER areas were concentrated in northwestern QTP. These areas have a high ecological vulnerability [10]. Low precipitation and low temperatures limited vegetation growth in the areas [83]. The main LULC type of these areas is barren land that has a high landscape vulnerability. These may result in a high LER. The low-LER areas were mainly in the southeastern QTP. The main LULC types of these areas were forests and grasslands, with low landscape vulnerability. Moreover, the vegetation cover is relatively high [84], natural conditions were good, and the ecosystem is stable and has high integrity, resulting in lower LER.
From 1990 to 2001, the LER showed a downward trend. The regions with a downward trend in LER were mainly concentrated in the southeast and northeast. During this period, the economy was underdeveloped in the QTP and human activities was limited, and the impact on LER was dominated by natural factors. Increased precipitation and temperature rise stimulated vegetation growth [85], which can decrease the landscape vulnerability, resulting in improved ecological stability.
From 2002 to 2011, the LER of more than 80% of the areas in QTP showed no significant trend. However, with the implementation of the Strategy for the Large-Scale Development of Western China, the intensity of human activities increased rapidly. The adverse effects of human activities offset the positive effects on the ecosystem to some extent. As a result, the overall LER was inhibited and presented no significant trend.
From 2012 to 2020, there was a downward trend in LER in the eastern and northeastern QTP. There was a sustainably and significant upward trend in vegetation during this time in the east and northeastern QTP [86]. Further, the restoration of grazing lands to grasslands, the preservation of the natural forests, and the establishment of nature reserves have significantly enhanced the ecological restoration, resulting in a decrease in LER. The eastern and southeastern QTP exhibited an upward trend in LER during this period. With rapid urbanization, the intense human activities further increased pressure on the environment [12,87], leading to an increasing trend in LER in these areas.

4.2. Analysis of Impact Factors

According to the results of BRT analysis, we found that climate, topography, and human activities impacted the LER of the QTP. The most important factors affecting LER were precipitation and temperature. Lower temperature and precipitation values in this area yielded relatively higher LER. Figure 14 shows that the temperature of the QTP increased significantly, whereas precipitation remained mostly constant from 1990 to 2020. The QTP has a fragile ecosystem that is extremely susceptible to environmental change [88]. Owing to global climate change, variations in wetting and warming on the QTP can reduce LER, resulting in improved ecological stability.
The southeastern QTP had the lowest LER. These areas experienced relatively high precipitation, from 620 to 1800 mm. The main LULC types of these areas were forests and grasslands, with low vulnerability. Moreover, the climate conditions stimulated vegetation growth, resulting in lower LER. Hotan, Bayingol, and Kashgar prefectures in the northwestern QTP presented the highest LER. The annual precipitation in these areas ranges from 2 to 120, 12 to 300, and 25 to 300 mm, respectively, which is quite low. Therefore, barren land, accompanied by low precipitation and low temperatures, can lead to a higher LER, as such areas are highly vulnerable to natural and anthropogenic pressures.
The QTP is a high-altitude plateau in terms of topography. The positive effect on the LER peaked at elevations between 2200 and 3100 m, primarily owing to the intense human activities in this region, causing the greatest disturbances. With increasing elevation, human activity gradually decreased, leading to a lower influence on the LER. Above 4200 m, the main LULC types were grasslands with many lakes, characterized by a low vulnerability. The LER decreased to its minimum value when the elevation exceeded 4200 m.
The human activities influenced the LER, to some extent. Grazing is one of the essential human activities on the QTP. The primary LULC type for grazing is grasslands, which have a low vulnerability. Moderate grazing intensity can reduce grassland vulnerability and improve habitat quality and the stability of the ecosystem [89,90,91]. The effect on LER is negative when the grazing intensity is within a moderate range. However, as the grazing intensity increase, high grazing intensity caused the degradation of the grasslands, reduction of biodiversity and productivity of grasslands, and reduced ecosystem stability [91], resulting in high LER. Sustainable grazing management can promote ecosystem health and reduce the LER levels [89]. The population of the QTP has gradually increased over the past 31 years. However, due to severe natural conditions, the QTP has a smaller population than other regions of the world. Therefore, the impact of population on LER is limited. In addition, local governments have attempted to control urbanization and expansion, restricting polluting industries to protect the QTP from anthropogenic pressures. When the population is within a certain range, settlements are effectively planned and managed, helping preserve ecological stability. The implementation of ecological restoration projects by the government across the QTP has also increased the vegetation cover and reduced the LER levels in certain areas [84].

4.3. Policy Implications

According to the LER assessment results of the Qinghai-Tibet Plateau, LER prevention strategies should be developed based on the characteristics of different risk areas combined with local environmental conditions and social development. For the high-LER areas, the northwestern part of the QTP, LER was mainly dominated by natural conditions. Implementation of the ecological safety barrier protection project of the QTP by establishing nature reserves and national parks can alleviate the ecological degradation caused by climate change and greatly reduce its LER. In low-LER areas, the southeastern part of the QTP, LER has increasing trends related to human activities. It is important to determine a reasonable ecological red line and to make rational allocations of life, production, and ecological space, coordinating and reducing the impact of humans on the ecological environment.

4.4. Advantages, Limitations, and Future Work

LER assessment is an effective method for multi-scale ecological risk assessment. This method combines geographical and ecological processes, effectively exploring the spatiotemporal heterogeneity of the ecological risk in regions. The LER changes can be reflected more precisely with the annual data, and areas with significant trends of LER over the QTP are identified, which has seldom been performed by previous studies. The quantitative analysis of impact factors at the pixel scale can provide a reference for ecological protection and sustainable planning in this area.
Nonetheless, this study has some limitations. First, the LER assessment results were highly dependent on the LULC maps; thus, different LULC classifications and errors in the LULC data may lead to uncertainties in LER assessment results. The overall accuracy of the LULC data was >79% in our research, enabling reliable assessments of the LER. However, errors in the LULC maps were unavoidable; thus, the accuracy of the LULC data should be improved in future studies to reduce uncertainties in the LER assessment and validate the findings of this study. Second, the QTP is a relatively large region over which to perform an LER assessment, and fully identifying ecosystem processes is complex. The partitioning of the evaluation unit was the basis for representing spatial heterogeneity in the LER; however, the scale effects enlarged the uncertainties in the LER assessment [92]. The size of the evaluation unit was set to 5 × 5 km2 [24] and 10 × 10 km2 [58] in previous studies, whereas we used a size of 30 × 30 km2. Using different assessment units may lead to different evaluation results. The scale effects should be looked up in future studies. Third, there were variations in the dominant factors influencing the LER of different regions. More aspects including human activities such as grazing will be considered in the future. Finally, the LEA assessment does not provide an endpoint. Incorporating ecosystem services into LEA assessment can improve the framework for landscape ERA by enhance the directionality of risk management [93].

5. Conclusions

As one of the most vulnerable ecosystems, the QTP is extremely sensitive to human activities and environmental changes. Management of ecological risk in the QTP to maintain ecosystem stability and sustainable development is a significant challenge for the government. We performed a spatiotemporal analysis of the LER in the QTP using a LERI based on land cover data for the QTP from 1990 to 2020. We identified the factors impacting the LER of the QTP, providing a basis for ecological protection and sustainable development.
From 1990 to 2020, the LER across the QTP was not severe and showed a decreasing trend (2.8%), indicating an overall improvement in the ecological scenario. A downward trends in LER can be seen during the period from 1990 to 2001, where the regions with decreasing trends in LER were mainly in the eastern, central, southeastern, and northeastern QTP and from 2012 to 2020, where the regions with decreasing trends in LER were mainly in the northwestern, southwestern, in central QTP. From 2002 to 2011, the LER of QTP showed no significant trend. The LER presented notable positive spatial correlations and was significantly spatially clustered. The high-LER areas were mostly in the northwestern QTP, whereas the low-LER areas were mostly in the southeastern QTP.
Climate, topography, and human activities impact the stability of the QTP ecosystem. Precipitation and temperature had the strongest impact on the LER in this area, primarily because the QTP is highly sensitive to natural environment changes. Because of climate change, variations in warming and wetting on the QTP can reduce LER, resulting in improved ecological stability. The elevation and human activities also impacted the LER of the QTP. Intensive human activities occurred in low-elevation areas of the QTP, maximizing disturbance to the ecosystem and leading to high LER. High grazing intensity caused the degradation of grasslands and reduced ecosystem health, leading to high LER. However, sustainable grazing management and appropriate population controls and effective management strategies can protect the environment and maintain ecological stability.

Author Contributions

Conceptualization, methodology, software, validation, and writing, S.W.; resources, X.T.; data curation, supervision, and funding acquisition, F.F. All authors have read and agreed to the published version of the manuscript.

Funding

This research was funded by the Natural Science Foundation of Tibet, China, grant number 2016ZR-TU-05, and the Foundation for Innovative Research for Young Teachers in Higher Educational Institutions of Tibet, China, grant number QCZ2016-07.

Data Availability Statement

Not applicable.

Acknowledgments

The authors are grateful to the anonymous reviewers for their valuable comments and suggestions to improve this study and thank Sun Caige for technical support with the software.

Conflicts of Interest

The authors declare no conflict of interest.

References

  1. Wu, T. The Qinghai-Tibetan Plateau: How High Do Tibetans Live? High Alt. Med. Biol. 2001, 2, 489–499. [Google Scholar] [CrossRef]
  2. Sun, H.; Zheng, D.; Yao, T.; Zhang, Y. Protection and Construction of the National Ecological Security Shelter Zone on Tibetan Plateau. Acta Geogr. Sin. 2012, 67, 3–12. [Google Scholar]
  3. Hua, T.; Zhao, W.; Cherubini, F.; Hu, X.; Pereira, P. Sensitivity and Future Exposure of Ecosystem Services to Climate Change on the Tibetan Plateau of China. Landsc. Ecol. 2021, 36, 3451–3471. [Google Scholar] [CrossRef]
  4. Yao, T.; Thompson, L.G.; Mosbrugger, V.; Zhang, F.; Ma, Y.; Luo, T.; Xu, B.; Yang, X.; Joswiak, D.R.; Wang, W.; et al. Third Pole Environment (TPE). Environ. Dev. 2012, 3, 52–64. [Google Scholar] [CrossRef]
  5. Piao, S.; Niu, B.; Zhu, J.; Zhang, X.; Wang, T.; Wang, S.; Liang, E. Responses and Feedback of the Tibetan Plateau’s Alpine Ecosystem to Climate Change. Chin. Sci. Bull. 2019, 64, 2842–2855. [Google Scholar] [CrossRef]
  6. Cui, X.; Graf, H.F. Recent Land Cover Changes on the Tibetan Plateau: A Review. Clim. Chang. 2009, 94, 47–61. [Google Scholar] [CrossRef]
  7. Dong, M.; Jiang, Y.; Zheng, C.; Zhang, D. Trends in the Thermal Growing Season throughout the Tibetan Plateau during 1960–2009. Agric. For. Meteorol. 2012, 166–167, 201–206. [Google Scholar] [CrossRef]
  8. Chen, D.; Xu, B.; Yao, T.; Guo, Z.; Cui, P.; Chen, F.; Zhang, R.; Zhang, X.; Zhang, Y.; Fan, J.; et al. Assessment of Past, Present and Future Environmental Changes on the Tibetan Plateau. Kexue Tongbao/Chin. Sci. Bull. 2015, 60, 3025–3035. [Google Scholar] [CrossRef]
  9. Xu, Z.; Zhang, Y.; Cheng, S.; Zheng, D. Scientific Basis and the Strategy of Sustainable Development in Tibetan Plateau. Sci. Technol. Rev. 2017, 35, 108–114. [Google Scholar]
  10. Xia, M.; Jia, K.; Zhao, W.; Liu, S.; Wei, X.; Wang, B. Spatio-Temporal Changes of Ecological Vulnerability across the Qinghai-Tibetan Plateau. Ecol. Indic. 2021, 123, 107274. [Google Scholar] [CrossRef]
  11. Wang, X.; Zhong, X.; Fan, J. Spatial Distribution of Soil Erosion Sensitivity on the Tibet Plateau. Pedosphere 2005, 15, 465–472. [Google Scholar]
  12. Wang, Z.; Li, J.; Liang, L. Ecological Risk in the Tibetan Plateau and Influencing Urbanization Factors. Environ. Chall. 2022, 6, 100445. [Google Scholar] [CrossRef]
  13. Li, S.; Zhang, Y.; Wang, Z.; Li, L. Mapping Human Influence Intensity in the Tibetan Plateau for Conservation of Ecological Service Functions. Ecosyst. Serv. 2018, 30, 276–286. [Google Scholar] [CrossRef]
  14. Xu, B.; Cao, J.; Hansen, J.; Yao, T.; Joswia, D.R.; Wang, N.; Wu, G.; Wang, M.; Zhao, H.; Yang, W.; et al. Black Soot and the Survival of Tibetan Glaciers. Proc. Natl. Acad. Sci. USA 2009, 106, 22114–22118. [Google Scholar] [CrossRef]
  15. Ge, J.; You, Q.; Zhang, Y. Effect of Tibetan Plateau Heating on Summer Extreme Precipitation in Eastern China. Atmos. Res. 2019, 218, 364–371. [Google Scholar] [CrossRef]
  16. Zhang, Y.; Ohata, T.; Kadota, T. Land-Surface Hydrological Processes in the Permafrost Region of the Eastern Tibetan Plateau. J. Hydrol. 2003, 283, 41–56. [Google Scholar] [CrossRef]
  17. Depietri, Y. The Social–Ecological Dimension of Vulnerability and Risk to Natural Hazards. Sustain. Sci. 2020, 15, 587–604. [Google Scholar] [CrossRef]
  18. Renn, O. Concepts of Risk: An Interdisciplinary Review Part 1: Disciplinary Risk Concepts. GAIA-Ecol. Perspect. Sci. Soc. 2008, 17, 50–66. [Google Scholar] [CrossRef]
  19. Peng, J.; Liu, Y.; Pan, Y.; Zhao, Z.; Song, Z.; Wang, Y. Study on the Correlation between Ecological Risk Due to Natural Disaster and Landscape Pattern-Process: Review and Prospect. Adv. Earth Sci. 2014, 29, 1186–1196. [Google Scholar]
  20. Lin, Y.; Hu, X.; Zheng, X.; Hou, X.; Zhang, Z.; Zhou, X.; Qiu, R.; Lin, J. Spatial Variations in the Relationships between Road Network and Landscape Ecological Risks in the Highest Forest Coverage Region of China. Ecol. Indic. 2019, 96, 392–403. [Google Scholar] [CrossRef]
  21. Levine, S.L.; Giddings, J.; Valenti, T.; Cobb, G.P.; Carley, D.S.; McConnell, L.L. Overcoming Challenges of Incorporating Higher Tier Data in Ecological Risk Assessments and Risk Management of Pesticides in the United States: Findings and Recommendations from the 2017 Workshop on Regulation and Innovation in Agriculture. Integr. Environ. Assess. Manag. 2019, 15, 714–725. [Google Scholar] [CrossRef]
  22. Peng, J.; Dang, W.; Liu, Y.; Zong, M.; Hu, X. Review on Landscape Ecological Risk Assessment. Dili Xuebao/Acta Geogr. Sin. 2015, 70, 664–677. [Google Scholar] [CrossRef]
  23. Yang, Y.; Chen, J.; Lan, Y.; Zhou, G.; You, H.; Han, X.; Wang, Y.; Shi, X. Landscape Pattern and Ecological Risk Assessment in Guangxi Based on Land Use Change. Int. J. Environ. Res. Public Health 2022, 19, 1595. [Google Scholar] [CrossRef]
  24. Jin, X.; Jin, Y.; Mao, X. Ecological Risk Assessment of Cities on the Tibetan Plateau Based on Land Use/Land Cover Changes–Case Study of Delingha City. Ecol. Indic. 2019, 101, 185–191. [Google Scholar] [CrossRef]
  25. Xie, H.; Wen, J.; Chen, Q.; Wu, Q. Evaluating the Landscape Ecological Risk Based on GIS: A Case-study in the Poyang Lake Region of China. Land Degrad. Dev. 2021, 32, 2762–2774. [Google Scholar] [CrossRef]
  26. Wang, B.; Ding, M.; Li, S.; Liu, L.; Ai, J. Assessment of Landscape Ecological Risk for a Cross-Border Basin: A Case Study of the Koshi River Basin, Central Himalayas. Ecol. Indic. 2020, 117, 106621. [Google Scholar] [CrossRef]
  27. Hou, M.; Ge, J.; Gao, J.; Meng, B.; Li, Y.; Yin, J.; Liu, J.; Feng, Q.; Liang, T. Ecological Risk Assessment and Impact Factor Analysis of Alpine Wetland Ecosystem Based on LUCC and Boosted Regression Tree on the Zoige Plateau, China. Remote Sens. 2020, 12, 368. [Google Scholar] [CrossRef]
  28. Fu, B. The Integrated Studies of Geography: Coupling of Patterns and Processes. Acta Geogr. Sin. 2014, 69, 1052–1059. [Google Scholar] [CrossRef]
  29. Leuven, R.S.E.W.; Poudevigne, I. Riverine Landscape Dynamics and Ecological Risk Assessment. Freshw. Biol. 2002, 47, 845–865. [Google Scholar] [CrossRef]
  30. Xue, L.; Zhu, B.; Wu, Y.; Wei, G.; Liao, S.; Yang, C.; Wang, J.; Zhang, H.; Ren, L.; Han, Q. Dynamic Projection of Ecological Risk in the Manas River Basin Based on Terrain Gradients. Sci. Total Environ. 2019, 653, 283–293. [Google Scholar] [CrossRef]
  31. Cui, L.; Zhao, Y.; Liu, J.; Han, L.; Ao, Y.; Yin, S. Landscape Ecological Risk Assessment in Qinling Mountain. Geol. J. 2018, 53, 342–351. [Google Scholar] [CrossRef]
  32. Yang, H.; Chen, W.; Chen, X. Regional Ecological Network Planning for Biodiversity Conservation: A Case Study of China’s Poyang Lake Eco-Economic Region. Pol. J. Environ. Stud. 2017, 26, 1825–1833. [Google Scholar] [CrossRef]
  33. Zhao, Z.; Wu, X.; Zhang, Y.; Gao, J. Assessment of Changes in the Value of Ecosystem Services in the Koshi River Basin, Central High Himalayas Based on Land Cover Changes and the CA-Markov Model. J. Resour. Ecol. 2017, 8, 67–76. [Google Scholar] [CrossRef]
  34. Wei, H.; Xu, L.; Li, X.; Li, J. Landscape Ecological Risk Assessment and Its Spatiotemporal Changes of the Boston Lake Basin. Environ. Sci. Technol. 2018, 41, 345–351. [Google Scholar] [CrossRef]
  35. Mikhailov, V.G.; Koryakov, A.G.; Mikhailov, G.S. Ecological Risk Management in Coal Mining and Processing. J. Min. Sci. 2015, 51, 930–936. [Google Scholar] [CrossRef]
  36. Chen, H.; Liu, J.; Cao, Y.; Li, S.; Ouyang, H. Ecological Risk Assessment of Regions Along the Roadside of the Qinghai-Tibet Highway and Railway Based on an Artificial Neural Network. Hum. Ecol. Risk Assess. Int. J. 2007, 13, 900–913. [Google Scholar] [CrossRef]
  37. Zhou, W.; Zeng, Y.; Chen, S.; Yan, Y. Ecological Risk Appraisal of Programming Infrastructure Construction in Tibet Plateau: A Case Study on Sannan Administrative Region. J. Nat. Disasters 2007, 16, 21–26. [Google Scholar]
  38. WANG, J.; BAI, W.; TIAN, G. Spatiotemporal Characteristics of Landscape Ecological Risks on the Tibetan Plateau. Resour. Sci. 2020, 42, 1739–1749. [Google Scholar] [CrossRef]
  39. Cao, Q.; Zhang, X.; Ma, H.; Wu, J. Review of Landscape Ecological Risk and an Assessment Framework Based on Ecological Services: ESRISK. Acta Geogr. Sin. 2018, 73, 843–855. [Google Scholar] [CrossRef]
  40. Li, W.; Wang, Y.; Xie, S.; Sun, R.; Cheng, X. Impacts of Landscape Multifunctionality Change on Landscape Ecological Risk in a Megacity, China: A Case Study of Beijing. Ecol. Indic. 2020, 117, 106681. [Google Scholar] [CrossRef]
  41. Ai, J.; Yu, K.; Zeng, Z.; Yang, L.; Liu, Y.; Liu, J. Assessing the Dynamic Landscape Ecological Risk and Its Driving Forces in an Island City Based on Optimal Spatial Scales: Haitan Island, China. Ecol. Indic. 2022, 137, 108771. [Google Scholar] [CrossRef]
  42. Li, L.; Zhou, X.; Yang, L.; Duan, J.; Zeng, Z. Spatio-Temporal Characteristics and Influencing Factors of Ecological Risk in China’s North–South Transition Zone. Sustainbility 2022, 14, 5464. [Google Scholar] [CrossRef]
  43. Mo, W.; Wang, Y.; Zhang, Y.; Zhuang, D. Impacts of Road Network Expansion on Landscape Ecological Risk in a Megacity, China: A Case Study of Beijing. Sci. Total Environ. 2017, 574, 1000–1011. [Google Scholar] [CrossRef]
  44. Zhao, Y.; Luo, L.; Wan, H.; Wu, Q.; Liu, C. Remote Sensing Monitoring and Analysis of Landscape Pattern in Bayanbulak Heritage Site for Nearly 30 Years. Natl. Remote Sens. Bull. 2021, 25, 2488–2506. [Google Scholar] [CrossRef]
  45. De’ath, G. Boosted Trees for Ecological Modeling and Prediction. Ecology 2007, 88, 243–251. [Google Scholar] [CrossRef]
  46. Main, A.R.; Michel, N.L.; Headley, J.V.; Peru, K.M.; Morrissey, C.A. Ecological and Landscape Drivers of Neonicotinoid Insecticide Detections and Concentrations in Canada’s Prairie Wetlands. Environ. Sci. Technol. 2015, 49, 8367–8376. [Google Scholar] [CrossRef]
  47. Zhang, W.; Du, Z.; Zhang, D.; Yu, S.; Hao, Y. Boosted Regression Tree Model-Based Assessment of the Impacts of Meteorological Drivers of Hand, Foot and Mouth Disease in Guangdong, China. Sci. Total Environ. 2016, 553, 366–371. [Google Scholar] [CrossRef]
  48. Solano-Villarreal, E.; Valdivia, W.; Pearcy, M.; Linard, C.; Pasapera-Gonzales, J.; Moreno-Gutierrez, D.; Lejeune, P.; Llanos-Cuentas, A.; Speybroeck, N.; Hayette, M.-P.; et al. Malaria Risk Assessment and Mapping Using Satellite Imagery and Boosted Regression Trees in the Peruvian Amazon. Sci. Rep. 2019, 9, 15173. [Google Scholar] [CrossRef]
  49. Li, C.; Liu, M.; Hu, Y.; Xu, Y.; Sun, F. Driving Forces Analysis of Urban Expansion Based on Boosted Regression Trees and Logistic Regression. Acta Ecol. Sin. 2014, 34, 727–737. [Google Scholar] [CrossRef]
  50. Ren, H.; Pan, X. Integration Dataset of Tibet Plateau Boundary; National Tibetan Plateau Data Center: Beijing, China, 2019. [Google Scholar]
  51. Zhang, Y.; Zheng, D.; Li, B. A Discussion on the Boundary and Area of the Tibetan Plateau in China. Geogr. Res. 2002, 21, 1–8. [Google Scholar]
  52. Yang, J.; Huang, X. The 30 m Annual Land Cover Dataset and Its Dynamics in China from 1990 to 2019. Earth Syst. Sci. Data 2021, 13, 3907–3925. [Google Scholar] [CrossRef]
  53. Wang, X.; Zhang, Y.; Wu, X.; Zheng, D.; Wang, Z.; Yan, J.; Liu, L.; Zhang, B.; Zhao, Z.; Bai, W.; et al. Spatial and Temporal Characteristics of Land Use and Cover Changes in the Tibetan Plateau. Chin. Sci. Bull. 2019, 64, 2865–2875. [Google Scholar] [CrossRef]
  54. Sun, Y.; Liu, S.; Liu, Y.; Dong, Y.; Li, M.; An, Y.; Shi, F. Grazing Intensity and Human Activity Intensity Data Sets on the Qinghai-Tibetan Plateau during 1990–2015. Geosci. Data J. 2022, 9, 140–153. [Google Scholar] [CrossRef]
  55. Zhang, X.; Shi, P.; Luo, J. Landscape Ecological Risk Assessment of the Shiyang River Basin. In Proceedings of the International Conference on Geo-Informatics in Resource Management and Sustainable Ecosystem (GRMSE 2013), Wuhan, China, 8–10 November 2013; Bian, F., Xie, Y., Cui, X., Zeng, Y., Eds.; Springer: Berlin/Heidelberg, Germany, 2013; pp. 98–106. [Google Scholar]
  56. Ju, H.; Niu, C.; Zhang, S.; Jiang, W.; Zhang, Z.; Zhang, X.; Yang, Z.; Cui, Y. Spatiotemporal Patterns and Modifiable Areal Unit Problems of the Landscape Ecological Risk in Coastal Areas: A Case Study of the Shandong Peninsula, China. J. Clean. Prod. 2021, 310, 127522. [Google Scholar] [CrossRef]
  57. Xie, H.; Wang, P.; Huang, H. Ecological Risk Assessment of Land Use Change in the Poyang Lake Eco-Economic Zone, China. Int. J. Environ. Res. Public Health 2013, 10, 328–346. [Google Scholar] [CrossRef]
  58. Zhang, W.; Chang, W.J.; Zhu, Z.C.; Hui, Z. Landscape Ecological Risk Assessment of Chinese Coastal Cities Based on Land Use Change. Appl. Geogr. 2020, 117, 102174. [Google Scholar] [CrossRef]
  59. Wang, H.; Liu, X.; Zhao, C.; Chang, Y.; Liu, Y.; Zang, F. Spatial-Temporal Pattern Analysis of Landscape Ecological Risk Assessment Based on Land Use/Land Cover Change in Baishuijiang National Nature Reserve in Gansu Province, China. Ecol. Indic. 2021, 124, 107454. [Google Scholar] [CrossRef]
  60. Jin, G.; Li, Z.; Deng, X.; Yang, J.; Chen, D.; Li, W. An Analysis of Spatiotemporal Patterns in Chinese Agricultural Productivity between 2004 and 2014. Ecol. Indic. 2019, 105, 591–600. [Google Scholar] [CrossRef]
  61. Gong, J.; Cao, E.; Xie, Y.; Xu, C.; Li, H.; Yan, L. Integrating Ecosystem Services and Landscape Ecological Risk into Adaptive Management: Insights from a Western Mountain-Basin Area, China. J. Environ. Manag. 2021, 281, 111817. [Google Scholar] [CrossRef]
  62. Dale, V.H.; Kline, K.L. Issues in Using Landscape Indicators to Assess Land Changes. Ecol. Indic. 2013, 28, 91–99. [Google Scholar] [CrossRef]
  63. Zhang, J.; Zhu, Y.; Fan, F. Mapping and Evaluation of Landscape Ecological Status Using Geographic Indices Extracted from Remote Sensing Imagery of the Pearl River Delta, China, between 1998 and 2008. Environ. Earth Sci. 2016, 75, 327. [Google Scholar] [CrossRef]
  64. Zhang, F.; Yushanjiang, A.; Wang, D. Ecological Risk Assessment Due to Land Use/Cover Changes (LUCC) in Jinghe County, Xinjiang, China from 1990 to 2014 Based on Landscape Patterns and Spatial Statistics. Environ. Earth Sci. 2018, 77, 491. [Google Scholar] [CrossRef]
  65. Jiang, W.; Yuan, L.; Wang, W.; Cao, R.; Zhang, Y.; Shen, W. Spatio-Temporal Analysis of Vegetation Variation in the Yellow River Basin. Ecol. Indic. 2015, 51, 117–126. [Google Scholar] [CrossRef]
  66. Yang, L.; Jia, K.; Liang, S.; Liu, M.; Wei, X.; Yao, Y.; Zhang, X.; Liu, D. Spatio-Temporal Analysis and Uncertainty of Fractional Vegetation Cover Change over Northern China during 2001–2012 Based on Multiple Vegetation Data Sets. Remote Sens. 2018, 10, 549. [Google Scholar] [CrossRef]
  67. Guo, D.; Song, X.; Hu, R.; Cai, S.; Zhu, X.; Hao, Y. Grassland Type-Dependent Spatiotemporal Characteristics of Productivity in Inner Mongolia and Its Response to Climate Factors. Sci. Total Environ. 2021, 775, 145644. [Google Scholar] [CrossRef]
  68. Sen, P.K. Estimates of the Regression Coefficient Based on Kendall’s Tau. J. Am. Stat. Assoc. 1968, 63, 1379–1389. [Google Scholar] [CrossRef]
  69. Kendall, M.G. Rank Correlation Methods; Griffin: London, UK, 1948. [Google Scholar]
  70. Mann, H.B. Nonparametric Tests Against Trend. Econometrica 1945, 13, 245. [Google Scholar] [CrossRef]
  71. Darand, M.; Dostkamyan, M.; Rehmani, M.I.A. Spatial Autocorrelation Analysis of Extreme Precipitation in Iran. Russ. Meteorol. Hydrol. 2017, 42, 415–424. [Google Scholar] [CrossRef]
  72. Overmars, K.P.; De Koning, G.H.J.; Veldkamp, A. Spatial Autocorrelation in Multi-Scale Land Use Models. Ecol. Modell. 2003, 164, 257–270. [Google Scholar] [CrossRef]
  73. Anselin, L. Local Indicators of Spatial Association—LISA. Geogr. Anal. 1995, 27, 93–115. [Google Scholar] [CrossRef]
  74. Liu, S.; Hou, X.; Yin, Y.; Cheng, F.; Zhang, Y.; Dong, S. Research Progress on Landscape Ecological Networks. Acta Ecol. Sin. 2017, 37, 3947–3956. [Google Scholar] [CrossRef]
  75. Lichstein, J.W.; Simons, T.R.; Shriner, S.A.; Franzreb, K.E. Spatial Autocorrelation and Autoregressive Models in Ecology. Ecol. Monogr. 2002, 72, 445–463. [Google Scholar] [CrossRef]
  76. Batlle, J.R.M.; Van Der Hoek, Y. Clusters of High Abundance of Plants Detected from Local Indicators of Spatial Association (LISA) in a Semi-Deciduous Tropical Forest. PLoS ONE 2018, 13, e0208780. [Google Scholar] [CrossRef]
  77. Elith, J.; Leathwick, J.R.; Hastie, T. A Working Guide to Boosted Regression Trees. J. Anim. Ecol. 2008, 77, 802–813. [Google Scholar] [CrossRef]
  78. Hu, Y.; Dai, Z.; Guldmann, J.M. Modeling the Impact of 2D/3D Urban Indicators on the Urban Heat Island over Different Seasons: A Boosted Regression Tree Approach. J. Environ. Manag. 2020, 266, 110424. [Google Scholar] [CrossRef]
  79. Zong, M.; Hu, Y.; Liu, M.; Li, C.; Wang, C.; Ping, X. Effects of Landscape Pattern Change on Water Yield and Nonpoint Source Pollution in the Hun-Taizi River Watershed, China. Int. J. Environ. Res. Public Health 2020, 17, 3060. [Google Scholar] [CrossRef]
  80. Vidal, L.; Antúnez, L.; Rodríguez-Haralambides, A.; Giménez, A.; Medina, K.; Boido, E.; Ares, G. Relationship between Astringency and Phenolic Composition of Commercial Uruguayan Tannat Wines: Application of Boosted Regression Trees. Food Res. Int. 2018, 112, 25–37. [Google Scholar] [CrossRef]
  81. Yang, R.; Zhang, G.; Liu, F.; Lu, Y.; Yang, F.; Yang, F.; Yang, M.; Zhao, Y.; Li, D.C. Comparison of Boosted Regression Tree and Random Forest Models for Mapping Topsoil Organic Carbon Concentration in an Alpine Ecosystem. Ecol. Indic. 2016, 60, 870–878. [Google Scholar] [CrossRef]
  82. Hashimoto, S.; Nanko, K.; Tupek, B.; Lehtonen, A. Data-Mining Analysis of the Global Distribution of Soil Carbon in Observational Databases and Earth System Models. Geosci. Model Dev. 2017, 10, 1321–1337. [Google Scholar] [CrossRef]
  83. Liang, S.; Chen, J.; Jin, X.; Wan, L.; Gong, B. Regularity of Vegetation Coverage Changes in the Tibetan Plateau over the Last 21 Years. Adv. Earth Sci. 2007, 22, 33–40. [Google Scholar]
  84. Zhang, L.; Zhang, H.; Xu, E. Information Entropy and Elasticity Analysis of the Land Use Structure Change Influencing Eco-Environmental Quality in Qinghai-Tibet Plateau from 1990 to 2015. Environ. Sci. Pollut. Res. 2022, 29, 18348–18364. [Google Scholar] [CrossRef]
  85. Huang, K.; Zhang, Y.; Zhu, J.; Liu, Y.; Zu, J.; Zhang, J. The Influences of Climate Change and Human Activities on Vegetation Dynamics in the Qinghai-Tibet Plateau. Remote Sens. 2016, 8, 876. [Google Scholar] [CrossRef]
  86. Diao, C.; Liu, Y.; Zhao, L.; Zhuo, G.; Zhang, Y. Regional-Scale Vegetation-Climate Interactions on the Qinghai-Tibet Plateau. Ecol. Inform. 2021, 65, 101413. [Google Scholar] [CrossRef]
  87. Sun, Y.; Liu, S.; Shi, F.; An, Y.; Li, M.; Liu, Y. Spatio-Temporal Variations and Coupling of Human Activity Intensity and Ecosystem Services Based on the Four-Quadrant Model on the Qinghai-Tibet Plateau. Sci. Total Environ. 2020, 743, 140721. [Google Scholar] [CrossRef]
  88. Qiu, P.; Wu, N.; Luo, P.; Wang, Z.; Li, M. Analysis of Dynamics and Driving Factors of Wetland Landscape in Zoige, Eastern Qinghai-Tibetan Plateau. J. Mt. Sci. 2009, 6, 42–55. [Google Scholar] [CrossRef]
  89. Dong, S.; Shang, Z.; Gao, J.; Boone, R.B. Enhancing Sustainability of Grassland Ecosystems through Ecological Restoration and Grazing Management in an Era of Climate Change on Qinghai-Tibetan Plateau. Agric. Ecosyst. Environ. 2020, 287, 106684. [Google Scholar] [CrossRef]
  90. Lu, X.; Kelsey, K.C.; Yan, Y.; Sun, J.; Wang, X.; Cheng, G.; Neff, J.C. Effects of Grazing on Ecosystem Structure and Function of Alpine Grasslands in Qinghai-Tibetan Plateau: A Synthesis. Ecosphere 2017, 8, e01656. [Google Scholar] [CrossRef]
  91. Liu, Y.; Liu, S.; Wang, F.; Sun, Y.; Li, M.; Wang, Q.; Yu, L. Responses of Habitat Quality and Animal Biodiversity to Grazing Activities on the Qinghai-Tibet Plateau. Front. Ecol. Evol. 2021, 9, 681775. [Google Scholar] [CrossRef]
  92. Cao, Q.; Zhang, X.; Lei, D.; Guo, L.; Sun, X.; Kong, F.; Wu, J. Multi-Scenario Simulation of Landscape Ecological Risk Probability to Facilitate Different Decision-Making Preferences. J. Clean. Prod. 2019, 227, 325–335. [Google Scholar] [CrossRef]
  93. Munns, W.R.; Rea, A.W.; Suter, G.W.; Martin, L.; Blake-Hedges, L.; Crk, T.; Davis, C.; Ferreira, G.; Jordan, S.; Mahoney, M.; et al. Ecosystem Services as Assessment Endpoints for Ecological Risk Assessment. Integr. Environ. Assess. Manag. 2016, 12, 522–528. [Google Scholar] [CrossRef] [PubMed]
Figure 1. Location of the Qinghai–Tibetan Plateau.
Remotesensing 14 04726 g001
Figure 2. Framework of this research.
Remotesensing 14 04726 g002
Figure 3. Nine impact factors of landscape ecological risk (LER): (a) elevation; (b) slope; (c) annual precipitation in 2015; (d) average annual temperature in 2015; (e) distance from residential areas in 2015; (f) distance from roads in 2015; (g) population in 2015; (h) gross domestic product (GDP) in 2015; (i) grazing intensity in 2015.
Remotesensing 14 04726 g003
Figure 4. Land-use/land cover (LULC) changes of the Qinghai–Tibetan Plateau in (a) 1990 and (b) 2020.
Remotesensing 14 04726 g004
Figure 5. Percentages of land-use/land cover (LULC) types across the Qinghai–Tibetan Plateau from 1990 to 2020.
Remotesensing 14 04726 g005
Figure 6. Landscape ecological risk (LER) of the Qinghai–Tibetan Plateau from (a) 1990 to 2005 and (b) 2006 to 2020.
Remotesensing 14 04726 g006aRemotesensing 14 04726 g006b
Figure 7. Proportions of landscape ecological risk (LER) levels of the Qinghai–Tibetan Plateau.
Remotesensing 14 04726 g007
Figure 8. Average landscape ecological risk index (LERI) from 1990 to 2020.
Remotesensing 14 04726 g008
Figure 9. Landscape ecological risk (LER) trends (a) from 1990 to 2020, (b) from 1990 to 2001, (c) from 2002 to 2011, (d) from 2012 to 2020.
Remotesensing 14 04726 g009
Figure 10. Global Moran’s I figures for 1990, 2000, 2010, and 2020.
Remotesensing 14 04726 g010
Figure 11. LISA maps of landscape ecological risk (LER) for (a) 1990, (b) 2000, (c) 2010, and (d) 2020.
Remotesensing 14 04726 g011
Figure 12. Relative importance of the nine factors to the landscape ecological risk in the boosted regression tree (BRT) model.
Remotesensing 14 04726 g012
Figure 13. Impact of the nine factors on the landscape ecological risk (LER) of the Qinghai–Tibetan Plateau.
Remotesensing 14 04726 g013
Figure 14. Precipitation and average temperature from 1990 to 2020.
Remotesensing 14 04726 g014
Table 1. Connotations of different local Moran’s I (LISA) types of the landscape ecological risk (LER) [61,62].
Clustering TypesConnotation
High–high (HH)The area and its neighbors both have high LER
High–low (HL)The area has a high LER, whereas its neighbors have low LER
Low–high (LH)The area has a low LER, whereas its neighbors have high LER
Low–low (LL)The area and its neighbors both have low LER
Not significantNo significant correlations
Table 2. Landscape ecological risk level transformation matrix from 1990 to 2020.
LERArea of Land in 2020 (in km2)
Extremely LowLowMediumHighExtremely HighTotal in 1990
Area of land in 1990 (in km2)Extremely low248,426.641270.240.000.000.00249,696.88
Low37,538.45723,854.076806.190.000.00768,198.71
Medium0.00161,070.77572,295.608530.820.00741,897.18
High0.0043.9591,139.52179,409.834974.98275,568.28
Extremely high0.000.00258.3877,347.76465,568.68543,174.82
Total in 2020285,965.09886,239.02670,499.69265,288.51470,543.662,578,535.87
Publisher’s Note: MDPI stays neutral with regard to jurisdictional claims in published maps and institutional affiliations.

