Abstract
The governance of rural living environments is one of the important tasks in the implementation of a rural revitalization strategy. At present, the illegal behaviors of random construction and random storage in public spaces have seriously affected the effectiveness of the governance of rural living environments. The current supervision on such problems mainly relies on manual inspection. Due to the large number and wide distribution of rural areas to be inspected, this method is limited by obvious disadvantages, such as low detection efficiency, long-time spending, and huge consumption of human resources, so it is difficult to meet the requirements of efficient and accurate inspection. In response to the difficulties encountered, a low-altitude remote sensing inspection method on rural living environments was proposed based on a modified YOLOv5s-ViT (YOLOv5s-Vision Transformer) in this paper. First, the BottleNeck structure was modified to enhance the multi-scale feature capture capability of the model. Then, the SimAM attention mechanism module was embedded to intensify the model’s attention to key features without increasing the number of parameters. Finally, the Vision Transformer component was incorporated to improve the model’s ability to perceive global features in the image. The testing results of the established model showed that, compared with the original YOLOv5 network, the Precision, Recall, and mAP of the modified YOLOv5s-ViT model improved by 2.2%, 11.5%, and 6.5%, respectively; the total number of parameters was reduced by 68.4%; and the computation volume was reduced by 83.3%. Relative to other mainstream detection models, YOLOv5s-ViT achieved a good balance between detection performance and model complexity. This study provides new ideas for improving the digital capability of the governance of rural living environments.
1. Introduction
According to the data from the seventh China census, the rural permanent population in China reached 510 million, accounting for 36.11% of the total population, which was distributed among 691,500 administrative villages [1]. Therefore, improving the living environment in rural areas and building beautiful and livable villages have become important tasks for the promotion of comprehensive rural revitalization. In 2018, the Chinese government implemented a three-year campaign with the goal of improving rural living environments. To date, the quality of rural living environments has been effectively improved, but there are still illegal behaviors of random construction and random storage in some rural public areas, such as simple houses built without authorization, building materials or sundries stacked at authorized sites, and so on. These problems not only encroach on public space resources, but also have a negative impact on the appearance of the living environment and even involve potential safety hazards. The traditional supervision methods of random construction and random storage are mainly based on manual on-site inspections. The collected images and sites are reported to the relevant supervision departments for rectification. However, due to the large number and wide distribution of rural areas in China, the supervision method based on manual inspection is limited by obvious disadvantages, including heavy workload, long time consumption, and low efficiency, and it is difficult to meet the requirements of digital and intelligent inspection of rural living environments.
In recent years, unmanned aerial vehicle (UAV) low-altitude remote sensing technology has developed rapidly [2,3]. Compared with satellite remote sensing, UAV low-altitude remote sensing is characterized by high cost-effectiveness, strong maneuverability, and high ground resolution; and UAVs are able to continuously obtain large-scale ground information in a short period of time. UAV low-altitude remote sensing has now become an important means of data collection, and has been widely used in traffic monitoring [4,5], environmental pollutant monitoring [6,7], high-voltage transmission line inspection [8,9], collapsed building detection [10,11], illegal building detection, etc. On the other hand, the rapid development of deep learning technology has injected fresh blood into image target detection and has achieved significant breakthroughs, bringing image target detection to an unprecedented research hotspot [12,13,14]. It is expected that image target detection technology will replace manual analysis of low-altitude remote sensing images in the near future. Therefore, the combination of “UAV low-altitude remote sensing + image target detection” is becoming a new paradigm for solving the problem of large-scale target inspections.
Jiao et al. [15] proposed a YOLOv3-based algorithm for detecting forest fires from UAV aerial images, which achieved a recognition rate of about 83% with a detection frame rate over 3.2 FPS (frames per second). Ammour et al. [16] proposed a method to automatically solve the problem of vehicle detection and counting in UAV images by using a deep convolutional neural network (CNN) system as the feature extraction tool, combined with a support vector machine (SVM) classifier. In the inspection of high-voltage transmission lines, Li et al. [17] trained a Faster R-CNN model with images collected by UAV to automatically identify bird nests on transmission line towers. The test results showed that this method could effectively detect bird nests in complex environments with the highest Recall of 95.38%. In terms of collapsed building detection, Ma et al. [18] proposed a method for detecting damaged buildings from UAV remote sensing images based on YOLOv3. The detection accuracy of the algorithm is about 90.89%, and the detection speed reaches 23.23 FPS. In the field of urban illegal building detection, Yu et al. [19] proposed an illegal building detection model based on the YOLOv5 network, aiming to solve for the problem of illegal buildings in remote sensing images being mostly small targets and showing occlusion, resulting in slow detection speed and a high false detection rate. The test results show that the improved algorithm greatly improved the speed of detecting illegal buildings and improved detection accuracy. Jiang et al. [20] used the change detection method to detect illegal buildings, and proposed the Pyramid Feature-Based Attention-Guided Siamese Network (PGA Siamnet) network model. The results show that this network model can effectively detect building changes. In terms of the inspection of illegal buildings in rural areas, Peng et al. [21] proposed a two-level rotating target detection network (TRDet) based on a deep feature fusion network and a pixel attention module. The results showed that the TRDet network better detected small rural buildings and dense rural buildings compared to traditional methods.
The research outcomes above have fully demonstrated the potential and effectiveness of the “UAV low-altitude remote sensing + image target detection” paradigm. On the one hand, UAV low-altitude remote sensing has the advantages of high flexibility and strong maneuverability, able to quickly cover the inspection area to collect a large number of high-resolution target images. On the other hand, by training the target detection model, it is possible to automatically determine whether a specific target is contained in a large number of images collected by the UAV.
As far as we know, the current inspections against behaviors like random construction and random storage in rural public areas are still based on manual operations in China. There is a lack of automatic and intelligent inspection methods. In view of the current situation, this paper proposed a low-altitude remote sensing inspection method on rural living environments based on a modified YOLOv5s. By utilizing the “UAV low-altitude remote sensing + image target detection” paradigm, this method could successfully realize the automatic and intelligent inspection of random construction and random storage behaviors in rural public areas. The main contributions of this paper are as follows:
- (1)
- A rural living environment inspection dataset was established based on images collected by UAV, which contained two categories of labeled samples, i.e., random construction samples and random storage samples. The dataset was used to train and evaluate the target detection model.
- (2)
- The SimAM attention mechanism was embedded into YOLOv5s to improve the model’s ability to capture distinguishable features of the target. Thereby, target detection accuracy was improved.
- (3)
- The Vision Transformer structure was incorporated to recognize the two categories of samples mentioned above. The Vision Transformer component allowed the model to pay attention to the contextual global features of the target, complementing the CNN model that mainly focused on local features.
2. Materials and Methods
2.1. Data Collection
All the images were captured by a UAV equipped with a single-lens reflex camera. Considering the existence of interfering objects, such as high-voltage electrical towers and birds at low altitudes, the flying height was set between 120 m and 150 m. The established dataset contained the rural image data of North China captured during 2020–2021 by a fixed-wing UAV (wingspan, 2.4 m), which was equipped with a Sony A7RIV camera. The camera parameters are shown in Table 1. Samples of the original images are shown in Figure 1.

Table 1.
Parameters of Sony A7RIV SLR camera.
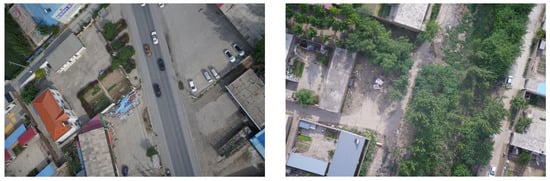
Figure 1.
Low-altitude remote sensing images of rural areas captured by UAV.
2.2. Data Processing
2.2.1. Data Preprocessing
The flying route of the UAV was set in advance, and automatic cruise mode was adopted for the process of image collection. To ensure full coverage of the monitored area, the images were captured with a certain degree of overlap (both heading overlap and bypass overlap). The size of the original low-altitude image captured by UAV was about 45 MB, with a resolution of 9504 × 6336 pixels. A total of 811 raw images containing one or more targets were manually screened. Statistical analysis indicated that the size of the target was around 7% of the entire image size. If the bilinear interpolation method is directly used to resize the image and input it into the model, the target in the image will be deformed to a certain extent, and some features will be lost, which will have a negative impact on detection accuracy. In order to avoid this problem, the original images were manually segmented using Photoshop. To ensure the completeness of the target after image segmentation, the size of each segmented image was set to 1024 × 1024 pixels. Eventually, 1018 images were obtained. All the images after segmentation were labeled using a labeling tool to generate a corresponding xml file. The xml file contained the category information of each image and the location information (xmin, ymin, xmax, and ymax) of the target rectangle relative to the upper left corner of the image. The data labeling process is illustrated in Figure 2.
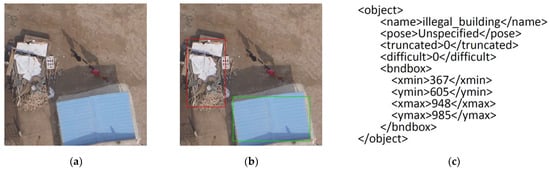
Figure 2.
Data labeling process. (a) Image after segmentation; (b) Image labeling; (c) Label information.
2.2.2. Data Enhancement
In this paper, the dataset was further enhanced by the following methods in order to enrich the diversity of the original dataset, fully simulate different lighting conditions, and adapt to the amount of data required to train the model: (1) random rotation and random brightness adjustment: the image was randomly rotated between (−90°, 90°) and was randomly adjusted for brightness between (1, 1.3); (2) random color adjustment: the image was randomly adjusted for color between (1, 1.3); (3) random contrast adjustment: the image was randomly adjusted for contrast between (1, 1.3). This process could enrich the diversity of the image data to a certain extent, which was helpful for improving the generalization ability and feature extraction ability of the model in order to improve its final detection accuracy.
3. Model Improvement
3.1. Basic YOLOv5 Network
The YOLOv5 network is the latest generation of the YOLO target detection algorithm series. Compared with YOLOv3 and YOLOv4, YOLOv5 has higher detection precision and speed. The YOLOv5 series consists of 5 different network structures: YOLOv5n, YOLOv5s, YOLOv5m, YOLOv5l, and YOLOv5x, and the main difference between them lies in the number of feature extraction modules and convolution kernels at specific locations of the network. The basic YOLOv5 network is shown in Figure 3.
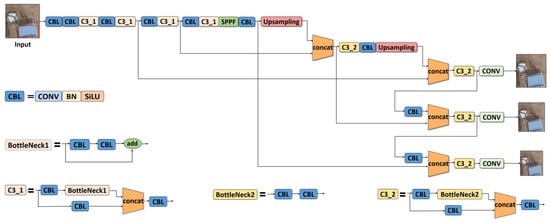
Figure 3.
Diagram of YOLOv5 network structure.
The YOLOv5 network structure is mainly composed of three elements, namely the BackBone network, the BottleNeck network, and the Detection network. The BackBone network is essentially a CNN, which is mainly used to extract image features. It is formed by the basic CBL modules and C3 modules in an alternant manner. More specifically, the CBL module consists of the convolution layer, the BN layer, and the SiLU activation function (see Figure 4 for the structure of the CBL module). The convolution layer is also the most fundamental element of all modules.
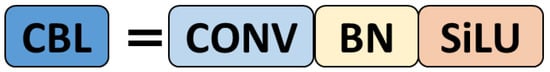
Figure 4.
CBL module.
The C3 module is mainly constituted by the BottleNeck1 component, which is essentially a residual structure. One branch of C3 is formed by the CBL layer and the BottleNeck1 layer, and the other branch is formed only by the CBL layer. The final output is the superposition of the two branches, as shown in Figure 5a. BottleNeck1 connects two CBL layers and the residual line together, and its final output is the addition of the output of this part and the initial input passing through the residual structure. The BottleNeck1 module is shown in Figure 5b.
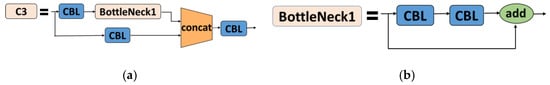
Figure 5.
C3 module and BottleNeck1 module. (a) C3 module; (b) BottleNeck1 module.
The BottleNeck network consists of two parts: SPPF (Spatial Pyramid Pooling—Fast) and the feature pyramid. The SPPF module aims to convert a feature map of any size into a feature vector of a fixed size. It connects 4 MaxPool layers in serial and superimposes their outputs to resample the feature map output by the Backbone network. Its ultimate goal is to improve the receptive field of the network. The feature pyramid fuses the feature maps extracted by the BackBone network in order to further combine with the contextual information to reduce feature loss (see Figure 6a for the structure of the SPPF module). Generally, in the detection network, the deep feature map carries stronger semantic features and weaker positioning information. The shallow feature map carries strong location information and weak semantic features. The FPN (Feature Pyramid Network) transfers deep semantic features to the shallow layer in order to enhance semantic expression on multiple scales. On the contrary, the PAN (Path Aggregation Network) transmits the positioning information from the shallow layer to the deep layer and enhances the positioning ability on multiple scales. FPN+PAN are fused together to enhance the transfer of contextual features in images in different layers of the network. The model generates feature maps with three sizes of 80 × 80, 40 × 40, and 20 × 20, which are used for model prediction and to improve the detection ability of targets of different scales. The FPN+PAN feature pyramid structure is shown in Figure 6b.
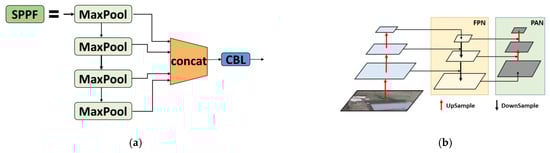
Figure 6.
SPPF module and FPN+PAN module. (a) SPPF module; (b) FPN+PAN module.
In this study, two categories of targets, namely random construction targets and random storage targets, needed to be detected in rural public spaces, which led to stringent requirements on the timeliness and precision of detection. Therefore, while ensuring high accuracy, it was also necessary to reduce the complexity of the model in order to improve the detection speed. The 5072 enhanced images were divided into a training set, a validation set, and a test set. The training set contained 4107 images, the validation set contained 458 images, and the test set contained 507 images. From the results (as shown in Table 2), it can be seen that the detection precision of the YOLOv5s model was 91.2%, and its number of parameters and computation volume were 7025023 and 15.9 GFLOPs, respectively. Except for the Precision, YOLOv5s outperformed YOLOv5n in terms of all other performance indicators. Compared with the rest of the models (YOLOv5m, YOLOv5l, and YOLOv5x), YOLOv5s had obvious advantages in model complexity. Because YOLOv5s was of the smallest depth and the smallest feature map width in the YOLOv5 series, it was chosen as the basic model for further modification under the goal of improving detection precision and other indicators while keeping the model lightweight.
Table 2.
Comparison of different YOLOv5 models.
3.2. Modification of YOLOv5s
To take into account the accuracy and computational complexity of model detection, we optimized and improved the original network structure of YOLOv5s, and named the optimized network YOLOv5s-ViT. The improvement in the network structure is mainly divided into three aspects. First, the multi-scale feature extraction structure was added; second, the attention mechanism module was embedded; third, the Vision Transformer module was integrated. The network structure of YOLOv5s-ViT based on the improvement of YOLOv5s is shown in Figure 7.
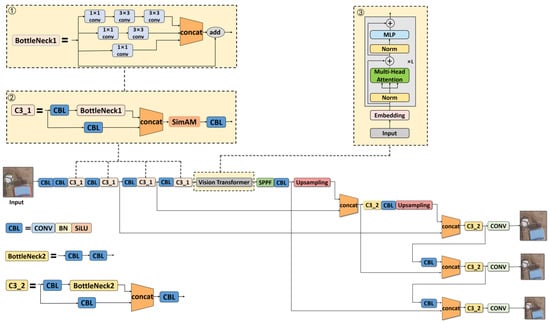
Figure 7.
The YOLOv5s-ViT structure. ① Multiscale Feature Extraction module; ② SimAM attention mechanism embedded in C3_1 module; ③ Vision Transformer module.
3.2.1. Multi-Scale Feature Detection
In an actual scenario, the targets of random construction and random storage in public rural spaces were of varying shapes and sizes. Additionally, during the image acquisition process, the flying height of the UAV might change within a certain range. For these two reasons, the targets in the images might have multi-scale sizes. Therefore, in the detection task, the multi-scale feature extraction ability was one of the challenges the model needed to overcome. The BackBone network of the original YOLOv5s model consists of 4 BottleNeck structures, and each BottleNeck structure consists of 2 convolutional layers and 1 residual structure. Using two identical convolutional layers consecutively may help extract image features more thoroughly. However, after extracting features with two identical convolutional layers, the receptive fields corresponding to the obtained feature maps are the same, but when extracting targets of different sizes, different receptive fields are required. Therefore, using identical convolutional layers for feature extraction will lead to loss of some features. In order to optimize the model’s ability to extract multi-scale features, the BottleNeck1 structure was further modified in this paper. Specifically, the original two serial convolutional layers were replaced by a multi-scale feature extraction structure composed of three branches, while the original residual structure was retained. The modified BottleNeck1 structure is shown in Figure 8.
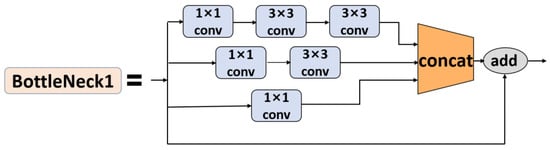
Figure 8.
Modified BottleNeck structure.
3.2.2. SimAM Attention Mechanism
Unlike the images captured on the ground, in the low-altitude images collected by UAV, all the targets to be detected had only one viewing angle, which was the top view. The visual representation of the target in the image was mainly concentrated on the top side, so the features with high distinguishability were not prominent. This required the model to focus more attention on key regions with high distinguishability in the image, but ignore non-critical parts. Therefore, improving the model’s ability to focus on key regions with high distinguishability was another important challenge to be overcome in this paper. The existing studies have shown that the attention mechanism can help a model focus on important features in the image and reduce attention to other information. Thus, selecting a suitable attention mechanism is the key to improving the fine-grained feature-capturing ability of the model. However, existing attention modules have two main problems in general. First, they can only refine features along the channel or the spatial dimension, which limits their flexibility in learning attention weights that vary with the channel or space. Second, their structure needs to be constructed by a complex set of factors, such as the choice of pooling. To solve these problems, the lightweight SimAM attention mechanism was selected in this paper. Inspired by the attention mechanism of the human brain, SimAM calculates the weights through an energy function. It can infer the 3D attention weight for the feature map in the layer without adding parameters to the original network. The 3D attention weights are shown in Figure 9. Owing to the advantages of high flexibility, high modularity, and being lightweight, the SimAM attention mechanism met the requirements of model improvement.
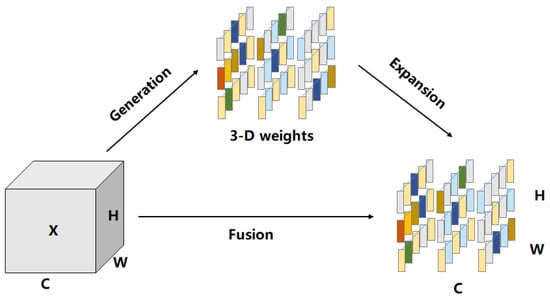
Figure 9.
The 3D attention weight map.
3.2.3. Vision Transformer Integration
The targets of random construction and random storage to be detected in this paper were confined to those located in rural public spaces, including streets, rural community squares, etc. In this regard, there might be confusion in detection. For example, a simple house might be categorized as illegal random construction if located next to the street, but if located in a private space (private courtyard), it was no longer in this category. In addition to the visual characteristics of the target itself, another important feature is whether the location of the target belongs to a public space. Therefore, the model was required not only to pay attention to the local detailed features of the target, but also to capture its global features. The CNN network can be used to extract local features from the target, while the Vision Transformer can be used to realize the learning of global features. Thus, by integrating the two modules together, the model established in this paper was able to focus on both the local distinguishable features of the target and the contextual features of the image in order to fuse global and local features to achieve accurate detection of the target. The component structure of the Vision Transformer is shown in Figure 10. The embedding layer divides the feature map into sub-blocks and adds position coding, and then inputs them into the encoder to extract global features with the help of a multi-head self-attention mechanism. The original YOLOv5s BackBone network consists of convolutional layers. This structure has a strong ability to learn local features of the target, but a weaker ability to learn global features. Global features are needed in this task to help the model distinguish whether objects are located in common areas. Therefore, we embedded the Vision Transformer into the last C3 module (i.e., the C3_1 module) of the BackBone network to extract global features. The experimental results show that the Vision Transformer module made the model realize the fusion of local features and global features, which improved the accuracy of model detection.
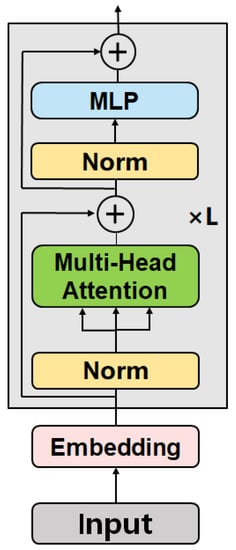
Figure 10.
Vision Transformer module structure.
3.2.4. The K-Means++ Custom Anchor Box
The original YOLOv5s algorithm uses the k-means clustering algorithm to cluster the bounding boxes in the dataset in order to obtain the appropriate anchor box size. However, the k-means algorithm randomly initializes the cluster centers, which are prone to the situation of local optimum, leading to the failure of obtaining the global optimum solution. In contrast, the k-means++ algorithm only randomly generates the first cluster center, while the subsequent cluster centers are generated on the basis of the existing centers through the roulette algorithm. The non-random generation of cluster centers solves the problem of the k-means algorithm in obtaining the global optimal solution to a certain extent. Additionally, the initial input image size of YOLOv5s is 640 × 640 pixels and there are 80 categories, but the input image size in this paper was 1024 × 1024 pixels with only 2 categories. Therefore, in order to avoid detection errors and improve detection precision in the foreground, the initial anchor box size of the original YOLOv5s network was modified after analyzing the image size and target size. Eventually, an anchor box size suitable for the dataset used in this study was regenerated by applying the k-means++ clustering algorithm. Specifically, the number of clusters was set to 9, and the epoch was set to 100. The size of the detection box generated by the k-means++ algorithm is shown in Table 3.
Table 3.
Prior anchor box size.
4. Experiment and Analysis
4.1. Experiment Dataset
The enhanced dataset contained a total of 5072 images, which were divided into the training set and test set according to the ratio of 9:1. Then, the training set was further divided into the training set and validation set, also according to the ratio of 9:1. Eventually, there were 4107 images in the training set, 507 images in the test set, and 458 images in the validation set. The file organization of the dataset follows the specifications of PASCAL VOC2007.
4.2. Model Training
The hardware configuration for model training and testing was as follows: Intel® Core (TM) i9-10920X CPU @ 3.00 GHz; 24 G memory; NVIDIA GeForce RTX 3090 graphics card; 64-bit Ubuntu 20.04 LTS operation system; CUDA version 11.4; Pytorch version 1.8.0; Python version 3.8.0.
In the training task, the Learning rate was set to 0.01; the optimizer was SGD; the Momentum was 0.937; the Weight decay was 0.0005; the batch_size was set to 16; the epoch was set to 300; and the number of layers of the Vision Transformer encoder was set to 6.
4.3. Evaluation Indicators
The YOLOv5 model judges the prediction results by setting a confidence threshold for the target region. In the experiment, the confidence threshold was set to 0.45; that is, prediction results higher than 0.45 were judged as correct. There would be an error between the actually labeled box and the predicted box. The smaller this error, the more precise the detection result is. The intersection-over-union (IoU) is a key parameter to measure the detection precision of the model, which can be calculated by Equation (1) below. In this experiment, the IoU was set to 0.45.
where DR refers to the target detected by the model and GT refers to the true annotated target.
The evaluation indicators, including Precision, Recall, F1 Harmonic Mean, and mean Average Precision (mAP), were used to evaluate the detection effect of the model. The Recall was used to describe the number of samples detected in the prediction result, which can be calculated by Equation (2).
The Precision was used to describe the proportion of samples labeled positive in all the samples predicted as positive, which can be calculated by Equation (3).
F1 refers to the harmonic mean of precision and recall, which can be calculated by Equation (4); mAP is the mean Average Precision, which is the main evaluation index for target detection and measures the overall performance of the network. The formula is shown in Equation (5).
where n refers to the detection category. In this paper, there were two categories of detection targets: random construction targets and random storage targets. AP stands for average precision, and the calculation formula is shown in formula (6).
4.4. Experiment Results and Analysis
4.4.1. Comparison of Different Detection Algorithms
We compared the improved YOLOv5s-ViT network model with the current mainstream YOLOv5s, YOLOv3, YOLOv4, Faster R-CNN, and YOLOv5x models, and the results are shown in Table 4. In terms of model detection speed, the YOLOv5s-ViT network model reached 30.1 FPS. Compared with the YOLOv5x network model with the best detection accuracy, the detection speed of this model improved by about 84.7%. Compared with the original YOLOv5s model, the detection speed of the YOLOv5s-ViT network model was only reduced by 34.6%, but the Precision of the YOLOv5s-ViT network model increased by about 2.2%, and the Recall increased by about 11.5%. Compared with the YOLOv5_Building [19] model in related fields, YOLOv5s-ViT still has a certain gap in detection speed, but it has great advantages in indicators such as Precision, Recall, and mAP. Experiments show that YOLOv5s-ViT meets the task requirements of village appearance detection.
Table 4.
Comparison of different target detection models.
In terms of detection performance and model complexity compared with the original YOLOv5s network, the Recall, Precision, and mAP of YOLOv5s-ViT improved by 11.5%, 2.2%, and 6.5%, respectively. Compared with the original YOLOv5x network, YOLOv5s-ViT is still somewhat lacking in Precision, but the Recall is 1.3% higher than that of YOLOv5x, and both the number of parameters and computation volume were significantly reduced (the number of parameters was 1/3 of YOLOv5x; the computation volume was about 1/6 of YOLOv5x). From the comparison data, YOLOv5s-ViT had improved detection precision and a greatly reduced number of parameters compared to YOLOv5x. In comparison with the best two-stage detection model at present, i.e., the Faster R-CNN network, the Precision of YOLOv5s-ViT improved by 26.9%, while the number of parameters was reduced by 80% and the computation volume was reduced by 91.7%. Compared with YOLOv5_Building, the model proposed in this paper has great advantages in all detection indicators except for computational complexity.
In order to further analyze the robustness of different models, the detection results diagrams of different targets were selected for comparative analysis, as shown in Table 5.
Table 5.
Detection results.
From the comparison of different detection algorithms, it can be found that YOLOv5s-ViT, Faster R-CNN, and YOLOv5s successfully detected all the random storage targets, but Faster R-CNN and YOLOv5s had a low confidence. YOLOv3 and YOLOv4 had missed detections on the random storage targets, which is mainly because the missed detections had similar colors to the land. YOLOv5_Building [19] missed all targets; one of the possible reasons for this is that the target color is similar to the background color, so the model does not detect the target; the other reason is that the YOLOv5_Building model deletes the smallest feature layer in the feature extraction BackBone network (32 × 32 feature layer), causing the model to miss detection when detecting large targets. In the detection of random construction targets, YOLOv5s-ViT, Faster R-CNN, YOLOv5s, and YOLOv4 successfully detected all the targets, but the confidence of YOLOv5s and YOLOv4 was low. Faster R-CNN had false detections, in which parts of the random construction targets were detected as random storage targets. YOLOv3 failed to detect any target. The detection algorithms in the control group had different detection abilities for different targets. In general, the confidence of YOLOv3, YOLOv4, and Faster R-CNN was relatively low in the detection task.
4.4.2. Ablation Experiment
In order to further validate the effectiveness of the modified part of the YOLOv5s-ViT model, an ablation experiment was carried out in this paper. The settings were as follows: scheme 0—the original YOLOv5s; scheme 1—the preset anchor box size of the original YOLOv5 was reconstructed by the k-means++ algorithm; scheme 2—on the basis of scheme 1, the multi-scale feature extraction module was added; scheme 3—on the basis of scheme 2, the SimAM attention mechanism was added; scheme 4—on the basis of scheme 3, the Vision Transformer module was added. Scheme 4 is the final model established in this paper for the detection of random construction and random storage targets.
The methods used in the different schemes are listed in Table 6, and the results are shown in Table 7.
Table 6.
Scheme design.
Table 7.
Model comparison in the ablation experiment.
It can be seen from the data in Table 7 that the reconstruction of the preset anchor box, the multi-scale feature extraction model, the SimAM attention mechanism, and the Vision Transformer module could all improve the detection precision of the model. Since the size of the input image was 1024 × 1024 pixels, the initial anchor box after reconstruction became more adaptable to the dataset used in this study. In the end, the Precision, Recall, and mAP of the model increased by 2.9%, 6.0%, and 3.3%, respectively. Therefore, the matching degree of the initial anchor box with the dataset has a certain impact on the detection effect of the model. Because the multi-scale feature extraction module improved the model’s ability to capture target features of different sizes, the mAP of the model improved by 1.1%. Because the SimAM attention mechanism improved the model’s ability to focus on key target features with high distinguishability without increasing the number of total parameters, the Recall and mAP improved to a certain extent. The Vision Transformer component mainly focuses on the global features of the image, while the CNN mainly focuses on the local features of the image. Thus, the fusion of the Vision Transformer and CNN improved the model’s ability to detect different targets in the scene. Eventually, the detection Precision, Recall, and mAP of the final model improved by 0.2%, 3.9%, and 1.8%, respectively. The experiment results were basically consistent with expectations, proving that the modification strategy is effective.
5. Conclusions
In the promotion of the rural revitalization strategy in China, the phenomenon of illegal random construction and random storage has become one of the key problems to be solved in the governance of rural living environments. Aiming at the shortcomings of low efficiency and low intelligence of the current inspection system, this paper proposed a low-altitude remote sensing inspection method for rural living environments based on the modified YOLOv5s-ViT network. This method was developed on the basis of YOLOv5s by addressing three issues: (1) the targets to be detected were of multiple scales; (2) all the images were captured from the same visual angle, so there were limited features with high distinguishability; and (3) both the global features and local features needed to be taken into account. First, the multi-scale feature learning ability of the model was improved by adjusting the BottleNeck1 structure. Second, the model’s ability to focus on key features was improved by embedding the SimAM attention mechanism. Finally, the Vision Transformer module was integrated with the YOLOv5s BackBone network, which improved the model’s ability to focus on global features. The experiment results showed that the Precision, Recall, and mAP of the YOLOv5s-ViT network improved by 2.2%, 11.5%, and 6.5%, respectively, compared with the original YOLOv5s network. Compared with the original YOLOv5x network, the Recall of YOLOv5s-ViT improved by 1.3%, while the total number of parameters and computation volume were reduced by 68.4% and 83.3%, respectively.
While the YOLOv5s-ViT network can meet the requirements of automatic inspection of rural living environments by balancing detection performance with model complexity, it still has the following shortcomings in actual practice. First, when the target is located in shadow or when there are other objects over the target, the model is prone to false detection or missed detection. Second, for the purpose of detecting random construction and random storage targets in public spaces, some targets in non-public spaces may be falsely detected. In future research, the robustness of the model needs to be further increased to improve its detection ability in complex environments. In addition, the GIS technology may be utilized to provide additional location information to ensure that the model only focuses on the targets in public spaces.
Author Contributions
C.W.: Writing-Original draft preparation; W.S.: Visualization, Software; H.W.: Writing—Reviewing and Editing; C.Z.: Methodology; G.T.: Data curation; Y.Y.: Investigation; P.D.: Validation. All authors have read and agreed to the published version of the manuscript.
Funding
This work was supported in part by the National Key Research and Development Program of China under Grant 2019YFD1101101, and in part by the National Key Research and Development Program of China under Grant 2019YFD1101105, and in part by the Natural Science Foundation of Hebei Province under Grant F2022204004, and in part by the Hebei Province Key Research and Development Program under Grant 20327402D,19227210D.
Data Availability Statement
The data presented in this study are available on request from the first author.
Acknowledgments
We are grateful to our colleagues at Hebei Agricultural University and Beijing Research Center for Information Technology in Agriculture for their help and input, without which this study would not have been possible.
Conflicts of Interest
The authors declare no conflict of interest.
References
- National Bureau of Statistics of China. 2021 China Statistical Yearbook; China Statistics Publishing Society: Beijing, China, 2021.
- Colomina, I.; Molina, P. Unmanned aerial systems for photogrammetry and remote sensing: A review. ISPRS J. Photogramm. Remote Sens. 2014, 92, 79–97. [Google Scholar] [CrossRef]
- Yao, H.; Qin, R.; Chen, X. Unmanned aerial vehicle for remote sensing applications—A review. Remote Sens. 2019, 11, 1443. [Google Scholar] [CrossRef]
- Sun, W.; Dai, L.; Zhang, X.; Chang, P.; He, X. RSOD: Real-time small object detection algorithm in UAV-based traffic monitoring. Appl. Intell. 2022, 52, 8448–8463. [Google Scholar] [CrossRef]
- Byun, S.; Shin, I.-K.; Moon, J.; Kang, J.; Choi, S.-I. Road traffic monitoring from UAV images using deep learning networks. Remote Sens. 2021, 13, 4027. [Google Scholar] [CrossRef]
- Li, B.; Cao, R.; Wang, Z.; Song, R.-F.; Peng, Z.-R.; Xiu, G.; Fu, Q. Use of multi-rotor unmanned aerial vehicles for fine-grained roadside air pollution monitoring. Transp. Res. Rec. 2019, 2673, 169–180. [Google Scholar] [CrossRef]
- Bolla, G.M.; Casagrande, M.; Comazzetto, A.; Dal Moro, R.; Destro, M.; Fantin, E.; Colombatti, G.; Aboudan, A.; Lorenzini, E.C. ARIA: Air pollutants monitoring using UAVs. In Proceedings of the 2018 5th IEEE International Workshop on Metrology for AeroSpace (MetroAeroSpace), Rome, Italy, 20–22 June 2018; pp. 225–229. [Google Scholar]
- Wong, S.Y.; Choe, C.W.C.; Goh, H.H.; Low, Y.W.; Cheah, D.Y.S.; Pang, S.C. Power transmission line fault detection and diagnosis based on artificial intelligence approach and its development in UAV: A review. Arab. J. Sci. Eng. 2021, 46, 9305–9331. [Google Scholar] [CrossRef]
- Chen, W.; Li, Y.; Zhao, Z. Transmission Line Vibration Damper Detection Using Deep Neural Networks Based on UAV Remote Sensing Image. Sensors 2022, 22, 1892. [Google Scholar] [CrossRef] [PubMed]
- Shi, L.; Zhang, F.; Xia, J.; Xie, J.; Zhang, Z.; Du, Z.; Liu, R. Identifying Damaged Buildings in Aerial Images Using the Object Detection Method. Remote Sens. 2021, 13, 4213. [Google Scholar] [CrossRef]
- Zhang, R.; Li, H.; Duan, K.; You, S.; Liu, K.; Wang, F.; Hu, Y. Automatic detection of earthquake-damaged buildings by integrating UAV oblique photography and infrared thermal imaging. Remote Sens. 2020, 12, 2621. [Google Scholar] [CrossRef]
- Zhao, Z.-Q.; Zheng, P.; Xu, S.-T.; Wu, X. Object detection with deep learning: A review. IEEE Trans. Neural Netw. Learn. Syst. 2019, 30, 3212–3232. [Google Scholar] [CrossRef] [PubMed]
- Wu, X.; Sahoo, D.; Hoi, S.C.H. Recent advances in deep learning for object detection. Neurocomputing 2020, 396, 39–64. [Google Scholar] [CrossRef]
- Wang, W.; Lai, Q.; Fu, H.; Shen, J.; Ling, H.; Yang, R. Salient object detection in the deep learning era: An in-depth survey. IEEE Trans. Pattern Anal. Mach. Intell. 2021, 44, 3239–3259. [Google Scholar] [CrossRef] [PubMed]
- Jiao, Z.; Zhang, Y.; Xin, J.; Mu, L.; Yi, Y.; Liu, H.; Liu, D. A deep learning based forest fire detection approach using UAV and YOLOv3. In Proceedings of the 2019 1st International Conference on Industrial Artificial Intelligence (IAI), Shenyang, China, 23–27 July 2019; pp. 1–5. [Google Scholar]
- Ammour, N.; Alhichri, H.; Bazi, Y.; Ben Jdira, B.; Alajlan, N.; Zuair, M. Deep learning approach for car detection in UAV imagery. Remote Sens. 2017, 9, 312. [Google Scholar] [CrossRef]
- Li, F.; Xin, J.; Chen, T.; Xin, L.; Wei, Z.; Li, Y.; Zhang, Y.; Jin, H.; Tu, Y.; Zhou, X.; et al. An automatic detection method of bird’s nest on transmission line tower based on faster_RCNN. IEEE Access 2020, 8, 164214–164221. [Google Scholar] [CrossRef]
- Ma, H.; Liu, Y.; Ren, Y.; Yu, J. Detection of collapsed buildings in post-earthquake remote sensing images based on the improved YOLOv3. Remote Sens. 2019, 12, 44. [Google Scholar] [CrossRef]
- Yu, J.; Luo, S. Detection method of illegal building based on YOLOv5. Comput. Eng. Appl. 2021, 57, 236–244. [Google Scholar]
- Jiang, H.; Hu, X.; Li, K.; Zhang, J.; Gong, J.; Zhang, M. PGA-SiamNet: Pyramid feature-based attention-guided Siamese network for remote sensing orthoimagery building change detection. Remote Sens. 2020, 12, 484. [Google Scholar] [CrossRef]
- Peng, B.; Ren, D.; Zheng, C.; Lu, A. TRDet: Two-Stage Rotated Detection of Rural Buildings in Remote Sensing Images. Remote Sens. 2022, 14, 522. [Google Scholar] [CrossRef]


Publisher’s Note: MDPI stays neutral with regard to jurisdictional claims in published maps and institutional affiliations. |
© 2022 by the authors. Licensee MDPI, Basel, Switzerland. This article is an open access article distributed under the terms and conditions of the Creative Commons Attribution (CC BY) license (https://creativecommons.org/licenses/by/4.0/).