Abstract
In the past few years, Synthetic Aperture Radar (SAR) has been widely used to detect marine ships due to its ability to work in various weather conditions. However, due to the imaging mechanism of SAR, there is a lot of background information and noise information similar to ships in the images, which seriously affects the performance of ship detection models. To solve the above problems, this paper proposes a new ship detection model called Feature enhancement and Land burial Net (FLNet), which blends traditional image processing methods with object detection approaches based on deep learning. We first design a SAR image threshold segmentation method, Salient Otsu (S-Otsu), according to the difference between the object and the noise background. To better eliminate noise in SAR images, we further combine image processing methods such as Lee filtering. These constitute a Feature Enhancement Module (FEM) that mitigates the impact of noise data on the overall performance of a ship detection model. To alleviate the influence of land information on ship detection, we design a Land Burial Module (LBM) according to the morphological differences between ships and land areas. Finally, these two modules are added to You Only Look Once V5 (YOLO V5) to form our FLNet. Experimental results on the SAR Ship Detection Dataset (SSDD) dataset show that FLNet comparison with YOLO V5 accuracy when performing object detection is improved by 7% and recall rate by 6.5%.
1. Introduction
As an active microwave imaging system for earth observation, Synthetic Aperture Radar (SAR) can work in any weather and at any time and is widely used in the field of ship detection [1,2,3]. In the early stages of ship detection, the primary goal is to better manually select some features to detect ships [4,5,6,7]. For instance, when detecting ships at the superpixel level, gray value differences between a ship’s area and neighboring regions is mainly used. Liu et al. used superpixels to segment object areas before applying a Constant False Positive Rate (CFAR) [8]. Wang et al. combined a superpixel segmentation with local contrast measurement [9]. Deng et al. first used the Simple Linear Iterative Clustering (SLIC) algorithm to generate superpixel regions and then used the corners for ship detection [10]. Wang et al. detect ship objects based on intensity differences between object and clutter pixels [11]. Liu et al. proposed the CFAR. The main principle of the CFAR is to apply a sliding window to the SAR image and then judge whether the window area is a ship according to the signal threshold [12]. A few extensions of the CFAR were progressively suggested including Smallest of CFAR, Order Statistic CFAR, Cell Averaging CFAR, and Greatest of CFAR [13,14,15,16]. Yang et al. developed ship detection based on the initial CFAR detection algorithm and improved it with a geometric optimization framework [17]. Wang et al. proposed a superpixel detector that improves the performance of ship target detection in SAR images via the local contrast of fisher vectors [18].
In the past few years, due to the rapid development of deep learning [19], a series of object detection methods based on deep learning have been applied to SAR images. These detection methods can be categorized into one-stage and two-stage [20]. Two-stage methods first extract a region of interest, then identify candidate objects, so the object detection accuracy is improved [21,22,23,24,25]. Unlike the two-stage algorithm, the one-stage algorithm performs in one step and is particularly appropriate for real-time detections. As one of the most advanced one-stage object detection algorithms, You Only Look Once V5 (YOLO V5) has the characteristics of fast detection speed and high accuracy, so it is selected as the baseline for our algorithm.
Some researchers have optimized the object detection algorithm based on deep learning according to the characteristics of SAR images. Li et al. proposed to use the K-means method to obtain the target scale distribution, optimize the selection of anchor boxes, and reduce the difficulty of network learning [26]. To reduce memory consumption and the computational complexity of convolutional neural networks, Xiong et al. proposed a lightweight detection model that utilizes channel shearing and knowledge distillation techniques, thereby reducing the YOLO V4 parameters [27]. Zhou et al. extended YOLO V5 by performing a K-means dimension clustering on the object frame and a mosaic enhancement image scale transformation and finally optimizing the loss function [28]. Lin et al. introduced a squeeze and excitation faster R-CNN that provides better detection results [29]. A Feature Pyramid Network (FPN) improved the performance of the detection network by utilizing the information between different feature layers [30]. Wei et al. proposed a high-resolution FPN for multiscale detection [31]. Cui et al. extended the convolutional network with an attention module that can learn weight coefficients between different channels [32]. Zhang et al. proposed using Neural Architecture Search (NAS) to automatically design a convolutional neural network structure on the dataset, which further improved the accuracy of ship detection [33]. Ke et al. fused the network feature layers to optimize the detection process [34].
Overall, these detection networks have achieved considerable performance when applied to SAR images, but so far, these SAR ship detection algorithms based on deep learning have not fully considered the differences between SAR ships and the surrounding environment. For instance, differences in the backscattering properties between ships and sea clutter result in the gray value of the ship is larger than that of the noise region. In addition, there are distinct geometrical features between the ship and the coast. Based on these differences, we introduced a combination of two modules: Feature Enhancement Module (FEM) and Land Burial Module (LBM). FEM is designed to enhance the characteristics of ships by eliminating noisy areas, while LBM eliminates coastal areas. The main contributions of this paper are as follows:
- We introduce a Salient Otsu (S-Otsu) threshold segmentation method to deal with SAR images noise;
- The FEM highlights ship features by suppressing background and noise information;
- The LBM is added to YOLO V5, removing coastal areas, improving convolutional neural network training efficiency, and reducing the impact of coastal features on detection performance.
2. Related Work
With the development of SAR technology, its application for object detection has gradually become a research hotspot. SAR can work in any location and in any weather as an active microwave detection technology. Optical remote sensing images contain information on multiple bands, which is more conducive to object identification. In contrast, SAR images only contain echo information from a single band, which is usually recorded in binary form, therefore object detection in SAR images is still a significant challenge. SAR ship detection algorithms can be divided into traditional and based on deep learning ship detection algorithms.
- (1)
- Traditional SAR ship detection algorithms
Most early ship detection algorithms are based on ship features to achieve detection. Gao et al. proposed a SAR ship detection algorithm based on a notch filter, which combines a notch filter designed according to the characteristics of hybrid polarization SAR with CFAR to achieve accurate detection of SAR ships [35]. This algorithm mainly applies in hybrid polarization SAR images, so it has poor robustness. Leng et al. introduced a ship detection model based on the distribution difference between the complex signal kurtosis in object and non-object areas, which can alleviate Radio Frequency Interference as compared with CFAR [36]. Lang et al. first selected pixels of specific values in a SAR image to form a high-dimensional space to enhance differences between ships and sea clutter and finally applied a spatial clustering algorithm for ship detection [37]. Liu introduced a detection algorithm for identifying small ships in a SAR image. The algorithm first models the polarization scattering in the ship and ocean areas and then uses a two-parameter constant false alarm rate for ship detection [38]. Zhang et al. proposed a Non-Window CFAR that combines superpixel segmentation with CFAR, and performed ship detection at the superpixel level, alleviating the dependence on sliding windows as in common CFAR [39]. Compared with CFAR, this algorithm makes a better difference between cluttered and ship areas. However, the algorithm also has certain limitations, and the detection effect of near-shore ships does not perform very well. Wang et al. first performed superpixel segmentation on SAR images to enhance the efficiency of ship detection. Then, Fisher vectors captured feature differences between ships and sea clutter using superpixels [40]. Overall, these methods still require efficient characterization of the ship and neighboring sea areas according to a selection of the most appropriate parameter settings to ensure good performance. However, complex and variable ocean environments make it difficult to build generic and successful modeling approaches.
- (2)
- Object detection algorithms based on deep learning
Object detection algorithms based on deep learning have shown significant advantages. Hu et al. designed a specific Squeeze-and-Excitation module in a Squeeze-and-Excitation Network, which suppresses background information by learning channel weights. Experiments show that the SE module can effectively improve the performance of the object detection network [41]. Woo et al. designed a Convolutional Block Attention Module (CBAM), which not only pays attention to channel information but also spatial information compared with the SE module and suppresses background information more effectively [42]. Wang et al. showed that capturing all channel dependencies in SE and CBAM is inefficient, therefore they replaced fully connected layers in the former two with one-dimensional convolutions in an Efficient Channel Attention Networks. Compared with the previous two, Efficient Channel Attention increases the accuracy of the object detection network while reducing the number of parameters. The above attention mechanisms have all been added to ship detection models to suppress SAR background information [43]. However, because these mechanisms are designed based on natural images and are directly applied to SAR images, they cannot achieve excellent results. Liu et al. added a top-to-bottom feature fusion path to the feature fusion pyramid, which alleviates the loss of feature details [44]. Chen et al. proposed an Atrous Spatial Pyramid Pooling (ASPP), which extracts features at different scales and increases detection capabilities for multi-scale objects [45].
- (3)
- SAR ship detection algorithms based on deep learning
With the development of deep learning, SAR ship detection algorithms are now mostly based on deep learning. Yang et al. introduced a multi-scale ship detector of complex backgrounds. Firstly, the attention module was introduced to mitigate the influence of the background, and then the ship features of different scales were captured by pooling operation [46]. However, the excessive use of pooling does not maintain the characteristics of small ships and then increases the possibility of missed detections. Guo et al. introduced CenterNet++ for the detection of small ships. This algorithm first uses dilated convolutions with different expansion rates to extract ship features of different scales and then further fuses the feature maps of different convolutional layers through a feature pyramid. Finally, the regression of ship position and class is achieved by a 1 × 1 convolution [47]. Although the algorithm shows excellent performance for the detection of small ships, the influence of background information on ship detection is not considered in the feature extraction process. Zhang et al. developed a lightweight ship detection model with only 20 convolutional layers, which proposed a feature reuse strategy that enhanced the ship detection ability of the model by repeatedly stacking feature maps of the same scale [48]. The shortcomings of this algorithm are similar to those of CenterNet++, both of which do not consider the impact of background information on ship detection. Sun et al. proposed to replace regular convolutions with atrous convolutions in the backbone to mitigate the loss of ship position information. Then, the ship detection model is made to pay more attention to ships by introducing an attention module [49]. Ge et al. designed a Spatially Oriented Attention Module (SOAM) and added it to You Only Look Once VX to achieve accurate detection of SAR objects. Its main principle is to utilize two one-dimensional global pooling operations to decode features into one-dimensional features in vertical and horizontal directions, further highlighting the location information of the target object [50]. Yu et al. proposed a bidirectional convolutional network in which a pooling operation is first used to suppress noise in SAR images. Then, the multi-scale mapping is used to further improve the performance of the ship detection model [51]. However, the attention modules used in these algorithms can only suppress non-ship information during feature generation and do not directly remove noise or coastal environment from the image. Furthermore, the attention module increases the computational cost of the algorithm.
3. Materials and Methods
This section gives a detailed description of the two main modules and discusses their main principles. The overall framework of our proposed Feature enhancement and Land burial Net (FLNet) is shown in Figure 1. Firstly, the image noise is reduced by FEM and then the threshold is set according to the difference in the sum of gray values in the SAR images with and without land areas. The FEM processed image is delivered to the LBM if the total grayscale values of the image are greater than the threshold. LBM generates land masks through superpixel segmentation, which alleviates the impact of land areas on ship detection. Finally, YOLO V5 is applied to identify ship locations as well as their types.
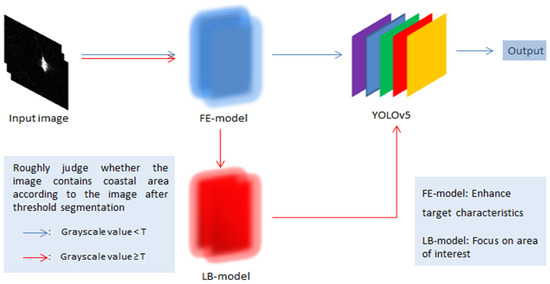
Figure 1.
Ship inspection network model.
3.1. Feature Enhancement Module (FEM)
3.1.1. Overall Framework of Feature Enhancement Modules
Common filtering methods include mean filtering, median filtering, local filtering, sigma filtering, Frost filtering, and gamma filtering [52]. Among these methods, mean and median filtering have poor edge retention capabilities. Although local filtering has better edge retention, the Signal-to-Noise Ratio and Peak Signal-to-Noise Ratio are very low. gamma, sigma and Frost filters have low effective coefficients and generate significant changes in the mean of the original image’s pixel values. Therefore, to reduce noise, we comprehensively choose the Lee filter. This module first performs a Lee filtering on Figure 2a to obtain Figure 2b. To further increase the contrast between the object and the image background, a non-linear transformation is performed on Figure 2b to obtain Figure 2d, the non-linear transformation process is given by
where x is the pixel value of the original image; c is a constant valued by 1; α is the coefficient here valued by 1.5; and y is the pixel value at the corresponding position of x after non-linear processing.
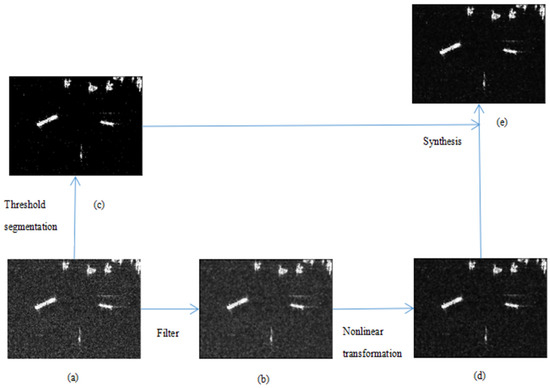
Figure 2.
Image processing engineering: (a) original image; (b) Lee filtered image; (c) threshold segmented image; (d) linear transformed image; (e) image after fusion of (d) and (c).
3.1.2. Salient Otsu (S-Otsu) Segmentation
An improved S-Otsu is applied to automatically find the threshold because pixel differences are image dependent.
Otsu is an algorithm that automatically determines the image binarization threshold [53]. The algorithm sets a threshold, T, to make a difference between the image background and potential objects and searches for the T value that maximizes the variance between the two, and then T is the final threshold. The calculation of the between-class variance is given by
where is the between-class variance between the background and the foreground; is the proportion of the background pixel in the entire image; is the proportion of the foreground pixel in the entire image; is the average gray value of the background; and is the average gray value of the foreground.
Although Otsu threshold segmentation can achieve good results for most images, the effect is not ideal for SAR images with a lot of noise, as shown in Figure 3. One can remark that ships with higher gray values in the picture are salient objects. To this end, we further design a new threshold segmentation method, which is mainly designed according to the significant difference between the noise area and the ship’s area. First, we define the difference of each pixel relative to other pixels, replace the original pixel value with this difference, and then calculate a new image segmentation threshold through Otsu.
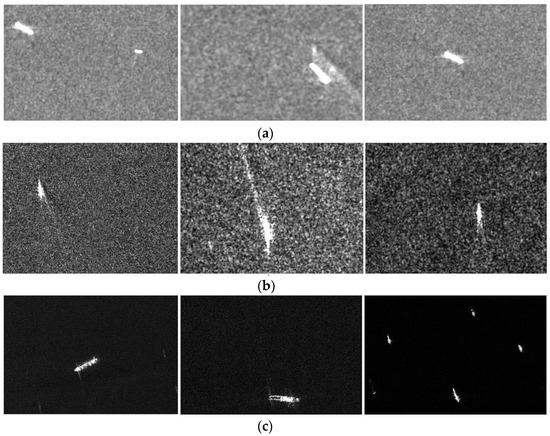
Figure 3.
SAR images under different noises: (a) SAR image with a lot of noise; (b) SAR image with less noise; (c) SAR image with a small amount of noise.
Since the ratio between the object and the background areas is uncertain, when the ratio of the object area is greater than the background area, the background area is mistaken as a significant area. To avoid this situation, the calculation of the gray value distance between two pixels is given by
where denotes the gray value of the original pixel; represents the sum of the gray value differences between the original and other pixels; and considers positive values.
The new pixel value is given by
where is the new gray value of the pixel; is the minimum value of the sum of the gray value differences between a pixel and the other pixels in the original image; and is the maximum value of the sum of the gray value differences between a pixel and the other pixels in the original image.
The pixel values of the image after threshold segmentation is given by
where represents the new gray value of the pixel (i, j); represents the original gray value of the pixel (i, j); and is the threshold obtained by S-Otsu.
3.1.3. Effect of S-Otsu
We selected three types of images (SAR images containing high noise regions, SAR images containing low-noise regions, SAR images containing land regions) from the SSDD dataset to evaluate the effect of our proposed S-Otsu. As shown in Figure 4, S-Otsu has no additional adverse effects compared to OTSU in SAR image maps that contain low-noise areas and SAR images that contain land areas. In images containing noise, S-Otsu can better segment objects from noisy regions compared to Otsu.
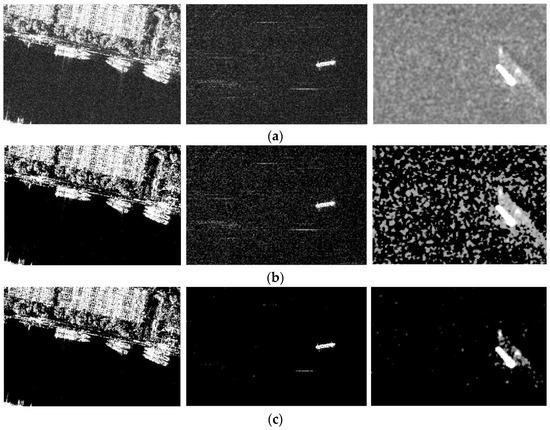
Figure 4.
Segmentation effect of S-Otsu on SAR images in different scenarios: (a) Original SAR image; (b) Segmentation effect of Otsu on SAR images; (c) Segmentation effect of S-Otsu on SAR images.
3.1.4. Image Fusion
Finally, the gray values of similar location points in Figure 2c,d are scaled by a factor and added. The function of the coefficient is to prevent the disappearance of the gradient caused by excessively high pixel values in the image fusion process. The fusion of images can be defined as
where represents the gray value of the pixel at the position (i, j) in the image e; represents the gray value of the pixel at the position (i, j) in the image c; represents the gray value of the pixel at the position (i, j) in the image d; and and β are the hyperparameters. The entire image processing steps are illustrated in Figure 2.
3.2. Grayscale Histogram Selection
Because a SAR image does not necessarily contain a land area, we set a threshold by counting the gray value distribution of the two types of images to decide whether to send the FEM processed image to LBM. There are 1160 SAR images in the SSDD dataset, including 194 SAR images containing land and 966 SAR images excluding land areas. We first count the Figure 2c gray value after threshold segmentation in module one to determine whether the Figure 2e in module one enters module two. It appears that most of the gray values of the images containing land areas are concentrated above one million (Figure 5). For SAR images without land areas, most of the gray values are concentrated below one million, therefore the sum of the gray values of each image is valued by one million as a preliminary threshold. This speeds up the image processing process and reduces misjudgments of the subsequent contour screening.
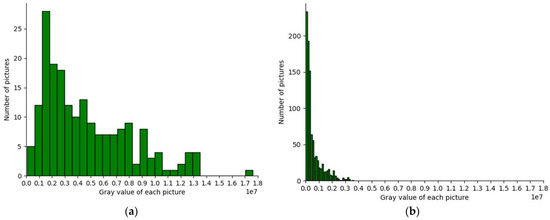
Figure 5.
Gray value statistics chart: (a) The gray value of the image that includes the land area; (b) The gray value of the image that does not include the land area.
3.3. Land Burial Module (LBM)
It appears that most SAR image segmentation algorithms often fail to obtain the desired mask when applied to sea and land segmentation contexts. Superpixel segmentation is widely applied in computer vision and includes different approaches such as the K-means algorithm, watershed algorithm, and SLIC generation algorithms [54,55]. The SLIC algorithm has a good edge fitting ability and efficient computation time. We designed this module based on the SLIC algorithm. The processing principle is shown in Figure 6.
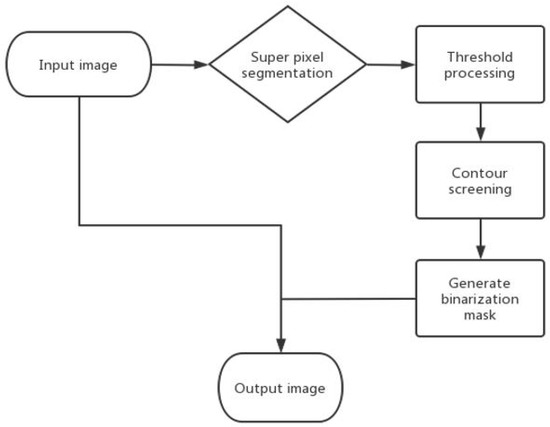
Figure 6.
Land burial module.
3.3.1. Superpixel Segmentation
The superpixel segmentation aggregates a given pixel-based image towards a regional-level image. After superpixel segmentation, regions of different sizes emerge. We can extract specific information from these regions, such as grayscale histograms and texture information. Superpixel segmentation divides a picture into many small parts along the object boundary to facilitate subsequent mask generations. A suitable k-value (i.e., number of superpixels) should be valued. An example of the k-value segmentation effect is shown in Figure 7. It appears that object edges of SAR images are often unclear, as ship objects are most often too small. We set the k-value to k = 1000 according to this specific case.
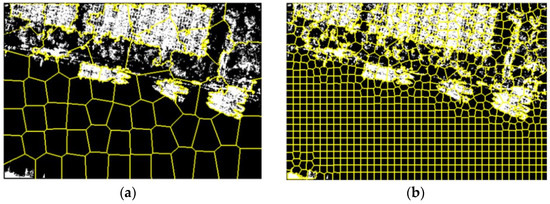
Figure 7.
Segmentation effect under different k-values: (a) Splitting effect picture when K = 100; (b) Splitting effect picture when K = 1000.
3.3.2. Threshold Processing
Common object segmentation algorithms are based on individual pixels, but as most SAR images are prone to noise with gray values close to the object, straight pixel processing generally does not achieve satisfactory results. We consider superpixels as the basic unit of object binaryzation and take the average gray value of the superpixel area as the gray value of the pixel block. The calculation of the gray value of the pixel block is given by
where denotes the pixel value of the superpixel; is the pixel value of the ith pixel of the original image; and N is the number of pixels in the original image.
The gray value of the superpixel in the noise background area is averaged. If the superpixel is in the object area, the overall gray value of the object area does not change significantly, thus greatly increasing the object and noise background areas. The gray value contrast is more conducive to this threshold segmentation. T is calculated by S-Otsu proposed in the first module and then binarized the image is defined as
where represents the new gray value of the pixel point (i, j) and represents the original gray value of the pixel point (i, j).
The final image after object segmentation is shown in Figure 8.
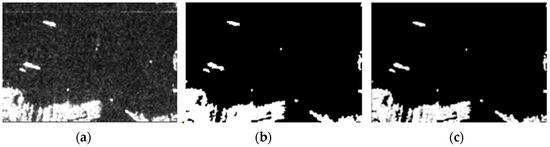
Figure 8.
Object segmentation results: (a) Original image; (b) Binarized image; (c) After segmentation, it only contains images of coasts and ships.
3.3.3. Generate Mask
This section identifies geometric differences between ships and land areas and then eliminates these ships to generate image masks. Indeed, ships and land features have different aspect ratios and area. Accordingly, we first identify the smallest bounding rectangle of the land area (as shown in Figure 9a). Next, we use the aspect ratio and area of the bounding area rectangle to identify ship and land areas and the final result is shown in Figure 9b. Finally, we can use a mask to remove the land areas from the SAR image.
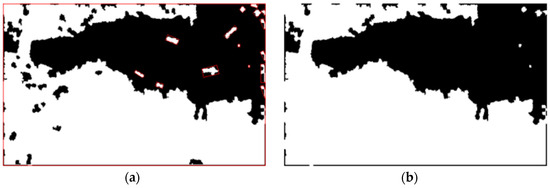
Figure 9.
Geometric feature processing diagram: (a) schematic diagram of the smallest enclosing bounding area of the object; (b) image mask.
4. Results
This section first introduces the dataset and evaluation parameters used in our experiments. Then, we validate the performance of our proposed ship detection model on SSDD and HRISD. Finally, we demonstrate the ability of FLNet to detect ships in different scenarios.
4.1. Dataset Introduction
The SSDD dataset is a public dataset mainly used for SAR ship object detection [56]. The dataset is obtained by clipping the target area and manually annotating the target objects. There are 2578 ships in the SSDD dataset and the size distribution of these ships ranges from several pixels to several hundred pixels, therefore the robustness of the proposed ship detection model can be well verified. A detailed description of the SSDD dataset is briefly summarized in Table 1. Figure 10 shows ships in different environments in the SSDD dataset.

Table 1.
Detail of SSDD and HRSID.
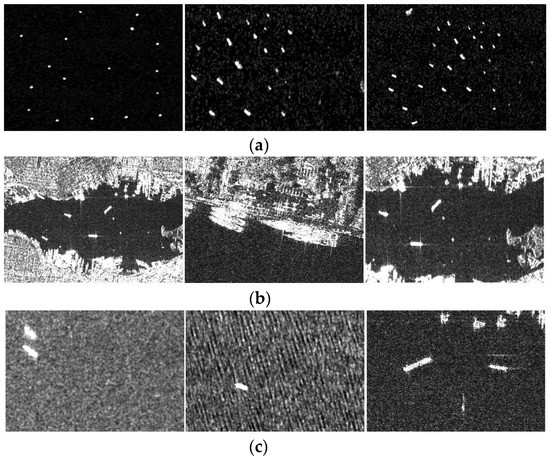
Figure 10.
Ships in different situations in SSDD: (a) Small ships in SAR images; (b) Near-shore ships in SAR images; (c) Ships affected by high noise in SAR images.
In HRSID, high-resolution SAR images are applied to construct the dataset and they are cropped to 800 × 800 pixel SAR images for better implementation of the functions such as multi-scale training [57]. This dataset contains a large number of ships with complex backgrounds. It was widely used in instance segmentation and ship detection. The details of this dataset are shown in Figure 11 and Table 1.
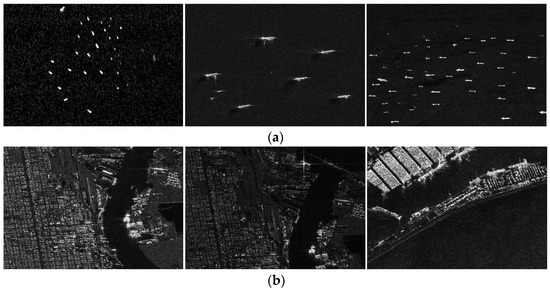
Figure 11.
Ships in different situations in HRSID: (a) Small ships in SAR images; (b) Near-shore ships in SAR images.
4.2. Metrics for Evaluating Model Performance
We use precision (P), average precision (AP), and recall rate (R) to evaluate the performance of our object detection model. The calculation methods of these three indicators are given by
where TP represents the number of positive samples correctly identified as positive samples, FP represents the number of negative samples misidentified as positive samples, P(R) represents the P-R curve, FN represents false negative.
4.3. Experimental Results
We trained our proposed FLNet and the Yolov5 separately on the SSDD dataset. To ensure the fairness of the experiment, all experiments are processed on a computer equipped with an intel i5-10600 processor and a Tesla K80 graphics card with 12GB of video memory, CUDA Version: 11.2, the operating system is 64-bit Windows 10. We used the most popular deep learning framework Pytorch. The backbone networks of these two ship detection models use the same pre-trained backbone.
During the training process, we set the learning rate of all model training to 0.01 and the batch size to 64. After 530 rounds of iterative training, the comparison of the detection effects of the two algorithms is shown in Table 2, Figure 12 and Figure 13.
Table 2.
Experimental results on SSDD dataset.
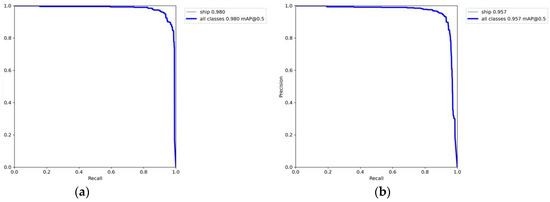
Figure 12.
Comparison of the P-R curves of the two detection algorithms on SSDD: (a) P-R curve of FLNet on SSDD dataset; (b) P-R curve of YOLO V5 on SSDD dataset.
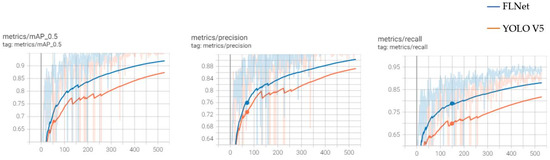
Figure 13.
Performance of the two detection algorithms in the training process.
From Table 3 and Figure 12, it appears that our improved algorithm has a 7% increase in precision, a 6.5% increase in recall rate, and a 2.3% increase in AP value compared with the original algorithm. It can be seen from Figure 13 that the performance of the improved algorithm in the training process also far exceeds the one of YOLO V5.
Table 3.
Experimental results on HRSID dataset.
To further verify the robustness of FLNet, we evaluated the detection capability of FLNet on ships using HRSID. The experimental results are shown in Figure 14 and Table 3. We can see from the experimental results that our proposed FLNet achieves SOTA on all metrics compared to YOLOV5.
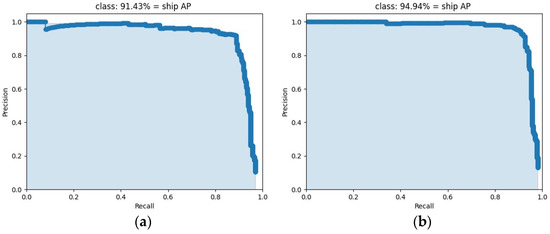
Figure 14.
Comparison of the P-R curves of the two detection algorithms on HRSID: (a) P-R curve of YOLO V5 on HRSID dataset; (b) P-R curve of FLNet on HRSID dataset.
4.4. Visualization of Ship Detection Effect
To more intuitively illustrate the effectiveness of our improvements, we compared FLNet and the baseline YOLO V5 in three scenarios. The three scenarios include detection of ships affected by high noise, detection of ships affected by coastal environments, and intensive detection of small ships.
4.4.1. Detection of Ships Affected by High Noise
As shown in Figure 15, due to the existence of a large amount of noise in the SAR image, the detection effect of the ship detection model on ships is seriously affected. In Figure 15b, YOLO V5 did not detect the presence of the ship, while our proposed FLNet correctly detected the position of the ship with a confidence of 0.94, as shown in Figure 15c.
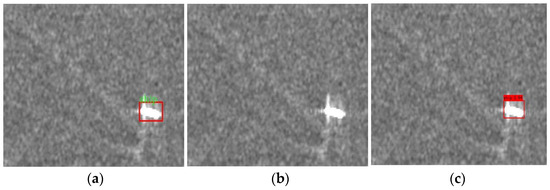
Figure 15.
Ship detection is affected by high noise in SAR images. (a) Correct position of the ship in the SAR image; (b) Ship detection effect of YOLO V5 in SAR images; (c) Ship detection effect of FLNet in SAR images.
4.4.2. Detection of Ships Affected by the Coastal Environment
As shown in Figure 16, since the gray value of the coast is close to the gray value of the ship and the ship is close to the coast, the detection effect of the ship detection model on the ship is seriously affected. In Figure 16b, YOLO V5 has seriously missed detections, while our proposed FLNet correctly detected three ships, as shown in Figure 16c.
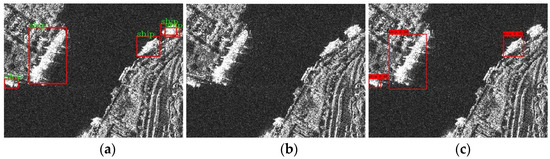
Figure 16.
Ship detection is affected by the coastal environment in SAR images. (a) Correct position of the ship in the SAR image; (b) Ship detection effect of YOLO V5 in SAR images; (c) Ship detection effect of FLNet in SAR images.
4.4.3. Detection of Dense Small Ships
The detection of small ships is a test of the performance of the ship detection model. As shown in Figure 17, there are a large number of small ships in the SAR image. While YOLO V5 missed one ship in the SAR image, (as shown in Figure 17b) our YOLOV5 correctly identified all ships (as shown in Figure 17c).
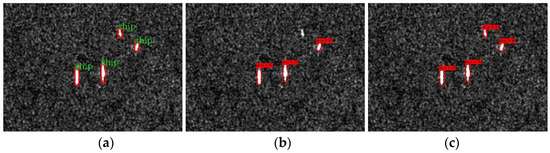
Figure 17.
Detection of dense small ships in SAR images. (a) Correct position of the ship in the SAR image; (b) Ship detection effect of YOLO V5 in SAR images; (c) Ship detection effect of FLNet in SAR images.
4.5. Comparison to Related Works
FLNet was compared with other deep learning ship detection models (faster RCNN, SSD, YOLO V4, HR-SDNet) on the SSDD dataset. The comparison results are shown in Table 4. The experimental results show that, in comparison to other algorithms, FLNet achieved SOTA with all indicators.
Table 4.
Comparison results with other algorithms.
5. Discussion
This section first discusses the impact of image fusion weights in FEM on detection results and then validates the effectiveness of our proposed module through ablation experiments. Finally, the failure cases of ship detection using FLNet are analyzed.
5.1. Influence of Image Fusion Weight in FEM on the Detection Result
This section discusses the influence of the image fusion weight in the FE module on the detection performance of FLNet. We set 0.25 + 0.25, 0.5 + 0.5, 0.75 + 0.75, 1 + 1 under the condition that other conditions are the same. The four sets of weights are tested. Experimental results are shown in the following Figure 18 and Table 5.
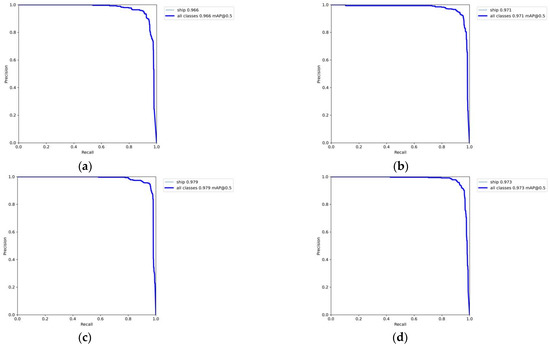
Figure 18.
The influence of four different weights set during image fusion on the P-R curve. (a) P-R curve of FLNet on SSDD dataset when the image fusion weight is 0.25; (b) P-R curve of FLNet on SSDD dataset when the image fusion weight is 0.5; (c) P-R curve of FLNet on SSDD dataset when the image fusion weight is 0.75; (d) P-R curve of FLNet on SSDD dataset when the image fusion weight is 1.
Table 5.
Experimental results of FLNet with different fusion weights on the SSDD dataset.
It can be seen from the experiments that the weight of image fusion impacts the detection capability of the network model. By appropriately lifting the weight of image fusion, the gray value difference between the ship and the background can be enhanced, which is more conducive to ship detection. However, a too large image fusion weight is likely to withdraw texture information of the ship itself, thus affecting the performance of the ship detection model. This indicates that not only the differences between the ship and the background but also the characteristics of the ship itself should be considered when performing ship detection.
5.2. Ablation Experiment
In order to verify the effectiveness of our proposed FEM and LBM, we used YOLO V5 as the baseline to verify the effects of different combinations of the two modules on the ship detection effect. The experimental results are shown in Table 6.
Table 6.
Ablation experiment results on SSDD dataset.
When adding FEM to YOLO V5 alone, ship detection accuracy is improved by 4.4%, recall rate by 7%, and AP by 2.3%. As shown in Figure 15, and due to the significant presence of noise, applying YOLO V5 alone is not satisfactory. On the other hand, FLNet first enhances ship features in the SAR image by removing noise and then facilitates the identification of the ship type and location. When adding LBM to YOLO V5 alone, ship detection accuracy is improved by 3.9%, recall rate by 3%, and AP by 1.1%. The LBM objective is to mainly detect near-shore ships. As shown in Figure 16, because land and ship gray values are close to each other, this potentially leads to false detection when using YOLO V5 to detect them. By applying LBM, land area is removed according to the geometric feature difference between the ship and the coast. When both FEM and LBM are added to YOLOV5, all indicators of the improved ship detection model reach SOTA except the recall rate, which is slightly decreased compared to FEM alone. Overall, the experiment results show that the performance of the ship detection model can be effectively enhanced by removing the noise background area. In addition, the decline in recall rate may be caused by the fact that our LBM can not completely distinguish land and ship according to the geometric characteristics of land and coast.
5.3. Bad Case Analysis
Experimental results on the SSDD and HRSID datasets show our improvements’ effectiveness. However, FLNet may miss detection in some specific scenes (as shown in Figure 19). Because the ship in the image is too close to the coast or other ships, the LBM module may incorrectly identify the ship as the coast, thus increasing the missed detection rate of the ship. We will pay more attention to the identification of such ships in future research.
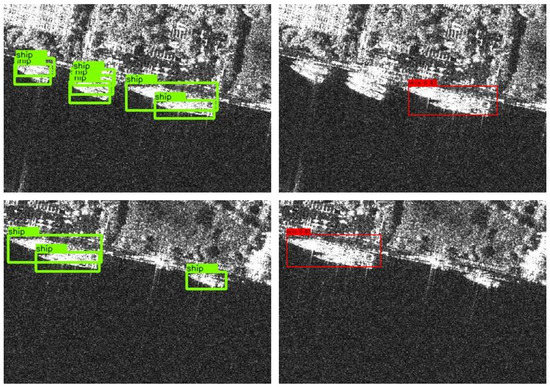
Figure 19.
Case of ship detection failure. The green target box is the correct position of the ship and the red target box is the propagation position predicted by FLNet.
6. Conclusions
This paper introduces a novel SAR ship detection model named FLNet. FLNet combines common image processing algorithms with a deep learning-based object detection algorithm, YOLO V5, to effectively suppress the influence of background information and noise information. The feature enhancement module combines Lee filtering with our improved Otsu threshold method to effectively enhance the SAR image objects and reduce noise. The land burial module eliminates the influence of land areas on ship detection based on geometric and gray value differences. The experimental results show that the proposed FLNet significantly improves the accuracy and recall rate as compared with YOLO V5. FLNet still misidentified a few near-shore ships in the land burial module. These misidentified ships will be eliminated. Therefore, our next step will be to study how to use deep learning algorithms to remove coastal areas to increase the performance of the ship detection model.
Author Contributions
Conceptualization, H.Z.; software, H.Z.; validation, H.Z.; resources, H.Z.; writing, H.Z.; visualization, H.Z.; supervision, G.T. and C.C.; project administration, G.T.; funding, editing, S.M. All authors have read and agreed to the published version of the manuscript.
Funding
This research was funded in part by the National Natural Science Foundation of China under Grant 82004259, in part by the Guangdong Basic and Applied Basic Research Foundation under Grant 2020A1515110503, and in part by the Guangzhou Basic and Applied Basic Research Project under Grant 202102020674.
Institutional Review Board Statement
Not applicable for studies not involving humans or animals.
Informed Consent Statement
Not applicable for studies not involving humans or animals.
Data Availability Statement
The data and code that support the findings of this study are available on request from the second author.
Acknowledgments
This research was supported in part by the National Natural Science Foundation of China (NO. 82004259), in part by the Guangdong Basic and Applied Basic Research Foundation (NO. 2020A1515110503) and in part by the Guangzhou Basic and Applied Basic Research Project (NO. 202102020674).
Conflicts of Interest
The authors declare no conflict of interest.
References
- Chang, Y.-L.; Anagaw, A.; Chang, L.; Wang, Y.C.; Hsiao, C.-Y.; Lee, W.-H. Ship Detection Based on YOLOv2 for SAR Imagery. Remote Sens. 2019, 11, 786. [Google Scholar] [CrossRef]
- Liu, T.; Zhang, J.; Gao, G.; Yang, J.; Marino, A. CFAR ship detection in polarimetric synthetic aperture radar images based on whitening filter. IEEE Trans. Geosci. Remote Sens. 2019, 58, 58–81. [Google Scholar] [CrossRef]
- Tang, G.; Liu, S.; Fujino, I.; Claramunt, C.; Wang, Y.; Men, S. H-YOLO: A Single-Shot Ship Detection Approach Based on Region of Interest Preselected Network. Remote Sens. 2020, 12, 4192. [Google Scholar] [CrossRef]
- Wang, X.; Chen, C.; Pan, Z.; Pan, Z. Fast and automatic ship detection for SAR imagery based on multiscale contrast measure. IEEE Geosci. Remote Sens. Lett. 2019, 16, 1834–1838. [Google Scholar] [CrossRef]
- Li, H.; Cui, X.; Chen, S. PolSAR Ship Detection with Optimal Polarimetric Rotation Domain Features and SVM. Remote Sens. 2021, 13, 3932. [Google Scholar] [CrossRef]
- Ai, J.; Tian, R.; Luo, Q.; Jin, J.; Tang, B. Multi-scale rotation-invariant Haar-like feature integrated CNN-based ship detection algorithm of the multiple-target environment in SAR imagery. IEEE Trans. Geosci. Remote Sens. 2019, 57, 10070–10087. [Google Scholar] [CrossRef]
- Zhao, D.; Zhu, C.; Qi, J.; Qi, X.; Su, Z.; Shi, Z. Synergistic Attention for Ship Instance Segmentation in SAR Images. Remote Sens. 2021, 13, 4384. [Google Scholar] [CrossRef]
- Liu, M.; Chen, S.; Lu, F.; Xing, M.; Wei, J. Realizing Target Detection in SAR Images Based on Multiscale Superpixel Fusion. Sensors 2021, 21, 1643. [Google Scholar] [CrossRef]
- Wang, X.; Chen, C.; Pan, Z.; Pan, Z. Superpixel-based LCM detector for faint ships hidden in strong noise background SAR imagery. IEEE Geosci. Remote Sens. Lett. 2018, 16, 417–421. [Google Scholar] [CrossRef]
- Deng, Y.; Wang, H.; Liu, S.; Sun, M.; Li, X. Analysis of the ship target detection in high-resolution SAR images based on information theory and Harris corner detection. J. Wirel. Com. Netw. 2018, 2018, 291. [Google Scholar] [CrossRef]
- Wang, Y.; Liu, H. PolSAR Ship Detection Based on Superpixel-Level Scattering Mechanism Distribution Features. IEEE Geosci. Remote Sens. Lett. 2015, 12, 1780–1784. [Google Scholar] [CrossRef]
- Liu, Y.; Zhang, S.; Suo, J.; Zhang, J.; Yao, T. Research on a new comprehensive CFAR (Comp-CFAR) processing method. IEEE Access 2019, 7, 19401–19413. [Google Scholar] [CrossRef]
- Kuttikkad, S.; Chellappa, R. Non-Gaussian CFAR techniques fortarget detection in high resolution SAR images. Proc. AICIP 1994, 1, 910–914. [Google Scholar]
- Hofele, F.X. An innovative CFAR algorithm. In 2001 CIE International Conference on Radar Proceedings (Cat No. 01TH8559); IEEE: Piscataway, NJ, USA, 2001; pp. 329–333. [Google Scholar]
- Novak, L.M.; Hesse, S.R. On the performance of order-statistics CFAR detectors. In Conference Record of the Twenty-Fifth Asilomar Conference on Signals, Systems & Computers; IEEE: Piscataway, NJ, USA, 1991; Volume 2, pp. 835–840. [Google Scholar]
- Di Bisceglie, M.; Galdi, C. CFAR detection of extended objects in high-resolution SAR images. IEEE Trans. Geosci. Remote Sens. 2005, 43, 833–843. [Google Scholar] [CrossRef]
- Yang, M.; Pei, D.; Ying, N.; Guo, C. An information-geometric optimization method for ship detection in SAR images. IEEE Geosci. Remote Sens. Lett. 2020, 19, 4005305. [Google Scholar] [CrossRef]
- Wang, X.; Li, G.; Zhang, X.P.; He, Y. Ship detection in SAR images via local contrast of Fisher vectors. IEEE Trans. Geosci. Remote Sens. 2020, 58, 6467–6479. [Google Scholar] [CrossRef]
- Zhu, M.; Hu, G.; Zhou, H.; Wang, S.; Feng, Z.; Yue, S. A Ship Detection Method via Redesigned FCOS in Large-Scale SAR Images. Remote Sens. 2022, 14, 1153. [Google Scholar] [CrossRef]
- Xu, C.; Yin, C.; Wang, D.; Han, W. Fast ship detection combining visual saliency and a cascade CNN in SAR images. IET Radar Sonar Navig. 2020, 14, 1879–1887. [Google Scholar] [CrossRef]
- Ren, S.; He, K.; Girshick, R.; Sun, J. Faster R-CNN: Towards real-time object detection with region proposal networks. TPAMI 2015, 28, 1137–1149. [Google Scholar] [CrossRef]
- Tang, G.; Zhuge, Y.; Claramunt, C.; Men, S. N-YOLO: A SAR Ship Detection Using Noise-Classifying and Complete-Target Extraction. Remote Sens. 2021, 13, 871. [Google Scholar] [CrossRef]
- Redmon, J.; Divvala, S.; Girshick, R.; Farhadi, A. You only look once: Unified, real-time object detection. In Proceedings of the IEEE Conference on Computer Vision and Pattern Recognition, Las Vegas, NV, USA, 27–30 June 2016; pp. 779–788. [Google Scholar]
- Liu, W.; Anguelov, D.; Erhan, D.; Szegedy, C.; Reed, S.; Fu, C.Y.; Berg, A.C. Ssd: Single shot multibox detector. In European Conference on Computer Vision; Springer: Cham, Switzerland, 2016; pp. 21–37. [Google Scholar]
- Jia, F.; Li, S.; Zuo, H.; Shen, J. Deep neural network ensemble for the intelligent fault diagnosis of machines under imbalanced data. IEEE Access 2020, 8, 120974–120982. [Google Scholar] [CrossRef]
- Li, Y.; Zhang, S.; Wang, W.Q. A lightweight faster R-CNN for ship detection in SAR images. IEEE Geosci. Remote Sens. Lett. 2020, 19, 4006105. [Google Scholar] [CrossRef]
- Ma, X.; Ji, K.; Xiong, B.; Zhang, L.; Kuang, G. Light-YOLOv4: An Edge-Device Oriented Target Detection Method for Remote Sensing Images. IEEE J. Sel. Top. Appl. Earth Obs. Remote Sens. 2021, 14, 10808–10820. [Google Scholar] [CrossRef]
- Zhou, J.; Jiang, P.; Zou, A.; Chen, X.; Hu, W. Ship Target Detection Algorithm Based on Improved YOLOv5. J. Mar. Sci. Eng. 2021, 9, 908. [Google Scholar] [CrossRef]
- Lin, Z.; Ji, K.; Leng, X.; Kuang, G. Squeeze and excitation rank faster R-CNN for ship detection in SAR images. IEEE Geosci. Remote Sens. Lett. 2018, 16, 751–755. [Google Scholar] [CrossRef]
- Lin, T.Y.; Dollár, P.; Girshick, R.; He, K.; Hariharan, B.; Belongie, S. Feature pyramid networks for object detection. In Proceedings of the IEEE Conference on Computer Vision and Pattern Recognition, Honolulu, HI, USA, 21–26 July 2017; pp. 2117–2125. [Google Scholar]
- Wei, S.; Su, H.; Ming, J.; Wang, C.; Yan, M.; Kumar, D.; Shi, J.; Zhang, X. Precise and Robust Ship Detection for High-Resolution SAR Imagery Based on HR-SDNet. Remote Sens. 2020, 12, 167. [Google Scholar] [CrossRef]
- Cui, Z.; Li, Q.; Cao, Z.; Liu, N. Dense attention pyramid networks for multi-scale ship detection in SAR images. IEEE Trans. Geosci. Remote Sens. 2019, 57, 8983–8997. [Google Scholar] [CrossRef]
- Zhang, P.; Tang, J.; Zhong, H.; Ning, M.; Liu, D.; Wu, K. Self-trained target detection of radar and sonar images using automatic deep learning. IEEE Trans. Geosci. Remote Sens. 2021, 60, 4701914. [Google Scholar] [CrossRef]
- Zhang, T.; Zhang, X.; Ke, X. Quad-FPN: A Novel Quad Feature Pyramid Network for SAR Ship Detection. Remote Sens. 2021, 13, 2771. [Google Scholar] [CrossRef]
- Gao, G.; Gao, S.; He, J.; Li, G. Ship detection using compact polarimetric SAR based on the notch filter. IEEE Trans. Geosci. Remote Sens. 2018, 56, 5380–5393. [Google Scholar] [CrossRef]
- Leng, X.; Ji, K.; Zhou, S.; Xing, X. Ship detection based on complex signal kurtosis in single-channel SAR imagery. IEEE Trans. Geosci. Remote Sens. 2019, 57, 6447–6461. [Google Scholar] [CrossRef]
- Lang, H.; Xi, Y.; Zhang, X. Ship detection in high-resolution SAR images by clustering spatially enhanced pixel descriptor. IEEE Trans. Geosci. Remote Sens. 2019, 57, 5407–5423. [Google Scholar] [CrossRef]
- Liu, G.; Zhang, X.; Meng, J. A Small Ship Target Detection Method Based on Polarimetric SAR. Remote Sens. 2019, 11, 2938. [Google Scholar] [CrossRef]
- Zhang, L.; Zhang, Z.; Lu, S.; Xiang, D.; Su, Y. Fast Superpixel-Based Non-Window CFAR Ship Detector for SAR Imagery. Remote Sens. 2022, 14, 2092. [Google Scholar] [CrossRef]
- Wang, X.; Li, G.; Plaza, A.; He, Y. Ship detection in SAR images by aggregating densities of Fisher vectors: Extension to a global perspective. IEEE Trans. Geosci. Remote Sens. 2021, 60, 5206613. [Google Scholar] [CrossRef]
- Hu, J.; Shen, L.; Sun, G. Squeeze-and-excitation networks. In Proceedings of the IEEE Conference on Computer Vision and Pattern Recognition, Salt Lake City, UT, USA, 18–23 June 2018; pp. 7132–7141. [Google Scholar]
- Woo, S.; Park, J.; Lee, J.Y.; Kweon, I.S. Cbam: Convolutional block attention module. In Proceedings of the European Conference on Computer Vision (ECCV); Springer: Berlin/Heidelberg, Germany, 2018; pp. 3–19. [Google Scholar]
- Liu, T.; Luo, R.; Xu, L.; Feng, D.; Cao, L.; Liu, S.; Guo, J. ECA-Net: Efficient Channel Attention for Deep Convolutional Neural Networks. In 2020 IEEE/CVF Conference on Computer Vision and Pattern Recognition (CVPR); IEEE: Piscataway, NJ, USA, 2020. [Google Scholar]
- Liu, S.; Qi, L.; Qin, H.; Shi, J.; Jia, J. Path aggregation network for instance segmentation. In Proceedings of the IEEE Conference on Computer Vision and Pattern Recognition, Salt Lake City, UT, USA, 18–23 June 2018; pp. 8759–8768. [Google Scholar]
- Chen, L.C.; Papandreou, G.; Kokkinos, I.; Murphy, K.; Yuille, A.L. Deeplab: Semantic image segmentation with deep convolutional nets, atrous convolution, and fully connected crfs. IEEE Trans. Pattern Anal. Mach. Intell. 2017, 40, 834–848. [Google Scholar] [CrossRef]
- Yang, X.; Zhang, X.; Wang, N.; Gao, X. A Robust One-Stage Detector for Multiscale Ship Detection with Complex Background in Massive SAR Images. IEEE Trans. Geosci. Remote Sens. 2021, 60, 5217712. [Google Scholar] [CrossRef]
- Guo, H.; Yang, X.; Wang, N.; Gao, X. A CenterNet plus plus model for ship detection in SAR images. Pattern Recognit. 2021, 112, 107787. [Google Scholar] [CrossRef]
- Zhang, T.; Zhang, X. ShipDeNet-20: An only 20 convolution layers and <1-MB lightweight SAR ship detector. IEEE Geosci. Remote Sens. Lett. 2020, 18, 1234–1238. [Google Scholar] [CrossRef]
- Sun, Y.; Sun, X.; Wang, Z.; Fu, K. Oriented ship detection based on strong scattering points network in large-scale SAR images. IEEE Trans. Geosci. Remote Sens. 2021, 60, 5218018. [Google Scholar] [CrossRef]
- Ge, J.; Wang, C.; Zhang, B.; Xu, C.; Wen, X. Azimuth-Sensitive Object Detection of High-Resolution SAR Images in Complex Scenes by Using a Spatial Orientation Attention Enhancement Network. Remote Sens. 2022, 14, 2198. [Google Scholar] [CrossRef]
- Yu, L.; Wu, H.; Zhong, Z.; Zheng, L.; Deng, Q.; Hu, H. TWC-Net: A SAR Ship Detection Using Two-Way Convolution and Multiscale Feature Mapping. Remote Sens. 2021, 13, 2558. [Google Scholar] [CrossRef]
- Sivaranjani, R.; Roomi, S.M.M.; Senthilarasi, M. Speckle noise removal in SAR images using Multi-Objective PSO (MOPSO) algorithm. Appl. Soft Comput. 2019, 76, 671–681. [Google Scholar] [CrossRef]
- Xu, S.; Liao, Y.; Yan, X.; Zhang, G. Change detection in SAR images based on iterative Otsu. Eur. J. Remote Sens. 2020, 53, 331–339. [Google Scholar] [CrossRef]
- Ren, X.; Malik, J. Learning a classification model for segmentation. In IEEE International Conference on Computer Vision; IEEE Computer Society: Piscataway, NJ, USA, 2003; Volume 2, p. 10. [Google Scholar]
- Achanta, R.; Shaji, A.; Smith, K.; Lucchi, A.; Fua, P.; Süsstrunk, S. SLIC superpixels compared to state-of-the-art superpixel methods. IEEE Trans. Pattern Anal. Mach. Intell. 2012, 34, 2274–2282. [Google Scholar] [CrossRef] [PubMed]
- Zhang, T.; Zhang, X.; Li, J.; Xu, X.; Wang, B.; Zhan, X.; Xu, Y.; Ke, X.; Zeng, T.; Su, H.; et al. SAR Ship Detection Dataset (SSDD): Official Release and Comprehensive Data Analysis. Remote Sens. 2021, 13, 3690. [Google Scholar] [CrossRef]
- Wei, S.; Zeng, X.; Qu, Q.; Wang, M.; Su, H.; Shi, J. HRSID: A high-resolution SAR images dataset for ship detection and instance segmentation. IEEE Access 2020, 8, 120234–120254. [Google Scholar] [CrossRef]
Publisher’s Note: MDPI stays neutral with regard to jurisdictional claims in published maps and institutional affiliations. |
© 2022 by the authors. Licensee MDPI, Basel, Switzerland. This article is an open access article distributed under the terms and conditions of the Creative Commons Attribution (CC BY) license (https://creativecommons.org/licenses/by/4.0/).