Technical Note

A Simple Band Ratio Library (BRL) Algorithm for Retrieval of Hourly Aerosol Optical Depth Using FY-4A AGRI Geostationary Satellite Data

1
School of Environment and Spatial Informatics, China University of Mining and Technology, Xuzhou 221116, China
2
School of Computing and Engineering, University of Derby, Derby DE22 1GB, UK
3
Artificial Intelligence Research Institute, China University of Mining and Technology, Xuzhou 221116, China
*
Author to whom correspondence should be addressed.
Remote Sens. 2022, 14(19), 4861; https://doi.org/10.3390/rs14194861
Submission received: 14 August 2022 / Revised: 25 September 2022 / Accepted: 26 September 2022 / Published: 29 September 2022
(This article belongs to the Section Atmospheric Remote Sensing)

Abstract

:
The Advanced Geostationary Radiation Imager (AGRI) is one of the primary payloads aboard the FY-4A geostationary meteorological satellite, which can provide high-frequency, wide coverage, and multiple spectral channel observations for China and surrounding areas. There are currently few studies on aerosol optical depth (AOD) inversion from FY-4A AGRI data. Based on AGRI data, a new land AOD retrieval algorithm called the band ratio library (BRL) algorithm was proposed in this study. The monthly average surface reflectance band ratio library was established after obtaining the relationship of band surface reflectance ratio from the MODIS combined AOD dataset. In order to calculate the hourly AOD, look-up tables (LUT) for the various aerosol models were constructed using the 6SV model. We quantitatively compared AOD produced from AGRI data with AERONET ground observations to validate the BRL algorithm. AGRI-retrieved AOD is in good agreement with AOD measured by AERONET, which has a correlation coefficient of R is 0.84, the linear regression function is AODAGRI = 0.80 ∗ AODAERONET − 0.004, the root-mean-square error (RMSE) is 0.16, and approximately 60% of the AGRI AOD results fall within the uncertain range of AOD = ±(0.2 × AODAERONET + 0.05). A cross-comparison was made with the MODIS AOD product provided by NASA. The comparison and verification show the proposed algorithm has a good accuracy of land AOD estimation from AGRI data.

1. Introduction

Aerosol exists widely in the atmosphere and is one of the important factors affecting air quality and climate change [1,2]. Aerosol Optical Depth (AOD) is one of the important parameters to describe aerosol optical properties, and accurate AOD information can be used to assess global climate change and atmospheric pollution [3].
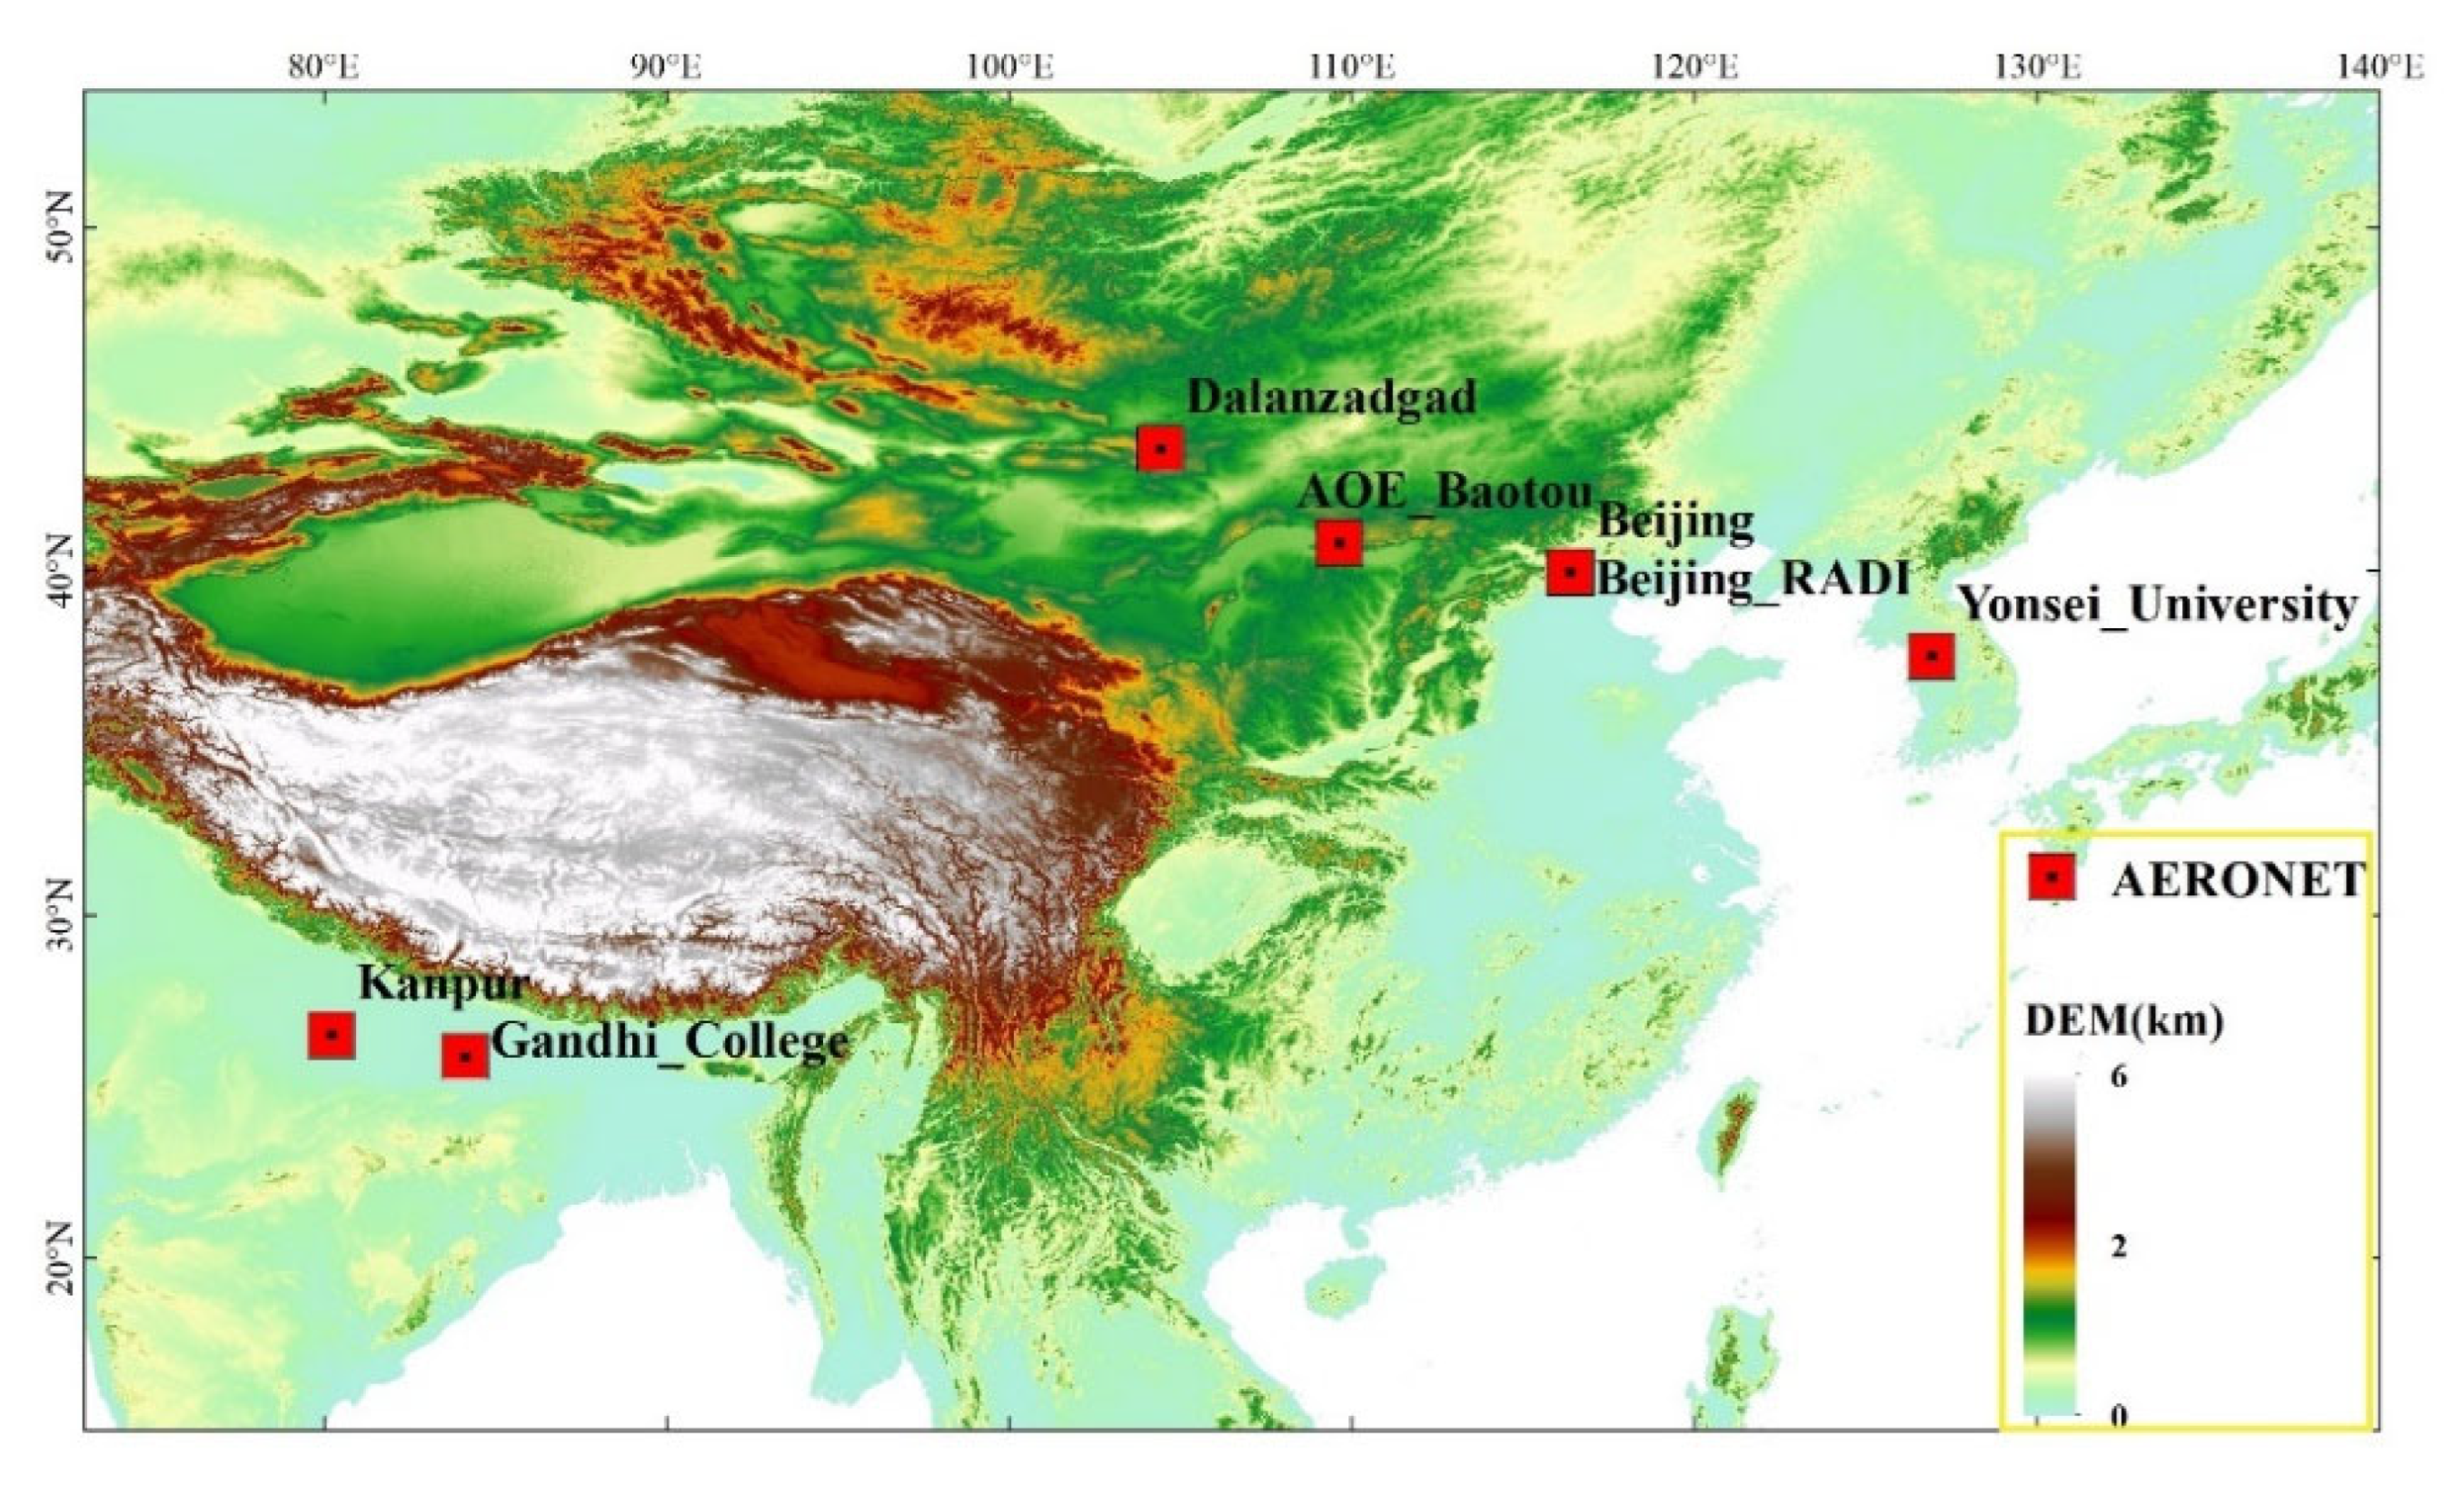
At present, aerosol optical characteristics monitoring research mainly includes ground observation and satellite remote sensing observation. Ground-based observations, such as the NASA-led Aerosol Robotic Network (AERONET), provide high-precision measurements of aerosol optical properties free of charge to researchers around the world [4]. However, the available data from ground observation stations in China are still limited, and ground-based observations cannot provide detailed monitoring results of aerosol optical properties in a large area. The development of aerosol satellite remote sensing observation has a history of over 40 years [5,6]. The first satellite sensor to provide aerosol optical depth products is AVHRR (Advanced Very High-Resolution Radiometer), which is a scanning radiometer with five bands and has been mounted on NOAA (National Ocean and Atmosphere Administration) since 1978 [2,7,8,9]. A large number of aerosol retrieval algorithms have emerged [1,6,10,11] after years of development of aerosol satellite remote sensing.
So far, the most widely used algorithms are Dark Target (DT) and DeepBlue (DB) algorithms officially adopted by MODIS [12,13,14]. Aerosol inversion is based on multiangle sensors, represented by AATSR [15,16] and MISR sensors [17]. AATSR has dual-angle observation capabilities. When establishing the relationship between the reflectance of different observation angles, it is usually assumed that the surface bidirectional reflection characteristics are negligible compared with the scattering characteristics of the surface and the atmosphere [10,18,19,20]. MISR is a true multiangle observation sensor the inversion algorithm was assumed to have the same BRF shape function as different bands, depending on the sun observation geometry [21]. Xue et al. [22] proposed the Synergetic Retrieval of Aerosol Properties (SRAP), which used Terra/Aqua data to produce long-term aerosol optical depth datasets in the Asian region. Lyapustin et al. [23] used the short-wave infrared 2.1 μm band and BRDF model and proposed the Multiangle implementation of the atmospheric correction (MAIAC) algorithm.
In comparison to polar-orbiting satellites, geostationary satellites can give a wealth of high coverage, high frequency, and multispectral images to monitor aerosol pollution, allowing for the study of aerosol changes on an hourly scale. For aerosol inversion using geostationary satellite data, the most widely used algorithm is the synthetic background method, which assumes that the surface reflectance is stable over time and selected the sub-dark pixel top of atmosphere reflectance (TOA) to obtain surface reflectance within this time window. Knapp et al. [24] used a synthetic background method; 4 km spatial resolution and 30-min temporal resolution were obtained from GOES. Choi et al. [25] used the dark blue band (412 nm) to synthesize the background reflectance at each time based on the monthly observation data for GOCI and then realized aerosol inversion. However, due to the existence of clouds, shadows and the complex relationship between the aerosol, and changes in surface and zenith angle, the true absolute surface reflectance is selected that is uncertain. Currently, some studies have moved to the strategy of obtaining the surface reflectance ratio in advance for AOD inversion rather than directly employing absolute reflectance. She et al. [26] used the stability of BRDF kernel coefficient ratio in a period, combined with the optimal estimation (OE) algorithm, and the synchronous solution of real-time surface reflectance and AOD was realized from the AHI sensor. Su et al. [27] also proposed the HiPARA algorithm for the AHI sensor; the sensor band was made the atmospheric correction by MOD09 CMA data, then the surface reflectance ratio database was established and achieved high-precision inversion results based on AHI data. Xie et al. [28] constructed a multi-channel inversion method based on FY-4A data using MODIS AOD data and believed that the ratio of surface reflectance remained unchanged within two weeks and successfully achieved aerosol optical depth inversion in South Asia. The above ratio library methods have achieved very good inversion results. However, the FY-4A currently has no official AOD products available. In this paper, we draw on these ideas, then a new aerosol optical depth retrieval algorithm was proposed for FY-4A/AGRI, which is called the Band Ratio Library (BRL) algorithm.

2. Data

2.1. FY-4A/AGRI Data

The FY-4A geostationary meteorological satellite was launched from the Xichang Satellite Launch Center and was located above the equator at 99.5°E in December 2016. The Advanced Geostationary Radiation Imager (AGRI) is one of the main payloads onboard the FY-4A satellite, including six visible and near-infrared bands, two short-wave infrared, two medium-wave infrared bands, four long-wave infrared bands, and two water vapor bands [29,30]. The settings of these channels are shown in Table 1. In previous studies, the calibration of 0.65 μm and 2.22 μm was stable enough, the signal noise ratio was high [31], and there was a stripe of 0.47 μm in the study area. Therefore, two band data of 0.65 μm and 2.22 μm were selected for retrieval AOD. FY-4A AGRI data were obtained from the website (http://satellite.nsmc.org.cn/, accessed on 1 April 2022).

2.2. Terra/Aqua MODIS AOD Data

MODIS can provide AOD products from 2000 to the present. The current C6.1 aerosol products (MOD04_L2) provide AOD from DT and DB algorithms, as well as “combined AOD” datasets. In this paper, due to its high coverage, the “combined AOD” dataset was used for atmospheric correction to provide a surface reflectance band ratio of 0.65 μm/2.22 μm. The DT AOD and DB AOD were used for comparison with retrieval results. MODIS AOD data were obtained from the website (https://ladsweb.modaps.eosdis.nasa.gov/, accessed on 3 June 2022).

2.3. AERONET Data

AOD measured by the AERONET sun photometer network (https://aeronet.gsfc.nasa.gov/, accessed on 7 June 2022) was used to evaluate the AOD retrieved by AGRI. AERONET version 3 products provide aerosol optical and physical properties, including AOD, aerosol size distribution, single scattering albedo (SSA), refractive index, and asymmetry factor (g). The Version3 AOD datasets offer three quality levels of data, L1.0 (unscreened), L1.5 (cloud screening and quality control), and L2.0 (quality assurance). AERONET sites provide high precision AOD at seven channels, 340 nm, 380 nm, 440 nm, 500 nm, 675 nm, 870 nm, and 1020 nm [4]. In this study, AOD datasets were obtained from 7 AERONET sites for evaluation of the BRL algorithm and other aerosol products. Detailed information is shown in Table 2 and Figure 1.

3. Research Methodology

3.1. Cloud/Water/Snow Pixel Mask Methods

The BRL algorithm can only invert the aerosol optical depth of clear sky pixels over land, so cloud/water pixels need to be eliminated. We used the 4 km cloud products officially released by FY4A for cloud masks based on visible observation and IR observation (http://satellite.nsmc.org.cn/, accessed on 1 April 2022). In the cloud mask (CLM) product datasets, the cloud states are described as follows, 0: Cloud, 1: Probably Cloud, 2: Probably Clear, and 3: Clear. In this study, we only selected Clear Cloud to ensure the accuracy of the cloud mask and used the MCD12C1 land cover product to remove water pixels. For snow pixels and ephemeral water pixels, we adopt the mask method proposed in this study [32]. An example diagram of cloud mask results at 04:00 (UTC) on 24 June 2020 is shown in Figure 2.

3.2. Aerosol Types

The BRL algorithm used five aerosol models, including the continental model (C1), Desert model (C2), Urban model (C3), Maritime model (C4), and Biomass burning model (C5) in the 6S model. Here, C1, C3, and C4 come from a mixture of four basic components (dust-like component, oceanic component, water-soluble component, and soot component), and C2 and C5 come from AERONET measurements [33,34]. The five aerosol models are shown in Table 3.
In general, the aerosol type is unknown before inversion. Because FY-4A/AGRI provides L1 datasets every 15 min, the surface reflectance changes very little at two adjacent moments. Therefore, for optimal aerosol type selection, the following cost function by minimizing the χ i was adopted [35]:
χ i = i λ = 1 2 ( ρ λ , i ρ λ , i + 1 ) 2
In Equation (2), i is the number of observations, λ is the FY-4A spectral channel used for the inversion, and ρ is surface reflectance.

3.3. Inverse Method

In general, for Lambertian surfaces that do not consider surface anisotropy, the equation characterizing the process of the atmospheric radiative transfer model is as follows [36]:
ρ T O A ( τ , θ s , θ v , φ ) = ρ a t m ( τ , θ s , θ v , φ ) + T ( θ s ) T ( θ v ) ρ s 1 S ρ s
In Equation (1), θ s , θ v and φ represent the solar zenith angle, view zenith angle, and relative azimuth angle between them, respectively. T ( θ s ) and T ( θ v ) are the total amount of light transmitted downward and upward, respectively. ρ s represents the Lambertian surface reflectance, and ρ a t m ( τ , θ s , θ v , φ ) is the atmospheric path reflectance, including aerosol and Rayleigh scattering. S is the atmosphere spherical albedo.
Before AOD retrieval, an important step is to determine the surface reflectance to separate from the satellite TOA signal. The correction procedure for water vapor and ozone is similar to this study [37]. We used the method of surface reflectance band ratio library to realize the inversion of AOD. This method has been proven to be effective in retrieving AOD with high accuracy. Firstly, we adopted the MODIS “combined” AOD to do atmosphere correction. In general, the uncertainty of atmospheric corrections increases significantly with increasing aerosol loading [14,27,38]. According to prior studies, the absolute inaccuracy of the MODIS combined AOD rises as the AOD rises; however, there is no discernible shift between 0 and 0.5 [28]. To guarantee the accuracy of atmospheric correction, these datasets under the condition of AOD < 0.5 was selected for atmospheric correction. Secondly, we selected the “Continental model” aerosol type, then calculated the surface reflectance at 03:00 and 05:00 UTC by running the 6S model. In many previous studies, it is assumed that the two-channel surface reflectance ratio remains unchanged within one month, which can be used to retrieve accurate AOD [27,39]. According to Zhang et al. [40], AOD can be retrieved on bright surfaces with reasonable accuracy if we have good estimates of surface reflectance and can use a single surface ratio value to represent an area of approximately 10 km. This hypothesis was adopted in this study. The monthly average surface reflectance ratio library of Red/NIR obtained is shown in Figure 3. The band ratio library method has good applicability. Compared with the lack of the DT algorithm in the bright surface area, our algorithm can be applied to the bright surface area. Compared with the DB algorithm for arid and semi-arid regions, our algorithm can dynamically measure the surface reflectance and use the reflectance ratio instead of the absolute reflectance to reduce the error, and variation in scene brightness brought on by topography is one of the reasons why the ratios are more stable than the absolute reflectance [40].
Next, we used Atmospheric Radiative Transfer Model to estimate the theoretical TOA reflectivity. However, running the model is time-consuming. Therefore, the 6S model is used to make a look-up table (LUT); 6S is a high-precision radiation transmission model; when the zenith angle of solar and view (SZA/VZA) is within 75 degrees, the simulation accuracy of TOA is less than 0.4% [41]. Therefore, the effective condition for retrieval is that the SZA/VZA is within 75 degrees. The detailed parameters and flowchart are shown in Table 4 and Figure 4, respectively.

3.4. Sensitivity Analysis

Figure 5 shows the deviation of the AOD results due to uncertainty of ±5% in the surface reflectance ratio. The sample data were from the location of the Beijing site on June 21, 2020. It can be seen that when the AOD value is higher, the AOD deviation caused by the uncertainty of the ratio is smaller. In the case of low AOD (AOD < 0.5), the ratio error will lead to a significant deviation of the AOD inversion results, which may be related to the dominance of surface signals under low AOD. Note that here the ratio uncertainties are the same for different AOD conditions, but the atmospheric correction uncertainty is lower for low AOD conditions, as mentioned earlier. The accuracy of the atmospheric correction is difficult to guarantee under high AOD conditions. Therefore, this sensitivity analysis does not affect the correctness of atmospheric correction experiments under low AOD conditions.
Figure 6 shows the deviation of the TOA results of different aerosol models in the forward modeling process, where (SZA = 30, VZA = 30, RAA = 30, and SR = 0.25). We can see that when AOD ≤ 0.5, the TOA simulated by C1, C2, and C5 are very close, while C3 and C5 are quite different. C5 is a pure scattering aerosol (SSA = 0.99), while C3 is a strongly absorbing aerosol (SSA = 0.65, of which the soot component accounts for 22%). Of course, if the AOD is very small, the TOA simulated by several aerosol models has almost no difference because the signal of the aerosol is already very weak at this time.

4. Results and Discussion

The algorithm was applied to AGRI data to estimate AOD in East Asia in June 2020, during a period of severe air pollution in North China. Our work in this section is primarily concerned with comparing AGRI AOD with AERONET measurements. Furthermore, AERONET AOD evaluated MODIS DT AOD and DB AOD, and AGRI AOD was cross-validated using DT AOD and DB AOD.

4.1. Spatiotemporal Distribution of the Retrieved AOD

Figure 7 shows the inversions of the spatiotemporal distribution results of AOD from AGRI data from 00:00 to 08:00 UTC on 24 June 24, 2020, respectively. The gradual variation of inversion coverage is caused by the variation of the solar zenith angle. AOD inversion results show that aerosol load is high in North China because the industrial emissions in this region have always been high. In the time series AOD images, we can find that aerosol distribution changes with time and the high aerosol coverage decreased in North China. Figure 8a,b show MODIS DB AOD and MODIS DT AOD from Terra at 03:00 UTC, and Figure 8c,d show MODIS DB AOD and MODIS DT AOD from Aqua at 05:00 UTC. We can find that although the temporal resolution of AGRI AOD is better than MODIS AOD, the overall coverage is still lower than that of MODIS AOD, which may be caused by the use of only the strictest official cloud mask products, and in North China and the Indian region, MODIS DT AOD and MODIS DB AOD also have similar AGRI AOD high aerosol loading.

4.2. Validation and Comparison of the Retrieved AOD

In order to verify the accuracy of the BRL algorithm, the AOD derived from AGRI was compared with AERONET data quantitatively, and the accuracy of DT and DB products released by MODIS was also compared at the same time. Statistical metrics including the correlation coefficient (R), root-mean-square error (RMSE), mean difference (MD), and expected error (EE, ±(0.20 ∗ AODAERONET + 0.05)) were used to assess accuracy [12,26]. The RMSE and MD can be calculated by the following equation:
R M S E = i = 1 N ( Y i Y i ) 2 / N
M D = i = 1 N ( Y i Y i ¯ ) / N
where Y i represents the results from remote sensing retrieval, Y i represents the corresponding AERONET data, Y i ¯ represents the mean value of AERONET observation data, and N represents the total number of matching results between remote sensing retrieval results and AERONET data.
The spatial–temporal matching method was used to verify the AOD from satellite inversion with AERONET AOD [26]. AERONET AOD from observations within ±30 min of the satellite overpass were averaged, while the satellite-retrieved AOD was averaged over an area of 50 km ∗ 50 km (5 ∗ 5 pixel window) with the AERONET site at the center.
Figure 9 shows the scatter diagrams of (a) AGRI AOD, (b) MODIS DT AOD, and (c) MODIS DB AOD at 550 nm. Due to the benefits of AGRI high-frequency observation, AGRI inversion results and AERONET observation results earned a total of 200 match points, surpassing DT and DB. Table 5 displays comprehensive validation outcomes. AOD inversion by AGRI has a good correlation with AOD inversion by AERONET, with a correlation coefficient R = 0.84, which is consistent with the verification results of DT and DB. The linear regression functions of AGRI AOD, DT, and DB are AODAGRI = 0.80 ∗ AODAERONET − 0.004, AODDT = 0.82 ∗ AODAERONET + 0.21, and AODDB = 0.94 ∗ AODAERONET + 0.02, respectively; they show that AGRI inversion results are worse than DB, but close to DT. Additionally, the RMSE and MD of AGRI AOD are 0.16 and 0.082, while the DT validation results are (RMSE = 0.20, MD = −0.127) and DB validation results are (RMSE = 0.12, MD = −0.004) in the same period. About 60.00% of the AGRI-retrieved results fall within the uncertain range of EE: ΔAOD = ±(0.20 × AODAERONET + 0.05), the EE of DT is 44.90%, and the EE of DB is 66.15%, indicating the accuracy of MODIS DB AOD is slightly better than AGRI AOD. However, AGRI AOD is superior to DT in most indicators. Figure 10 shows the cross-validation scatter diagrams of AGRI AOD versus. (a) MODIS DT AOD. (b) MODIS DB AOD at 550 nm in June 2020 and detailed validation results of statistical parameters are shown in Table 6. In the correlation coefficient R and slope, the cross-validation results of AGRI AOD-DT and AGRI AOD-DB are close, but in RMSE and MD, AGRI AOD-DB shows better results. The previous ground-based verification also shows the accuracy of DB AOD is better than DT AOD in East Asia, which further indicates that AGRI AOD has higher accuracy. The aforementioned verification and comparison findings demonstrate the BRL algorithm’s high accuracy and suitability for use in the successful AOD retrieval of FY-4A/AGRI.
To test the product accuracy in each area, various AERONET sites in the study area were used for verification. The results are shown in Table 7. As can be seen from Table 7, AGRI AOD performs well in the Beijing, Beijing_RADI, AOE_Baotou, Dalanzadgad, and Yonsei_University stations while performing poorly in the Indian regional station, which may be related to the large satellite zenith Angle in this region, leading to a large inversion error.

5. Conclusions

There is little research on the retrieval of FY-4A AOD, and the official AOD product of the FY-4A has not yet been made public. In this article, the hour-level AOD over land from FY-4A/AGRI was extracted using a unique, straightforward approach called the BRL algorithm. This algorithm created a library of monthly average band ratios in pixels that may be used to dynamically calculate surface reflectance.
Both MODIS AOD (DT and DB) and AGRI AOD (DB) showed a similar spatial distribution pattern. In regional aerosol studies, AGRI-retrieved AOD datasets exhibit superior temporal resolution compared to MODIS AOD. The spatiotemporal variation of local pollution can be captured using AOD inversion based on geostationary satellite data, and atmospheric pollution can be monitored with high temporal resolution.
However, we still need to consider additional work to make up for some deficiencies. First, this research only uses one month’s data, and the stability of the inversion algorithm needs more time to test, for example, with the characteristics of seasonal and hourly changes. Second, the continental aerosol was used for atmospheric correction in this research since the retrieval results indicated that it was appropriate. Moreover, future research will continue to examine how various aerosol models affect atmospheric correction in the study region.

Author Contributions

X.J.: Data curation, Methodology, Writing—original draft, Writing—review and editing. Y.X.: Conceptualization, Methodology, Software, Writing—review and editing. C.J.: Methodology, Software, Supervision. R.B.: Methodology, Software. Y.S.: Data download, Software. S.W.: Data download, Methodology. All authors have read and agreed to the published version of the manuscript.

Funding

This work was supported in part by the National Natural Science Foundation of China (NSFC) under Grant No. 41871260.

Data Availability Statement

Not applicable.

Acknowledgments

The authors are very grateful to the China Meteorological Administration, AERONET, and MODIS teams for providing free data.

Conflicts of Interest

The authors declare no conflict of interest.

References

  1. Lenoble, J.; Remer, L.; Tanre, D. Aerosol Remote Sensing; Springer Science & Business Media: Berlin/Heidelberg, Germany, 2011. [Google Scholar]
  2. King, M.D.; Kaufman, Y.J.; Tanré, D.; Nakajima, T. Remote sensing of tropospheric aerosols from space: Past, present, and future. Bull. Am. Meteorol. Soc. 1999, 80, 2229–2260. [Google Scholar] [CrossRef]
  3. Schaap, M.; Apituley, A.; Timmermans, R.M.A.; Koelemeijer, R.B.A.; de Leeuw, G. Exploring the relation between aerosol optical depth and PM2.5 at Cabauw, the Netherlands. Atmos. Chem. Phys. 2009, 9, 909–925. [Google Scholar] [CrossRef]
  4. Holben, B.N.; Eck, T.F.; Slutsker, I.A.; Tanre, D.; Buis, J.; Setzer, A.; Vermote, E.; Reagan, J.A.; Kaufman, Y.; Nakajima, T. AERONET—A federated instrument network and data archive for aerosol characterization. Remote Sens. Environ. 1998, 66, 1–16. [Google Scholar] [CrossRef]
  5. Griggs, M. Measurements of atmospheric aerosol optical thickness over water using ERTS-1 data. J. Air Pollut. Control Assoc. 1975, 25, 622–626. [Google Scholar] [CrossRef]
  6. Lee, K.H.; Li, Z.; Kim, Y.J.; Kokhanovsky, A. Atmospheric aerosol monitoring from satellite observations: A history of three decades. In Atmospheric Biological Environmental Monitoring; Kim, Y.J., Platt, U., Gu, M.B., Iwahashi, H., Eds.; Springer: Berlin/Heidelberg, Germany, 2009; pp. 13–38. [Google Scholar]
  7. Stowe, L.L.; Ignatov, A.M.; Singh, R.R. Development, validation, and potential enhancements to the second-generation operational aerosol product at the National Environmental Satellite, Data, and Information Service of the National Oceanic and Atmospheric Administration. J. Geophys. Res. Atmos. 1997, 102, 16923–16934. [Google Scholar] [CrossRef]
  8. Li, Y.; Xue, Y.; de Leeuw, G.; Li, C.; Yang, L.; Hou, T.; Marir, F. Retrieval of aerosol optical depth and surface reflectance over land from NOAA AVHRR data. Remote Sens. Environ. 2013, 133, 1–20. [Google Scholar] [CrossRef]
  9. Xue, Y.; He, X.; de Leeuw, G.; Mei, L.; Che, Y.; Rippin, W.; Guang, J.; Hu, Y. Long-time series aerosol optical depth retrieval from AVHRR data over land in North China and Central Europe. Remote Sens. Environ. 2017, 198, 471–489. [Google Scholar] [CrossRef]
  10. Kokhanovsky, A.A.; Leeuw, G. Satellite Aerosol Remote Sensing over Land; Springer: Berlin/Heidelberg, Germany, 2009. [Google Scholar]
  11. Schutgens, N.; Sayer, A.M.; Heckel, A.; Hsu, C.; Jethva, H.; de Leeuw, G.; Leonard, P.J.; Levy, R.C.; Lipponen, A.; Lyapustin, A. An AeroCom–AeroSat study: Intercomparison of satellite AOD datasets for aerosol model evaluation. Atmos. Chem. Phys. 2020, 20, 12431–12457. [Google Scholar] [CrossRef]
  12. Levy, R.; Mattoo, S.; Munchak, L.; Remer, L.; Sayer, A.; Patadia, F.; Hsu, N. The Collection 6 MODIS aerosol products over land and ocean. Atmos. Meas. Tech. 2013, 6, 2989–3034. [Google Scholar] [CrossRef]
  13. Gupta, P.; Levy, R.C.; Mattoo, S.; Remer, L.A.; Munchak, L.A. A surface reflectance scheme for retrieving aerosol optical depth over urban surfaces in MODIS Dark Target retrieval algorithm. Atmos. Meas. Tech. 2016, 9, 3293–3308. [Google Scholar] [CrossRef] [Green Version]
  14. Hsu, N.C.; Jeong, M.J.; Bettenhausen, C.; Sayer, A.M.; Hansell, R.; Seftor, C.S.; Huang, J.; Tsay, S.C. Enhanced Deep Blue aerosol retrieval algorithm: The second generation. J. Geophys. Res. Atmos. 2013, 118, 9296–9315. [Google Scholar] [CrossRef]
  15. Veefkind, J.P.; de Leeuw, G.; Durkee, P.A. Retrieval of aerosol optical depth over land using two-angle view satellite radiometry during TARFOX. Geophys. Res. Lett. 1998, 25, 3135–3138. [Google Scholar] [CrossRef]
  16. Veefkind, J.P.; de Leeuw, G.; Stammes, P.; Koelemeijer, R.B. Regional distribution of aerosol over land, derived from ATSR-2 and GOME. Remote Sens. Environ. 2000, 74, 377–386. [Google Scholar] [CrossRef]
  17. Martonchik, J.V.; Diner, D.J.; Kahn, R.A.; Ackerman, T.P.; Verstraete, M.M.; Pinty, B.; Gordon, H.R. Techniques for the retrieval of aerosol properties over land and ocean using multiangle imaging. IEEE Trans. Geosci. Remote Sens. 1998, 36, 1212–1227. [Google Scholar] [CrossRef]
  18. Kolmonen, P.; Sundström, A.-M.; Sogacheva, L.; Rodriguez, E.; Virtanen, T.; Leeuw, G.D. Uncertainty characterization of AOD for the AATSR dual and single view retrieval algorithms. Atmos. Meas. Tech. Discuss. 2013, 6, 4039–4075. [Google Scholar] [CrossRef]
  19. Grey, W.M.; North, P.R.; Los, S.O.; Mitchell, R.M. Aerosol optical depth and land surface reflectance from multiangle AATSR measurements: Global validation and intersensor comparisons. IEEE Trans. Geosci. Remote Sens. 2006, 44, 2184–2197. [Google Scholar] [CrossRef]
  20. Mei, L.; Xue, Y.; Kokhanovsky, A.A.; von Hoyningen-Huene, W.; Istomina, L.; de Leeuw, G.; Burrows, J.P.; Guang, J.; Jing, Y. Aerosol optical depth retrieval over snow using AATSR data. Int. J. Remote Sens. 2013, 34, 5030–5041. [Google Scholar] [CrossRef]
  21. Martonchik, J.V.; Diner, D.J.; Crean, K.A.; Bull, M.A. Regional aerosol retrieval results from MISR. IEEE Trans. Geosci. Remote Sens. 2002, 40, 1520–1531. [Google Scholar] [CrossRef]
  22. Xue, Y.; He, X.; Xu, H.; Guang, J.; Guo, J.; Mei, L. China Collection 2.0: The aerosol optical depth dataset from the synergetic retrieval of aerosol properties algorithm. Atmos. Environ. 2014, 95, 45–58. [Google Scholar] [CrossRef]
  23. Lyapustin, A.; Wang, Y.; Laszlo, I.; Kahn, R.; Korkin, S.; Remer, L.; Levy, R.; Reid, J. Multiangle implementation of atmospheric correction (MAIAC): 2. Aerosol algorithm. J. Geophys. Res. Atmos. 2011, 116, D03211. [Google Scholar] [CrossRef]
  24. Knapp, K.R.; Frouin, R.; Kondragunta, S.; Prados, A. Toward aerosol optical depth retrievals over land from GOES visible radiances: Determining surface reflectance. Int. J. Remote Sens. 2005, 26, 4097–4116. [Google Scholar] [CrossRef]
  25. Choi, M.; Kim, J.; Lee, J.; Kim, M.; Park, Y.-J.; Jeong, U.; Kim, W.; Hong, H.; Holben, B.; Eck, T.F. GOCI Yonsei Aerosol Retrieval (YAER) algorithm and validation during the DRAGON-NE Asia 2012 campaign. Atmos. Meas. Tech. 2016, 9, 1377–1398. [Google Scholar] [CrossRef]
  26. She, L.; Xue, Y.; Yang, X.; Leys, J.; Guang, J.; Che, Y.; Fan, C.; Xie, Y.; Li, Y. Joint retrieval of aerosol optical depth and surface reflectance over land using geostationary satellite data. IEEE Trans. Geosci. Remote Sens. Environ. 2018, 57, 1489–1501. [Google Scholar] [CrossRef]
  27. Su, X.; Wang, L.; Zhang, M.; Qin, W.; Bilal, M. A High-Precision Aerosol Retrieval Algorithm (HiPARA) for Advanced Himawari Imager (AHI) data: Development and verification. Remote Sens. Environ. 2021, 253, 112221. [Google Scholar] [CrossRef]
  28. Xie, Y.; Li, Z.; Guang, J.; Hou, W.; Salam, A.; Ali, Z.; Fang, L. Aerosol Optical Depth Retrieval over South Asia Using FY-4A/AGRI Data. IEEE Trans. Geosci. Remote Sens. 2021, 60, 1–14. [Google Scholar] [CrossRef]
  29. Guo, Q.; Lu, F.; Wei, C.; Zhang, Z.; Yang, J. Introducing the New Generation of Chinese Geostationary Weather Satellites, Fengyun-4. Bull. Am. Meteorol. Soc. 2017, 98, 1637–1658. [Google Scholar]
  30. Chen, B.; Li, X.; Zhang, G.; Guo, Q.; Wu, Y.; Wang, B.; Chen, F. On-orbit installation matrix calibration and its application on AGRI of FY-4A. J. Appl. Remote Sens. 2020, 14, 024507. [Google Scholar] [CrossRef]
  31. Sun, L.; Chen, B.; Zhang, Y.; Gao, L.; Min, M.; Guo, Q.; Zhang, Z. On-orbit calibration analysis of FY-4A AGRI solar bands. In Earth Observing Missions and Sensors: Development, Implementation, and Characterization V; Xiong, X., Kimura, T., Eds.; SPIE: Bellingham, WA, USA, 2018. [Google Scholar]
  32. Lim, H.; Choi, M.; Kim, J.; Kasai, Y.; Chan, P.W. AHI/Himawari-8 Yonsei aerosol retrieval (YAER): Algorithm, validation and merged products. Remote Sens. 2018, 10, 699. [Google Scholar] [CrossRef]
  33. Dubovik, O.; Holben, B.; Eck, T.F.; Smirnov, A.; Kaufman, Y.J.; King, M.D.; Tanré, D.; Slutsker, I. Variability of Absorption and Optical Properties of Key Aerosol Types Observed in Worldwide Locations. J. Atmos. Sci. 2002, 59, 590–608. [Google Scholar] [CrossRef]
  34. Bao, F.; Cheng, T.; Li, Y.; Shi, S.; Guo, H.; Wu, Y. Single Scattering Albedo of High Loading Aerosol Estimated Across East Asia from S-NPP VIIRS. IEEE Trans. Geosci. Remote Sens. 2021, 60, 2080. [Google Scholar] [CrossRef]
  35. Mei, L.; Xue, Y.; de Leeuw, G.; Holzer-Popp, T.; Guang, J.; Li, Y.; Yang, L.; Xu, H.; Xu, X.; Li, C. Retrieval of aerosol optical depth over land based on a time series technique using MSG/SEVIRI data. Atmos. Chem. Phys. 2012, 12, 9167–9185. [Google Scholar] [CrossRef] [Green Version]
  36. Vermote, E.F.; Tanré, D.; Deuze, J.L.; Herman, M.; Morcette, J.-J. Second simulation of the satellite signal in the solar spectrum, 6S: An overview. IEEE Trans. Geosci. Remote Sens. 1997, 35, 675–686. [Google Scholar] [CrossRef]
  37. Jin, C.; Xue, Y.; Jiang, X.; Sun, Y.; Wu, S. Improved Bi-Angle Aerosol Optical Depth Retrieval Algorithm from AHI Data Based on Particle Swarm Optimization. Remote Sens. 2021, 13, 4689. [Google Scholar] [CrossRef]
  38. Levy, R.C.; Remer, L.A.; Mattoo, S.; Vermote, E.F.; Kaufman, Y.J. Second-generation operational algorithm: Retrieval of aerosol properties over land from inversion of Moderate Resolution Imaging Spectroradiometer spectral reflectance. J. Geophys. Res. Atmos. 2007, 112, D13211. [Google Scholar] [CrossRef]
  39. Xie, Y.Q.; Xue, Y.; Guang, J.; Mei, L.L.; She, L.; Li, Y.; Che, Y.H.; Fan, C. Deriving a Global and Hourly Data Set of Aerosol Optical Depth Over Land Using Data from Four Geostationary Satellites: GOES-16, MSG-1, MSG-4, and Himawari-8. IEEE Trans. Geosci. Remote Sens. 2020, 58, 1538–1549. [Google Scholar] [CrossRef]
  40. Zhang, H.; Kondragunta, S.; Laszlo, I.; Liu, H.; Remer, L.A.; Huang, J.; Superczynski, S.; Ciren, P. An enhanced VIIRS aerosol optical thickness (AOT) retrieval algorithm over land using a global surface reflectance ratio database. J. Geophys. Res. Atmos. 2016, 121, 10717–10738. [Google Scholar] [CrossRef]
  41. Vermote, E.; Justice, C.; Claverie, M.; Franch, B. Preliminary analysis of the performance of the Landsat 8/OLI land surface reflectance product. Remote Sens. Environ. 2016, 185, 46–56. [Google Scholar] [CrossRef]
Figure 1. The study area (73°E–140°E, 15°N–54°N). Color bars represent elevation, and red squares represent the location of AERONET sites, with selected site data used for validation in this study.
Remotesensing 14 04861 g001
Figure 2. AGRI Cloud masks on 24 June 2020. The green and blue represent Cloud and Clear status, respectively.
Remotesensing 14 04861 g002
Figure 3. Monthly average ratio library between 0.65 μm and 2.22 μm in June 2020.
Remotesensing 14 04861 g003
Figure 4. Flowchart of aerosol optical depth retrieval algorithm in this study.
Remotesensing 14 04861 g004
Figure 5. Influence of SR ratio with ±5% uncertainty on AOD results.
Remotesensing 14 04861 g005
Figure 6. TOA is estimated by different aerosol models under multiple AOD conditions.
Remotesensing 14 04861 g006
Figure 7. Maps of the AGRI AOD on 24 June 2020, from 00:00 UTC to 08:00 UTC (ai).
Remotesensing 14 04861 g007
Figure 8. Maps of MODIS AOD on 24 June 2020 (ad). (a,c) MODIS C61 DB AOD, and (b,d) MODIS C61 DT AOD. (a,b) from MODIS/Terra; (c,d) from MODIS/Aqua.
Remotesensing 14 04861 g008
Figure 9. Satellite remote sensing and ground verification scatter plots. AERONET AOD versus (a) AGRI AOD. (b) MODIS DT AOD. (c) MODIS DB AOD at 550 nm were derived in June 2020. EE = ±(0.2 × AODAERONET + 0.05) envelope blue line. The text at the top describes the number of collocation points (N), correlation coefficient (R), RMSE, MD, EE, and linear regression function.
Remotesensing 14 04861 g009
Figure 10. The cross-validation scatter plots of AGRI AOD versus. (a) MODIS DT AOD. (b) MODIS DB AOD at 550 nm were derived in June 2020.
Remotesensing 14 04861 g010
Table 1. Central wavelengths of AGRI sensor channels.
Channel NameWavelength (μm)Channel NameWavelength (μm)
10.4783.72
20.6596.25
30.83107.10
41.37118.5
51.611210.8
62.221312
73.721413.5
Table 2. The AERONET site used for validation in this paper.
NameLevelLongitude (°)Latitude (°)Altitude (m)
Beijing1.5116.38E39.98N92
Beijing_RADI1.5116.38E40.00N59
AOE_Baotou1.5109.63E40.88N1314
Dalanzadgad1.5104.42E43.58N1470
Gandhi_College1.584.13E25.87N60
Kanpur1.580.23E26.51N123
Yonsei_University1.5126.93E37.56N97
Table 3. Five aerosol types were used in AOD inversion. SSA is the single scattering albedo, and g is the asymmetry factor.
Aerosol TypeSSA at 550 nmg at 550 nm
Continental model (C1)0.890.64
Desert model (C2)0.940.70
Urban model (C3)0.650.59
Maritime model (C4)0.990.74
Biomass burning model (C5)0.970.68
Table 4. Look-up table parameters setting.
VariableValue
Solar zenith angle (°)0, 6, 12, 18, 24, 30, 36, 42, 48, 54, 60, 66, 72, 78
View zenith angle (°)0, 6, 12, 18, 24, 30, 36, 42, 48, 54, 60, 66, 72, 78
Relative azimuth angle (°)0, 12, 24, 36, 48, 53, 72, 84, 96, 108, 120, 132, 144, 156, 168, 179
AOD at 550 nm0.001, 0.1, 0.2, 0.5, 0.8, 1.1, 1.5, 2, 3
Aerosol typeC1, C2, C3, C4, C5
Elevation (km)0 and 6
Band (2)2 (0.65 μm), 6 (2.22 μm)
Table 5. Validation results of statistical parameters.
AOD ProductNRRMSEMDEESlope
AGRI AOD2000.840.160.08260.00%0.80
MODIS DT AOD490.840.20−0.12744.90%0.82
MODIS DB AOD650.840.12−0.00466.15%0.94
Table 6. Cross verification results of statistical parameters.
Cross-ValidationNRRMSEMDSlope
AGRI AOD-MODIS DT AOD370.870.260.2310.60
AGRI AOD-MODIS DB AOD490.850.140.0570.55
Table 7. All points AGRI AOD comparisons over each AERONET site.
Site_NameNRRMSEMDEESlope
Beijing350.930.130.08974.29%1.03
Beijing_RADI550.890.160.09761.82%0.98
AOE_Baotou150.840.090.03986.67%0.74
Dalanzadgad260.790.06−0.03073.08%0.79
Gandhi_College450.540.230.17043.50%0.70
Kanpur160.520.15−0.04841.67%1.44
Yonsei_University80.780.160.15562.50%0.82
Publisher’s Note: MDPI stays neutral with regard to jurisdictional claims in published maps and institutional affiliations.

