2.1. Study Area
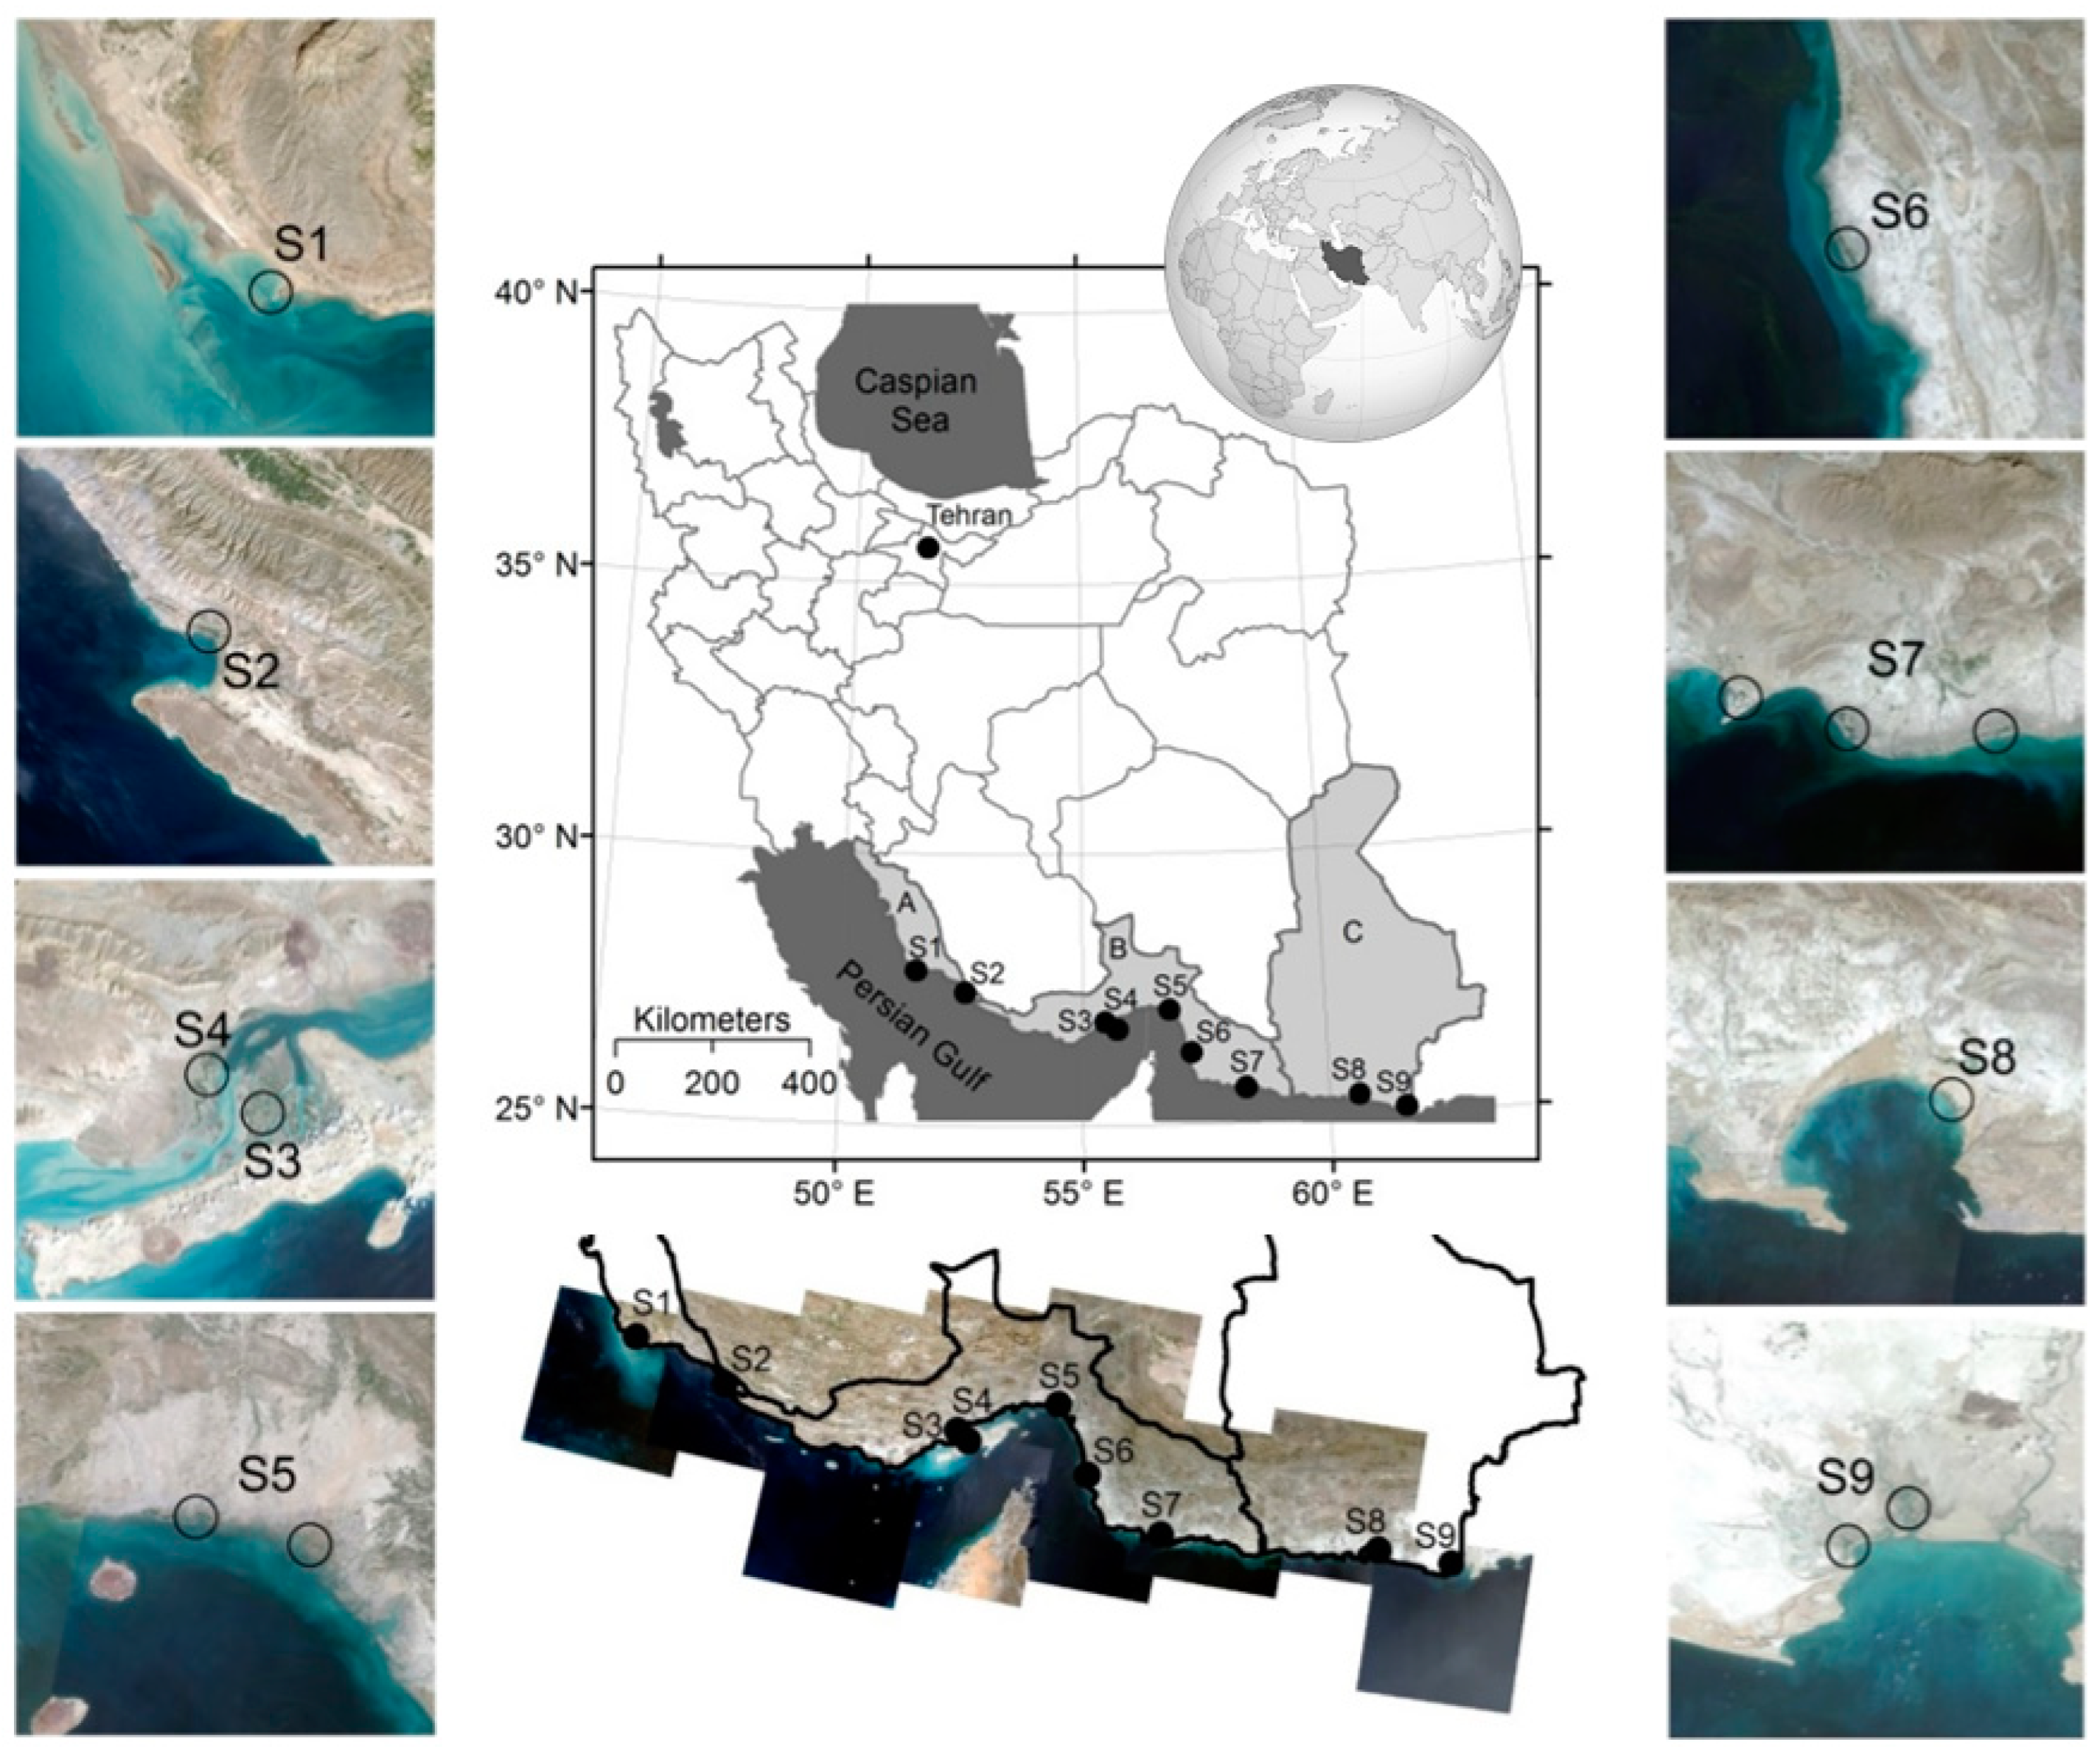
Mangrove forests along the southern coast of Iran are located between the latitudes 25°10′ to 27°55′ north and longitudes 51°25′ to 61°25′ east. The forests are a unique natural beauty in Iran and potential sites for ecotourism and recreation. Significantly dense mangroves are observed in Qeshm Island and Khamir Harbor, while they form dense and open stands within other sites. Iran’s mangroves comprise two species, i.e., grey mangrove (
Avicennia marina (Forssk.) Vierh.) and loop-root mangrove (
Rhizophora mucronata Lam.). Grey mangrove is the dominant species forming pure stands, while loop-root mangrove can be observed only in mixed stands of both species in Sirik and Jask (S6 and S7 in Hormozgan Province,
Figure 1). The mangroves are mainly threatened by natural (pest damage, storm, acid rain) and anthropogenic (oil spills, industrial wastes, infrastructure development) factors. However, establishment of protected areas in almost all mangrove sites is an effective management tool extensively used by the government to prevent their loss and degradation. In addition to restoration, afforestation and reforestation are two management strategies successfully undertaken since 1990s supported by local communities.
All mangrove sites in Persian Gulf and Gulf of Oman coasts were considered as the study sites, i.e., Mond protected area (S1) and Nayband National Park (S2) in Bushehr Province; Hara protected area (S3), Haraye Khamir protected area (S4), Hara Tiab and Minab protected area (S5), Hara Roud-e Gaz protected area (S6), and Hara-e Gabrik and Jask protected area (S7) in Hormozgan Province; and Chabahar hara forests (S8) and Bahookalat protected area (S9) in Sistan and Baluchestan Province (
Figure 1). Some subsites are defined within each major mangrove site; however, they are considered as one site in this study. For instance, there are two different subsites within S5, i.e., the forests located at the mouth of the Shoor River and the forests distributed in Tiab Harbor estuary. Additionally, S7 has three subsites: Jask Harbour and Sourgalm and Gabrik villages. Hara Biosphere Reserve is one of 13 UNESCO biosphere reserves of Iran, registered in 1976, which consists of Qeshm Island (S3) and Khamir Harbor (S4).
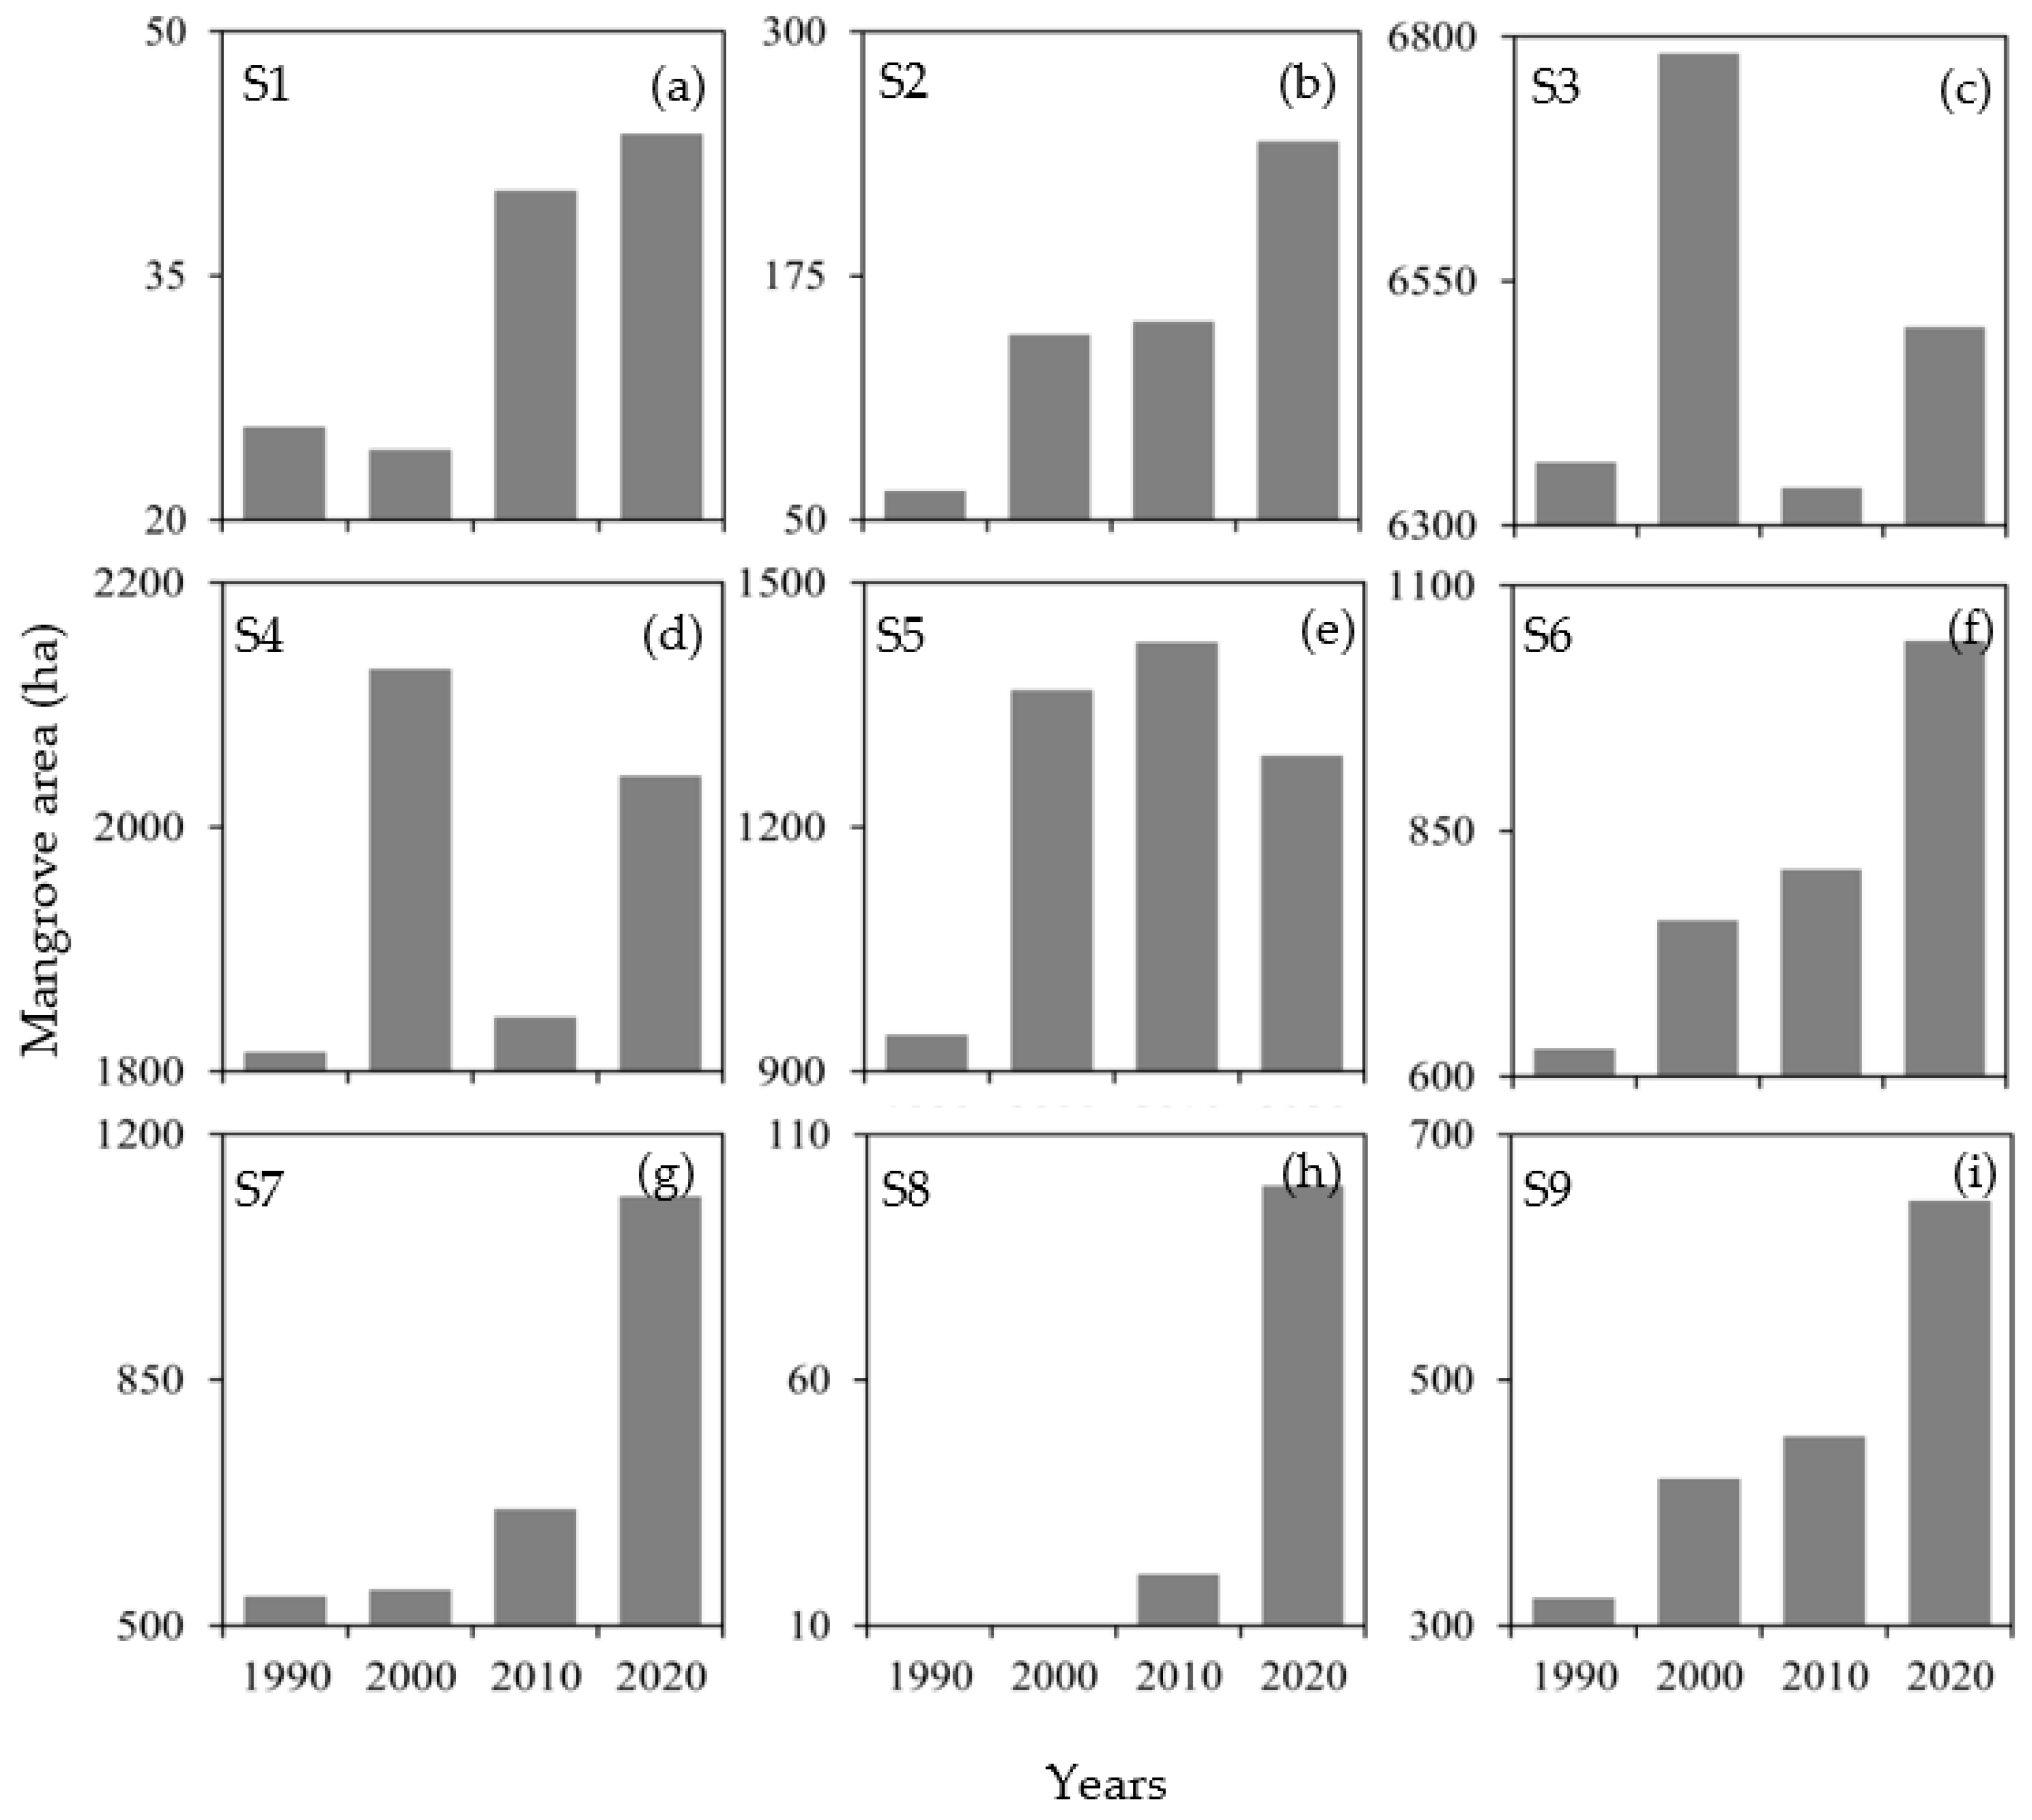
The last area of assessment of mangrove forests in 2011 using NDVI on Landsat imagery showed that S1 (17.9 ha) and S3 (5542.7 ha) comprised the smallest and largest mangrove sites, respectively. Moreover, the total area of mangroves was 11,015.1 ha. The mangrove sites in Hormozgan Province supported 93.5% (10,305.2 ha) of the total mangroves in Iran. Meanwhile, the extent of mangroves in provinces of Bushehr and Sistan and Baluchestan was 1.4% (149.8 ha) and 5.1% (560.1 ha) of the total mangroves, respectively. According to results of the study, no mangrove stands were observed in S8 in 2011.
2.2. Satellite Data and Input Bands
The Landsat time series data covering all areas of interest (i.e., S1 to S9) were considered in the present study, as the Landsat archive is the longest continuous satellite-based record of Earth’s land cover in existence, which was available for the study sites. The data were downloaded from the USGS (United States Geological Survey) EarthExplorer from 1990 to 2020, with 10-year lags (see
Table A1 for the dates of the images). The cloud-free images of Landsat 5 TM (L5), Landsat 7 ETM+ (L7), and Landsat 8 OLI (L8) were controlled for topographic distortion by employing the digital terrain model (DTM) of each region, and, if required, the images were geometrically corrected using ground control points. Atmospheric correction was also performed using FLAASH (Fast Line-of-sight Atmospheric Analysis of Spectral Hypercubes) algorithm in ENVI.
For each mangrove site, Landsat data were obtained for high- and low-tide levels, based on visual interpretation, and the tidal data obtained from WXTide32 software [
29] for the study years (i.e., 1990, 2000, 2010, 2020). We used the reference stations in Bushehr Province (Jazirat Kharg), Hormozgan Province (Jazirat Farur, Hengam Island, Bandar Abbas, Jask Bay), and Sistan and Baluchestan Province (Gwatar Bay). A single Landsat tile covered the subsites of a mangrove sites, e.g., S5, S7, and S9; however, S3 was covered by two Landsat tiles (
Figure 1).
The Landsat (i.e., L5, L7, L8) images of the study sites required a series of preprocessing prior to being used to derive the vegetation indices. In the first step, radiometric corrections were conducted with application of dark object subtraction (DOS) method on the Landsat images, to reduce atmospheric effects. In the second step, the Landsat images were geometrically corrected using rational polynomial coefficients (RPCs), with at least 10 evenly dispersed ground control points within each image tile extracted from very high resolution (VHR) images of Google Earth, UltraCam airborne images, and 1:25,000 topographic maps. The average root-mean-square errors (RMSEs) were less than 0.5 pixels for all Landsat images in both the X and Y directions.
Based on the literature on spectral signature of mangrove forests and the indices used to detect them on Landsat imagery, the required spectral wavelengths were obtained to be used in computation of the VIs and MSIs investigated in the present study (
Table 1). These spectral wavelengths were Blue (Band 1 in L5 and L7; Band 2 in L8), Green (Band 2 in L5 and L7; Band 3 in L8), Red (Band 3 in L5 and L7; Band 4 in L8), NIR (Band 4 in L5 and L7; Band 5 in L8), SWIR1 (Band 5 in L5 and L7; Band 6 in L8), and SWIR2 (Band 7 in L5, L7, and L8) (see
Table A2 for more details). Bands of SWIR1 and SWIR2 are affected by leaf water content; however, studies have shown that SWIR1 region is more efficient in mangrove recognition from open and dense terrestrial vegetation compared to SWIR2 [
7,
22].
2.3. Computation of Vegetation Indices
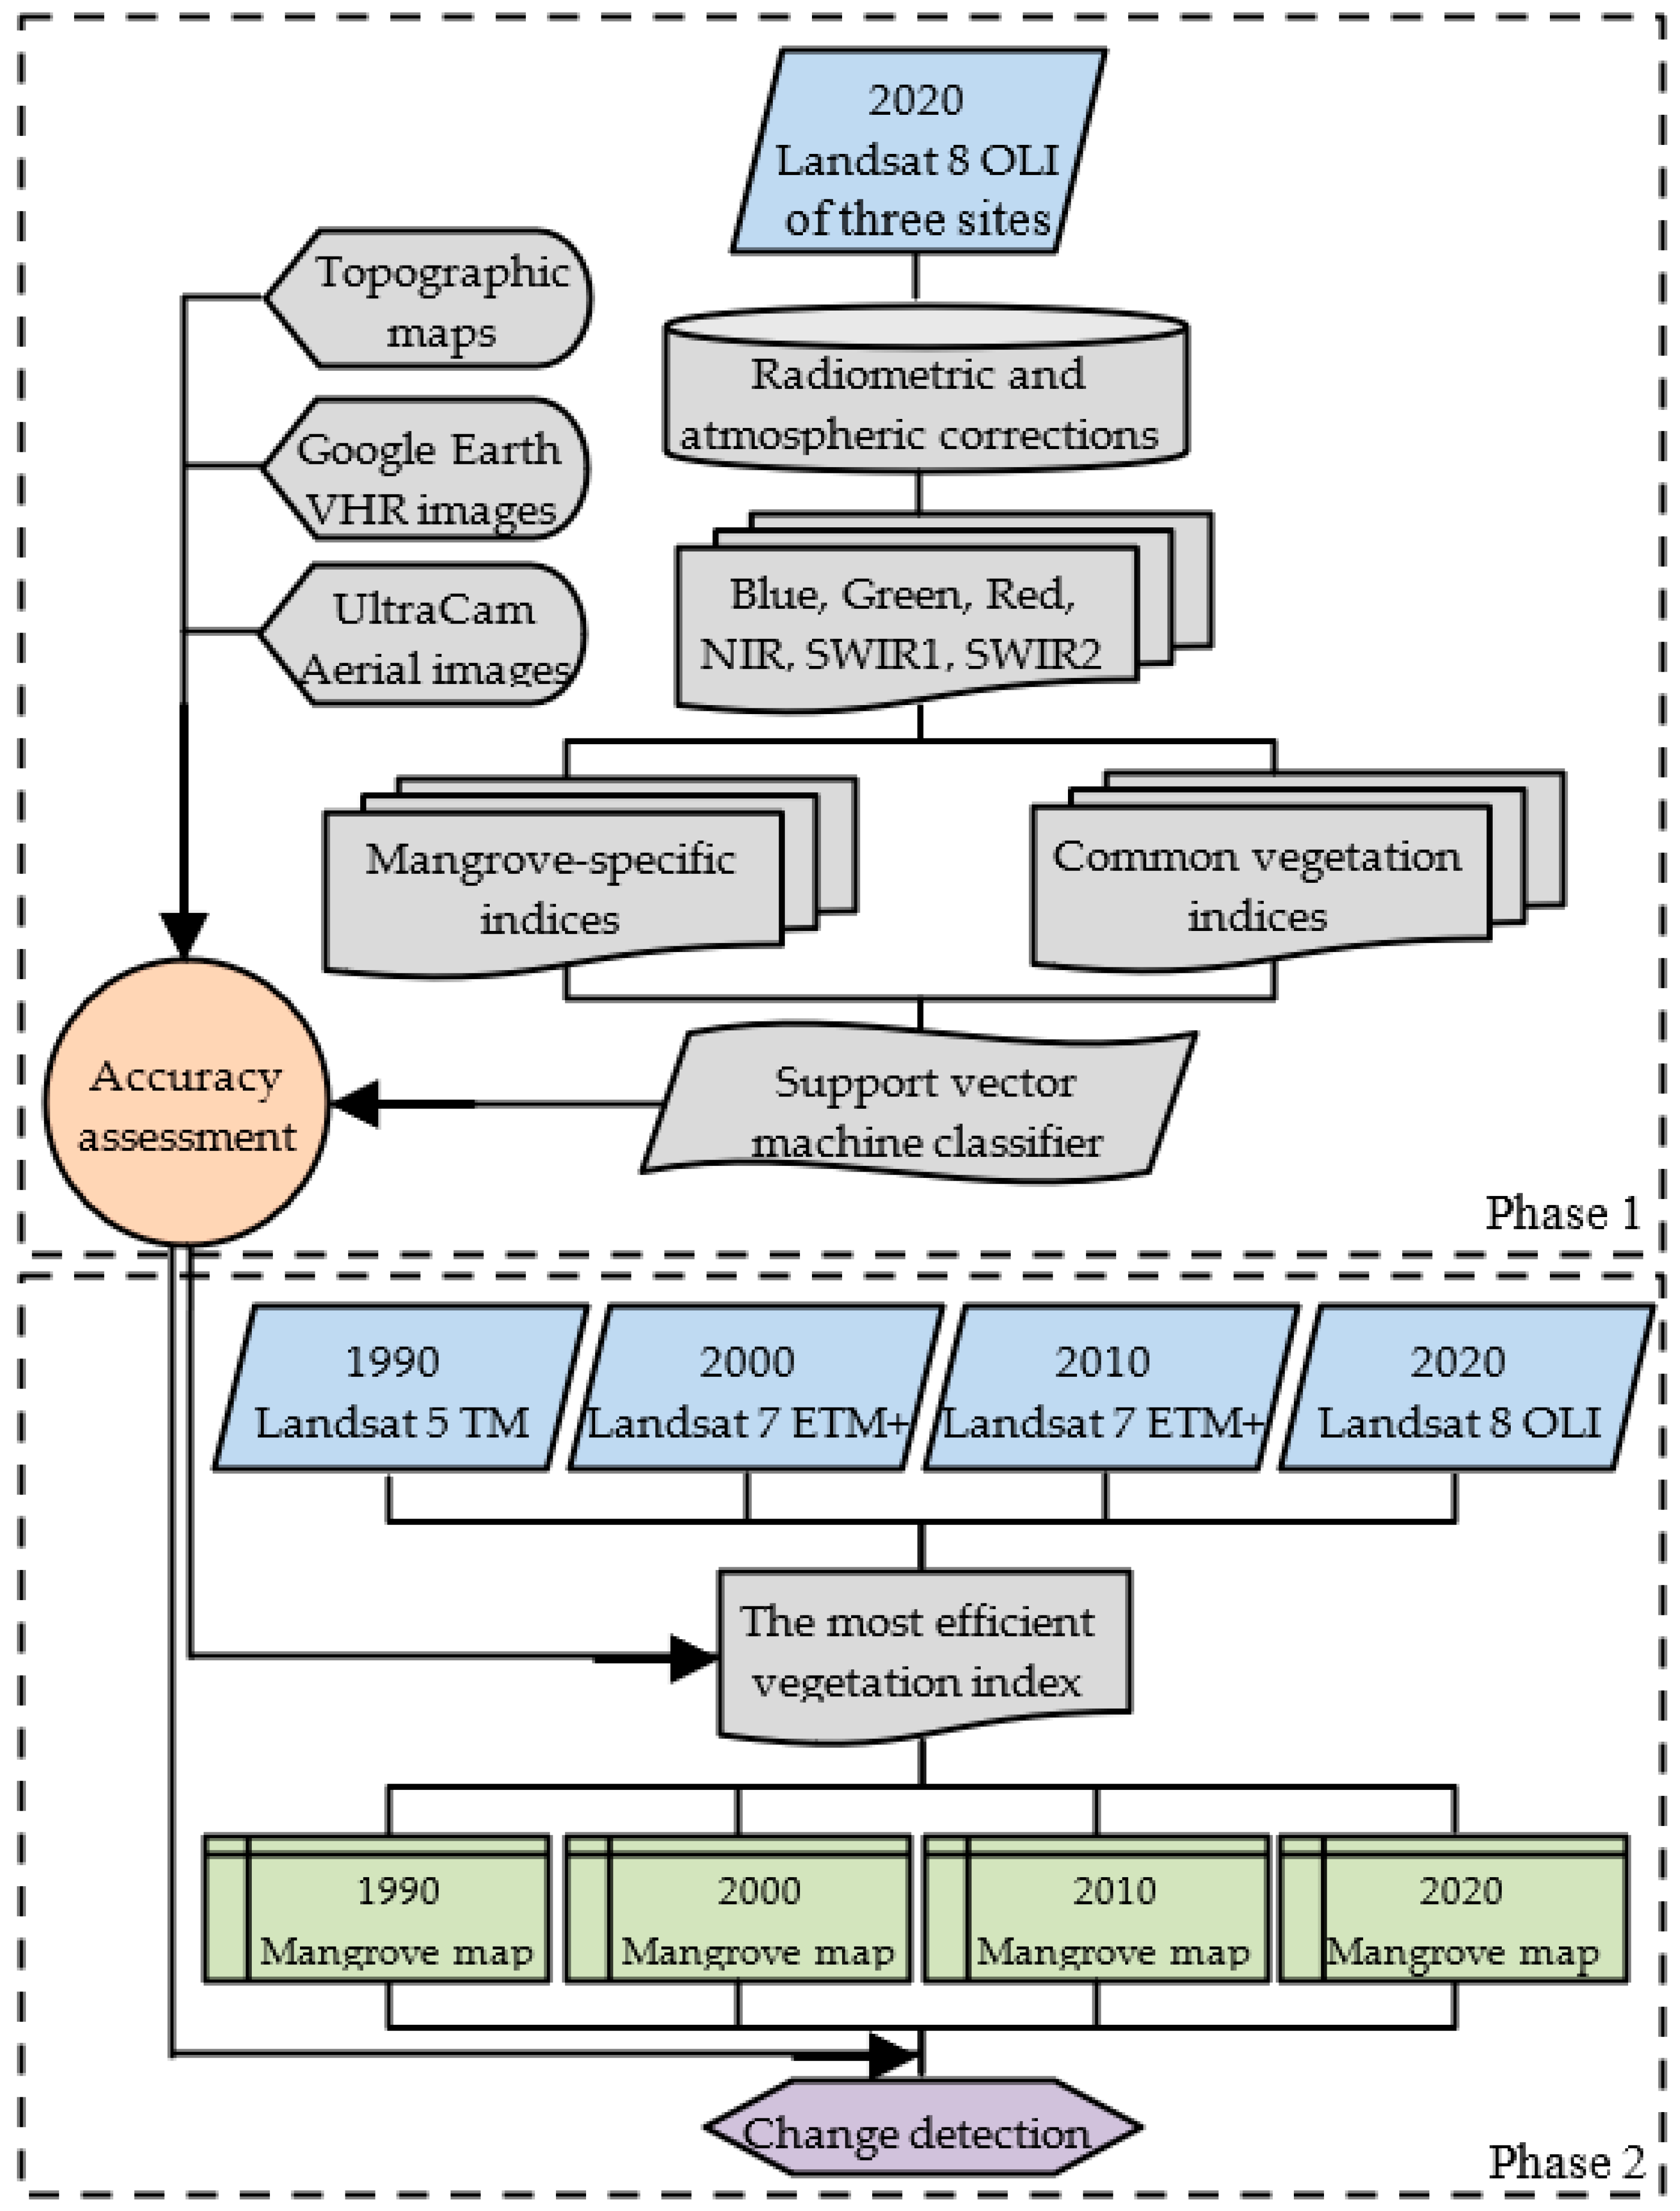
The present study had two phases (
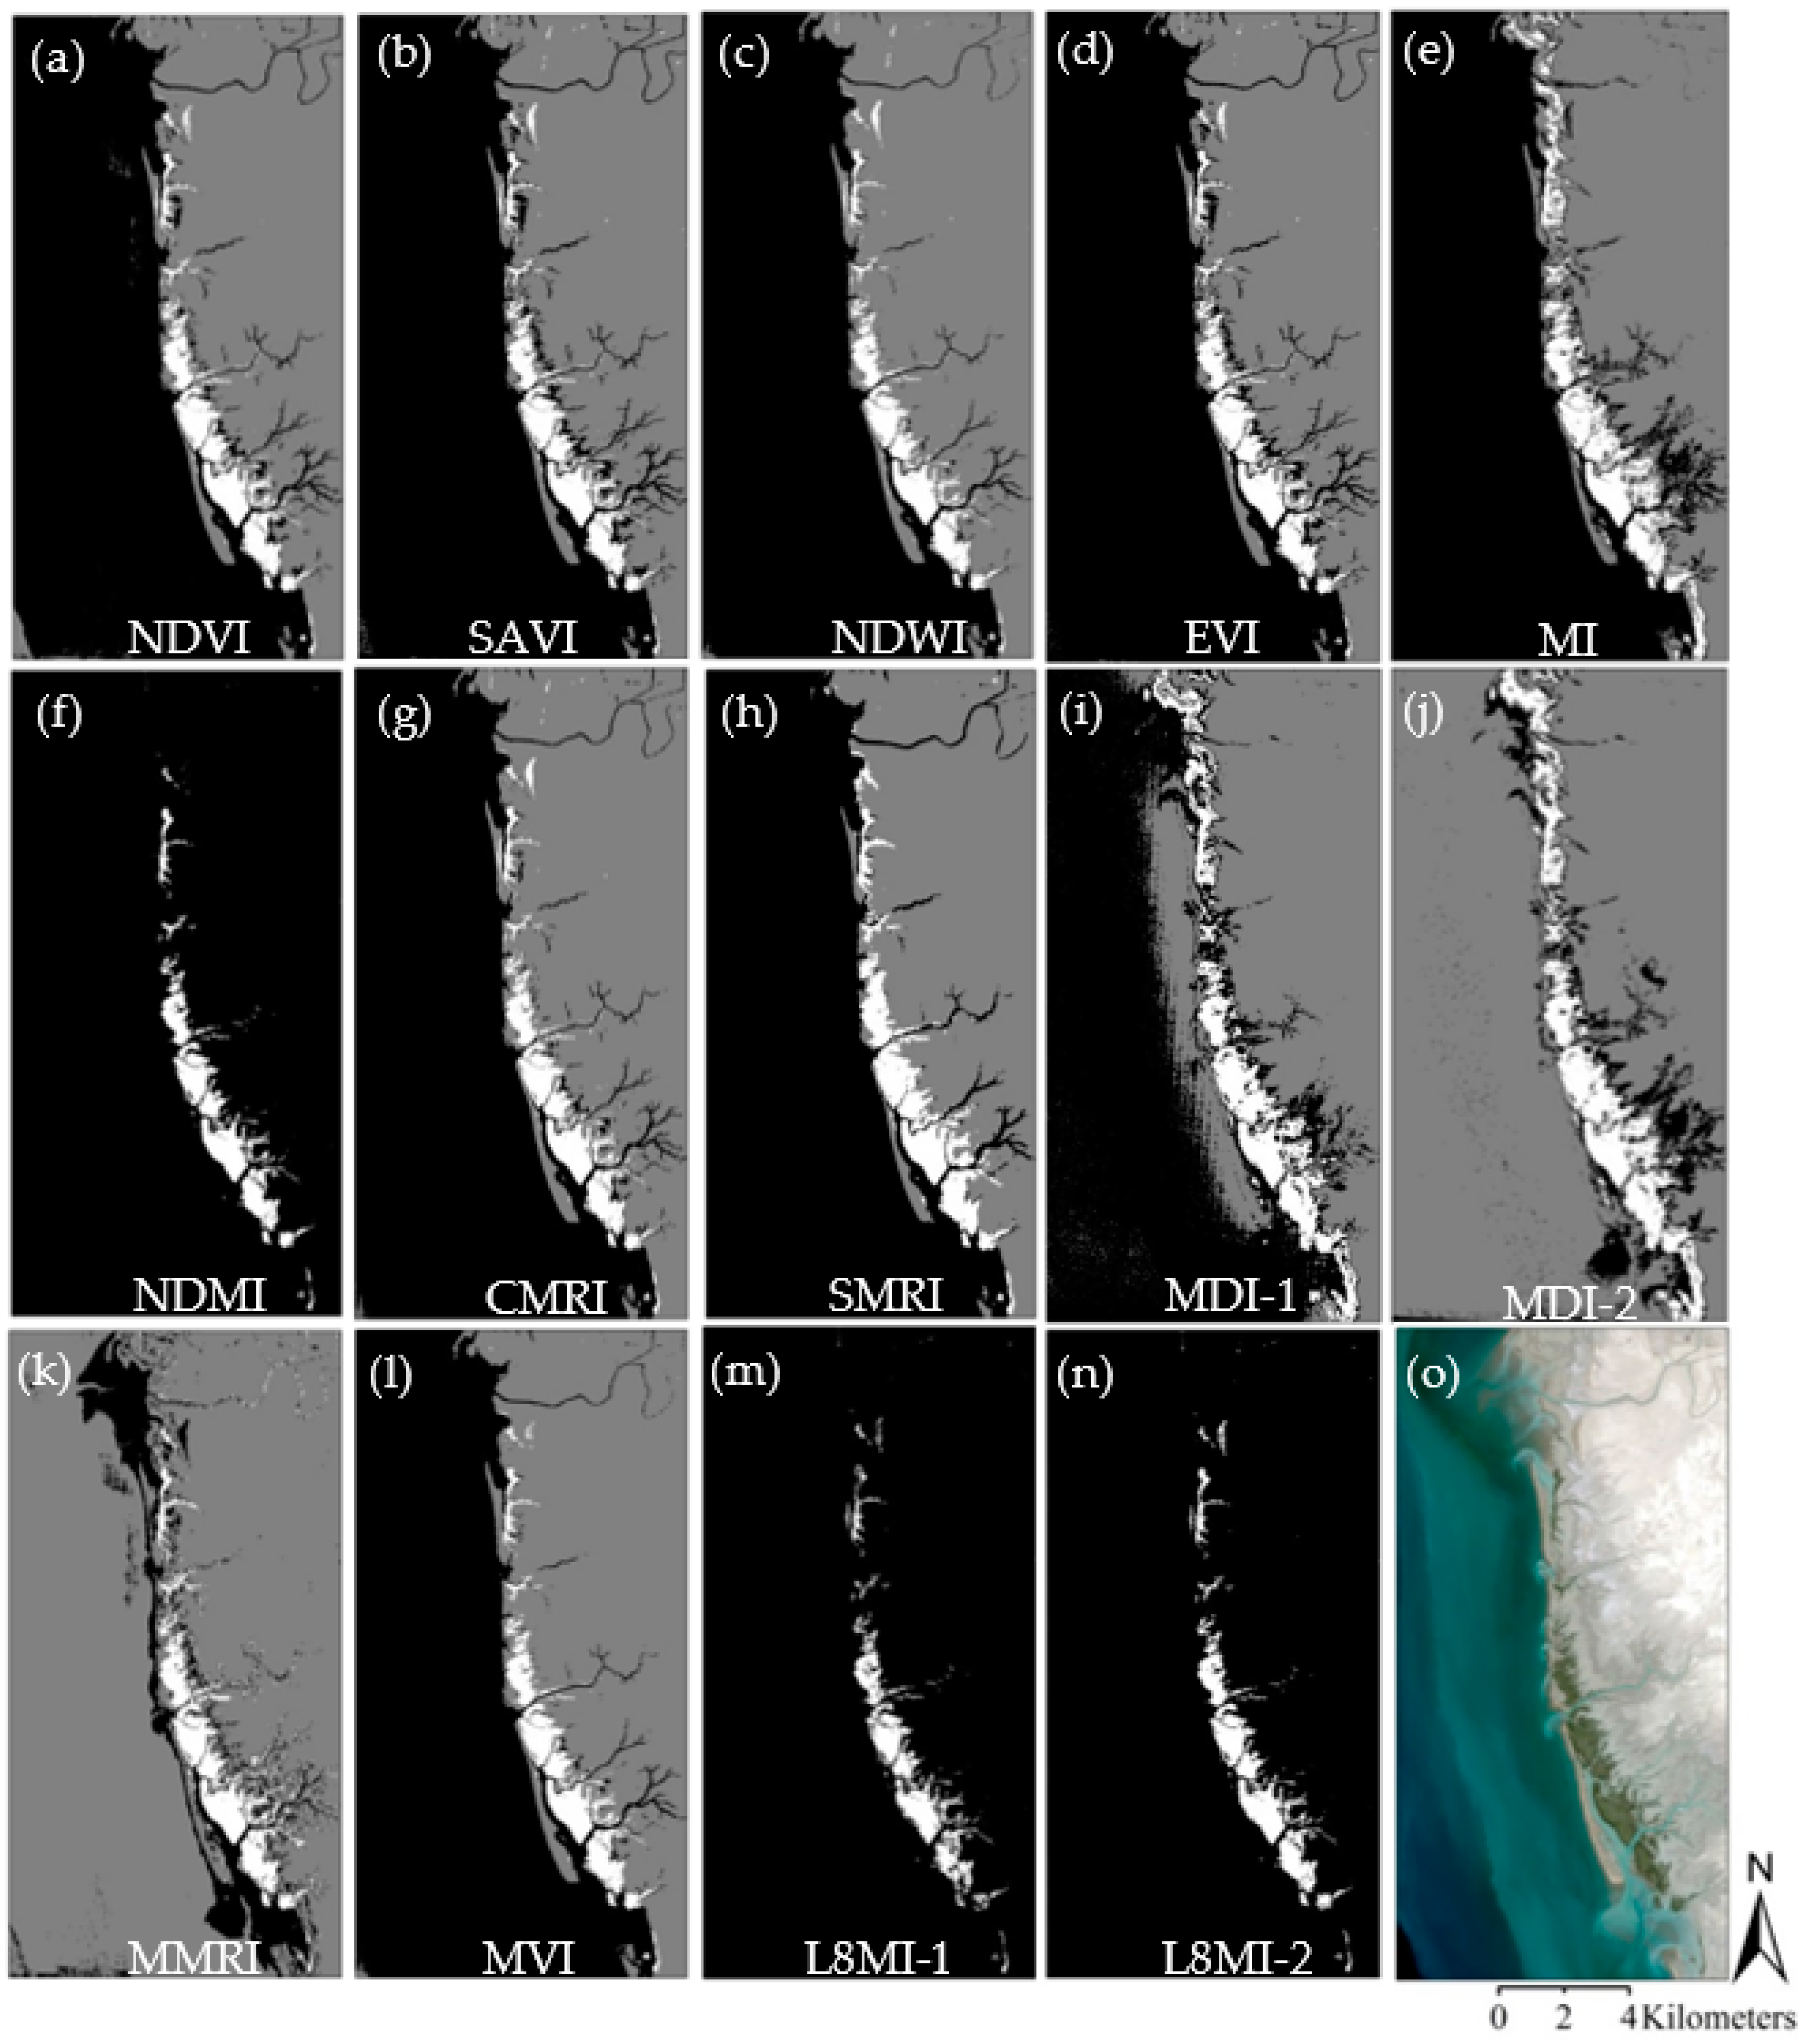
Figure 2). The first phase involved a comparative assessment of widely used VIs and MSIs that have been developed to discriminate mangroves on L8 data for 2020. The assessment of the indices was performed within three mangrove sites, i.e., S2 (Bushehr Province), S6 (Hormozgan Province), and S9 (Sistan and Baluchestan Province) to identify the most efficient index in the study areas. In the second phase, the Landsat bands (
Table A2) were used as inputs for computing the selected index for all mangrove sites (
Figure 1) in all study years (i.e., 1990, 2000, 2010, 2020).
Previous studies have used a wide range of VIs for mangrove mapping on Landsat images, so four of them were considered in this study (
Table 1). One of the most frequently used VIs is NDVI, introduced by Rouse et al. [
30]. The index was successfully implemented to delineate green vegetation, including mangrove forests, from other land use/land cover classes on different remote sensing data [
31]. For instance, Lovelock et al. [
32] indicated that NDVI is significantly correlated with canopy loss in mangrove forests. NDVI can be effectively used to monitor degradation and deforestation of mangroves. In addition to NDVI, SAVI, proposed by Huete [
33], is a popular index employed to classify mangrove and non-mangrove areas [
7,
26,
34]. SAVI considers a soil-brightness correction factor (i.e., L,
Table 1) to reduce the influence of soil brightness in open vegetation patches. As suggested by previous studies [
32,
35], the L factor is 0.75 in the present research. Normalized Difference Water Index (NDWI), developed by Gao [
36], is strongly sensitive to vegetation water content. The index has successfully been used to delineate mangrove stands on different remote sensing imagery [
25,
37]. Pastor-Guzman et al. [
38] investigated the capability of NDWI in examining biophysical variables and tracking seasonality of mangroves. According to their achievements, it was revealed that NDWI time series is reliable for monitoring mangrove water stress, since NDWI has the ability to change in proportion to canopy moisture content. While NDVI has significant correlations with green biomass and canopy chlorophyll content, EVI is more sensitive to canopy structural characteristics such as canopy architecture and leaf area index [
39,
40]. In studying mangrove forests, EVI has been found to be a reliable index in classifying mangroves and non-mangrove areas [
7,
26].
There are diverse and multiple VIs (e.g., NDVI, SAVI, NDWI, EVI) that have been developed to discriminate vegetation and measure their temporal and spatial variations. However, these indices cannot specifically characterize mangroves from other vegetation types such as terrestrial forests. The investigation by Baloloy et al. [
22] shows that the SWIR1 and SWIR2 bands are the region within which mangrove and terrestrial forests are recognizable, because of the difference in their spectral reflectance properties. Although SWIR1 and SWIR2 are helpful for mangrove and non-mangrove vegetation differentiation, the bands are not considered in formulation of common VIs. Meanwhile, some VIs may provide similar values in vegetation types such as mangrove forests and dense terrestrial vegetation. Therefore, indices have been developed utilizing Green, NIR, SWIR1, and SWIR2 wavelengths to specifically delineate mangroves considering their spectral behavior (
Table 1).
The Mangrove Index (MI) was one of the first mangrove-specific indices proposed by Winarso et al. [
27]. The index computed from L8 Band 5 (NIR) and Band 6 (SWIR1) was successfully used to map the mangrove forests in the east of Indonesia. The authors reported the efficiency of MI utilizing L8 near- and short-wave infrared bands in their case study; however, the accuracy of mangrove mapping using MI on L8 in different mangrove habitats has not been examined.
Shi et al. [
28] suggested an index, i.e., Normalized Difference Mangrove Index (NDMI), to separate mangroves from terrestrial vegetation using L8 Green and SWIR2 wavelengths. NDMI combined with two indices (Spectral Match Degree (SMD); SWIR Absorption Depth (SIAD)) significantly improved mangrove forest identification on L8 in a national nature reserve in the south of China. Additionally, Ali and Nayyar [
7] found that NDMI had the highest user accuracy (UA) of mangrove forests among different indices (i.e., NDVI, SAVI, EVI, five MSIs) on L8 in the south of Pakistan, although its producer’s accuracy (PA) was not acceptable.
Subtraction of NDVI and NDWI obtained from L8 was considered a new mangrove discriminating index, called Combined Mangrove Recognition Index (CMRI) [
25]. The index employs spectral signatures and morphological characteristics to distinguish mangroves from non-mangrove vegetation types. The mangroves of three habitats in India and Bangladesh were well-characterized by CMRI on L8 images. Comparison of CMRI and NDMI showed that the first index could extract L8 pixels covered by mangroves, while the pixels extracted by the second index were a mixture of mangroves and barren land [
7].
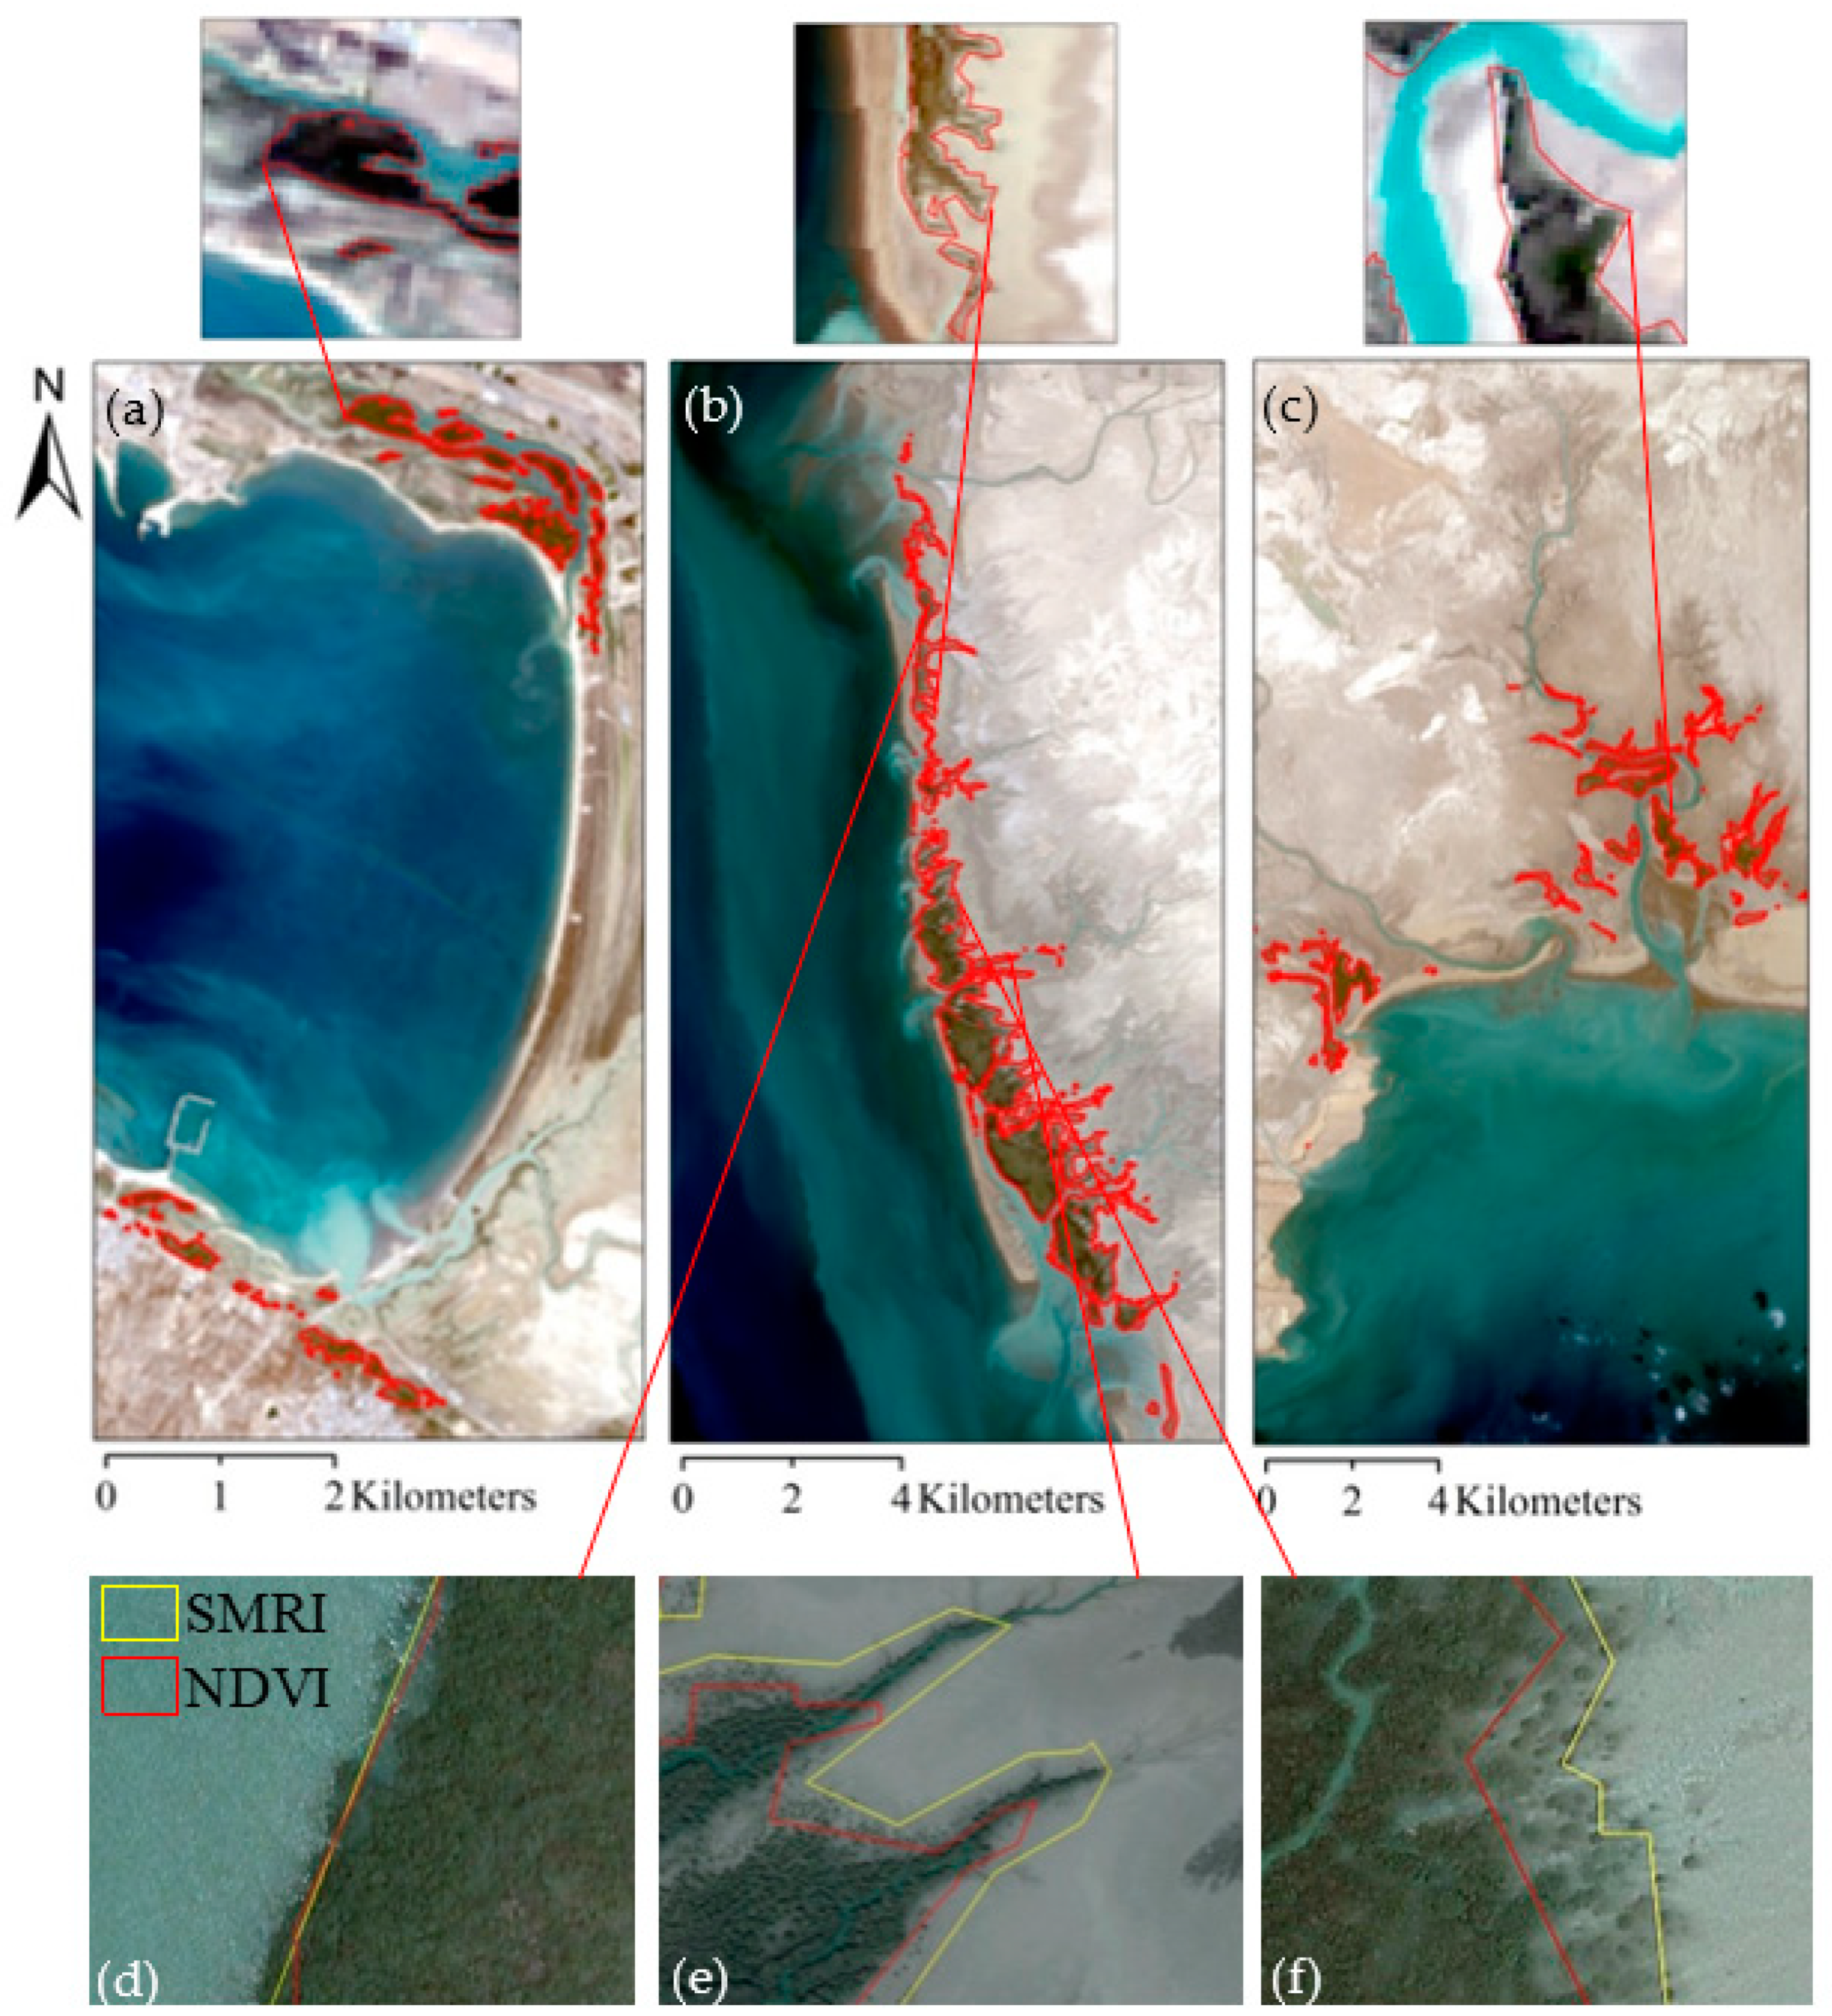
One of the outstanding characteristics of mangrove ecosystems is periodic submerging of moderate and low-height intertidal stands by fluctuating tide levels. Consequently, the spectral signature of mangroves can be influenced by submerging or emerging status of canopy. Mapping mangrove forests with single satellite images, without consideration of tide levels, may result in under- or overestimation of their extent. A recent study by Xia et al. [
41] proposed an index, the Submerged Mangrove Recognition Index (SMRI), using two satellite images of high- and low-tide levels to accurately identify mangrove forests. The SMRI considers NIR wavelength and NDVI to discriminate submerged mangroves that are not characterized by object-oriented classification of NDVI images. The procedure significantly enhances the classification accuracy of mangrove forests. A number of researchers, namely Li et al. [
42] and Xia et al. [
26], utilized the SMRI as a reliable analytical instrument to map mangrove forests on L8 data.
Mapping mangrove forests within a nature reserve in the south of China, Wang et al. [
43] created a new index (Mangrove Discrimination Index (MDI)) to discriminate mangroves from non-mangrove vegetation on different satellite images. The authors suggested using SWIR1 and SWIR2 wavelengths to compute MDI1 and MDI2, respectively, although their investigation revealed that MDI2 performed better than MDI1 on L8 data. However, Mukhtar et al. [
44] found that MDI1 was more efficient than MDI2 for mapping mangrove forests in Indonesia on L8 images.
The Modular Mangrove Recognition Index (MMRI) was proposed by Diniz et al. [
45] to enhance the contrast of mangrove forests against non-mangroves in the east of Brazil. The index was a modified version of the Normalized Difference Drought Index (NDDI) (Equation (1)). The NDWI was replaced by the Modified Normalized Difference Water Index (MNDWI) (Equation (2)) [
46] to construct MMRI.
The assessment of MMRI on L8 imagery showed that the index achieved more robust results than NDVI, NDWI, and CMRI in discrimination of mangroves from other vegetation types [
45]. Additionally, the index was successfully implemented by Sahadevan et al. [
47] to map mangroves in the south of India.
The Mangrove Vegetation Index (MVI) was also constructed with the objective of mangrove mapping on L8 and Sentinel-2 data [
22]. The index uses Green, NIR, and SWIR1 wavelengths to rapidly and accurately map mangroves. MVI had successfully discriminated mangroves from non-mangroves within six study sites in the Philippines; however, its performance must still be explored within other habitats and be compared to diverse MSIs available for mangrove mapping.
Recently, a new MSI was developed by Ali and Nayyar [
7] to specifically separate mangrove forests from other vegetation types on L8 imagery. The Landsat 8 Mangrove Index (L8MI) uses Advanced Slope-based Spectral Transformation (ASST) (Equation (3)) to maximize the difference between mangroves and other features. The SWIR1 and SWIR2 wavelengths (L8 bands 6 and 7, respectively) (
Table A2) can be utilized in Equation (3) to produce ASST_1 and ASST_2, respectively.
The combination of ASST_1 and ASST_2 images and SAVI was called L8MI_1 and L8MI_2, respectively. A comparative investigation revealed that both versions of L8MI were more efficient than VIs (e.g., NDVI, SAVI) and MSIs (i.e., CMRI, NDMI) in discrimination of mangroves in the south of Pakistan, although the robustness of the index has not been evaluated within other mangrove forests.
Table 1.
The commonly used vegetation indices (VIs) and mangrove-specific indices (MSIs) developed for mangrove mapping. All of the indices have been used on Landsat images.
Table 1.
The commonly used vegetation indices (VIs) and mangrove-specific indices (MSIs) developed for mangrove mapping. All of the indices have been used on Landsat images.
| | Vegetation Indices | Formula | Reference |
|---|
| VIs | NDVI (Normalized Difference Vegetation Index) | (NIR − Red)/(NIR + Red) | [30] |
| SAVI (Soil Adjusted Vegetation Index) | | [33] |
| NDWI (Normalized Difference Water Index) | (Green − NIR)/(Green + NIR) | [36] |
| EVI (Enhanced Vegetation Index) | | [39] |
| MSIs | MI (Mangrove Index) | (NIR − SWIR1/NIR × SWIR1) × 10,000 | [27] |
| NDMI (Normalized Difference Mangrove Index) | SWIR2 − Green/SWIR2 + Green | [28] |
| CMRI (Combined Mangrove Recognition Index) | NDVI − NDWI | [25] |
| SMRI (Submerged Mangrove Recognition Index) | | [41] |
| MDI (Mangrove Discrimination Index) | (NIR − SWIR)/SWIR | [43] |
| MMRI (Modular Mangrove Recognition Index) | (|MNDWI| − |NDVI|)/(|MNDWI| + |NDVI|) | [45] |
| MVI (Mangrove Vegetation Index) | NIR − Green/SWIR1 − Green | [22] |
| L8MI (Landsat 8 Mangrove Index) | [ASST > T] and [SAVI > T] | [7] |
Table 1 summarizes the common vegetation and mangrove-specific indices investigated in the present study. The VIs were frequently used to map mangroves in previous studies. Meanwhile, the selected MSIs were the indices that have been developed or successfully implemented to recognize mangroves on L8 imagery.
2.5. Accuracy Assessment
As the last part of phase 1, the performance and capability of the VIs and MSIs (
Table 1) were quantitatively compared for depicting mangrove and non-mangrove areas. For such quantitative comparison, approximately 24,000 validation pixels were randomly selected for three land cover types (i.e., 6000 pixels for mangroves, 9000 pixels for soil, 9000 pixels for water) in three study sites: S2, S6, and S9. Regarding the difficulty in obtaining the ground control points of land cover types over such a large extent, images with very high spatial resolution obtained from airborne remote sensing (i.e., aerial photographs of 1992 and 2006 with scale of 1:20,000 and 1:40,000, respectively; aerial images taken by UltraCam-D and Xp digital airborne cameras from 2014 to 2018, with approximate pixel size of 7 cm) and Google Earth historical image data (from 1990 to 2020) were considered as the references data in the present study. The number of random pixels was selected according to approximate estimation of area ratio of each land cover type; 70% of these pixels were considered for training the classifier, and 30% were used for accuracy verification. By constructing the confusion matrix and calculating the accuracy, precision, recall, and F1-score of mangroves, in addition to overall accuracy (OA) and kappa (K), an accuracy assessment was performed to choose the most robust index within three study sites.
In phase 2, the selected index was implemented to map mangrove forests within all study sites (
Figure 1), for the three 10-year periods (
Figure 2). Total validation pixels considered for training and test in all study sites were approximately 65,000 random pixels, including 17,000 pixels of mangroves, 23,000 pixels of soil, and 25,000 pixels of water. The accuracy of final maps was ascertained by calculating the accuracy statistics (i.e., accuracy, precision, recall, F1-score), based on a confusion matrix constructed from 30% of total validation pixels in all study sites. The results of the statistics for mangrove class were considered to reflect the accuracy of mangrove mapping on Landsat images.


