Article

Crop Water Productivity Mapping and Benchmarking Using Remote Sensing and Google Earth Engine Cloud Computing

1
Department of Biological and Agricultural Engineering, University of California Davis, Davis, CA 95616, USA
2
Department of Land, Air and Water Resources, University of California Davis, Davis, CA 95616, USA
3
School of Civil Engineering, Iran University of Science & Technology, Tehran 16846, Iran
4
Department of Water Management, Delft University of Technology, 2600 AA Delft, The Netherlands
5
Water Engineering Department, Urmia Lake Research Institute, Urmia University, Urmia 57179-44514, Iran
6
Institute of Geodesy, University of Stuttgart, Stuttgart 70174, Germany
7
Department of Physical Geography and Ecosystem Science, Lund University, S-22362 Lund, Sweden
*
Author to whom correspondence should be addressed.
Remote Sens. 2022, 14(19), 4934; https://doi.org/10.3390/rs14194934
Submission received: 16 August 2022 / Revised: 24 September 2022 / Accepted: 29 September 2022 / Published: 2 October 2022

Abstract

:
Scarce water resources present a major hindrance to ensuring food security. Crop water productivity (WP), embraced as one of the Sustainable Development Goals (SDGs), is playing an integral role in the performance-based evaluation of agricultural systems and securing sustainable food production. This study aims at developing a cloud-based model within the Google Earth Engine (GEE) based on Landsat -7 and -8 satellite imagery to facilitate WP mapping at regional scales (30-m resolution) and analyzing the state of the water use efficiency and productivity of the agricultural sector as a means of benchmarking its WP and defining local gaps and targets at spatiotemporal scales. The model was tested in three major agricultural districts in the Lake Urmia Basin (LUB) with respect to five crop types, including irrigated wheat, rainfed wheat, apples, grapes, alfalfa, and sugar beets as the major grown crops. The actual evapotranspiration (ET) was estimated using geeSEBAL based on the Surface Energy Balance Algorithm for Land (SEBAL) methodology, while for crop yield estimations Monteith’s Light Use Efficiency model (LUE) was employed. The results indicate that the WP in the LUB is below its optimum targets, revealing that there is a significant degree of work necessary to ameliorate the WP in the LUB. The WP varies between 0.49–0.55 (kg/m3) for irrigated wheat, 0.27–0.34 for rainfed wheat, 1.7–2.2 for apples, 1.2–1.7 for grapes, 5.5–6.2 for sugar beets, and 0.67–1.08 for alfalfa, which could be potentially increased up to 80%, 150%, 76%, 83%, 55%, and 48%, respectively. The spatial variation of the WP and crop yield makes it feasible to detect the areas with the best and poorest on-farm practices, thereby facilitating the better targeting of resources to bridge the WP gap through water management practices. This study provides important insights into the status and potential of WP with possible worldwide applications at both farm and government levels for policymakers, practitioners, and growers to adopt effective policy guidelines and improve on-farm practices.

1. Introduction

Consuming more than 70% of freshwater on a global scale [1], the agricultural sector needs to increase food production by 60% and 110% in developed and developing countries by 2050, respectively, to secure future food demands [2]. Over the last decades, due to anthropogenic pressure and climate change, water resources have been on the wane, pushing the earth’s sustainability to its limits [3,4]. With prolonged drought events and an increasing demand for agricultural outputs, water scarcity and the availability of arable lands are posing threats to food production. Therefore, increasing water use efficiency and crop production per unit of consumed water, which is known as crop water productivity (referred to hereinafter as WP) (kg/m3), is the key strategy to ensure food security. The United Nations (UN) perceives WP as one of the Sustainable Development Goals (SDGs), which should be increased considerably by 2030 (SDGs2.3 and SDGs6.4). In most areas, crop WP is far below its optimum level, implying that there must be significant potential to improve WP [5,6].
WP is typically estimated using crop yield and evapotranspiration (ET). The crop yield depends on factors such as soil fertility, disease control, and agricultural practices, whereas ET varies with the rainfall pattern, soil moisture, irrigation and drainage systems, and climatology. Therefore, on-farm practices play an integral role in improving WP. Hence, mapping WP at the catchment scale is a prerequisite to spatially detecting areas with good and poor on-farm management practices and evaluating the effectiveness of agricultural management strategies [7]. While a wealth of knowledge on WP at a fine spatiotemporal resolution is of paramount importance to understanding the water–food relationship, monitoring water use efficiency, and following through with productivity goals, such information is not available in most regions [6,8]. In addition, ground measurements, due to the nature of spatial heterogeneity at the basin scale and routine difficulties in taking measurements, are unable to capture spatial trends over large areas [9,10].
Remote sensing is becoming the most viable alternative for water productivity assessments and estimating WP components with multiple temporal and spatial resolutions from farm to continental scales on a pixel-by-pixel basis [11,12,13,14,15]. Remote-sensing-based estimates of ET can be obtained from satellite multi-spectral measurements based on Surface Energy Balance models, making them feasible for providing ET maps at different scales [16,17,18]. Among several surface energy balance models including Mapping Evapotranspiration at High Resolution with Internalized Calibration (METRIC) [19], Atmosphere-Land Exchange Inverse (ALEXI) [20], Simplified Surface Energy Balance (SSEBop) [21], and the Surface Energy Balance System (SEBS) [22], SEBAL (Surface Energy Balance Algorithm for Land) [17,23] has been implemented successfully worldwide across different regions and is recognized as one of the most suitable models for estimating ET without prior knowledge of site-specific parameters such as the field conditions, practices, and crop type [24,25,26,27]. Furthermore, the spatial variation of crop yield can be quantified from satellite measurements with an acceptable accuracy at a high resolution based on the Light Use Efficiency (LUE) concept [28,29,30,31]. Such remote-sensing-based applications allow for the determination of water productivity gaps [32] independent of the site-specific conditions and in situ measurements.
The Lake Urmia Basin (LUB), located in northwestern Iran, is an endorheic basin facing environmental and socio-economic challenges due to the human-initiated pressure and impact of climate extremes on water resources [33,34,35,36]. Designated as a UNESCO Biosphere Reserve, Lake Urmia is on the verge of dying and with no maintenance, it will endanger the unique ecosystem in the area [37,38,39,40]. The majority of studies blame anthropogenic factors, in particular, a high agricultural water demand and the expansion of irrigated lands with low efficiency, as the primary culprits for the desiccation of Lake Urmia [34,35,41]. Despite the urgent call at the governmental level for ameliorating the detrimental impacts of the current modes of agricultural water production and level of productivity, the preliminary questions of (i) ‘where are we’, (ii) ‘what are the goals’, and (iii) ‘how to achieve them’ have not yet fully answered given the technical limitations and complexities of the basin. The paucity of irrigation, the current water use practices, and the demand for information have proven considerable constraints, hindering the quantification of water productivity and the tracking of the progress of on-farm practices in the basin [33]. The lack of such guiding insights due to the unavailability of relevant data has limited the ability to set WP targets, bridge the yield and productivity gaps, benchmark WP values, and report them to decision-makers. In light of this, analyzing agricultural water use, production, and WP at a high spatiotemporal resolution is of strategic importance to mitigating water scarcity and informing policymakers to better understand the complexities associated with sustainable water resources management.
To benchmark WP, some recent studies have evaluated WP at global and local scales. The first benchmarking assessment at a global level was published by Zwart and Bastiaanssen [42] and Mekonnen and Hoekstra [43] with a 95% percentile and a 90% percentile, respectively, based on the compiled WP values for individual crops. Zwart et al. [7] also created global WP maps for rainfed and irrigated wheat as benchmarks for a productivity analysis and performance-based comparison. In an interesting study, Bastiaanssen and Steduto [6] introduced a Global Water Productivity Score (GWPS), which is a normalized standard scale analogous to grading systems such as Richter (for earthquakes) or Beaufort (for wind force) for scoring a given area’s WP against global WP values. Though such studies are valuable for reflecting intrinsic agricultural productivity capacities at a global level as well as elucidating planetary boundaries, on a local scale, they may not appear to be that informative and, thus, conducive to local farmers, practitioners, and agricultural departments’ adoption of the WP concept. To this end, regional-scale governance should be fully aware of the WP margin, and the extent of the WP gap must be closed in the domains under these governments’ respective jurisdictions to successfully put the WP concept into practice [6,44].
To the best of our knowledge, this is the first study aiming at benchmarking the WP of major crops in different agricultural sites of the LUB in detail to evaluate the implemented water-saving policies and stipulate the productivity gap with respect to its achievements. Our study attempts to provide insights into the aforementioned questions on the actual status, realistic goals, and untapped potentials of the agricultural sector in the LUB by utilizing Landsat -7 and -8 satellite imagery. Using the Google Earth Engine (GEE) platform [45], an open-source model was developed to estimate ET and crop yield based on the geeSEBAL [46] and LUE concept, respectively, at a high spatial resolution (30 m resolution). This cloud-based approach could also be a practical way of overcoming data collection challenges concerning data-scarce regions and providing WP maps on a global scale in an independent manner. Moreover, we analyzed so-called “bright spots” or higher WP boundaries as target WP values and, similarly, “hot spots” as lower boundaries where improvements are required to help decision-makers understand the extent of improvements as well as the locations of bad and good practices over the major agricultural districts.

2. Materials and Methods

2.1. Description of the Study Area

Geographically, the Lake Urmia Basin (LUB), with a total surface area of 52,000 km2, is one of the major river basins located in the northwest of Iran between 35.6°N–38.5°N latitude and 44.1°E–47.8°E longitude. The mean annual precipitation varies spatially from 200 mm up to 800 mm in the basin and the temperature from 3 °C to 12 °C (ranging from −10 °C in December to 30 °C in August) [47], classifying LUB as a semi-arid region. Agriculture plays a fundamental role in the economy and livelihoods of rural provinces in LUB, while accounting for more than 90% of water resource consumption in the whole basin. Owing to aggressive agricultural development accompanied by the overexploitation of surface and groundwater resources across the LUB, the inflow from 14 rivers to the lake has decreased by 56% and groundwater withdrawal jumped from 1200 MCM in 1984 to 2200 MCM in 2013 [48].
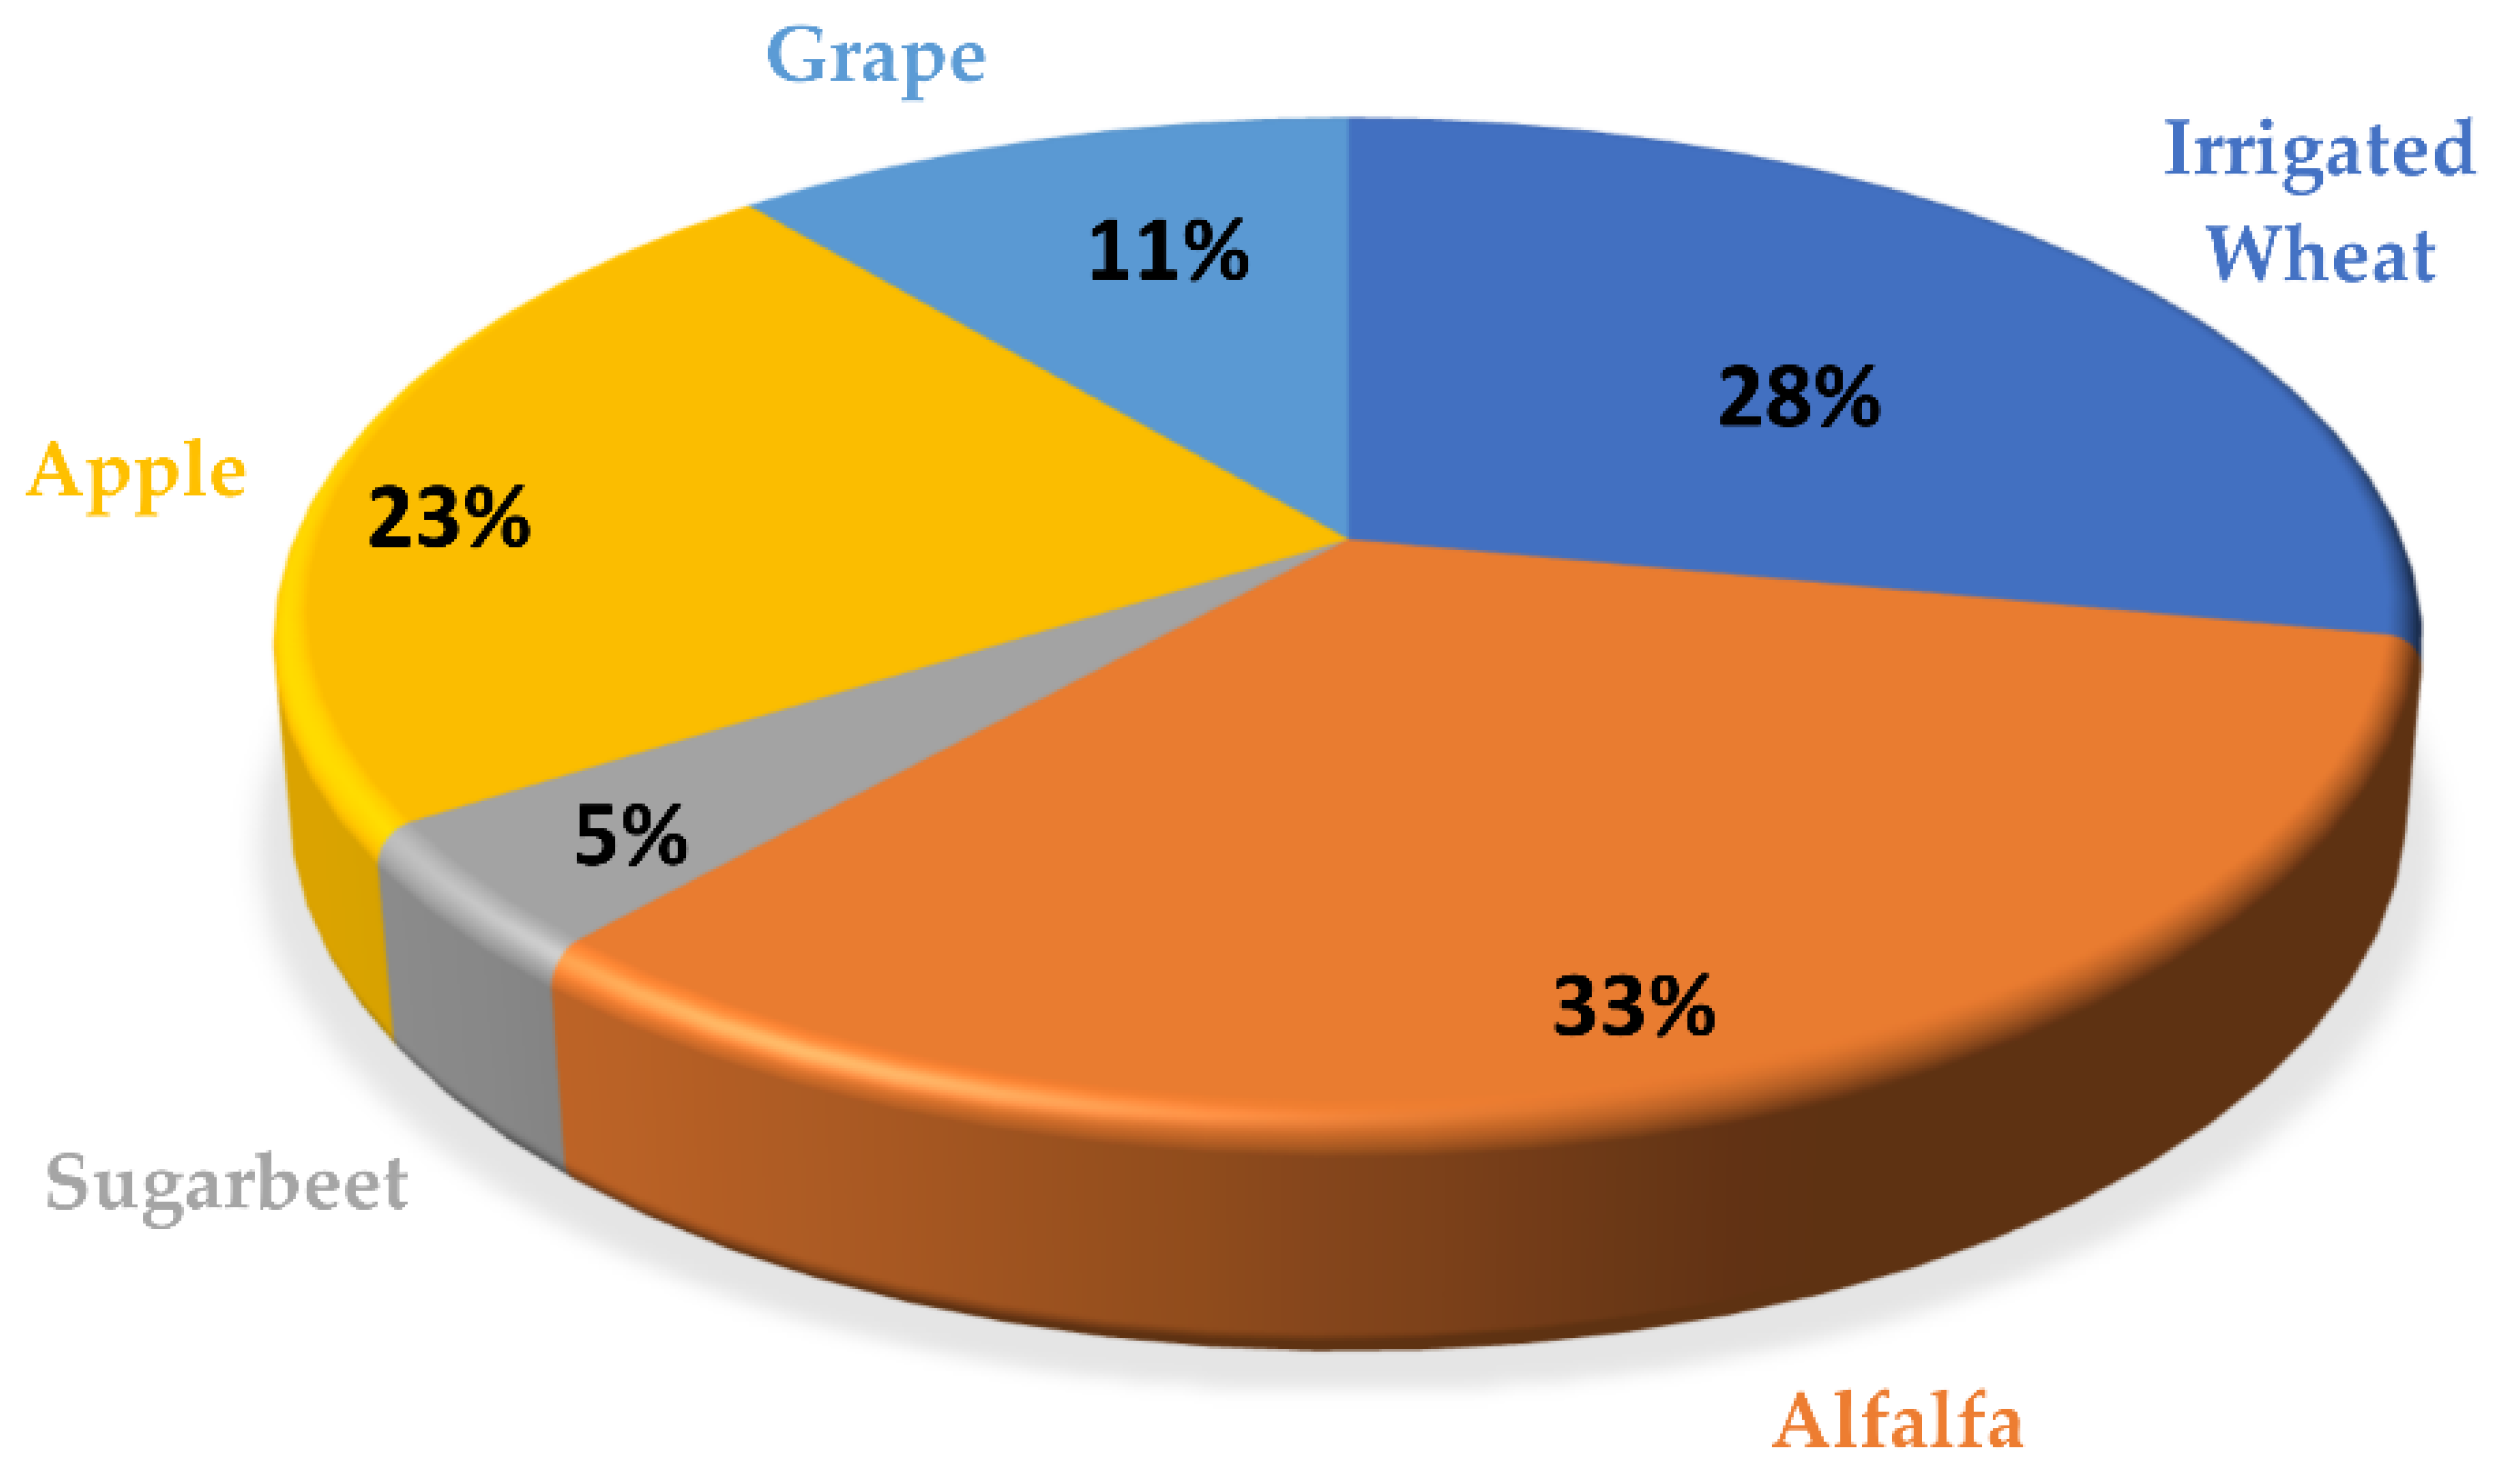
Figure 1 shows the location of LUB along with the position of three major agricultural districts in the west of LUB (WLUB), south of LU (SLUB), and southwest of LUB (SWLUB). These zones cover Urima, Miandoab, Naghadeh-Oshnavie, and Mahabad plains, which have intensive cropping systems in LUB. The selected crops and their related cultivated area for this study are recorded in Table 1 for 2019. In addition, the irrigated areas for wheat, apples, grapes, alfalfa, and sugar beets for the entire basin are demonstrated in Figure 2.
Established in 2013 with the aim of bringing together regional stakeholders, legislators, and international cooperatives, the Urmia Lake Restoration National Committee (ULRNC) initiated a set of prompt actions under the Lake Urmia Restoration Program (ULRP). One of the major objectives of the developed roadmap, with the highest contribution to LU’s restoration, was to “control and decrease agricultural water use by 40%” [48]. To this end, a set of water conservation technologies were implemented to replace traditional irrigation with more water-efficient systems such as pressurized, drip, and sprinkler irrigation, mostly in SLUB and SWLUB, to enhance water use efficiency. Nevertheless, the impact of such interventions on water use efficiency and WP is under question and needs to be assessed.

2.2. Methodology

2.2.1. SEBAL and geeSEBAL Model Description

Following the SEBAL methodology, the degree of actual evapotranspiration originates from latent heat flux (LE) as a residual of the surface energy balance (Equation (1)). geeSEBAL is a version of the SEBAL algorithm implemented within GEE by Laipelt et al. [46] in JavaScript and Python environments. geeSEBAL makes it possible to apply the energy balance equation across the globe in an entirely independent manner with high-performance computing. The calculation of the latent heat flux is as follows:
LE = RnHG
where H is instantaneous sensible heat flux (W/m2), Rn is net radiation (W/m2), and G is the soil heat flux (W/m2). According to Bastiaanssen [49]:
R n = ( 1 α )   R s + R l R l ( 1 ε 0 )   R l
G = T s , c o r r   ( 0.0038 + 0.007 α )   ( 120130.98 N D V I 4 ) × R n
where Rs↓ is the incoming shortwave radiation, and R l and R l are incoming and outgoing longwave radiation, respectively. α is surface albedo (−) estimated according to [50] and ε0 is the surface thermal emissivity determined from vegetative indices such as NDVI and leaf area index (LAI). T s , c o r r is the adjusted land surface temperature (Ts) in °K based on the DEM map and the difference between extraterrestrial solar radiation on sloped and flat terrains to account for changes in temperature due to common elevation data and slope according to Jaafar and Ahmad [51].
H in SEBAL is calculated through an iterative procedure based on the bulk aerodynamic resistance equation:
H =   ρ C p d T r a h
where ρ is the air density (kg/m3), C p is the specific heat of air at constant pressure (kg K), r a h is the aerodynamic resistance (s/m), and d T is the temperature difference between two near-surface heights. Being the major assumption, d T is estimated as a linear function according to Bastiaanssen et al. [17] (Equation (5)), where coefficients a and b are empirically determined for extreme anchors for each image:
d T = a + b × T s , c o r r
In geeSEBAL, d T is calculated from anchor endmember pixels (cold and hot pixels) corresponding to zero G and LE, respectively. In each iteration, an atmospheric stability correction is applied to r a h according to Bastiaanssen et al. [17] until reaching a stable value. geeSEBAL utilizes an automated statistical algorithm similar to METRIC to identify cold and hot endmembers [52]. In this vein, cold and hot populations (corresponding to well-vegetated and sparsely vegetated areas) are generated from percentiles of NDVI and surface temperature (Ts). The cold endmember is detected with the highest NDVI (5% percentile) and the lowest Ts (20% percentile). Likewise, the hot endmember candidate is selected from the lowest NDVI (10%) and the highest Ts (20%) percentiles. It should be noted that these standard percentiles are suitable and recommended for semiarid regions [52].
Finally, the evaporative fraction (Λ) is calculated from Equation (6) and then daily evapotranspiration (ET24h) with 30 m resolution is estimated as:
Λ = L E R n G  
E T 24 h = Λ R n 24 h λ
where R n 24 h is the daily net radiation and λ is the latent heat of vaporization of water.

2.2.2. Crop Water Productivity Model

We developed the crop water productivity model within GEE using Python API. On the basis of the Light Use Efficiency model, the biomass production (Bio) (kg/ha) model first proposed by Monteith [53] is known to be a straightforward, non-data intensive, and extensively used model [6,29,54,55]. According to this model:
B i o = 0.864 × ε × A P A R
where APAR represents 24 h absorbed photosynthetically active radiation (W/m2) and ε (gr/Mj) is the actual light use efficiency. APAR is approximated according to Bastiaanssen and Ali [29]:
A P A R = 0.48 × f × S
f = 0.161 + 1.257 N D V I  
where S is incoming solar radiation and f is the fraction of 24 h Absorbed Photosynthetically Active Radiation. The LUE is estimated based on Jarvis–Stewart model [29,56]:
ε = ε m a x × g ( T ) × g ( D ) × Λ
where maximum LUE ( ε m a x ) for C3 crop is 2.5 (g/MJ) and g(T), g(D), and Λ (evaporative fraction) are scalars to account for heat stress, vapor pressure stress, and water stress, respectively. Further details on these functions have been well documented by Bastiaanssen and Ali [29] and Bastiaanssen et al. [57].
Bio can be converted to crop yield (Y) (kg/ha) using yield factor or harvest index (h) and the accumulated Biomass on a seasonal basis, from the start of season (SOS) to the end of season (EOS):
Y = h S O S E O S B i o
h = Y m e a n B i o m e a n
B i o m e a n is the average biomass derived from Biomass map and Y m e a n is the average yield for the specific crop based on the available observed records in the LUB.
Finally, WP may be computed by combining Equations (7) and (12):
W P = Y 10 S O S E O S E T  
The cropping season in LUB is mostly from April to October. Little rainfall occurs during this period; consequently, there is a high demand for irrigation. Therefore, this study mainly focuses on this period to evaluate agricultural water use and productivity. Monthly and seasonal ET aggregation was performed using linear interpolation by daily reference evapotranspiration (ET0) and E T 24 h . Then, the resulting interpolated E T 24 h accumulates over the period of interest.

2.3. Remote Sensing and Meteorological Inputs

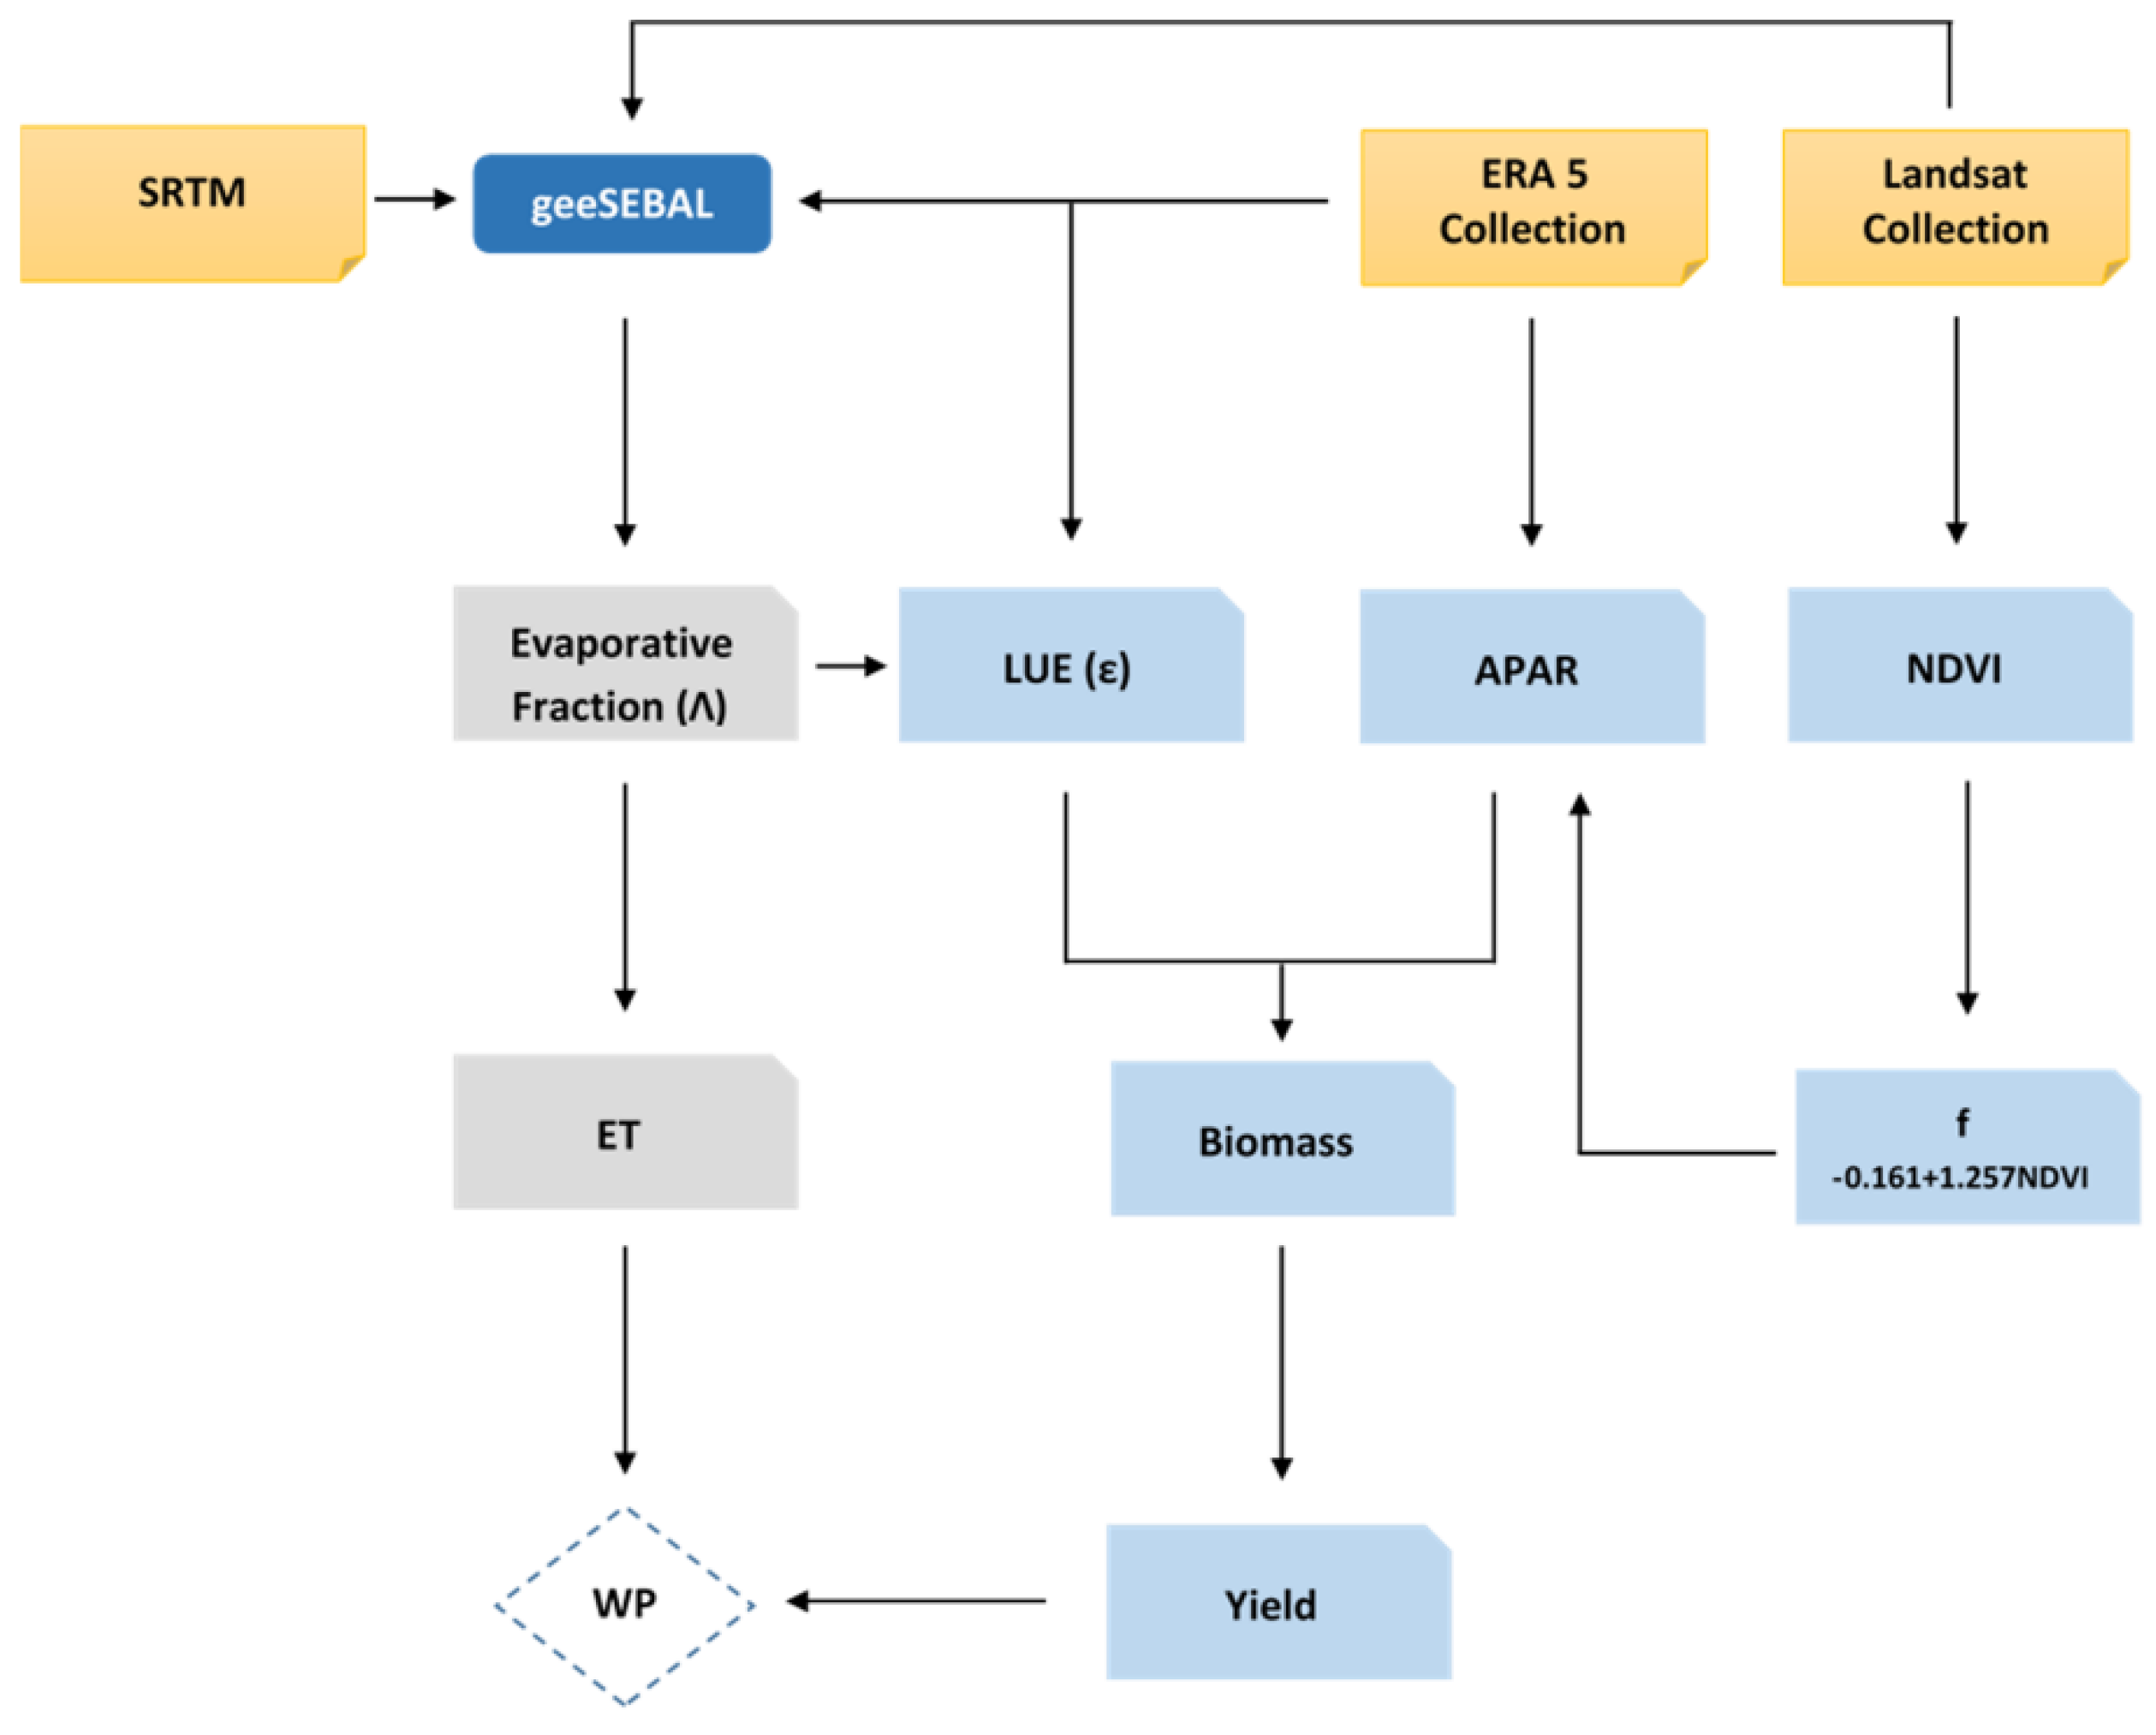
Most of the data for this study were obtained from GEE collection through Python API. Atmospherically corrected land surface reflectance and brightness temperature image collections (Tier1) were extracted from Landsat 7 ETM+ and 8 OLI/TIRS. A cloud cover filter based on the CFMask algorithm [58] was applied to each image to detect clouds, cloud shadow, and snow/ice pixels. Since instantaneous meteorological data at the satellite overpass were not available, ERA5 Land, a state-of-the-art global reanalysis dataset [59,60], was used, collecting data at hourly rates. In addition, the Digital Elevation Model (DEM) from SRTM was used. Table 2 summarizes the characteristics of the related data collections for geeSEBAL in detail. In addition, daily reference ET (ET0) was calculated using in situ meteorological data from available synoptic stations based on Hargreaves and Samani [61] for the sake of simplicity. Figure 3 demonstrates the implemented workflow for estimating WP within GEE.
A detailed Land-Use Land-Cover (LULC) map with the spatial resolution of 8 m developed for the year 2019 (accessed on 30 September 2022 https://www.fao.org/iran/news/detail-events/ru/c/1287598/) was used as the base map for analyzing the performance of each crop. Agricultural data, including crop yield and planting and harvesting dates, and meteorological data were collected from Ministry of Jahade-Agriculture and Ministry of Energy, respectively. The growing season for the majority of the crops ranges from April until October. However, the amount of precipitation in this period is very low, while the temperature rises significantly. So, the focus of this study was on this cropping calendar.

3. Results

3.1. Evaluation and Analysis of ET and Crop Water Use in the Study Area

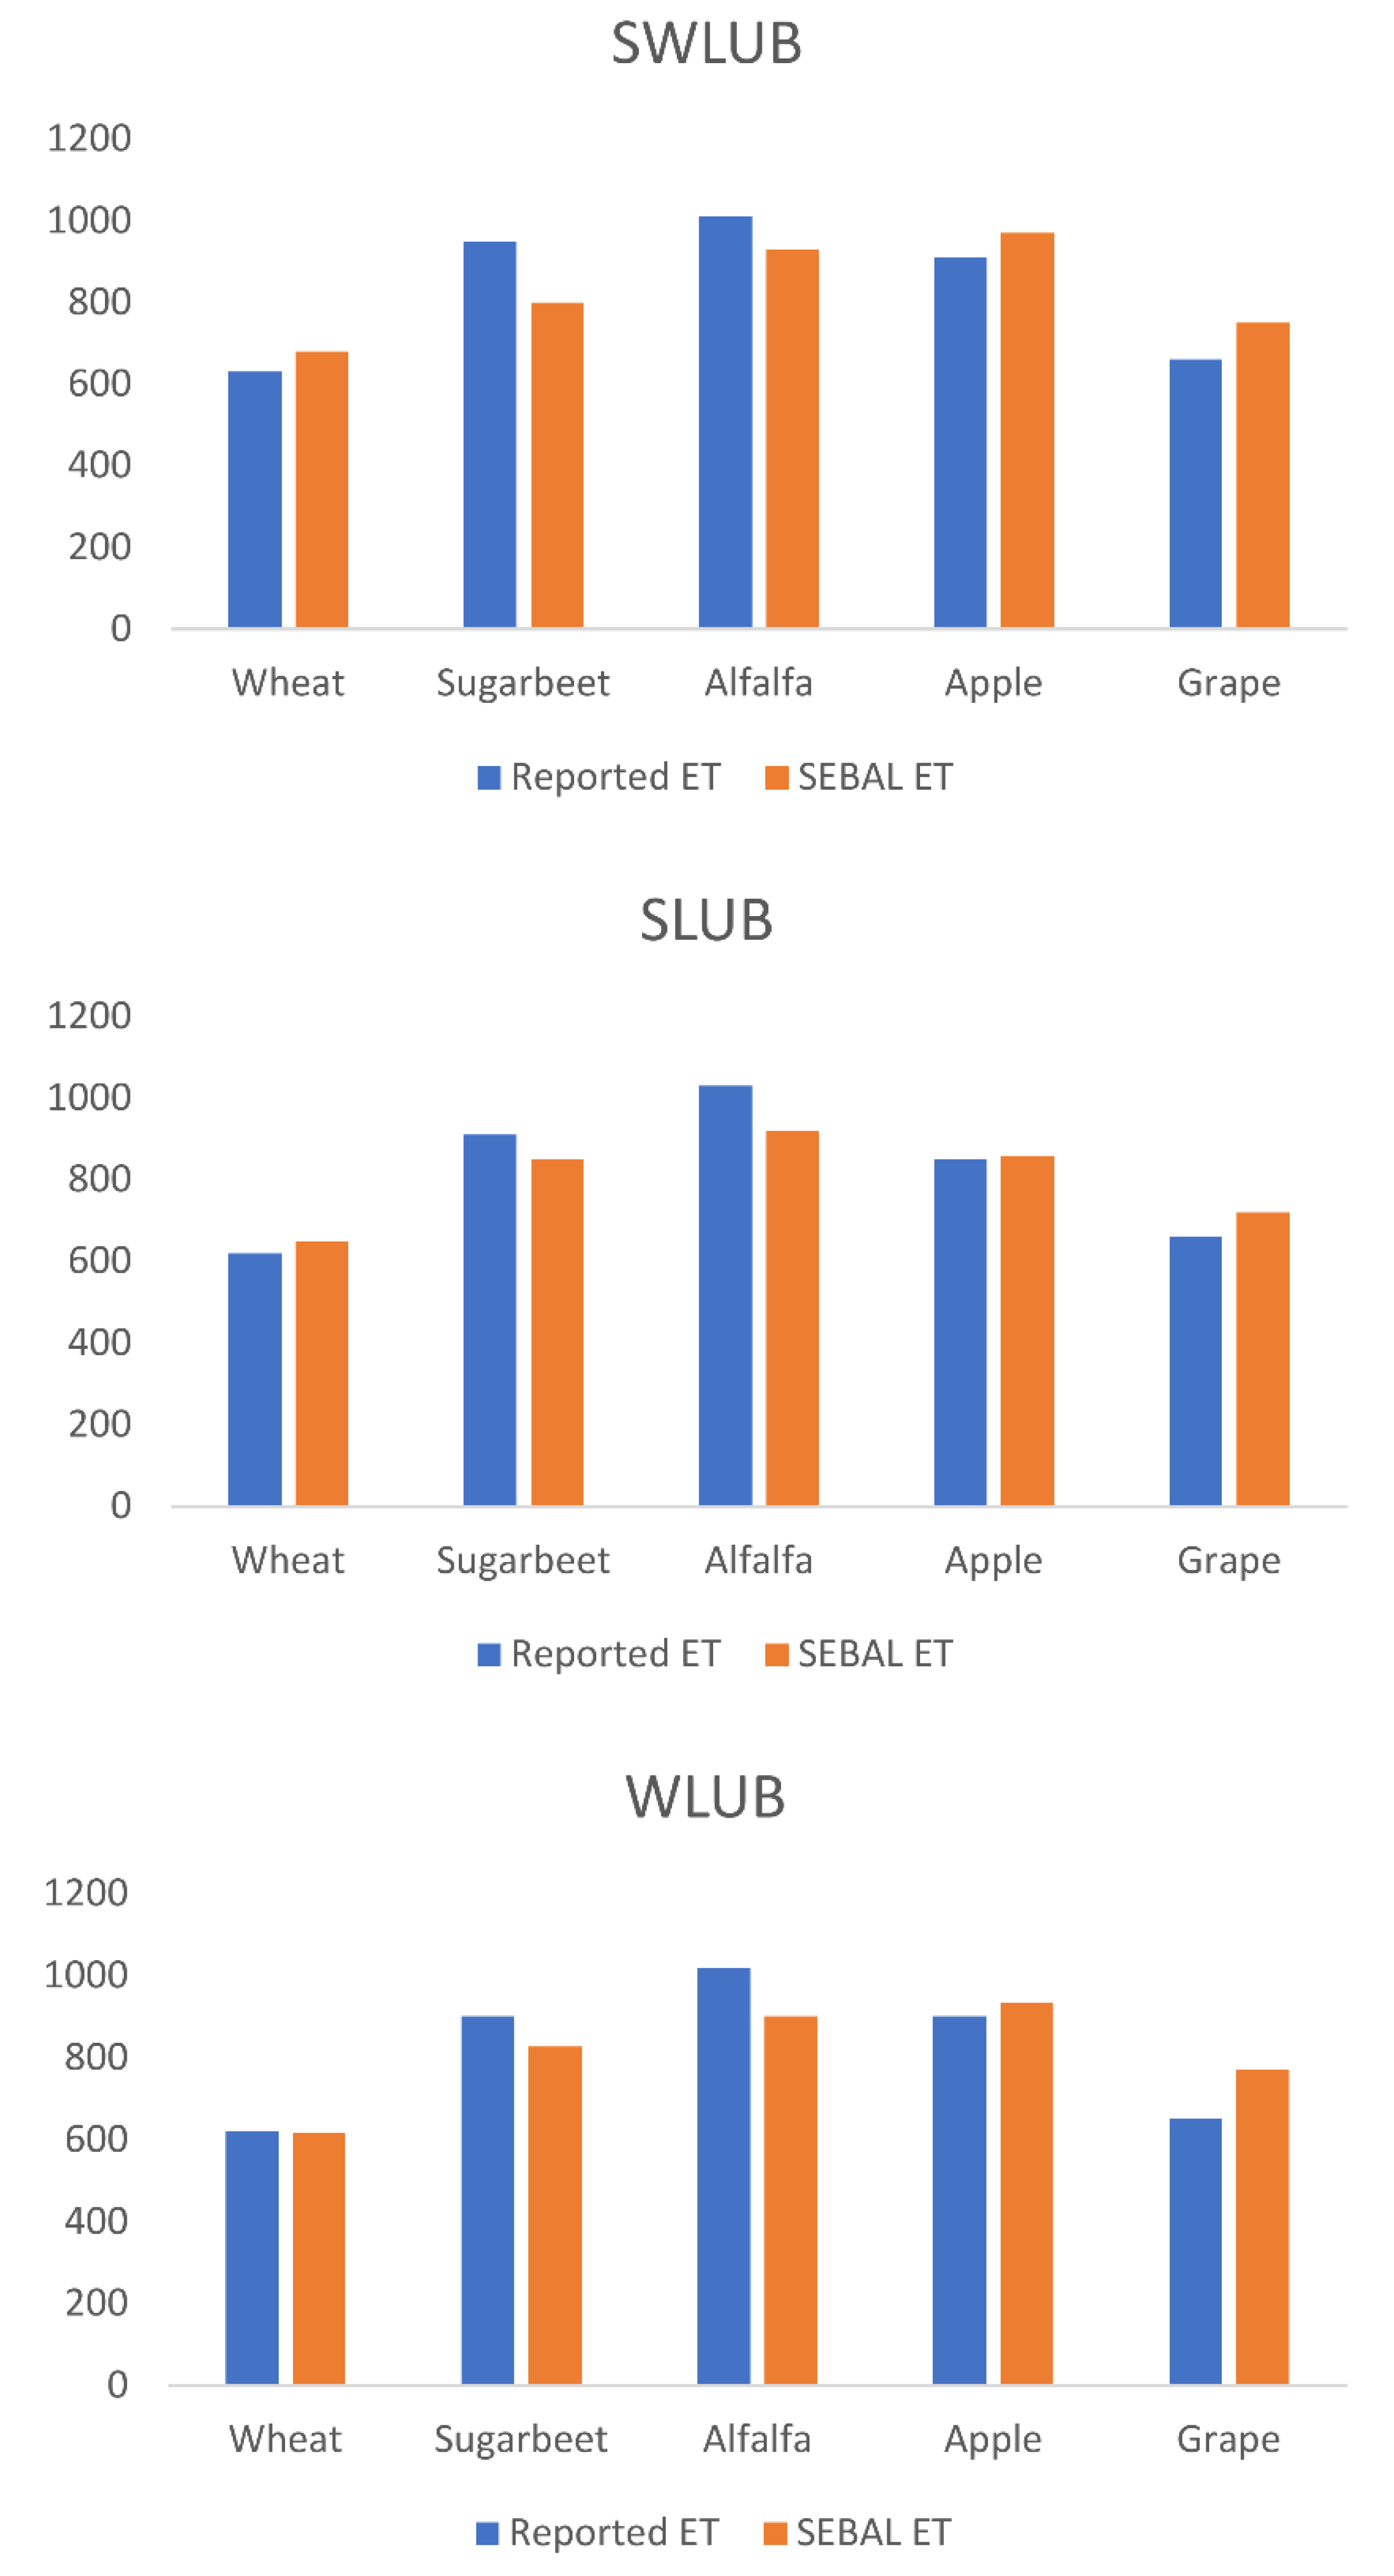
No in situ measurements or active lysimetric data on ET were available in the study area; thus, the SEBAL-based ET was compared to the reported values regarding crop water requirements from the Iran National Water Document for five crop types in each district. Since crop water use and water requirements may vary spatially due to the climate variability across the basin, ET was compared at WLUB, SWLUB, and SLUB; see Figure 4, which shows that SEBAL ET corresponds well with the reported values. Several studies conducted in the LUB have reported the accuracy of satellite-based ET models such as SEBAL and METRIC in a manner similar to this study [62,63,64,65].
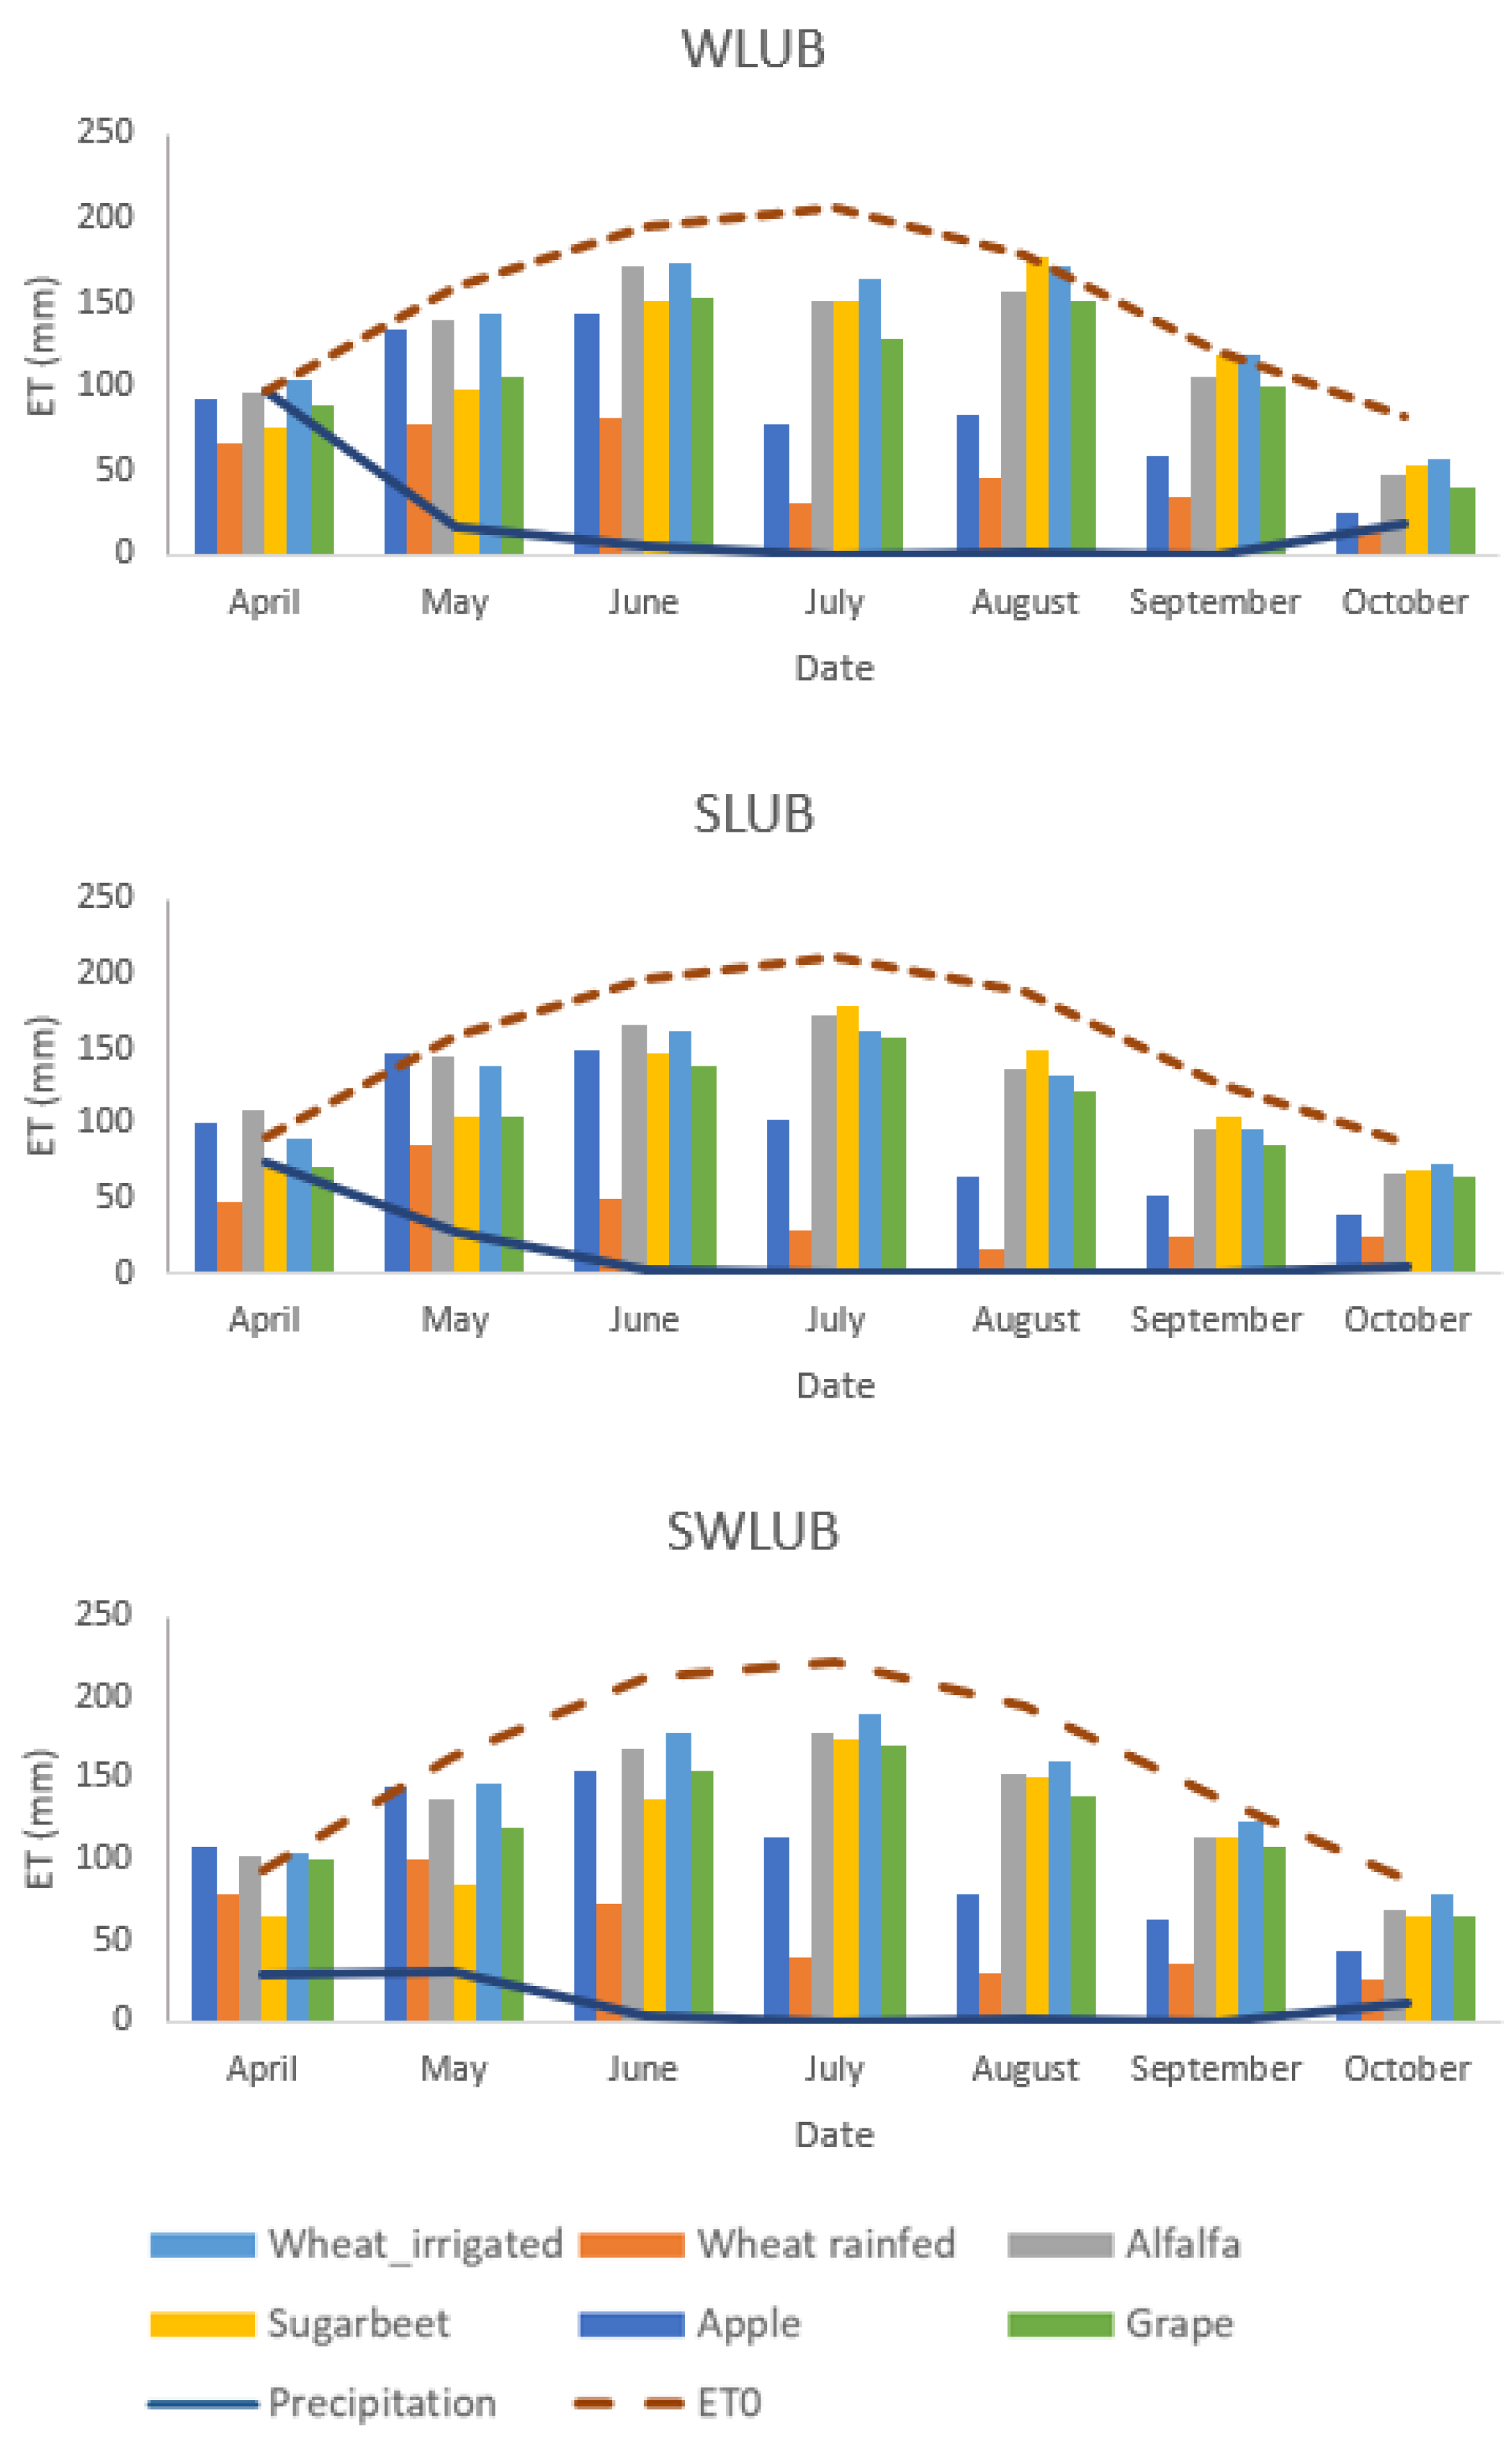
To better analyze the spatiotemporal dynamics of ET in the LUB, seasonal ET maps for WLUB, SLUB, and SWLUB are plotted in Figure 5. The irrigated lands are distinguished by green to blue shading while non-irrigated lands show the lowest ET (reddish pixels). Monthly ET values for the selected crops at each agricultural site along with the ET0 and precipitation are shown in Figure 6. Rainfed wheat has the lowest degree of ET as it receives no extra supplemental water. Some light precipitation occurs in April and May. As it can be seen, the ET of irrigated crops reaches its pinnacle during the summer (June–August) in all districts since the ET0 increases and almost no rainfall occurs.
According to the common terminology of blue and green water used by Falkenmark and Rockström [66], the majority of the water consumed for irrigation during this period is extracted from surface and groundwater resources, which are considered blue water. By comparing the water used by each crop, it can be perceived that the degree of ET varies slightly at different sites but at some points it touches the ET0 line. Being below the ET0 line implies that crops may undergo water stress during the growing season due to the water shortage.
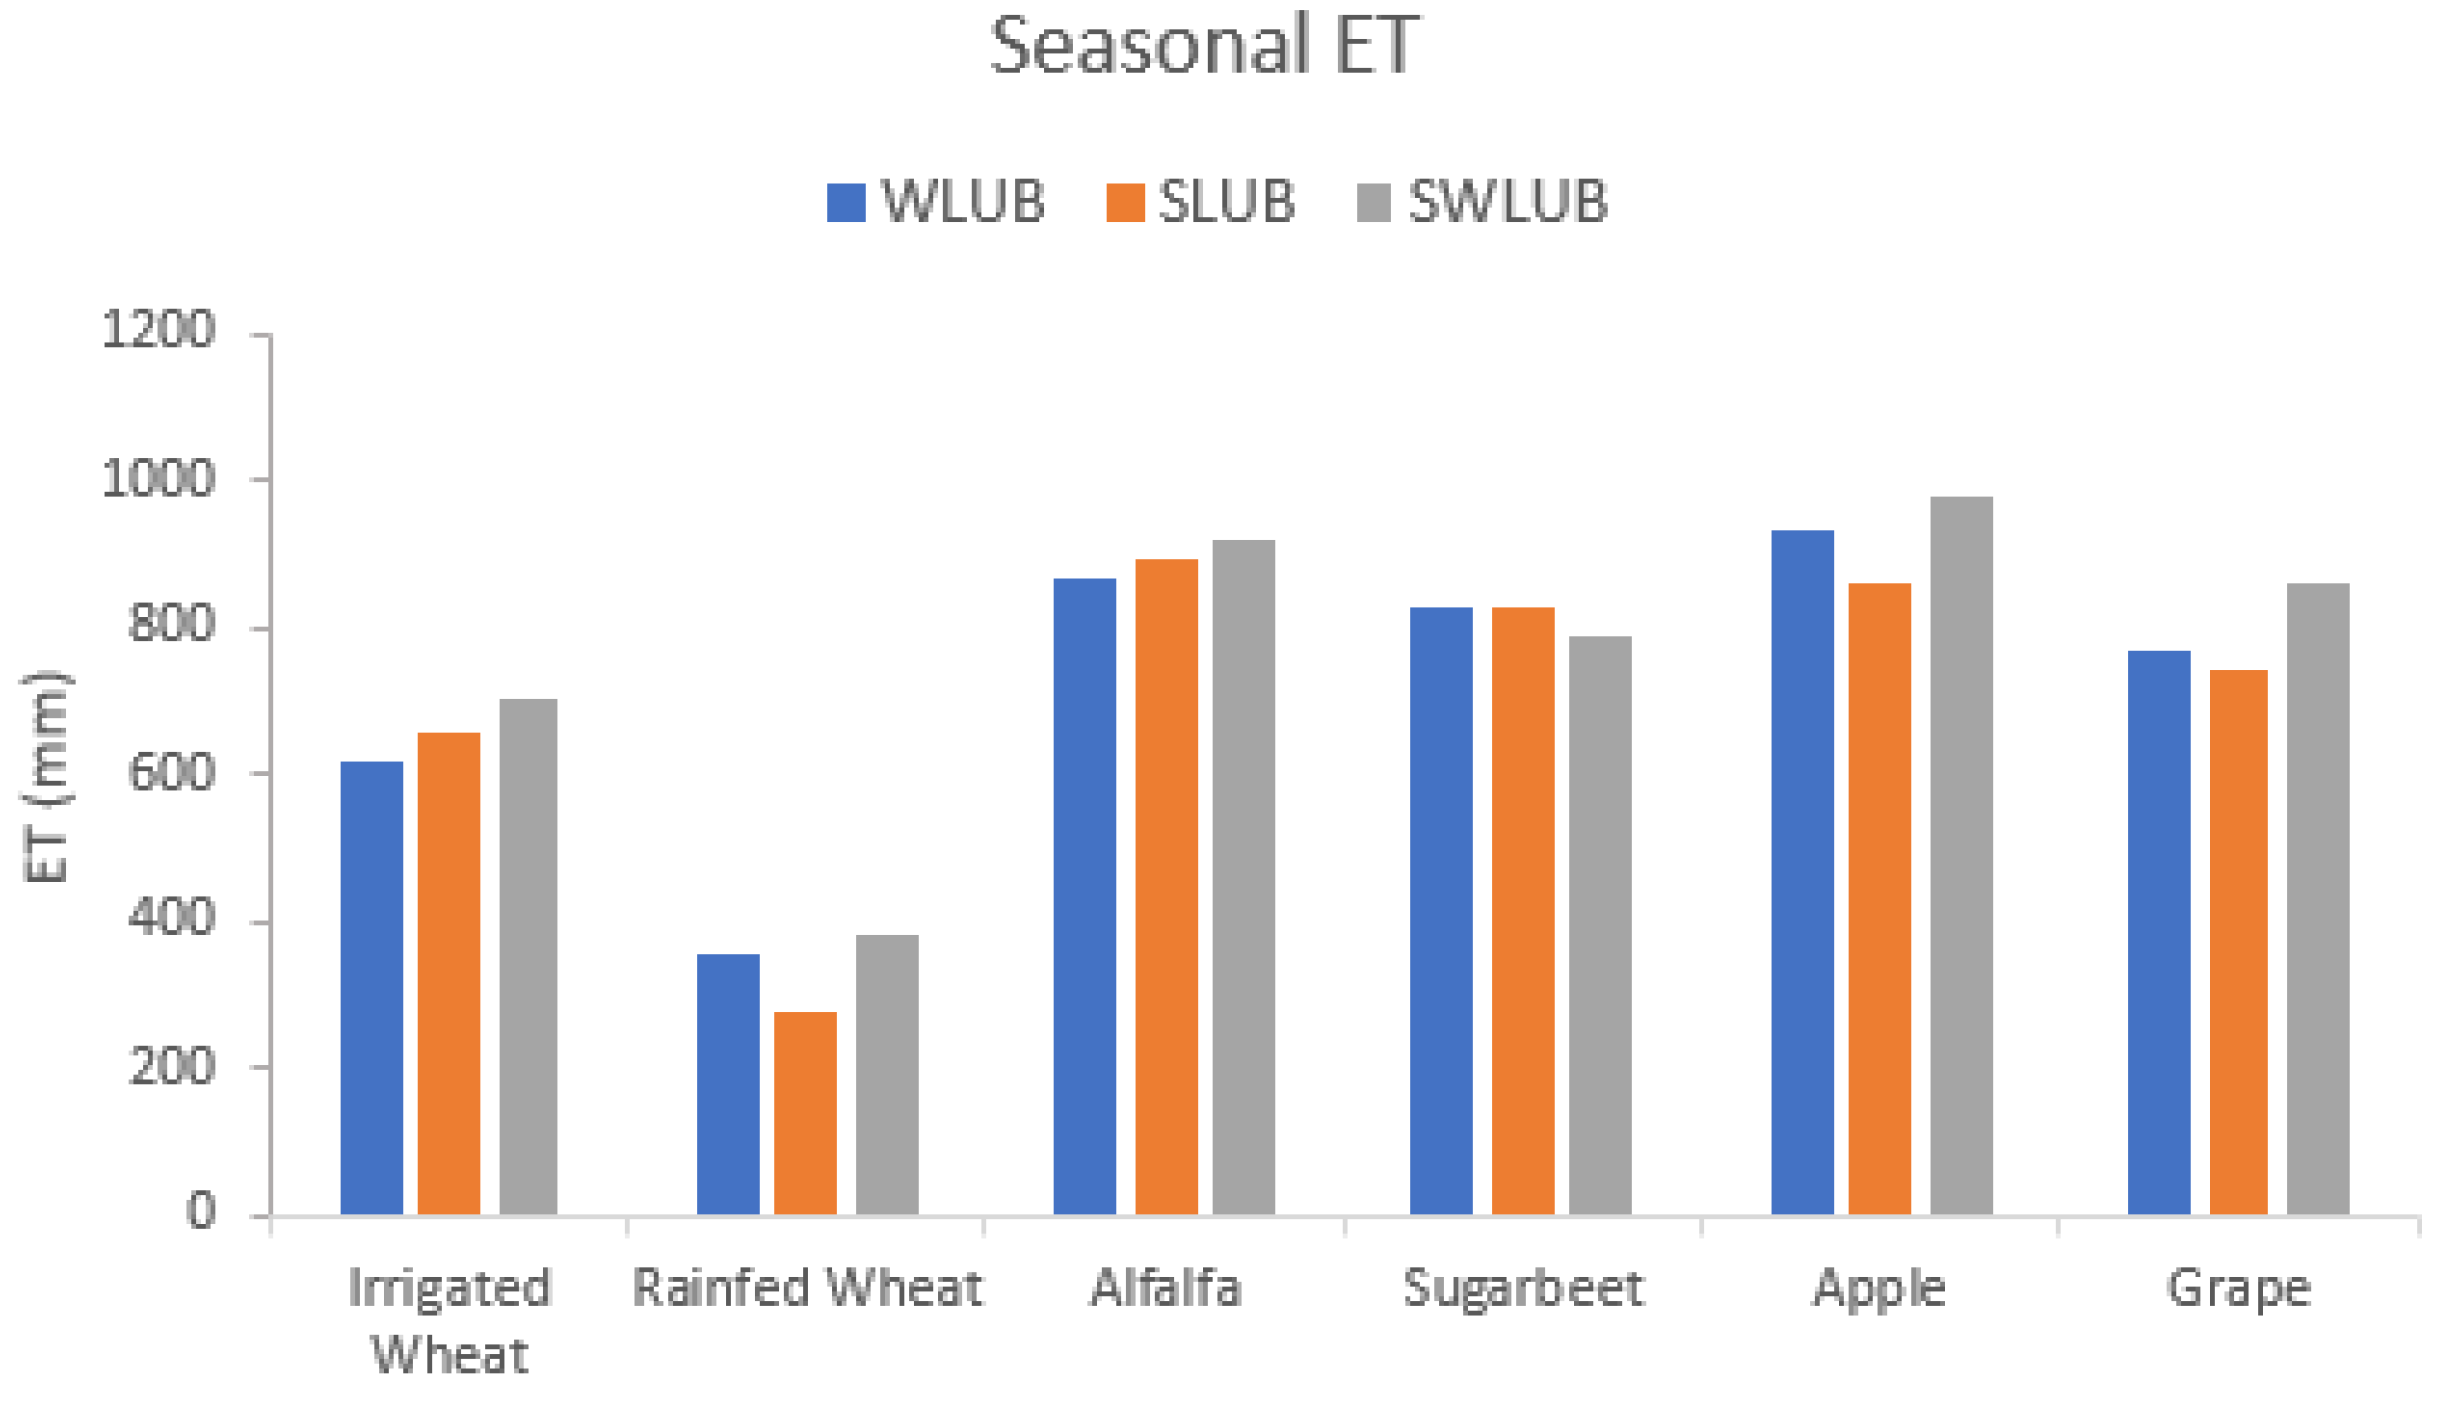
Alfalfa, apples, and sugar beets show a higher water consumption rate compared to wheat and grapes. Figure 7 shows the average degree of ET for each individual crop and relevant locations. It is clear that the SWLUB has a higher ET compared to the WLUB and SLUB. The level of evapotranspiration for rainfed wheat is roughly 300 mm but the ET level for other irrigated crops ranges from 616 mm for wheat to 950 mm for apples.

3.2. Comparing and Assessing Spatiotemporal Variations in WP

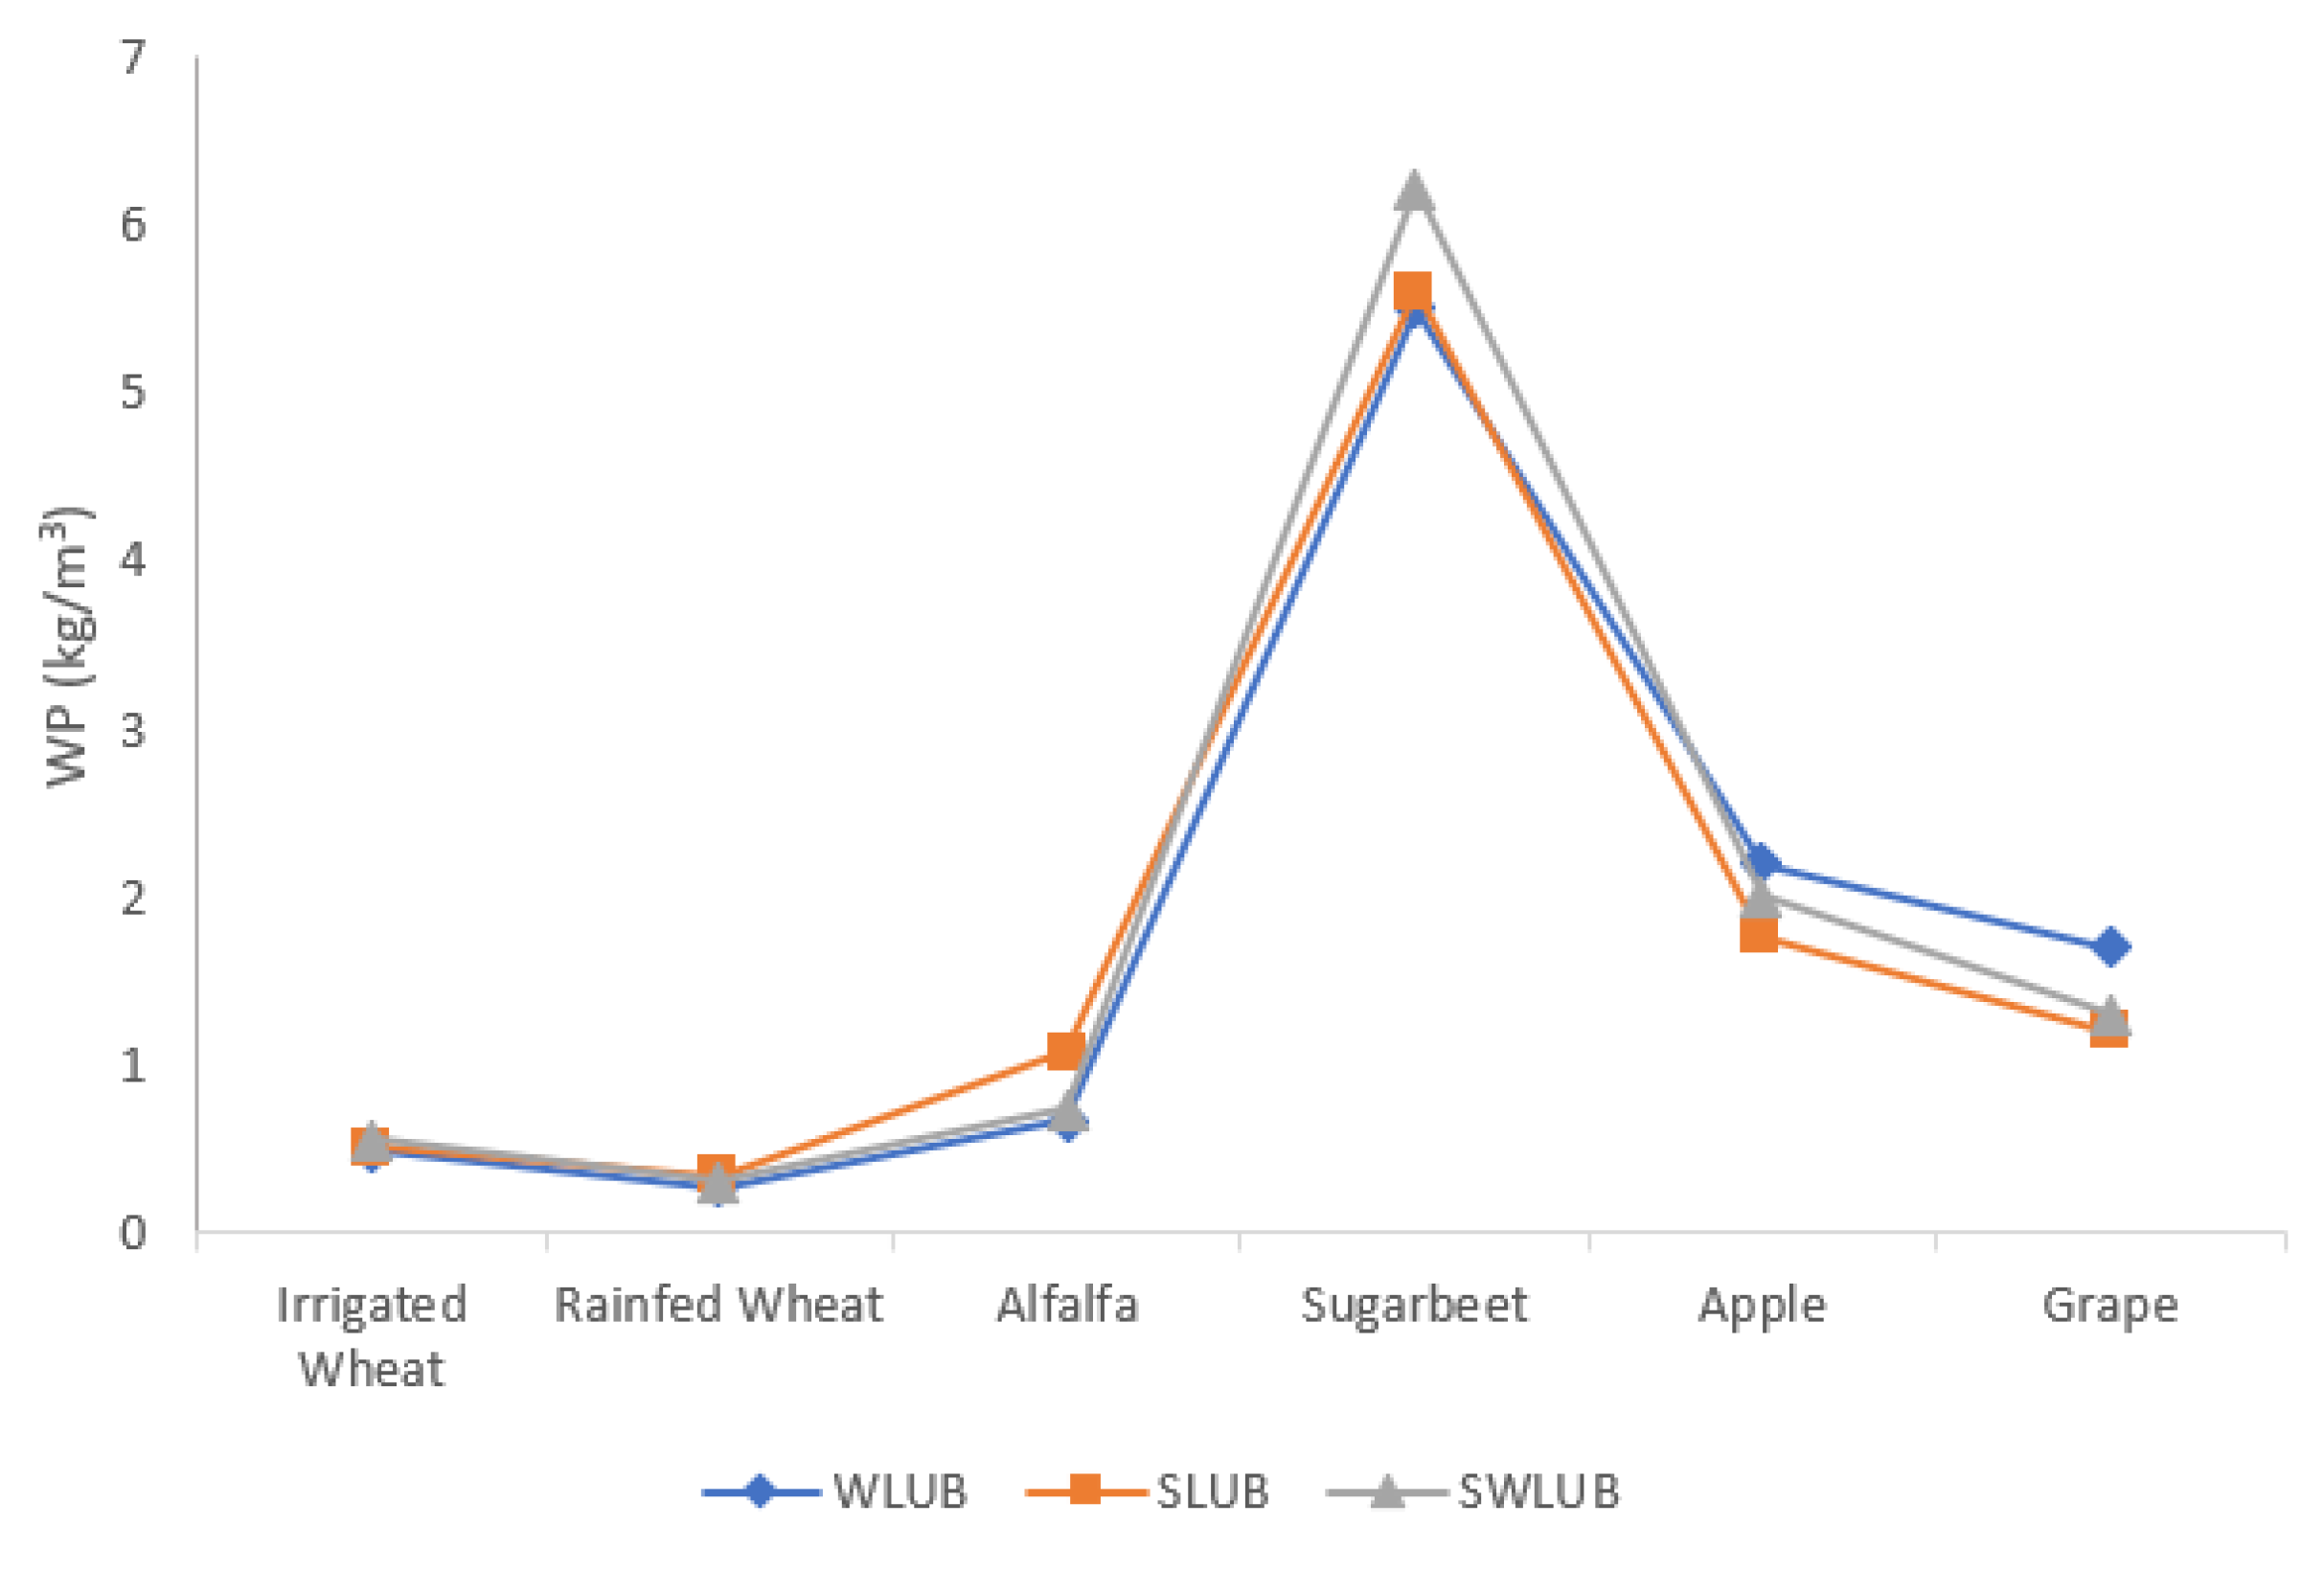
As stated earlier, the WP level should be used in a relative manner to evaluate agricultural performance. The WP levels for the selected crops in each major agricultural zone are estimated and compared to understand the productivity and performance of the implemented irrigation systems. The average WP and yield values for each crop through the cropping season are demonstrated in Figure 8. Apples and grapes in the WLUB possess higher WP levels than the SWLUB and SLUB. Little variation in the rainfed and irrigated wheat can be observed between the districts. The irrigated wheat in the SWLUB with 0.55 kg/m3 and rainfed wheat with 0.34 kg/m3 have the highest WP levels. Alfalfa and sugar beets are relatively more productive in the SLUB and SWLUB with 1.08 and 6.22 kg/m3 productivity levels, respectively. Ahmadzadeh et al. [67] also reports similar WP values for apples, alfalfa, wheat, and sugar beets in the south of the LUB. According to Ghorbanpour et al. [68], the WP values for wheat, apples, grapes, and sugar beets in the west of the LUB are 0.4, 1.9, 1.5, and 5.1, respectively, which are identical to the estimated WP values in this study. Nevertheless, the WP variation between the same crops is too little to be perceptible. Considering that the SLUB and SWLUB have been equipped with pressurized and drip irrigation for most parts, the impact was not significant enough to reduce water use and increase water productivity distinctively. In other words, the WP and water use efficiency, on average, seem similar in these regions. This lends tacit support to the view that inefficient water consumption could lower WP.
As an example, the spatial variation of the WP for certain crops is illustrated in Figure 9. These maps are an example of locating so-called ‘bright spots’ and ‘hot spots’ spatially. The bright spots are seen where the WP is above the average values, which is identified by blue shading. Much lower WP values or fewer hot spots pertain to lands where poor farming and water management practices can be easily detected. These maps prove that on-farm practices could have a significant range of impacts on improving WP. Bright spots represent superior management practices applied by farmers to maximize the ‘crop per drop’. Such maps can help decision-makers and local farmers to discern the best agronomic practices and thereby apply a similar approach to low-yielding areas to increase productivity.

4. Discussion

4.1. WP–Yield Relationship and Implications for Sustainable Agricultural Management

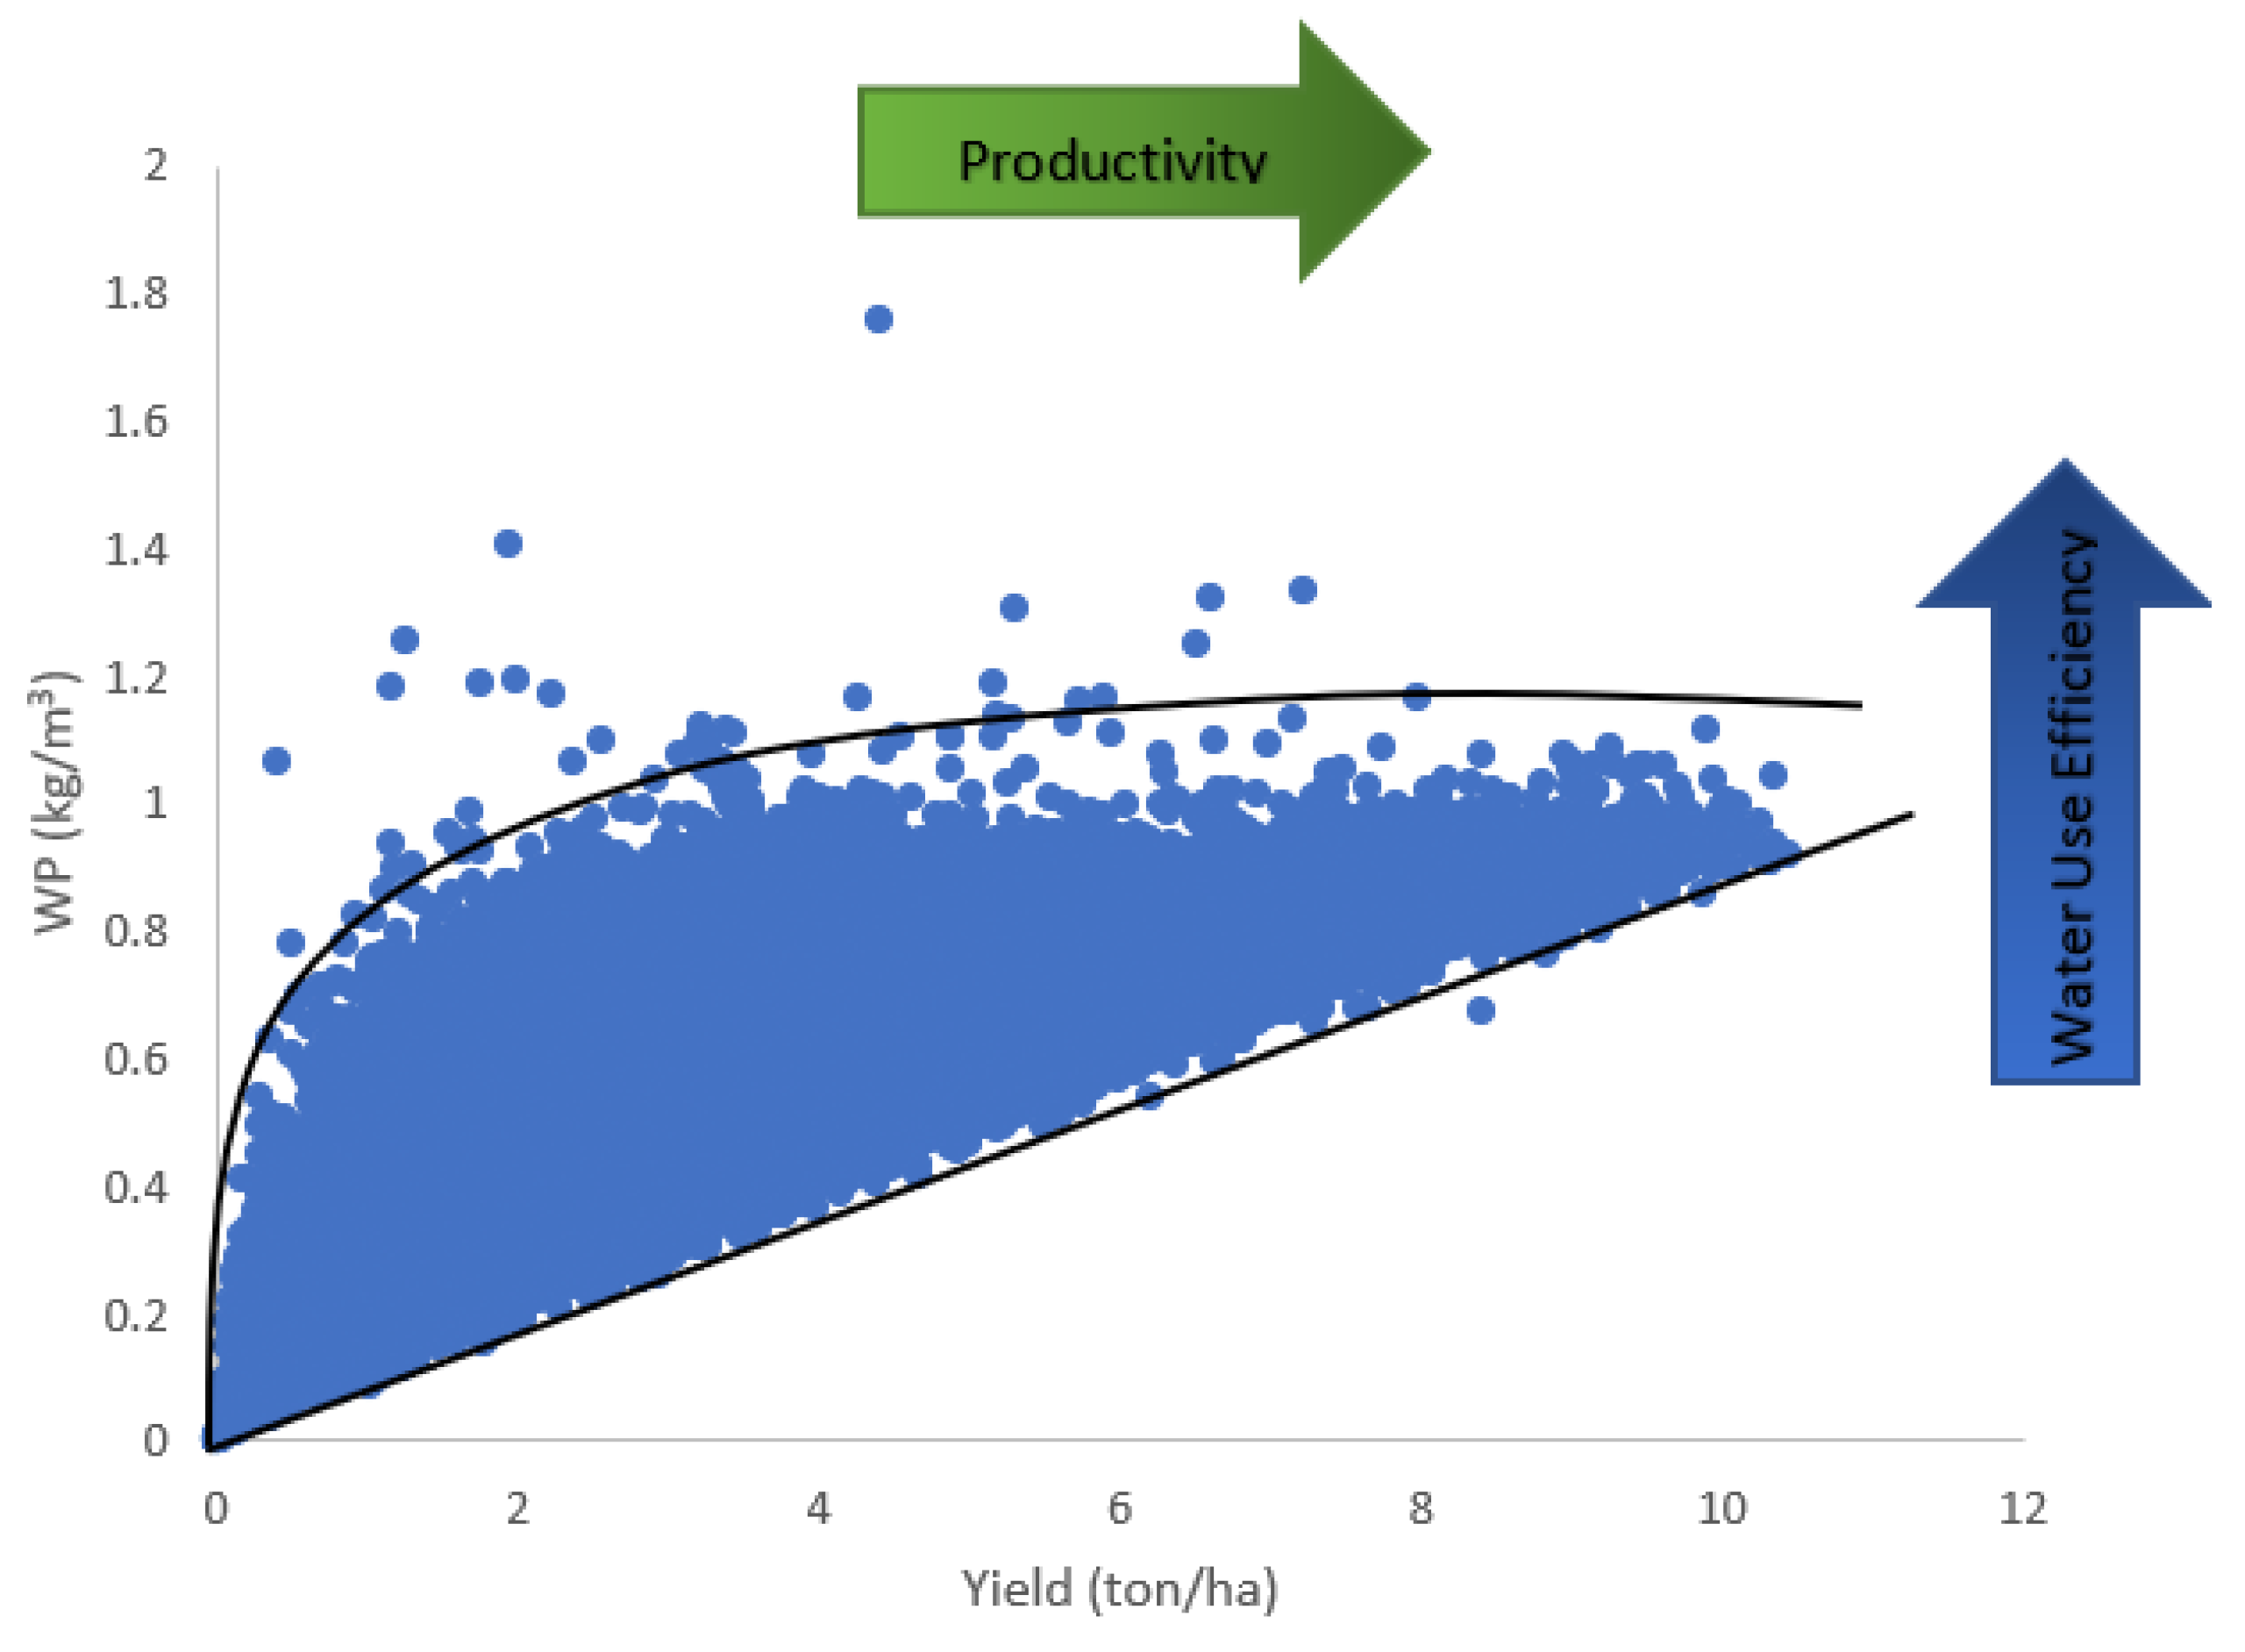
The scatter plot of the WP plotted against the yield for irrigated wheat is shown in Figure 10. Since the shape of the scatter plot was more or less similar to the other crops, wheat was selected as the representative. Two lines were drawn to determine the lower and higher boundaries for the WP. Interestingly, the lower boundary increases linearly with the crop yield. The upper boundary follows a curved shape similar to a logarithmic behavior, showing a steep change in less productive areas. A similar pattern has also been reported by Bastiaanssen and Steduto [6] and Blatchford et al. [44]. This figure also reveals that fields with a much higher crop yield exhibit a very low variation in WP compared to lower WP zones. This could be attributed to the fact that farmers in these fields have excluded the risk by investing in water-efficient and agronomic practices. This suggests that there is ample potential to establish a higher WP in low-yielding and poorly performing fields, provided that proper practices are implemented.
Increasing WP can be achieved either by improving water use efficiency (reducing ET) while retaining the same yield or by improving productivity (increasing crop yield) with the same amount of consumed water. At the basin-scale with water as the first priority, the former approach is more desirable for establishing methods to reduce water consumption while maintaining food production as suggested by Blatchford et al. [44]. Depending on the situation, ideal local goals could be set. If the goal aims to reduce ET, farmers should be encouraged to move vertically from lower boundaries to upper boundaries with respect to the WP–Yield scatterplot. In view of this, for the LUB, facing water scarcity, this option is the most relevant for adopting a water-saving approach. However, farmers, especially smallholders with unfavorable financial conditions, typically have a tendency to enact the latter to prioritize yields rather than water consumption regardless of the environmental consequences, as Pouladi et al. [69] perceive it. This may be one of the underlying reasons why the SWLUB and SLUB do not show noticeable improvements over the WLUB despite the application of water-saving irrigation systems. In addition, another important reason for this failure is that farmers have little knowledge of farm-level management practices. They simply do not have a clear mindset as to the maximum WP targets or how to achieve them in the region.

4.2. WP Boundaries, Benchmarks, and Potentials in LUB

The WP mean and boundary values along with the coefficient of variation (CV) for each crop are shown in Table 3. Since extreme values may represent outliers, the 5th and 99th percentiles were used as the minimum and maximum WP values. Table 3 provides a clear overview of the WP status in the LUB. The average WP for irrigated wheat is 0.49, 0.51, and 0.55 for the WLUB, SLUB, and SWLUB, respectively. The SWLUB has a higher WP and lower CV for irrigated wheat. The WP with respect to the 99th percentile for this crop in the basin is 0.92, hinting that there is an 80% WP gap that needs to be bridged. This could be accomplished by increasing either water use efficiency or productivity. The CV for rainfed wheat is higher, which is expected, as the production of rainfed wheat is inconsistent due to the climate variability across the basin. The SLUB has relatively the highest WP (0.34) and WP at 99% (0.87) amongst the others while the WLUB and SWLUB are similar. Therefore, the WP for rainfed wheat could potentially be improved up to 150% (see Table 4). It is clear that rainfed wheat has the highest potential to be improved in the whole basin. This is in agreement with the studies conducted by Rockström et al. [70] and Faramarzi et al. [71] where they reported that low-yielding crops such as rainfed wheat may lead to a larger marginal return with better water management. Apples and grapes perform better in the WLUB. The WP value for sugar beets in the SWLUB is higher but Alfalfa in the SLUB is 60% more productive. Though some districts have higher WP values compared to each other, the gap between the WP mean and WP at 99% is too large to overlook. This proves that water use in the entire basin could be minimized enormously if the best on-farm practices and policies are implemented. This could be achieved by moving from the lower boundaries with respect to the WP–Yield scatterplot to the upper levels to cope with water scarcity in the LUB. Chukalla et al. [72] and Bastiaanssen and Steduto [6] show that this is possible.
Table 4 shows the possible improvements of WP in each region if the WP moves toward the WP 99% defined at the local scale. It is noteworthy that the SLUB will receive major improvements in terms of WP compared to the WLUB and SWLUB. Few research values are available for WP with which to benchmark the local WP for each crop in the LUB. Zwart et al. [7] found that the global range of WP for wheat for the 5% and 95% percentiles is 0.2–1.5 kg/m3 with an average of 0.86. Based on the global water productivity statistics for wheat, the mean WP, WP 95%, and WP 5% are 0.98, 1.9, and 0.2, respectively [6]. It is true that global WP values may not be practical at local scales but they show that there are intrinsic capacities to stretch WP boundaries even further at local scales. As another example, the crop water productivity of grapes in a semi-arid region of Brazil and California was reported at 2.44 and 4.48 [73,74].

4.3. Distribution and Variability of WP and Crop Yield in LUB

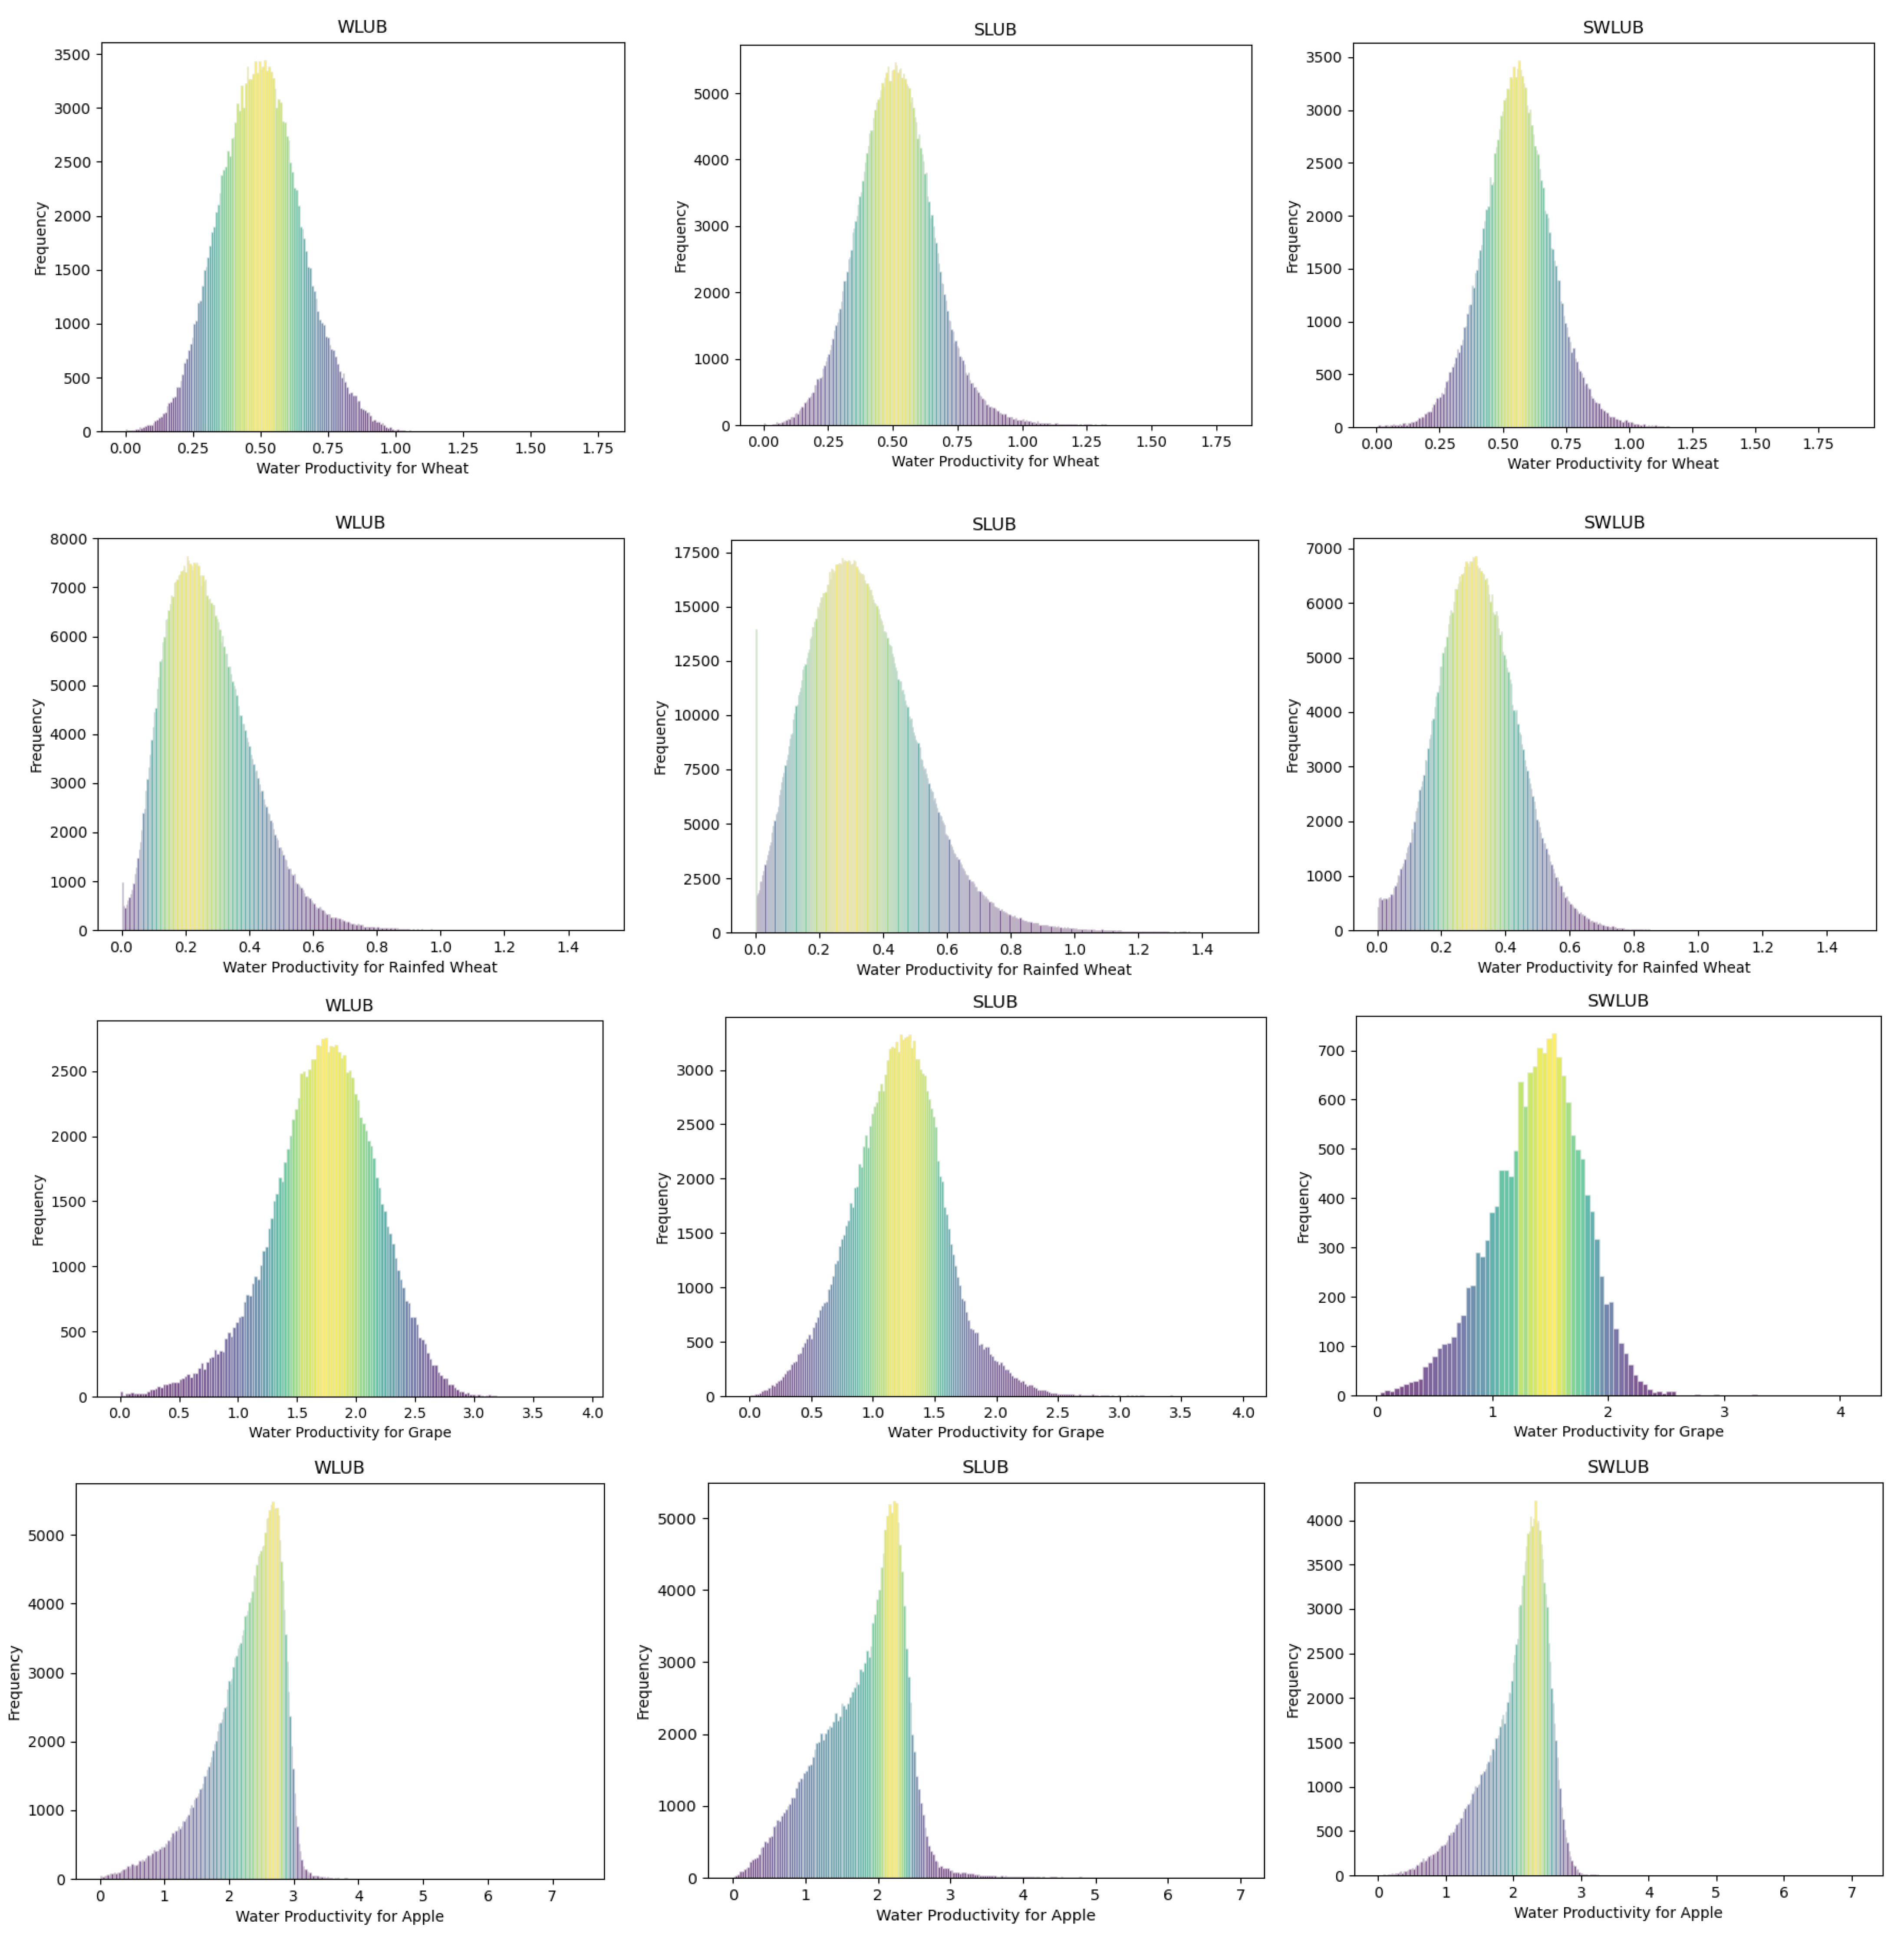
The frequency distribution of the WP for wheat, grapes, and apples—as the most important crops in the LUB—is presented in Figure 11. The shape of the distribution shows an approximately similar to unimodal distribution for each crop with subtle differences. For instance, concerning irrigated wheat, the mode is located around 0.5 WP for the WLUB and SLUB while it is more than 0.5 for the SWLUB, which can also be inferred from Table 3. By examining the distribution of the WP for apples and grapes, it becomes apparent that a large portion of farmlands has a relatively lower WP. The frequency distribution demonstrates that apples and grapes display better performance in the WLUB as they skew towards a higher range of WP values, which is in accordance with Table 3.
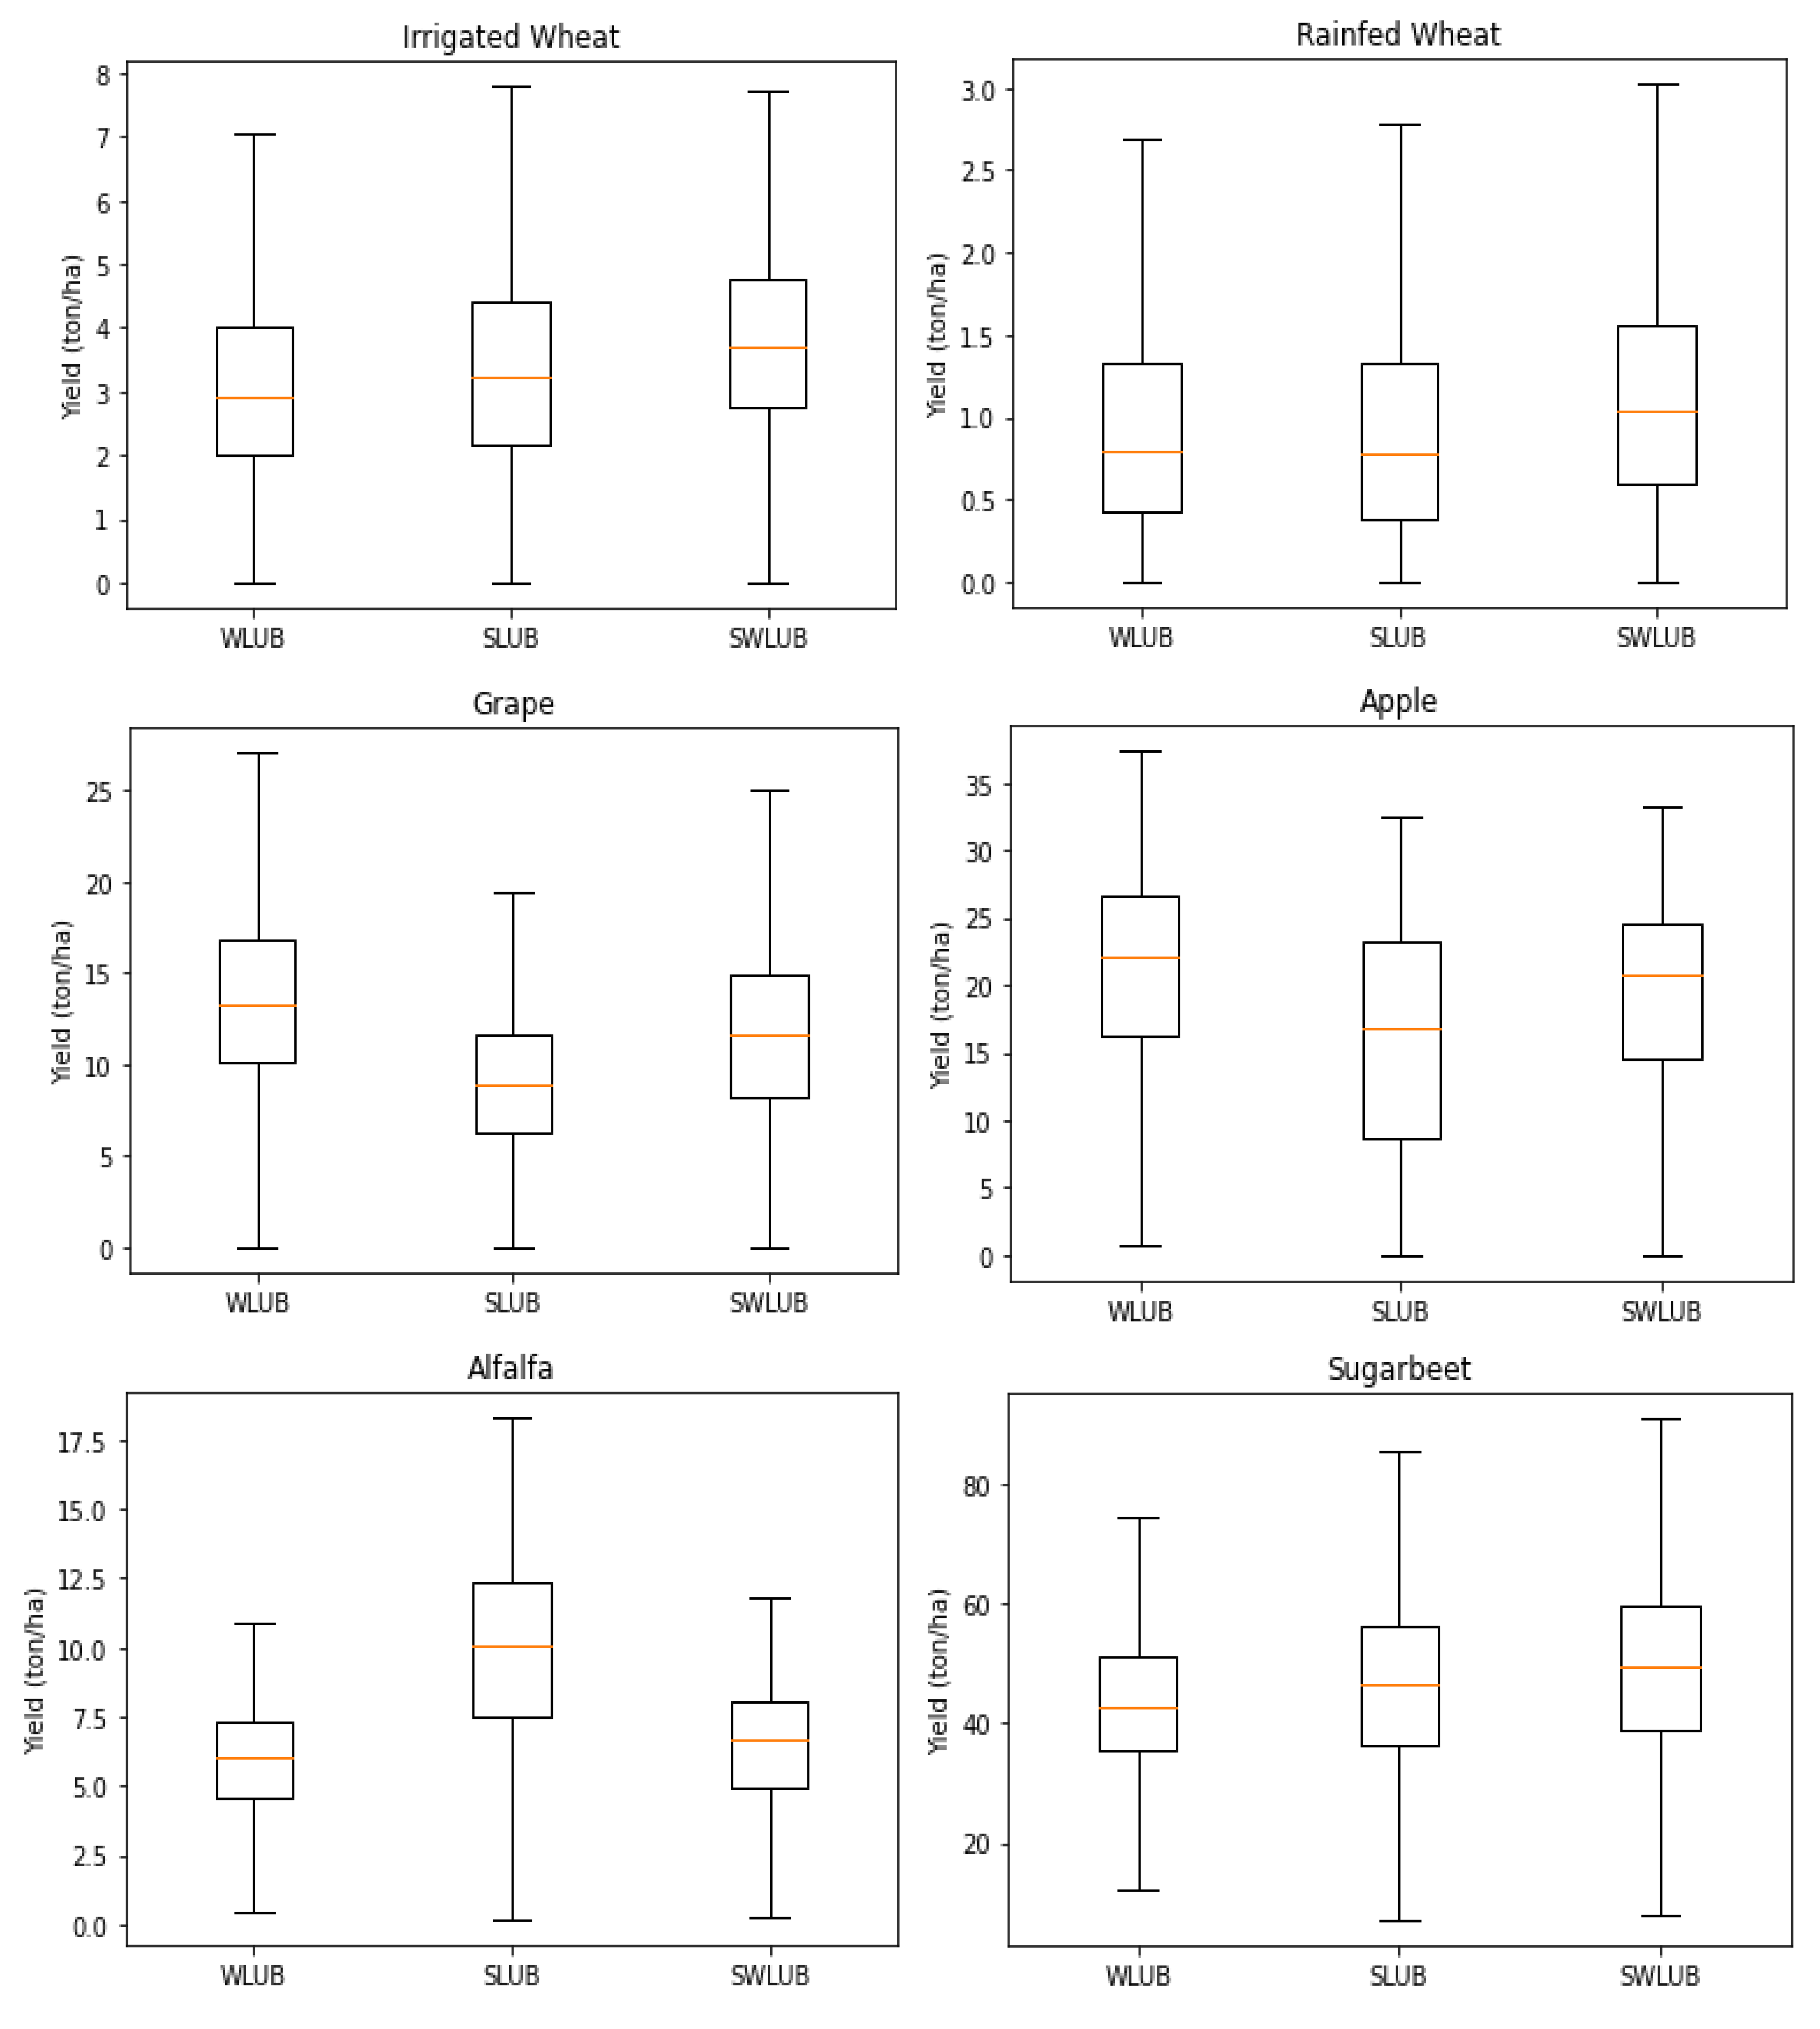
To show the spatial variability of the yield, we constructed box-plots, which are shown in Figure 12. For irrigated and rainfed wheat, the crop yield varies by up to 8 and 3 kg/ha, respectively, with the SWLUB having a relatively higher yield. The apples and grapes in the WLUB show higher variability but are also more productive than the SWLUB and SLUB. It can be seen that Alfalfa, as a water-intensive crop, exhibits a greater yield in the SLUB. It can be argued that there is a considerable degree of work necessary to maximize the lower yields towards the upper quantiles to sustain higher water productivity.

4.4. Opportunities and Caveats for Resurrecting an Endangered Ecosystem

As stated in the previous sections, reducing the water consumption of the agricultural sector by 40% is one of the major objectives of the ULRP for reviving Lake Urmia. Danesh-Yazdi and Ataie-Ashtiani [48] argue that the lack of data and information on the Lake Urmia Basin is a major hurdle when it comes to developing effective restoration plans. The studies conducted by Naboureh et al. [75] and Khazaei et al. [41] emphasize that the impact of anthropogenic factors—mostly the expansion of agricultural areas with low efficiency—on the Lake Urmia crisis are higher than the impact of the warming climate. However, the implemented measures to increase water use efficiency do not stipulate any promising outcomes per se. All the evidence found in this study proves the point that the LUB holds an abundant capacity for increasing crop water productivity through optimum water management. Table 4 clearly indicates that water-efficient practices, even if only amounting to half of the necessary effort to improve WP, could have possibly the highest contribution to restoring Lake Urmia to its ecological levels. That being said, the successful implementation of such measures should be carried out with caution due to the socio-economic complexities and conditions at the basin scale. For instance, Pouladi et al. [69] echoed that misconceptions and a lack of awareness towards environmental issues and trust in authorities have caused farmers to minimally participate in restoration programs and the implementation of policy actions. They concluded that ignoring such socio-hydrological barriers could bring about conflicts among stakeholders and thwart effective restoration efforts. Several studies advocate that water-saving activities in the absence of controlled water allocations and a comprehensive monitoring system are likely to be short-sighted, thereby shifting the behavioral responses of farmers towards their expected farm incomes and crop patterns and, thus, possibly exacerbating the current situation [76,77,78].

5. Conclusions

The main objective of this study was to address the current status of the WP in the Lake Urmia Basin and develop a cloud-based model to facilitate an estimation and benchmark of the region’s WP at a 30 m resolution. Three major agricultural lands in the LUB were selected to test the model based on Landsat-7 and -8 satellite imagery. Five major crops at each agricultural site were selected to evaluate the LUB’s WP, determine its boundaries, and set pragmatic targets.
Our analysis showed that the water productivity in the LUB is far below its optimum level. Although some parts of the LUB such as the SWLUB and SLUB are equipped with modernized irrigation, they fail to show tangible improvements. In fact, the WLUB performs better for crops such as grapes and apples compared to others in terms of the WP assessment. This indicates that water-efficient interventions are not properly implemented in the LUB. This is in part due to the fact that stakeholders and supporting cooperatives are unable to set WP targets and track WP-related progress. On the other hand, local farmers have little knowledge of the optimum agronomic practices, valuing yields rather than reducing water use. In the context of the case study, reducing water use while retaining yields could be the most practical way to deal with water stress in the LUB. Farmers should also receive additional incentives and required training to adopt the best water-efficient practices.
The WP boundaries in each district reveal that there is great potential to improve water use efficiency and productivity. Wheat demonstrates the highest potential for improvement. The status of WP in the LUB is even worse vis-à-vis the available global WP values, indicating that a large WP gap needs to be closed. Moreover, mapping the WP values enabled the detection of bright spots and hot spots as representatives of superior and poor on-farm practices, respectively. Fields with a high WP could help decision-makers and local growers diagnose the optimum practices and promulgate said practices to lands with low performance.
Our paper presents a model within the GEE environment to map WP at regional scales at a 30 m resolution using Landsat satellite images, thereby facilitating worldwide applications. It is expected that such open-source and practical initiatives could provide decision-makers with high-value information to monitor and enhance sustainable water resource management in an integrated manner, especially in water-limited regions. The gist of this study is the necessity of benchmarking WP and tracking progress towards its achievement for evidence-informed planning to help policymakers and farming communities define baselines, set practical goals, and implement proper policies accordingly.

Author Contributions

Conceptualization, A.K.G., I.K. and A.A.; methodology, A.K.G. and I.K.; software, A.K.G. and T.H.; validation, A.K.G., B.H. and I.K.; formal analysis, A.K.G.; investigation, A.K.G. and M.T.; data curation, A.K.G., M.T. and B.H.; writing—original draft preparation, A.K.G.; writing—review and editing, I.K., A.A., Z.D., M.J.T., M.T., B.H. and T.H.; visualization, A.K.G.; supervision, I.K. and A.A. All authors have read and agreed to the published version of the manuscript.

Funding

This research received no external funding.

Data Availability Statement

Publicly available datasets were analyzed in this study. This data can be found in Google Earth Engine database.

Conflicts of Interest

The authors declare no conflict of interest.

References

  1. Foley, J.A.; Ramankutty, N.; Brauman, K.A.; Cassidy, E.S.; Gerber, J.S.; Johnston, M.; Mueller, N.D.; O’Connell, C.; Ray, D.K.; West, P.C.; et al. Solutions for a cultivated planet. Nature 2011, 478, 337–342. [Google Scholar] [CrossRef] [PubMed] [Green Version]
  2. Alexandratos, N.; Bruinsma, J. World Agriculture towards 2030/2050: The 2012 Revision; Food and Agriculture Organization of the United Nations: Rome, Italy, 2012. [Google Scholar]
  3. Rockström, J.; Steffen, W.; Noone, K.; Persson, Å.; Chapin, F.S., III; Lambin, E.F.; Lenton, T.M.; Scheffer, M.; Folke, C.; Schellnhuber, H.J.; et al. A safe operating space for humanity. Nature 2009, 461, 472–475. [Google Scholar] [CrossRef] [PubMed]
  4. Steffen, W.; Broadgate, W.; Deutsch, L.; Gaffney, O.; Ludwig, C. The trajectory of the Anthropocene: The Great Acceleration. Anthr. Rev. 2015, 2, 81–98. [Google Scholar] [CrossRef]
  5. Brauman, K.A.; Siebert, S.; A Foley, J. Improvements in crop water productivity increase water sustainability and food security—a global analysis. Environ. Res. Lett. 2013, 8, 024030. [Google Scholar] [CrossRef]
  6. Bastiaanssen, W.G.; Steduto, P. The water productivity score (WPS) at global and regional level: Methodology and first results from remote sensing measurements of wheat, rice and maize. Sci. Total Environ. 2017, 575, 595–611. [Google Scholar] [CrossRef] [PubMed]
  7. Zwart, S.J.; Bastiaanssen, W.G.; de Fraiture, C.; Molden, D. A global benchmark map of water productivity for rainfed and irrigated wheat. Agric. Water Manag. 2010, 97, 1617–1627. [Google Scholar] [CrossRef]
  8. Olivera-Guerra, L.; Merlin, O.; Er-Raki, S. Irrigation retrieval from Landsat optical/thermal data integrated into a crop water balance model: A case study over winter wheat fields in a semi-arid region. Remote Sens. Environ. 2020, 239, 111627. [Google Scholar] [CrossRef] [Green Version]
  9. Biggs, T.W.; Marshall, M.; Messina, A. Mapping daily and seasonal evapotranspiration from irrigated crops using global climate grids and satellite imagery: Automation and methods comparison. Water Resour. Res. 2016, 52, 7311–7326. [Google Scholar] [CrossRef]
  10. Teixeira, A.H.D.C.; Bastiaanssen, W.G.M. Five methods to interpret field measurements of energy fluxes over a micro-sprinkler-irrigated mango orchard. Irrig. Sci. 2010, 30, 13–28. [Google Scholar] [CrossRef] [Green Version]
  11. Blatchford, M.L.; Mannaerts, C.M.; Zeng, Y.; Nouri, H.; Karimi, P. Status of accuracy in remotely sensed and in-situ agricultural water productivity estimates: A review. Remote Sens. Environ. 2019, 234, 111413. [Google Scholar] [CrossRef]
  12. Cai, W.; Ullah, S.; Yan, L.; Lin, Y. Remote Sensing of Ecosystem Water Use Efficiency: A Review of Direct and Indirect Estimation Methods. Remote Sens. 2021, 13, 2393. [Google Scholar] [CrossRef]
  13. Platonov, A.; Thenkabail, P.S.; Biradar, C.; Cai, X.; Gumma, M.K.; Dheeravath, V.; Cohen, Y.; Alchanatis, V.; Goldshlager, N.; Ben-Dor, E.; et al. Water Productivity Mapping (WPM) Using Landsat ETM+ Data for the Irrigated Croplands of the Syrdarya River Basin in Central Asia. Sensors 2008, 8, 8156–8180. [Google Scholar] [CrossRef] [PubMed] [Green Version]
  14. Foley, D.J.; Thenkabail, P.S.; Aneece, I.P.; Teluguntla, P.G.; Oliphant, A.J. A meta-analysis of global crop water productivity of three leading world crops (wheat, corn, and rice) in the irrigated areas over three decades. Int. J. Digit. Earth 2019, 13, 939–975. [Google Scholar] [CrossRef]
  15. Marshall, M.; Aneece, I.; Foley, D.; Xueliang, C.; Biggs, T. Crop Water Productivity Estimation with Hyperspectral Remote Sensing. In Advanced Applications in Remote Sensing of Agricultural Crops and Natural Vegetation; CRC Press: Boca Raton, FL, USA, 2018; pp. 79–96. [Google Scholar]
  16. Allen, R.; Irmak, A.; Trezza, R.; Hendrickx, J.M.H.; Bastiaanssen, W.; Kjaersgaard, J. Satellite-based ET estimation in agriculture using SEBAL and METRIC. Hydrol. Process. 2011, 25, 4011–4027. [Google Scholar] [CrossRef]
  17. Bastiaanssen, W.G.M.; Menenti, M.; Feddes, R.A.; Holtslag, A.A.M. A remote sensing surface energy balance algorithm for land (SEBAL). 1. Formulation. J. Hydrol. 1998, 212, 198–212. [Google Scholar] [CrossRef]
  18. Senay, G.B.; Friedrichs, M.; Singh, R.K.; Velpuri, N.M. Evaluating Landsat 8 evapotranspiration for water use mapping in the Colorado River Basin. Remote Sens. Environ. 2016, 185, 171–185. [Google Scholar] [CrossRef] [Green Version]
  19. Allen, R.G.; Tasumi, M.; Trezza, R. Satellite-Based Energy Balance for Mapping Evapotranspiration with Internalized Calibration (METRIC)—Model. J. Irrig. Drain. Eng. 2007, 133, 380–394. [Google Scholar] [CrossRef]
  20. Anderson, M.C.; Kustas, W.P.; Norman, J.M.; Hain, C.R.; Mecikalski, J.R.; Schultz, L.; González-Dugo, M.; Cammalleri, C.; d’Urso, G.; Pimstein, A. Mapping daily evapotranspiration at field to continental scales using geostationary and polar orbiting satellite imagery. Hydrol. Earth Syst. Sci. 2011, 15, 223–239. [Google Scholar] [CrossRef] [Green Version]
  21. Senay, G.B.; Bohms, S.; Singh, R.K.; Gowda, P.H.; Velpuri, N.M.; Alemu, H.; Verdin, J.P. Operational Evapotranspiration Mapping Using Remote Sensing and Weather Datasets: A New Parameterization for the SSEB Approach. JAWRA J. Am. Water Resour. Assoc. 2013, 49, 577–591. [Google Scholar] [CrossRef] [Green Version]
  22. Su, Z. The Surface Energy Balance System (SEBS) for estimation of turbulent heat fluxes. Hydrol. Earth Syst. Sci. 2002, 6, 85–100. [Google Scholar] [CrossRef]
  23. Bastiaanssen, W.G.M.; Pelgrum, H.; Wang, J.; Ma, Y.; Moreno, J.F.; Roerink, G.J.; van der Wal, T. A remote sensing surface energy balance algorithm for land (SEBAL): Part 2: Validation. J. Hydrol. 1998, 212, 213–229. [Google Scholar] [CrossRef]
  24. Nyolei, D.; Nsaali, M.; Minaya, V.; van Griensven, A.; Mbilinyi, B.; Diels, J.; Hessels, T.; Kahimba, F. High resolution mapping of agricultural water productivity using SEBAL in a cultivated African catchment, Tanzania. Phys. Chem. Earth Parts A B C 2019, 112, 36–49. [Google Scholar] [CrossRef]
  25. Wagle, P.; Bhattarai, N.; Gowda, P.H.; Kakani, V.G. Performance of five surface energy balance models for estimating daily evapotranspiration in high biomass sorghum. ISPRS J. Photogramm. Remote Sens. 2017, 128, 192–203. [Google Scholar] [CrossRef] [Green Version]
  26. Xue, J.; Bali, K.M.; Light, S.; Hessels, T.; Kisekka, I. Evaluation of remote sensing-based evapotranspiration models against surface renewal in almonds, tomatoes and maize. Agric. Water Manag. 2020, 238, 106228. [Google Scholar] [CrossRef]
  27. Bastiaanssen, W.G.M.; Noordman, E.J.M.; Pelgrum, H.; Davids, G.; Thoreson, B.P.; Allen, R.G. SEBAL Model with Remotely Sensed Data to Improve Water-Resources Management under Actual Field Conditions. J. Irrig. Drain. Eng. 2005, 131, 85–93. [Google Scholar] [CrossRef]
  28. Zwart, S.J.; Bastiaanssen, W.G. SEBAL for detecting spatial variation of water productivity and scope for improvement in eight irrigated wheat systems. Agric. Water Manag. 2007, 89, 287–296. [Google Scholar] [CrossRef]
  29. Bastiaanssen, W.G.M.; Ali, S. A new crop yield forecasting model based on satellite measurements applied across the Indus Basin, Pakistan. Agric. Ecosyst. Environ. 2003, 94, 321–340. [Google Scholar] [CrossRef]
  30. Schull, M.A.; Anderson, M.C.; Houborg, R.; Gitelson, A.; Kustas, W.P. Thermal-based modeling of coupled carbon, water, and energy fluxes using nominal light use efficiencies constrained by leaf chlorophyll observations. Biogeosciences 2015, 12, 1511–1523. [Google Scholar] [CrossRef] [Green Version]
  31. Dos Santos, R.A.; Mantovani, E.C.; Filgueiras, R.; Fernandes-Filho, E.I.; Da Silva, A.C.B.; Venancio, L.P. Actual Evapotranspiration and Biomass of Maize from a Red–Green-Near-Infrared (RGNIR) Sensor on Board an Unmanned Aerial Vehicle (UAV). Water 2020, 12, 2359. [Google Scholar] [CrossRef]
  32. Sadras, V.; Cassman, K.; Grassini, P.; Bastiaanssen, W.; Laborte, A.; Milne, A.; Sileshi, G.; Steduto, P. Yield Gap Analysis of Field Crops: Methods and Case Studies; Food and Agriculture Organization of the United Nations: Rome, Italy, 2015. [Google Scholar]
  33. AghaKouchak, A.; Norouzi, H.; Madani, K.; Mirchi, A.; Azarderakhsh, M.; Nazemi, A.; Nasrollahi, N.; Farahmand, A.; Mehran, A.; Hasanzadeh, E. Aral Sea syndrome desiccates Lake Urmia: Call for action. J. Great Lakes Res. 2015, 41, 307–311. [Google Scholar] [CrossRef]
  34. Chaudhari, S.; Felfelani, F.; Shin, S.; Pokhrel, Y. Climate and anthropogenic contributions to the desiccation of the second largest saline lake in the twentieth century. J. Hydrol. 2018, 560, 342–353. [Google Scholar] [CrossRef]
  35. Ghale, Y.A.G.; Altunkaynak, A.; Unal, A. Investigation Anthropogenic Impacts and Climate Factors on Drying up of Urmia Lake using Water Budget and Drought Analysis. Water Resour. Manag. 2017, 32, 325–337. [Google Scholar] [CrossRef]
  36. Schulz, S.; Darehshouri, S.; Hassanzadeh, E.; Tajrishy, M.; Schüth, C. Climate change or irrigated agriculture – what drives the water level decline of Lake Urmia. Sci. Rep. 2020, 10, 1–10. [Google Scholar] [CrossRef] [PubMed] [Green Version]
  37. Ghale, Y.A.G.; Tayanc, M.; Unal, A. Dried bottom of Urmia Lake as a new source of dust in the northwestern Iran: Understanding the impacts on local and regional air quality. Atmospheric Environ. 2021, 262, 118635. [Google Scholar] [CrossRef]
  38. Pengra, B. The Drying of Iran’s Lake Urmia and its Environmental Consequences; UNEP-GRID, Sioux Falls, UNEP Global Environmental Alert Service (GEAS): Sioux Falls, SD, USA, 2012. [Google Scholar]
  39. Tourian, M.; Elmi, O.; Chen, Q.; Devaraju, B.; Roohi, S.; Sneeuw, N. A spaceborne multisensor approach to monitor the desiccation of Lake Urmia in Iran. Remote Sens. Environ. 2015, 156, 349–360. [Google Scholar] [CrossRef]
  40. Saemian, P.; Elmi, O.; Vishwakarma, B.; Tourian, M.; Sneeuw, N. Analyzing the Lake Urmia restoration progress using ground-based and spaceborne observations. Sci. Total Environ. 2020, 739, 139857. [Google Scholar] [CrossRef]
  41. Khazaei, B.; Khatami, S.; Alemohammad, S.H.; Rashidi, L.; Wu, C.; Madani, K.; Kalantari, Z.; Destouni, G.; Aghakouchak, A. Climatic or regionally induced by humans? Tracing hydro-climatic and land-use changes to better understand the Lake Urmia tragedy. J. Hydrol. 2019, 569, 203–217. [Google Scholar] [CrossRef]
  42. Zwart, S.J.; Bastiaanssen, W.G.M. Review of measured crop water productivity values for irrigated wheat, rice, cotton and maize. Agric. Water Manag. 2004, 69, 115–133. [Google Scholar] [CrossRef]
  43. Mekonnen, M.M.; Hoekstra, A.Y. Water footprint benchmarks for crop production: A first global assessment. Ecol. Indic. 2014, 46, 214–223. [Google Scholar] [CrossRef] [Green Version]
  44. Blatchford, M.L.; Karimi, P.; Bastiaanssen, W.; Nouri, H. From Global Goals to Local Gains—A Framework for Crop Water Productivity. ISPRS Int. J. Geo-Inf. 2018, 7, 414. [Google Scholar] [CrossRef]
  45. Gorelick, N.; Hancher, M.; Dixon, M.; Ilyushchenko, S.; Thau, D.; Moore, R. Google Earth Engine: Planetary-scale geospatial analysis for everyone. Remote Sens. Environ. 2017, 202, 18–27. [Google Scholar] [CrossRef]
  46. Laipelt, L.; Kayser, R.H.B.; Fleischmann, A.S.; Ruhoff, A.; Bastiaanssen, W.; Erickson, T.A.; Melton, F. Long-term monitoring of evapotranspiration using the SEBAL algorithm and Google Earth Engine cloud computing. ISPRS J. Photogramm. Remote Sens. 2021, 178, 81–96. [Google Scholar] [CrossRef]
  47. Ghorbanpour, A.K.; Hessels, T.; Moghim, S.; Afshar, A. Comparison and assessment of spatial downscaling methods for enhancing the accuracy of satellite-based precipitation over Lake Urmia Basin. J. Hydrol. 2021, 596, 126055. [Google Scholar] [CrossRef]
  48. Danesh-Yazdi, M.; Ataie-Ashtiani, B. Lake Urmia crisis and restoration plan: Planning without appropriate data and model is gambling. J. Hydrol. 2019, 576, 639–651. [Google Scholar] [CrossRef]
  49. Bastiaanssen, W.G. SEBAL-based sensible and latent heat fluxes in the irrigated Gediz Basin, Turkey. J. Hydrol. 2000, 229, 87–100. [Google Scholar] [CrossRef]
  50. Tasumi, M.; Allen, R.G.; Trezza, R. At-Surface Reflectance and Albedo from Satellite for Operational Calculation of Land Surface Energy Balance. J. Hydrol. Eng. 2008, 13, 51–63. [Google Scholar] [CrossRef]
  51. Jaafar, H.H.; Ahmad, F.A. Time series trends of Landsat-based ET using automated calibration in METRIC and SEBAL: The Bekaa Valley, Lebanon. Remote Sens. Environ. 2020, 238, 111034. [Google Scholar] [CrossRef]
  52. Allen, R.G.; Burnett, B.; Kramber, W.; Huntington, J.; Kjaersgaard, J.; Kilic, A.; Kelly, C.; Trezza, R. Automated Calibration of the METRIC-Landsat Evapotranspiration Process. JAWRA J. Am. Water Resour. Assoc. 2013, 49, 563–576. [Google Scholar] [CrossRef]
  53. Monteith, J.L. Solar Radiation and Productivity in Tropical Ecosystems. J. Appl. Ecol. 1972, 9, 747–766. [Google Scholar] [CrossRef] [Green Version]
  54. Sandana, P.; Pinochet, D. Grain yield and phosphorus use efficiency of wheat and pea in a high yielding environment. J. Soil Sci. Plant Nutr. 2014, 14, 973–986. [Google Scholar] [CrossRef]
  55. Teixeira, A.D.C.; de Miranda, F.; Leivas, J.; Pacheco, E.; Garçon, E. Water productivity assessments for dwarf coconut by using Landsat 8 images and agrometeorological data. ISPRS J. Photogramm. Remote Sens. 2019, 155, 150–158. [Google Scholar] [CrossRef]
  56. Jarvis, P.G. The interpretation of the variations in leaf water potential and stomatal conductance found in canopies in the field. Philos. Trans. R. Soc. B Biol. Sci. 1976, 273, 593–610. [Google Scholar]
  57. Bastiaanssen, W.; Miltenburg, I.; Zwart, S. Global-WP, Modelling and Mapping Global Water Productivity of Wheat, Maize and Rice; Report to FAO Land and Water Division, Rome, Italy; Food and Agriculture Organization of the United Nations: Rome, Italy, 2010; p. 115. [Google Scholar]
  58. Foga, S.; Scaramuzza, P.L.; Guo, S.; Zhu, Z.; Dilley, R.D.; Beckmann, T.; Schmidt, G.L.; Dwyer, J.L.; Hughes, M.J.; Laue, B. Cloud detection algorithm comparison and validation for operational Landsat data products. Remote Sens. Environ. 2017, 194, 379–390. [Google Scholar] [CrossRef] [Green Version]
  59. Hersbach, H.; Bell, B.; Berrisford, P.; Hirahara, S.; Horányi, A.; Muñoz-Sabater, J.; Nicolas, J.; Peubey, C.; Radu, R.; Schepers, D. The ERA5 global reanalysis. Q. J. R. Meteorol. Soc. 2020, 146, 1999–2049. [Google Scholar] [CrossRef]
  60. Muñoz-Sabater, J.; Dutra, E.; Agustí-Panareda, A.; Albergel, C.; Arduini, G.; Balsamo, G.; Boussetta, S.; Choulga, M.; Harrigan, S.; Hersbach, H.; et al. ERA5-Land: A state-of-the-art global reanalysis dataset for land applications. Earth Syst. Sci. Data 2021, 13, 1–50. [Google Scholar] [CrossRef]
  61. Hargreaves, G.H.; Samani, Z.A. Reference Crop Evapotranspiration from Temperature. Appl. Eng. Agric. 1985, 1, 96–99. [Google Scholar] [CrossRef]
  62. Javadian, M.; Behrangi, A.; Gholizadeh, M.; Tajrishy, M. METRIC and WaPOR Estimates of Evapotranspiration over the Lake Urmia Basin: Comparative Analysis and Composite Assessment. Water 2019, 11, 1647. [Google Scholar] [CrossRef] [Green Version]
  63. Mohebzadeh, H.; Fallah, M. Quantitative analysis of water balance components in Lake Urmia, Iran using remote sensing technology. Remote Sens. Appl. Soc. Environ. 2019, 13, 389–400. [Google Scholar] [CrossRef]
  64. Taheri, M.; Emadzadeh, M.; Gholizadeh, M.; Tajrishi, M.; Ahmadi, M.; Moradi, M. Investigating the temporal and spatial variations of water consumption in Urmia Lake River Basin considering the climate and anthropogenic effects on the agriculture in the basin. Agric. Water Manag. 2018, 213, 782–791. [Google Scholar] [CrossRef]
  65. Tasumi, M. Estimating evapotranspiration using METRIC model and Landsat data for better understandings of regional hydrology in the western Urmia Lake Basin. Agric. Water Manag. 2019, 226, 105805. [Google Scholar] [CrossRef]
  66. Falkenmark, M.; Rockström, J. The New Blue and Green Water Paradigm: Breaking New Ground for Water Resources Planning and Management; American Society of Civil Engineers: Reston, VA, USA, 2006. [Google Scholar]
  67. Ahmadzadeh, H.; Morid, S.; Delavar, M.; Srinivasan, R. Using the SWAT model to assess the impacts of changing irrigation from surface to pressurized systems on water productivity and water saving in the Zarrineh Rud catchment. Agric. Water Manag. 2016, 175, 15–28. [Google Scholar] [CrossRef]
  68. Ghorbanpour, A.K.; Afshar, A.; Hessels, T.; Duan, Z. Water and productivity accounting using WA+ framework for sustainable water resources management: Case study of northwestern Iran. Phys. Chem. Earth Parts A B C 2022, 128, 103245. [Google Scholar] [CrossRef]
  69. Pouladi, P.; Badiezadeh, S.; Pouladi, M.; Yousefi, P.; Farahmand, H.; Kalantari, Z.; Yu, D.J.; Sivapalan, M. Interconnected governance and social barriers impeding the restoration process of Lake Urmia. J. Hydrol. 2021, 598, 126489. [Google Scholar] [CrossRef]
  70. Rockström, J.; Lannerstad, M.; Falkenmark, M. Assessing the water challenge of a new green revolution in developing countries. Proc. Natl. Acad. Sci. USA 2007, 104, 6253–6260. [Google Scholar] [CrossRef] [PubMed] [Green Version]
  71. Faramarzi, M.; Yang, H.; Schulin, R.; Abbaspour, K.C. Modeling wheat yield and crop water productivity in Iran: Implications of agricultural water management for wheat production. Agric. Water Manag. 2010, 97, 1861–1875. [Google Scholar] [CrossRef]
  72. Chukalla, A.D.; Krol, M.S.; Hoekstra, A.Y. Green and blue water footprint reduction in irrigated agriculture: Effect of irrigation techniques, irrigation strategies and mulching. Hydrol. Earth Syst. Sci. 2015, 19, 4877–4891. [Google Scholar] [CrossRef] [Green Version]
  73. Teixeira, A.D.C.; Bassoi, L.H. Crop Water Productivity in Semi-Arid Regions: From Field to Large Scales; Embrapa Semiárido-Artigo em periódico indexado (ALICE): Brasillia, Brazil, 2009. [Google Scholar]
  74. Xue, J.; Huo, Z.; Kisekka, I. Assessing impacts of climate variability and changing cropping patterns on regional evapotranspiration, yield and water productivity in California’s San Joaquin watershed. Agric. Water Manag. 2021, 250, 106852. [Google Scholar] [CrossRef]
  75. Naboureh, A.; Li, A.; Ebrahimy, H.; Bian, J.; Azadbakht, M.; Amani, M.; Lei, G.; Nan, X. Assessing the effects of irrigated agricultural expansions on Lake Urmia using multi-decadal Landsat imagery and a sample migration technique within Google Earth Engine. Int. J. Appl. Earth Obs. Geoinf. ITC J. 2021, 105, 102607. [Google Scholar] [CrossRef]
  76. Pfeiffer, L.; Lin, C.-Y.C. Does efficient irrigation technology lead to reduced groundwater extraction? Empirical evidence. J. Environ. Econ. Manag. 2014, 67, 189–208. [Google Scholar] [CrossRef] [Green Version]
  77. Grafton, R.Q.; Williams, J.; Perry, C.J.; Molle, F.; Ringler, C.; Steduto, P.; Udall, B.; Wheeler, S.A.; Wang, Y.; Garrick, D.; et al. The paradox of irrigation efficiency. Science 2018, 361, 748–750. [Google Scholar] [CrossRef]
  78. Perry, C.; Steduto, P.; Karajeh, F. Does Improved Irrigation Technology Save Water? A review of the Evidence; Food and Agriculture Organization of the United Nations: Cairo, Egypt, 2017; p. 42. [Google Scholar]
Figure 1. Study area and location of major agricultural sites in Lake Urmia Basin.
Remotesensing 14 04934 g001
Figure 2. An overview of the selected irrigated crops in LUB.
Remotesensing 14 04934 g002
Figure 3. Workflow of the WP model within GEE.
Remotesensing 14 04934 g003
Figure 4. Comparison of SEBAL-based ET and reported water requirement for the selected crops in the study area.
Remotesensing 14 04934 g004
Figure 5. Seasonal ET maps for (a) west of Lake Urmia Basin (WLUB), (b) southwest of Lake Urmia Basin (SWLUB), and (c) south of Lake Urmia Basin (SLUB).
Remotesensing 14 04934 g005
Figure 6. Monthly precipitation, reference ET, and actual ET for each individual crop in major agricultural districts in LUB.
Remotesensing 14 04934 g006
Figure 7. Seasonal evapotranspiration (ET) in agricultural sections in LUB.
Remotesensing 14 04934 g007
Figure 8. The WP status and comparison its comparison among three major agricultural lands in LUB.
Remotesensing 14 04934 g008
Figure 9. Examples of spatial maps of WP in LUB: (a) WP for grapes in WLUB, (b) WP for apples in WLUB, (c) WP for rainfed wheat in SWLUB, (d) WP for rainfed wheat in SLUB, (e) WP for irrigated wheat in SLUB, and (f) WP for grapes in SLUB.
Remotesensing 14 04934 g009
Figure 10. WP–Yield relationship for wheat in the study area.
Remotesensing 14 04934 g010
Figure 11. Frequency distribution of WP for irrigated wheat, rainfed wheat, apples, and grapes in LUB.
Remotesensing 14 04934 g011
Figure 12. Spatial variation of crop yield at each agricultural site in LUB.
Remotesensing 14 04934 g012
Table 1. Total crop area (km2) for the selected crops in west of Lake Urmia (WLUB), South of Lake Urmia (SLUB), and southwest of Lake Urmia (SWLUB).
CropWLUBSLUBSWLUBTotal
Rainfed Wheat49523965293420
Irrigated Wheat160398152710
Alfalfa213477157847
Sugar beets125441107
Apples231201151583
Grapes11515114280
Table 2. Data used in this study and their characteristics from GEE.
ProductGEE IDData Type/BandsPath/RowResolution
LANDSAT 8 OLI/TIRSLANDSAT/LC08/C01/
T1_SRLANDSAT/
LC08/C01/T1
Surface reflectance
Brightness temperature
168/34
&
169/34
30 m
LANDSAT 7ETM+LANDSAT/LE07/C01/
T1_SRLANDSAT/
LE07/C01/T1
Surface reflectance
Brightness temperature
168/34
&
169/34
30 m
ERA-5 hourlyECMWF/ERA5_LAND/
HOURLY
Meteorological data
including air temperature,
wind speed, solar radiation
-0.1°
SRTMUSGS/
SRTMGL1_003
Elevation-30 m
Table 3. Overview of WP mean, its relevant boundaries, and coefficient of variation (CV) for the selected crops in west of Lake Urmia (WLUB), South of Lake Urmia (SLUB), and southwest of Lake Urmia (SWLUB).
Crop TypeWLUBSLUBSWLUB
WP 5%WP MeanWP 99%CVWP 5%WP MeanWP 99%CVWP 5%WP MeanWP 99%CV
Irrigated wheat0.250.490.880.30.270.510.920.30.320.550.910.25
Rainfed wheat0.080.270.670.50.080.340.870.540.020.30.620.46
Apples1.12.23.10.240.71.730.341.122.80.22
Grapes0.91.72.70.260.561.22.20.370.681.32.20.28
Sugar beets3.65.580.23.35.68.70.243.76.229.40.23
Alfalfa0.40.670.930.220.551.081.60.250.450.7310.2
Table 4. WP gap and possible improvements for the selected crops in West of Lake Urmia (WLUB), South of Lake Urmia (SLUB), and Southwest of Lake Urmia (SWLUB).
Crop Type% of Crop Water Productivity Gap
towards Optimization
WP WLUBWP SLUBWP SWLUB
Irrigated wheat798065
Rainfed wheat148150100
Apples407640
Grapes588369
Sugar beets455551
Alfalfa384836
Publisher’s Note: MDPI stays neutral with regard to jurisdictional claims in published maps and institutional affiliations.