Article

The Quantitative Impact of the Arable Land Protection Policy on the Landscape of Farmland Abandonment in Guangdong Province

1
School of Management, Guangdong University of Technology, Guangzhou 510520, China
2
The Academy of Digital China, Fuzhou University, Fuzhou 350108, China
3
Big Data Development Center, Ministry of Agriculture and Rural Affairs of the People’s Republic of China, Beijing 100125, China
4
Guangdong Research Center for Smart Land, School of Geography, South China Normal University, Guangzhou 510631, China
*
Author to whom correspondence should be addressed.
Remote Sens. 2022, 14(19), 4991; https://doi.org/10.3390/rs14194991
Submission received: 19 September 2022 / Revised: 2 October 2022 / Accepted: 6 October 2022 / Published: 7 October 2022
(This article belongs to the Special Issue Monitoring Agricultural Land-Use Change and Land-Use Intensity Ⅱ)

Abstract

:
In the past two decades, the Ministry of Agriculture and Rural Affairs of China (MARA) has issued a series of strict cultivated land protection policies to prevent the spread of farmland abandonment and maintain a dynamic balance between the quantity and quality of arable land. However, high-speed economic development, strict arable land protection policies, and ecological security and sustainable development strategies interacting with human activities have brought challenges to quantifying the effectiveness of arable land protection policies. In this study, we proposed a method to quantify the impacts of the arable land protection policies and evaluate the quantitative impacts on farmland abandonment in Guangdong Province after 2014 from the perspective of landscape ecology. The results illustrated that the landscape fragmentation of farmland abandonment in Guangdong Province decreased after the new arable land policies were issued. More annual farmland abandonment (AFA) shifted to seasonal farmland abandonment (SFA), revealing the considerable pronounced effects of farmland abandonment management. The new policies effectively restrained the area increase for AFA in the regions with lower rural population (RPOP) and lower gross domestic product (GDP), and reduced the fragmentation of AFA in the regions with the highest RPOP and lower GDP. Additionally, the new policies effectively restrained the fragmentation increase for SFA in the regions with lower RPOP and lower GDP, and reduced the area increase for SFA in the regions with the highest RPOP and lower GDP. The management effect was not that significant in the regions with higher RPOP and higher GDP. These findings will provide important data references for arable land decision making in southern China.

1. Introduction

Farmland abandonment refers to an agricultural phenomenon that occurs when the rural labour force moves to urban areas due to urbanization and industrialization. Farmers stopped or reduced their farming activities for economic, social, natural, and political reasons [1,2,3,4]. The urbanization process is accelerating in China, with an urbanization rate of 17.92% in 1978, 53.73% in 2014, and 63.89% in 2020 [5]. Along with the expansion of urbanization, farmland abandonment management has become a serious issue impacting land use policies [6,7,8]. Guangdong Province is located in the Guangdong–Hong Kong–Macao Greater Bay Area, and its limited arable land resources with a high urbanization expansion rate leads to a high risk of farmland abandonment in Guangdong Province [9,10]. Concurrently, rapid economic development brings considerable employment opportunities, a high cost of farming, and relatively low income from farming. All these factors encourage rural labourers to voluntarily move to nonfarm industries, eventually intensifying the risk of farmland abandonment [11,12]. Farmland abandonment leads to the waste of arable land resources, a decline in agricultural production capacity, and negative impacts on food security and ecological sustainability [13,14,15]. In the context of economic development in China, the dominance of agricultural land in China has decreased. The impact of human activities on the landscape pattern of cultivated land is becoming increasingly complex [16,17,18]. The spatial heterogeneity of farmland landscape patterns is a result of the interaction between human activities and farmland ecosystems. It reflects the farmland landscape function and farmland ecological process, which are essential to the sustainable development of agriculture [19,20,21]. The landscape pattern and evolution of farmland abandonment can help us scientifically understand the mechanism of farmland abandonment and can benefit agricultural land use policies.
There have been a series of arable land protection policies issued by the Chinese government to prevent farmland abandonment [22,23]. These momentous policies include the following. (1) The permanent basic farmland policy is the concept of permanent basic farmland that was introduced by the MARA in 2008. Permanent basic farmland refers to basic farmland that cannot be used for other purposes under any circumstances or in any other way. In 2014, the Ministry of Natural Resources (MNR) and MARA jointly issued the Notice on Further Improving the Delineation of Permanent Basic Farmland, which highlighted the importance and urgency of permanent basic farmland protection [24,25]. (2) The cultivated land requisition–compensation balance policy is the requisition–compensation balance that refers to however much farmland is occupied by construction, then farmland with the equivalent quantity and quality should be allocated by the local government. This policy was proposed in 1997, and MARA issued the notice on Strengthening Control and Implementing the Strictest Cultivated Land Protection System in 2014. This policy proposed increasingly stricter requirements for arable land protection, and it is still being improved [4,22]. The purpose of this policy is to maintain a dynamic balance between the quality and quantity of cultivated land, while human activities resulting from urbanization may lead to the fragmentation of the spatial pattern of cultivated land. (3) The crop rotation and farmland fallow policy refers to combining land use and cultivation via a planting method in which different crops or multiple cropping combinations are planted sequentially in the same field between seasons and years. Farmland fallow refers to intentionally letting the farmland rest with the intention of improving the soil. MARA issued a related policy on comprehensively deepening rural reform and accelerating agricultural modernization in 2014. This policy has been implemented on a large scale since 2016 [26,27]. The cultivated land protection policy guarantees the quantity of cultivated land and pays attention to quality and ecological sustainability. Quantitative analysis of the efficiency of different cultivated land policies on farmland abandonment management can provide data support for land policy making.
Previous researchers have tried to quantitatively analyse the relationship between cultivated land policy and arable land use changes with empirical statistical methods, system dynamics methods, and geographic simulation methods. Some studies have explored the driving factors and mechanisms of land use change with empirical statistical methods by modelling the multiple regression between land use types and driving factors [28,29,30]. These studies paid more attention to natural factors than land policy spatialization; it is difficult to achieve quantitative impacts with only land policy. System dynamics methods regard land change and external policy impact as a system, selecting driving factors and simulating land use change processes by modelling the closed interdependence between human activities and intrinsic mechanisms [31,32,33]. These studies employed land use data as input; it is difficult to quantify the policy impacts. Because the natural condition and socioeconomic environment affects farmland abandonment as a complex human–land interaction system, a forward quantitative analysis of the effectiveness of arable land policy needs to distinguish the policy effects from the natural and socioeconomic factors [2,34,35]. This is the reason why a large number of studies related to farmland abandonment have been devoted to the analysis of driving factors and driving mechanisms [2,10,36,37]. In recent years, geographic simulation methods, such as cellular automata, have typically been used to simulate future land use changes [38,39,40]. These methods can simulate the spatiotemporal land use evolution in different scenarios by learning the spatial pattern from the land use change transition matrix, which considers external interventions less [41,42,43,44]. It is assumed that the land use transfer types will be consistent if there is no new land policy implemented. The quantitative effectiveness of arable land policy can be evaluated by comparing the simulated farmland abandonment distribution that is not affected by formulated arable land policy with the actual farmland abandonment distribution.
Additionally, cloudy weather and humid climatic conditions in Guangdong Province permit multiple cropping patterns. These circumstances have resulted in various types of farmland abandonment. Considering the duration of abandonment, the types of farmland use include SFA, AFA, and continuously cultivated farmland (CCF) [45,46,47]. To date, there have been few studies that have focused on the quantitative effectiveness of the arable land protection policy in a multiple cropping region.
This study proposed a method to evaluate the quantitative impacts of the cultivated land protection policy after 2014 by comparing the actual distribution of farmland abandonment in 2019, which was affected by the series of strict arable land policies after 2014, and the simulated distribution of farmland abandonment in 2019, which was assumed to be continually managed by the land policy before 2014. The research objectives include (1) an analysis of the spatiotemporal landscape pattern of farmland abandonment in Guangdong Province from 2010 to 2019; (2) a simulation of the distribution of farmland abandonment in Guangdong Province in 2019 based on the CLUMondo model; and (3) a quantitative assessment of the effectiveness of arable land policy on farmland abandonment management.

2. Materials and Methods

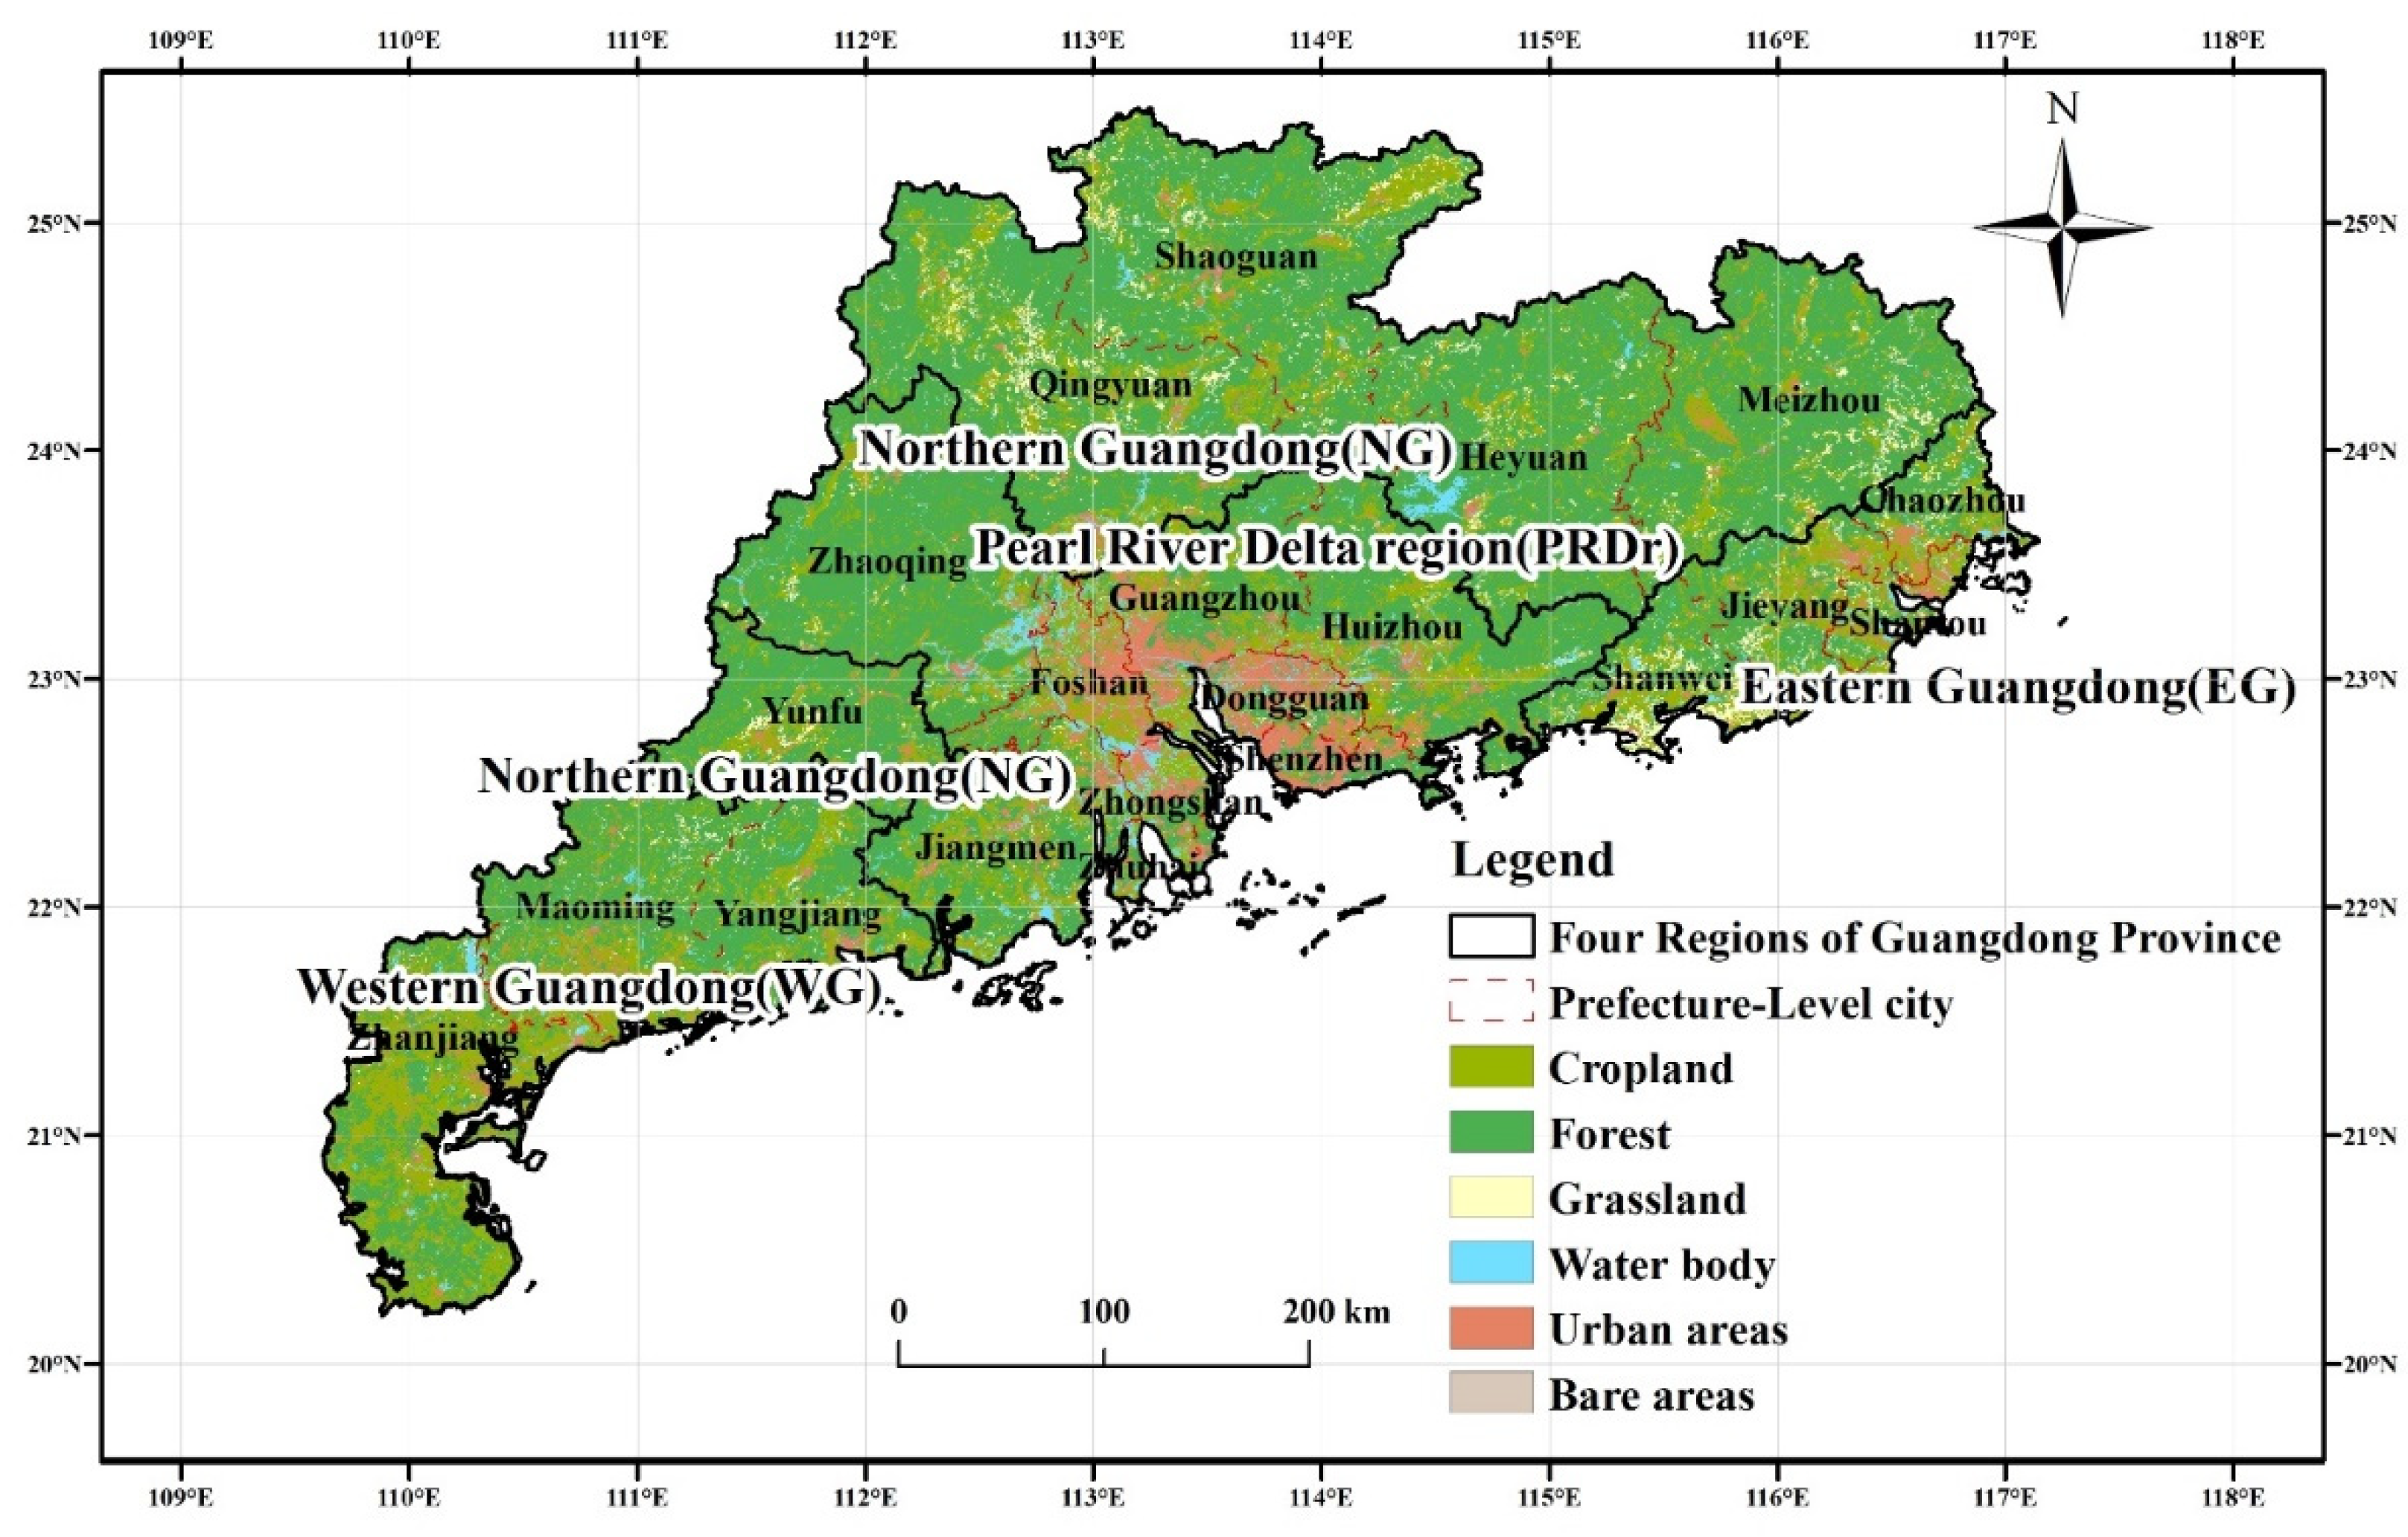
2.1. Description of the Study Area

Guangdong Province (20°13′–25°31′N, 109°45′–117°20′E) is located in southern China and is one of the most economically developed regions in China. During the past five years, Guangdong Province has had the highest GDP and the largest resident population in the country [48]. The area of arable land in Guangdong Province is approximately 2.6 million hectares, and the annual grain production is more than 13 million tons. The per capita arable land area is approximately 3.3 hectares, which is lower than the national average of 8.1 hectares per capita. The province can be divided into Northern Guangdong (NG), Eastern Guangdong (EG), Western Guangdong (WG), and the Pearl River Delta region (PRDr) according to geographical location and economic development status (Figure 1). NG has a vast mountainous area and is an important ecological region. EG mainly consists of a marine economy and is a characteristic urban agglomeration that is liveable and suitable for business. WG has a national heavy chemical industry base that focuses on the marine economy and modern agriculture. PRDr is the core area of economic development in both the province and the nation; it is also the core of the Guangdong–Hong Kong–Macao Greater Bay Area.

2.2. Data Preprocessing

The farmland abandonment map from 2010 to 2019 with a 500 m resolution was derived using the approach described in Li et al. [46]. The types of farmland abandonment were calculated by cropping cycles, which were retrieved from MODIS-EVI time series data. While identifying the types of farmland abandonment, the maximum number of cropping cycles in the last five years was considered as the potential cropping cycle without abandonment. The land use types for farmland abandonment maps here include SFA, AFA, CCF, and other land. SFA refers to farmland with multiple cropping practices abandoned in one or more growing seasons, and AFA refers to farmland abandoned for one year. CCF refers to arable land that has been cultivated for at least two consecutive years. The overall accuracy for most annual farmland abandonment maps was above 80% compared with current land cover products MCD12Q1 [22].
The statistical data used in the study were obtained from the Guangdong Provincial Statistical Yearbook and the Guangdong Rural Statistical Yearbook (http://stats.gd.gov.cn/ accessed on 30 June 2022). The DEM data were obtained from the Resource and Environment Science and Data Center (https://www.resdc.cn/ accessed on 30 June 2022). The road data and the settlement data were obtained from the National Catalogue Service for Geographic Information (https://www.webmap.cn/ accessed on 30 June 2022).

2.3. Land Use Transfer Matrix for Farmland Abandonment Calculation

To alleviate the impact from period length on farmland use change, the study took the year of 2014 as a time node, and selected four years before and after as the time period in farmland distribution simulation. While farmland distribution simulating, it is assumed that the land use transfer types during 2015–2019 are consistent with those during 2010–2014. Based on this assumption, the land use transfer matrices of farmland abandonment were derived from farmland abandonment maps separately for 2010–2014 and 2015–2019. Here, the land use types in the transfer matrix included AFA, SFA, CCF, and other land. The formula for calculating the land use transfer matrix for farmland abandonment was as follows
S i j = [ S 11 S 12 S 21 S 22   S 1 n S 2 n S n 1 S n 2   S n n ]
Here, i and j represent the type of farmland abandonment before and after, respectively. Sij represents the land area from farmland abandonment type i to farmland abandonment type j. n represents the number of farmland abandonment types.

2.4. Future Farmland Abandonment Simulation

The CLUMondo model is a land use simulation model with intuitive spatial benefits, and it is successfully used for land use change simulation considering land demand, bio-environmental sustainability, and socioeconomic impact [49,50,51]. The primary functional modules of the CLUMondo model include application characteristics, regression analysis, model parameters, and results and postprocessing.
CLUMondo was modelled and used to simulate the distribution of farmland abandonment in 2014 based on the distribution of farmland abandonment in 2010, then to simulate the distribution of farmland abandonment in 2019 based on the distribution of farmland abandonment in 2015. In the CLUMondo modelling, we assumed that the driving mechanism without a new arable land policy from 2010 to 2014 was the same as the driving mechanism from 2015 to 2019. The simulated distribution of farmland abandonment in 2019 was not affected by the arable land protection policy after 2014. Then, the impacts of the arable land protection policy after 2014 were quantified by comparing the actual distribution of farmland abandonment in 2019, which was affected by the series of strict arable land policies after 2014, and the simulated distribution of farmland abandonment in 2019, which was assumed to be continually managed by the land policy before 2014.
GDP, the population at the year end, the decrease in arable land, the total yield of grain, DEM, the distance from the abandoned farmland to the nearest roadways, and the distance from the abandoned farmland to the settlements were defined as the driving factors for farmland abandonment. The impacts of these driving factors were quantified on the prefecture-level city scale in Guangdong Province by the regression analysis module in CLUMondo.
Four land use types were selected in CLUMondo, including SFA, AFA, CCF, and other land. In the land use service module of CLUMondo, AFA and SFA were defined as the simulation objects of farmland abandonment, and the conversion unit was defined as pixels. In the conversion resistance module of CLUMondo, the conversion resistances of the four land use types were defined as 0.78, 0.85, 0.82, and 0.92 for AFA, SFA, CCF, and other land, respectively. The range of conversion resistance was [0, 1]. A high conversion resistance value indicates that the land has a high probability of being maintained in the current land use status. The direction of cultivated land use conversion is defined in the conversion matrix module in Table 1.

2.5. Simulation Distribution Evaluation

The area under the curve (AUC), Kappa value, and overall accuracy (OA) were used to evaluate the simulation results [52,53]. The AUC refers to the confidence level of driving factors for land use types, and it was calculated in the parameter selection module in CLUMondo. Kappa was used to evaluate the simulation results, and it was calculated as Equation (2).
K a p p a = p o p e 1 p o
where
p e = i = 1 n a i × b i n 2
Here, p o represents the proportion of correctly classified samples in total samples; p e represents the hypothetical probability of change agreement; n represents the total number of samples; and a i represents the observation number of land use type i; b i represents the number of predictions as land use types i.
The OA was calculated as Equation (3).
O A = 1 n N i h i t 1 n N i
Here, N i h i t presents the number of correctly classified samples for land use type i; N i presents the number of total samples for land use type i; n refers to the number of land use types.

2.6. Landscape Indices of Farmland Abandonment Calculation

Some researchers related to landscape ecology have regarded landscape indices as two types. They are landscape unit characteristic indices and landscape heterogeneity indices [54,55]. Among these landscape indices, the number of patches (NP) and mean patch size (MPS) were selected to describe the landscape unit characteristic, while aggregation index (AI) was selected to present the landscape heterogeneity [56,57,58,59] (Table 2). NP reflects the effect of the disturbance of human activities on nature and directly represents the fragmentation of abandoned farmland. A greater NP value indicates a more fragmented farmland abandonment landscape pattern with more human activities interfering with farmland. MPS refers to the average area of abandoned farmland. A smaller MPS value refers to a smaller patch size of abandoned farmland and indicates the fragmentation of abandoned farmland. AI reflects the connectivity and aggregation of abandoned farmland. The range of AI is [0, 100], and a greater AI value indicates a compact spatial distribution of abandoned farmland.
The landscape indices of abandoned farmland in NG, EG, WG, and PRDr from 2010 to 2019 were calculated, and their trends from 2010 to 2014 and from 2015 to 2019 were tested by the Mann–Kendall test. The Mann–Kendall test (MK test) is widely used in trend analysis in hydrology, climate, and other related areas [60,61,62]. The confidence level for the trend of abandoned farmland landscape indices in the MK test was set at 0.05.

2.7. Quantitative Analysis of the Impact of the Arable Land Protection Policy

The impacts of the arable land protection policy after 2014 were quantified by comparing the actual distribution of farmland abandonment in 2019, which was affected by the series of strict arable land policies after 2014, and the simulated distribution of farmland abandonment in 2019, which was assumed to be continually managed by the arable land protection policy before 2014.
Furthermore, ∆Area, ∆NP, ∆MPS, and ∆AI were calculated by subtracting the indices from simulated farmland abandonment in 2019 from the indices for actual farmland abandonment. All index difference data were taken as absolute values and normalized to [–1, 1], while GDP and RPOP were normalized to [0, 1]. An ∆Area less than 0 indicates that the new arable land policy restrains the increase in farmland abandonment. An ∆NP less than 0, ∆MPS greater than 0, and ∆AI greater than 0 all indicate that the new arable land policy restrains the fragmentation increase in farmland abandonment.

3. Results

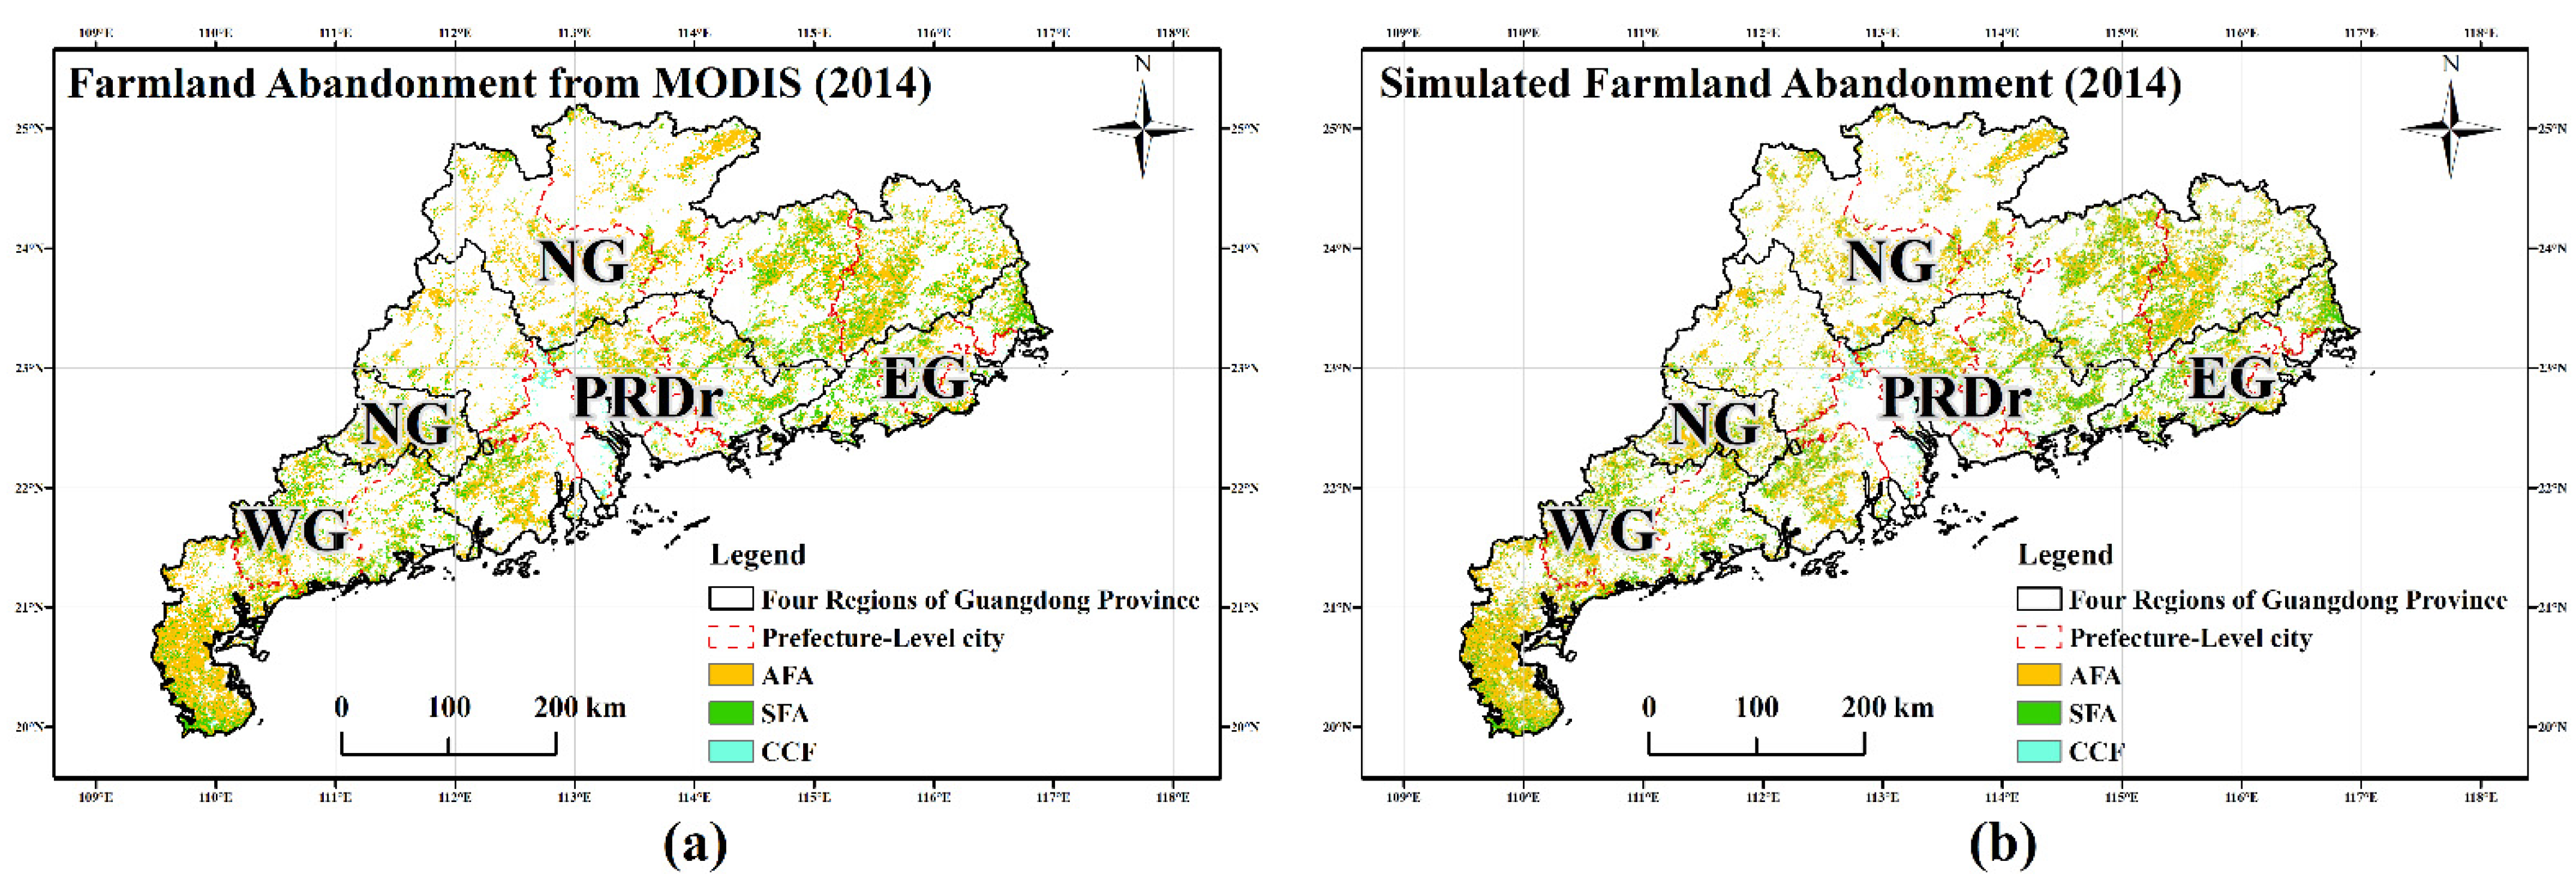
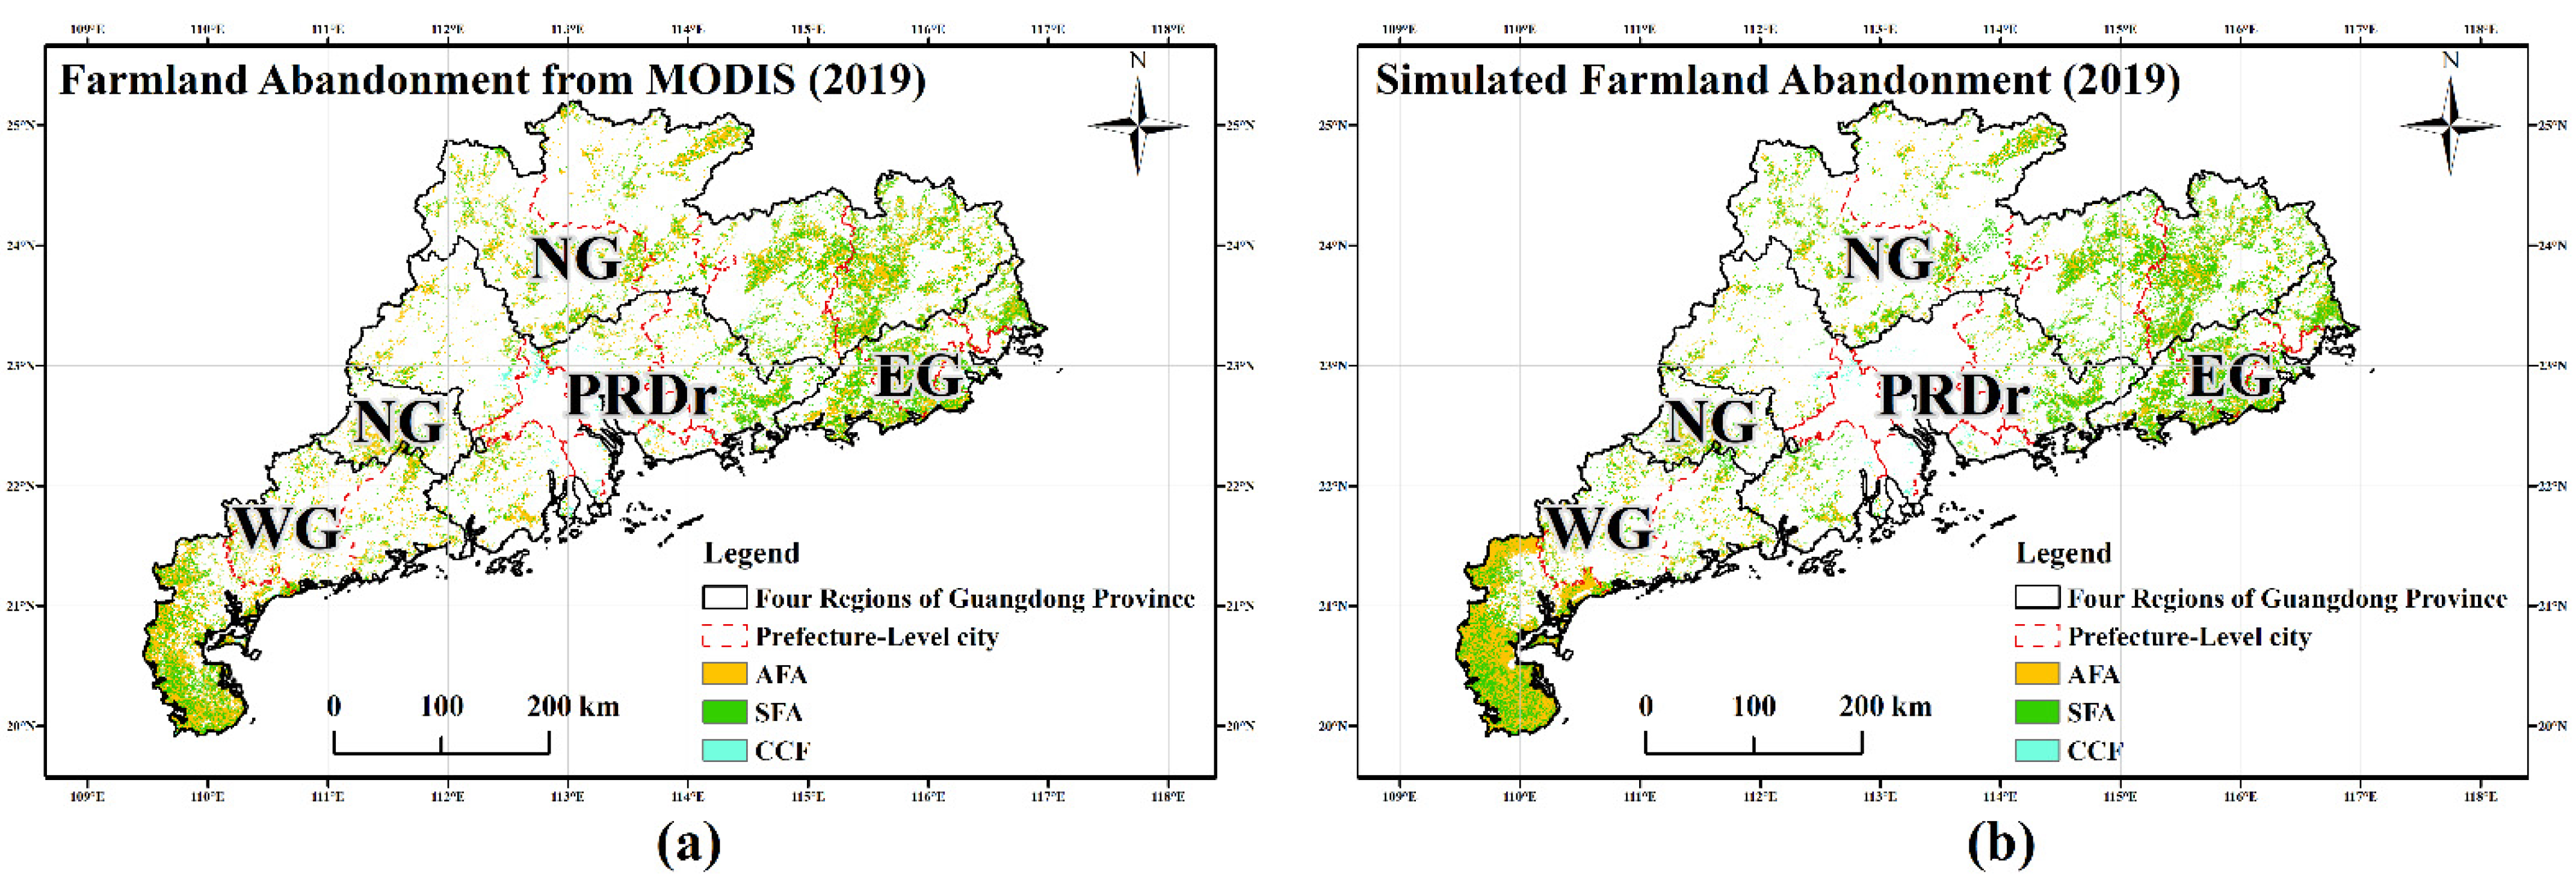
3.1. The Spatiotemporal Patterns of Farmland Abandonment in Guangdong Province

The NP of farmland abandonment in Guangdong Province increased during 2010–2019, and the increase during 2015–2019 was lower than that during 2010–2014 (Figure 2a). The NP during 2010–2014 increased significantly, with an increase of 27.59%, while the NP during 2015–2019 increased nonsignificantly, with an increase of 9.46% (Table 3). The pattern change in NP varied in the four regions. During 2010–2014, EG had the greatest variance in NP, with an increase of 120.72%. During 2015–2019, PRDr had the greatest variance in NP, with a nonsignificant increase of 23.64%. For most of the period from 2010–2019, the NP in NG was higher than that in the other three regions.
MPS decreased in Guangdong Province during 2010–2019 (Figure 2b), indicating that the average plot size of abandoned farmland decreased, and the decline during 2015–2019 was lower than that during 2010–2014 (Table 3). During 2010–2014, the variance in MPS was greatest in the EG, with a nonsignificant decline of 72.35%, while the variance in MPS was greatest in the NG, with a nonsignificant increase of 33.43% during 2015–2019. For most of the period from 2010–2019, PRDr had a lower MPS than the other three regions.
From 2010 to 2019, the AI in Guangdong Province showed a declining trend before 2014 and a rising trend after 2014 (Figure 2c), indicating that the abandoned farmland in Guangdong Province became more fragmented before 2014 and improved after 2014. AI decreased nonsignificantly with a decrease of 3.88% during 2010–2014, and it increased nonsignificantly with an increase of 0.05% during 2015–2019 (Table 3). Among these four regions, the aggregation of abandoned farmland in the PRDr was most affected by human activities. PRDr presented the greatest variance in AI, with a significant decrease of 21.04% during 2010–2014 and a nonsignificant decrease of 6.30% during 2015–2019. For most of the period from 2010–2019, PRDr had a lower AI than the other three regions.

3.2. Changes in Different Farmland Abandonment Types

The transfer matrix of abandoned farmland suggests intensive human activities occurred on the different types of farmland abandonment that had been converted (Table 4). The decline in farmland abandonment and most of the AFA shifting to SFA reflect that farmland abandonment was being managed during 2010–2014, as SFA clearly increased. The total area of abandoned farmland decreased by 2.17%. The area of AFA decreased by 11.46%. with 8.74% changed to SFA and 2.89% changed to other lands. The SFA area increased by 25.84%, with 26.39% from AFA. The CCF decreased by 16.70%, with 4.59% changing to AFA and 12.17% changing to other land.
During 2015–2019, the declining trend of farmland abandonment and the shifts between farmland abandonment types were similar to those during 2010–2014, and a higher reduction in AFA revealed more pronounced effects of farmland abandonment governance. The total area of abandoned farmland decreased by 4.92%. The area of AFA decreased by 23.93%, with 14.14% changing to SFA and 10.15% changing to other land. The SFA area increased by 32.67%, with 27.98% from AFA, 0.28% from CCF, and 4.41% from other land. CCF decreased with a proportion of 23.23%, with 8.31% changed to AFA, 2.26% changed to SFA, and 11.66% changed to other land.

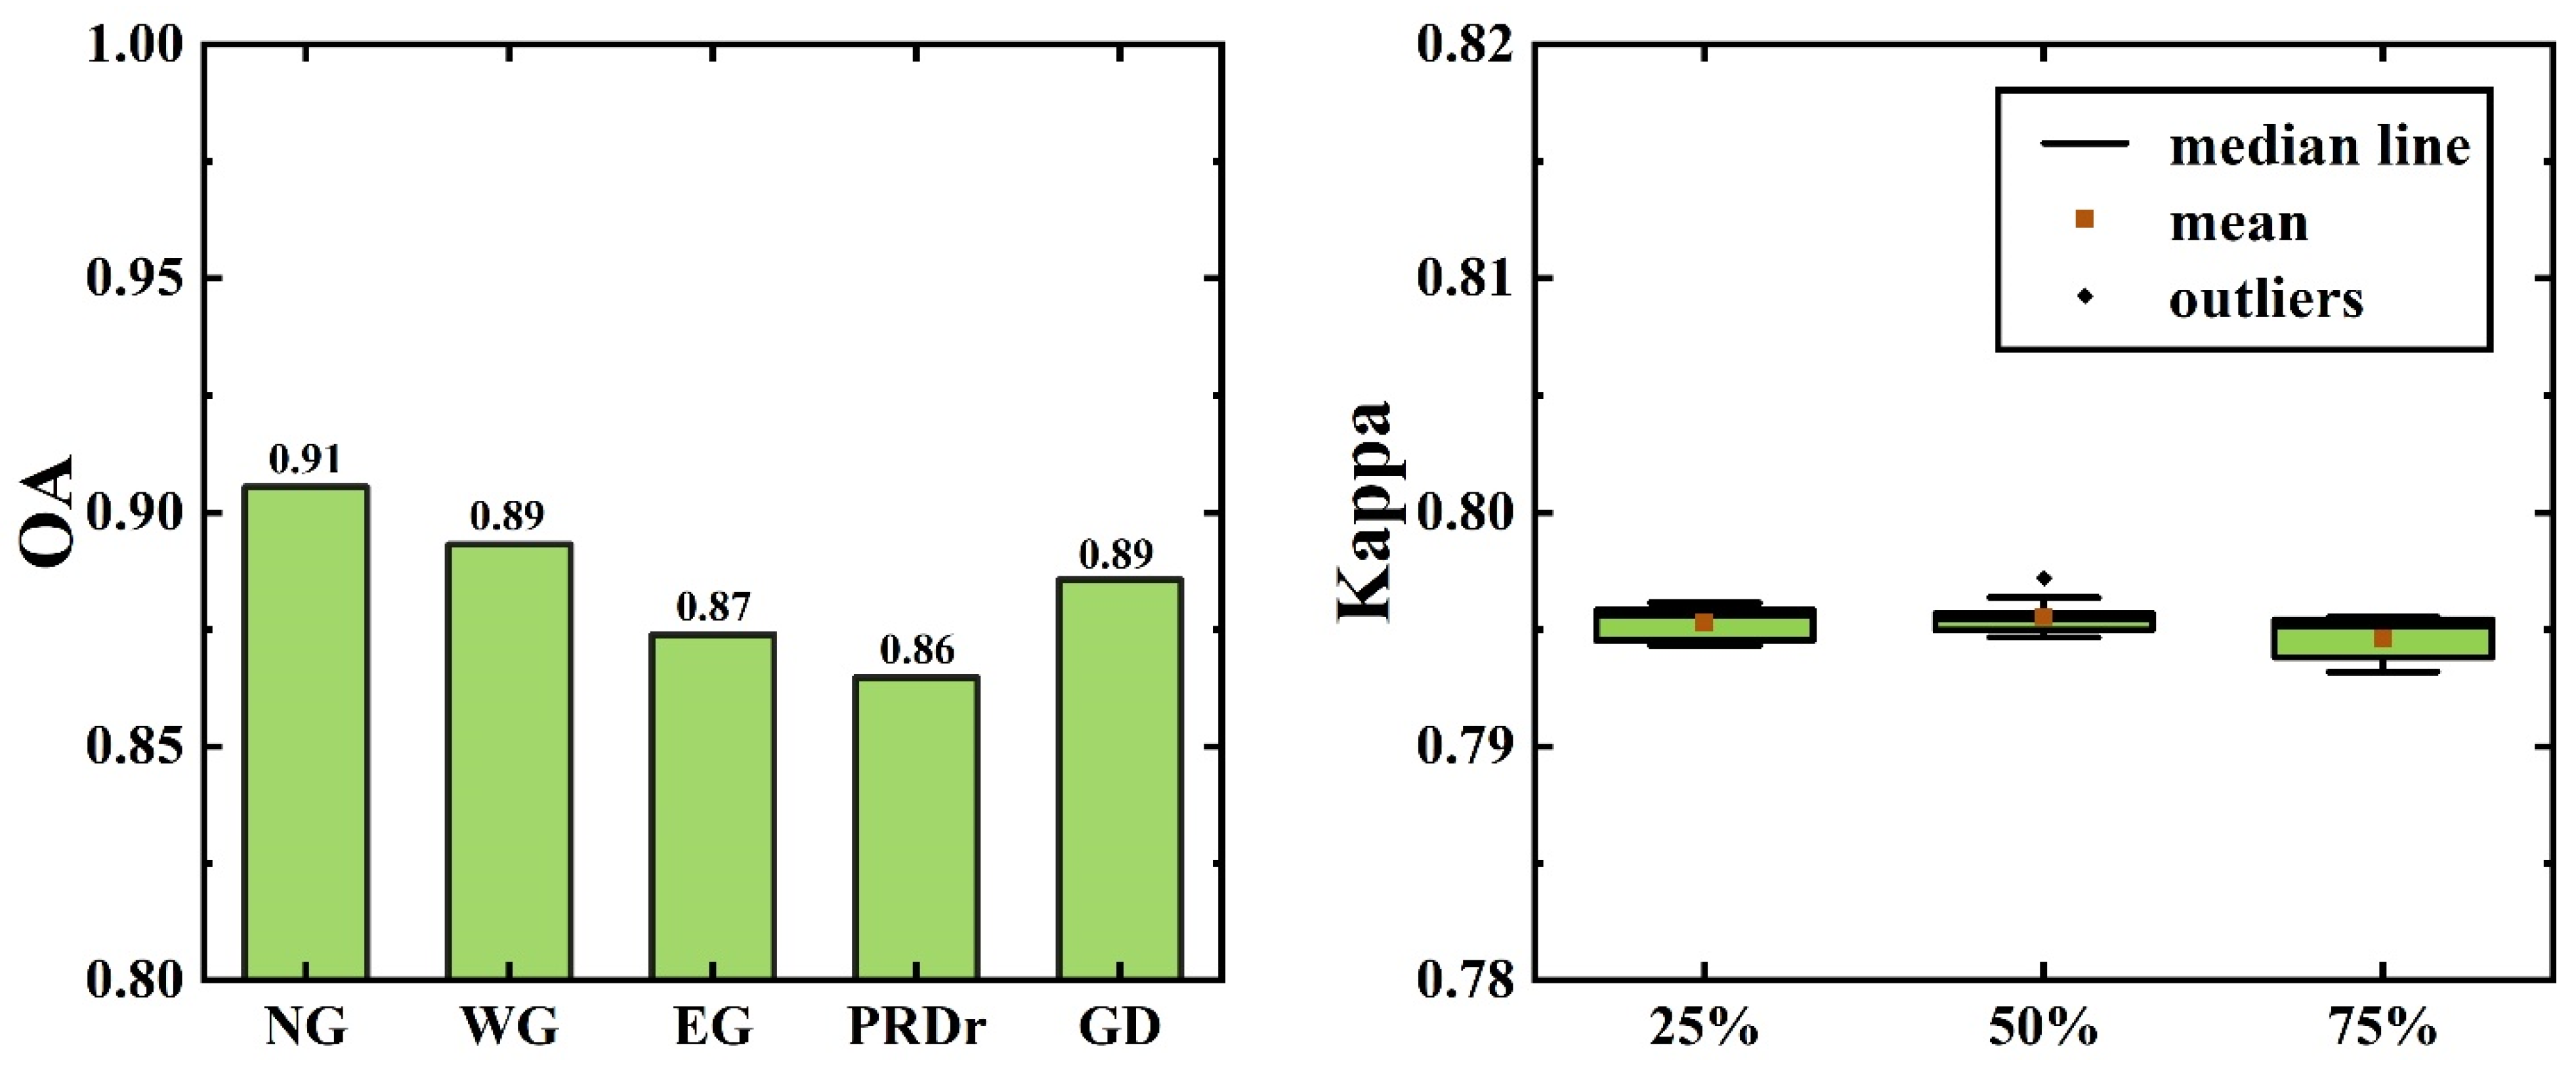
3.3. Validation Results

The spatial distribution of farmland abandonment in Guangdong Province in 2014 simulated by the CLUMondo model was validated by the farmland abandonment map produced from MODIS time series data (Figure 3). The AUCs of AFA, SFA, and CCF in the CLUMondo model were 0.72, 0.69, and 0.80, respectively.
The OAs for NG, WG, EG, and PRDr were 0.90, 0.89, 0.87, and 0.86, respectively (Figure 4). The OA in Guangdong Province was 0.89, and the kappa for Guangdong Province was 0.79. The study selected samples in Guangdong Province with the proportion of 25%, 50%, and 75%. For sample selecting for each proportion, random sampling method was repeated ten times. The mean kappa values of ten times were 0.795, 0.796, and 0.795, with all the range around 0.001, for the proportions 25%, 50%, and 75%, respectively.

3.4. The Impact of Land Use Policies on Farmland Abandonment Management

The validated model was used to simulate the spatial distribution of farmland abandonment in Guangdong Province in 2019 (Figure 5). The results reflect that the area of AFA decreased, and the area of SFA and CCF increased after the new arable land protection policy was issued. The variance for each farmland abandonment type was 13.61%, 17.07%, and 15.76%, respectively. The area of AFA declined greatly with 81.86% in NG and increased with 86.69% in WG. The area of SFA increased by 62.53% and decreased by 3.50% in WG. The area of CCF increased in PRDr by 28.04% and decreased slightly by 5.51% in NG.
After the new arable land protection policy was issued, the fragmentation of abandoned farmland generally increased. The results show that, since the occupation policy was implemented, the landscape of AFA has been fragmenting, but the landscape of SFA and CCF has been compacting. The NP, AI, and MPS for AFA changed by 19.58%, −27.75%, and −9.30%, respectively; those for SFA changed by 3.99%, 11.33%, and 7.53%, respectively; and those for CCF changed by −1.65%, 19.04%, and 7.05%, respectively. The landscape of AFA east of Guangdong greatly increased AFA fragmentation, while eastern Guangdong and the Pearl River Delta experienced reduced SFA and CCF fragmentation. The fragmentation of AFA in EG increased visibly, and the fragmentation of SFA and CCF in EG and PRDr decreased slightly.

3.5. The Impact of Arable Land Policies on Prefectures with Different Urbanization Levels

The impacts of arable land policies and the different urbanization levels at the prefecture level are presented in Figure 6. The results revealed that the new policy effectively restrained the area increase for AFA but failed to adequately restrain the fragmentation increase for AFA in the regions with lower RPOP and lower GDP, such as NG. In the regions with the highest RPOP and lower GDP, such as WG, the new policy reduced the fragmentation of AFA but failed to restrain the area increase in AFA. The management effect of the new arable land policy was not that significant for AFA in the regions with higher RPOP and higher GDP, such as PRDr.
The impact of arable land policies on the area and landscape fragmentation of SFA differs from that on the area and landscape fragmentation of AFA. In the regions with lower RPOP and lower GDP, such as NG and EG, the new policy effectively restrained the fragmentation increase for SFA but failed to adequately restrain its area increase. In the regions with the highest RPOP and lower GDP, such as WG, the new policy reduced the area increase for SFA but failed to restrain the area increase of SFA. The management effect of the new arable land policy was also not that significant for SFA in the regions with higher RPOP and higher GDP, such as PRDr.

4. Discussion

4.1. The Contributions and Limitations

Relying on the ability of the geographic simulation model to simulate land use change, the study proposed a method to quantify the effectiveness of land policy. Compared with the previous statistical analysis method [36,63,64], the results from this method have more delicate spatial characteristics, which can help to provide multiple scale analysis for policy effectiveness assessment in the future. The landscape perspective and the quantitative results for Guangdong Province can also provide a reference for land policy making in similar urban agglomeration areas.
Some limitations need to be improved in future research. The farmland abandonment dataset used in this study was derived from an approach described in Li et al., 2022. This dataset provided the different types of farmland abandonment, which can help explain the farmland status in detail. This dataset brought in uncertainty of the simulated farmland abandonment maps because of its 500 m spatial resolution. A higher resolution distribution or virogram of farmland locally should be considered to remove the error from mixed pixels [45,65]. In addition, seven factors related to economic, demographic, and agricultural production were selected as the main factors in this study because of the input limitation in the CLUMondo model. Although topography, population, and transportation accessibility have been proved to be essential factors in causing farmland abandonment [36,63,66], natural climate factors such as annual average precipitation and annual temperature could be considered in future research to comprehensively illustrate the driving mechanism of farmland abandonment. Additionally, the accuracy of the geographic simulation model is of great importance to land policy assessment. In this study, the effectiveness of land policies in PRDr is weaker than other regions, while the simulation accuracy in PRDr is lower than other regions. It is necessary to improve the ability and accuracy for simulating farmland abandonment in fragmented plots. Finally, more landscape indices deserve further discussion to quantitatively assess different management objectives of different land policies.

4.2. The Effectiveness of Arable Land Policy under Rapid Urbanization

Although urbanization is an inevitable trend in global development, strict land protection policies proved to have a positive impact on preventing farmland abandonment in this study. Keenleyside and Tucker concluded that the reason for farmland abandonment in European countries is urbanization and industrialization [67]. The rapid development of the second and tertiary industries has provided considerable employment opportunities. Many researches agreed that developed countries are the main areas where farmland abandonment has occurred. Li and Li pointed out that farmland abandonment in China was also influenced comparatively by the land policy, as well as urbanization [2]. During 2010–2014, Guangdong Province was in a stage of rapid urbanization, while the planning of cultivated land protection policies was in the developmental stage. This situation led to farmland abandonment in the process of expansion, even though the Land Reclamation Regulations were issued. Urbanization was the dominant factor leading to the fragmented landscape pattern of abandoned farmland during that period.
Since 2014, the strategy of China’s urbanization development has been to pay attention to the sustainability of the ecological environment while focusing on urban economic development. Currently, the focus of the arable land protection policy formulation is to improve the land policy by comprehensively evaluating the early land policy and its implementation effect and giving more attention to improving the quality of arable land and the ecological landscape, which has a strong influence and binding force on the protection of arable land. For example, during the implementation of the cultivated land occupation–compensation balance policy, comparing the productivity of the occupied arable land with the compensated arable land is required. In this way, arable land protection during urbanization not only considers the area of arable land but also considers the quality and ecological effect of arable land. The positive effect of a strong farmland protection policy is an important reason for slowing down the fragmentation trend of abandoned farmland.

4.3. The Influence of Agricultural Labour Forces on Farmland Abandonment

The quantity and landscape changes in farmland abandonment in Guangdong Province from 2010 to 2019 were also closely related to the proportion of available jobs. With the increase in total available jobs, agricultural labourers transferred to industry and service jobs [68]. These opportunities provide convincing reasons for farmers to abandon their farms, which directly results in abandoned farmland [10]. During 2010–2014, the proportion of the labour opportunities in Guangdong Province increased (Figure 7). This intensified economic urbanization and became a possible reason for the increase in farmland abandonment during that period. During 2015–2019, the proportion of the total labour in Guangdong Province declined, and economic urbanization slowed down. These factors may have led to a decline in farmland abandonment.
Furthermore, this study reflects that even strict land policies cannot restrain the increase in abandoned farmland area in regions with higher populations and lower GDP, although they can restrain the fragmentation of AFA. Strict land policies can better restrain the expansion of AFA by increasing cropping cycles at least one time in regions with lower RPOP and lower GDP, that is, AFA changed to SFA. Thus, the fundamental part of arable land policy formulation is considering the farmers’ benefits from farming and the economic development needs of individual farmers.
Some recent studies have shifted from the regional geographic condition and its economic mechanism to farmers’ behavioural mechanism [37,47,69,70]. He et al. proposed a series of policy measures to alleviate farmland abandonment, based on the researched behavioural mechanism leading to farmland abandonment by different types of farming households [37]. The simulation model of farmland abandonment distribution combined with farmers’ behaviour choices is worthy of further exploration.

5. Conclusions

Quantitative evaluation of the implementation effect of land policy is essential to policy making. To quantify the management effectiveness of new arable land policies, this study proposed a method to quantify the impacts of the arable land protection policy and evaluate the quantitative impacts on farmland abandonment in Guangdong Province after 2014 from the perspective of landscape ecology.
The results indicated that the new arable land policy after 2014 was effective for farmland abandonment management. Although the total farmland abandonment increased during 2010–2019, the increase after 2014 was lower than that before 2014. The landscape of farmland abandonment in Guangdong Province became more fragmented before 2014 and improved after 2014. More annual farmland abandonment (AFA) shifted to seasonal farmland abandonment (SFA) after the new arable land policy was issued. The new policies succeeded in restraining the area increasing for AFA in the regions with lower RPOP and lower GDP and reducing the fragmentation of AFA in the regions with highest RPOP and lower GDP. Additionally, the new policies restrained the fragmentation increase for SFA in the regions with lower RPOP and lower GDP and reduced the area increase for SFA in the regions with the highest RPOP and lower GDP. The management effect was not that significant in the regions with higher RPOP and higher GDP.
Our study provides a solution to quantify land policy management and conducts an in-depth analysis of changes in the types and landscape patterns of farmland abandonment in southern China. These findings will provide important data references for arable land decision making in areas with multiple cropping habits and a similar process of urbanization.

Author Contributions

Conceptualization, L.L. and S.Z.; methodology, L.L., S.Z. and K.Z.; software, S.Z.; validation, K.S., X.Y. and Y.Z.; resources, K.S., X.Y. and Y.Z.; writing—original draft preparation, L.L. and S.Z.; writing—review and editing, L.L. and K.Z. All authors have read and agreed to the published version of the manuscript.

Funding

This research is supported by National Natural Science Foundation of China (grant no. 41901345, no. 41901312, and no. 42101417), Major project of high-resolution earth observation system (civil part) (grant No. 20-Y30F10-9001-20/22), and the Project of the Science and Technology Foundation of Guangdong Province (grant No. 2021B1111610001, 2021B1212100003).

Data Availability Statement

Not applicable.

Conflicts of Interest

The authors declare no conflict of interest.

References

  1. Gellrich, M.; Zimmermann, N.E. Investigating the regional-scale pattern of agricultural land abandonment in the Swiss mountains: A spatial statistical modelling approach. Landsc Urban Plan. 2007, 79, 65–76. [Google Scholar] [CrossRef]
  2. Li, S.; Li, X. Global understanding of farmland abandonment: A review and prospects. J. Geogr. Sci. 2017, 27, 1123–1150. [Google Scholar] [CrossRef]
  3. Terres, J.-M.; Scacchiafichi, L.N.; Wania, A.; Ambar, M.; Anguiano, E.; Buckwell, A.; Coppola, A.; Gocht, A.; Källström, H.N.; Pointereau, P.; et al. Farmland abandonment in Europe: Identification of drivers and indicators, and development of a composite indicator of risk. Land Use Policy 2015, 49, 20–34. [Google Scholar] [CrossRef]
  4. Wu, Y.; Shan, L.; Guo, Z.; Peng, Y. Cultivated land protection policies in China facing 2030: Dynamic balance system versus basic farmland zoning. Habitat Int. 2017, 69, 126–138. [Google Scholar] [CrossRef]
  5. Chen, W.; Cheshmehzangi, A.; Mangi, E.; Heath, T. Implementations of China’s New-Type Urbanisation: A Comparative Analysis between Targets and Practices of Key Elements’ Policies. Sustainability 2022, 14, 6341. [Google Scholar] [CrossRef]
  6. Levers, C.; Schneider, M.; Prishchepov, A.V.; Estel, S.; Kuemmerle, T. Spatial variation in determinants of agricultural land abandonment in Europe. Sci Total Environ 2018, 644, 95–111. [Google Scholar] [CrossRef] [PubMed]
  7. Estel, S.; Kuemmerle, T.; Alcántara, C.; Levers, C.; Prishchepov, A.; Hostert, P. Mapping farmland abandonment and recultivation across Europe using MODIS NDVI time series. Remote Sens. Environ. 2015, 163, 312–325. [Google Scholar] [CrossRef]
  8. Deng, X.; Huang, J.; Rozelle, S.; Zhang, J.; Li, Z. Impact of urbanization on cultivated land changes in China. Land Use Policy 2015, 45, 1–7. [Google Scholar] [CrossRef]
  9. Jiang, L.; Deng, X.; Seto, K.C. The impact of urban expansion on agricultural land use intensity in China. Land Use Policy 2013, 35, 33–39. [Google Scholar] [CrossRef]
  10. Xu, D.; Deng, X.; Guo, S.; Liu, S. Labor migration and farmland abandonment in rural China: Empirical results and policy implications. J. Environ. Manage. 2019, 232, 738–750. [Google Scholar] [CrossRef]
  11. Chen, L.; Meadows, M.E.; Liu, Y.; Lin, Y. Examining pathways linking rural labour outflows to the abandonment of arable land in China. Popul. Space Place 2022, 28, e2591. [Google Scholar] [CrossRef]
  12. Deng, X.; Xu, D.; Qi, Y.; Zeng, M. Labor Off-Farm Employment and Cropland Abandonment in Rural China: Spatial Distribution and Empirical Analysis. Int. J. Environ. Res. Public Health 2018, 15, 1808. [Google Scholar] [CrossRef] [PubMed] [Green Version]
  13. Wei, Z.; Gu, X.; Sun, Q.; Hu, X.; Gao, Y. Analysis of the spatial and temporal pattern of changes in abandoned farmland based on long time series of remote sensing data. Remote Sens. 2021, 13, 2549. [Google Scholar] [CrossRef]
  14. Zhang, X.; Liu, K.; Wang, S.; Long, X.; Li, X. A Rapid Model (COV_PSDI) for Winter Wheat Mapping in Fallow Rotation Area Using MODIS NDVI Time-Series Satellite Observations: The Case of the Heilonggang Region. Remote Sens. 2021, 13, 4870. [Google Scholar] [CrossRef]
  15. Liu, Y.; Wang, J. Revealing Annual Crop Type Distribution and Spatiotemporal Changes in Northeast China Based on Google Earth Engine. Remote Sens. 2022, 14, 4056. [Google Scholar] [CrossRef]
  16. Li, G.; Cao, Y.; He, Z.; He, J.; Cao, Y.; Wang, J.; Fang, X. Understanding the Diversity of Urban–Rural Fringe Development in a Fast Urbanizing Region of China. Remote Sens. 2021, 13, 2373. [Google Scholar] [CrossRef]
  17. Eggen, M.; Ozdogan, M.; Zaitchik, B.F.; Simane, B. Land cover classification in complex and fragmented agricultural landscapes of the Ethiopian highlands. Remote Sens. 2016, 8, 1020. [Google Scholar] [CrossRef] [Green Version]
  18. Knauer, K.; Gessner, U.; Fensholt, R.; Forkuor, G.; Kuenzer, C. Monitoring agricultural expansion in Burkina Faso over 14 years with 30 m resolution time series: The role of population growth and implications for the environment. Remote Sens. 2017, 9, 132. [Google Scholar] [CrossRef] [Green Version]
  19. Mottet, A.; Ladet, S.; Coqué, N.; Gibon, A. Agricultural land-use change and its drivers in mountain landscapes: A case study in the Pyrenees. Agric. Ecosyst. Environ. 2006, 114, 296–310. [Google Scholar] [CrossRef]
  20. Atalová, B.; Pulerová, J.; Tefunková, D.; Dobrovodská, M.; Vlachoviová, M.; Kozelová, I. Monitoring and evaluating the contribution of the rural development program to high nature value farmland dominated by traditional mosaic landscape in Slovakia. Ecol. Indic. 2021, 126, 107661. [Google Scholar] [CrossRef]
  21. Li, M.; Xie, Y.; Li, Y. Transition of rural landscape patterns in Southwest China’s mountainous area: A case study based on the Three Gorges Reservoir Area. Environ. Earth Sci. 2021, 80, 742. [Google Scholar] [CrossRef]
  22. Liu, X.; Zhao, C.; Wei, S. Review of the evolution of cultivated land protection policies in the period following China’s reform and liberalization. Land Use Policy 2017, 67, 660–669. [Google Scholar] [CrossRef]
  23. Zhou, X.X.; Zhu, Z.H.; Feng, C. The evolution of land policies in China from 1980 to 2019: A policy-text based analysis. Environ. Sci. Pollut. Res. 2022, 29, 54902–54915. [Google Scholar] [CrossRef]
  24. Cheng, Q.; Jiang, P.; Cai, L.; Shan, J.; Zhang, Y.; Wang, L.; Li, M.; Li, F.; Zhu, A.; Chen, D. Delineation of a permanent basic farmland protection area around a city centre: Case study of Changzhou city, China. Land Use Policy 2017, 60, 73–89. [Google Scholar]
  25. Kuang, B.; Han, J.; Lu, X.; Zhang, X.; Fan, X. Quantitative evaluation of China’s cultivated land protection policies based on the PMC-Index model. Land Use Policy 2020, 99, 105062. [Google Scholar] [CrossRef]
  26. Shi, K.; Yang, Q.; Li, Y.; Sun, X. Mapping and evaluating cultivated land fallow in Southwest China using multisource data. Sci. Total Environ. 2019, 654, 987–999. [Google Scholar] [CrossRef]
  27. Wang, C.; Siriwardana, M.; Meng, S. Effects of the Chinese arable land fallow system and land-use change on agricultural production and on the economy. Econ. Model. 2019, 79, 186–197. [Google Scholar] [CrossRef]
  28. Yin, R.; Liu, C.; Zhao, M.; Yao, S.; Liu, H. The implementation and impacts of China’s largest payment for ecosystem services program as revealed by longitudinal household data. Land Use Policy 2014, 40, 45–55. [Google Scholar] [CrossRef]
  29. Zhu, Z.; Liu, L.; Chen, Z.; Zhang, J.; Verburg, P.H. Land-use change simulation and assessment of driving factors in the loess hilly region—A case study as Pengyang County. Environ. Monit. Assess. 2010, 164, 133–142. [Google Scholar] [CrossRef]
  30. Hussain, S.; Mubeen, M.; Ahmad, A.; Majeed, H.; Qaisrani, S.A.; Hammad, H.M.; Amjad, M.; Ahmad, I.; Fahad, S.; Ahmad, N. Assessment of land use/land cover changes and its effect on land surface temperature using remote sensing techniques in Southern Punjab, Pakistan. Environ. Sci. Pollut. Res. 2022. [Google Scholar] [CrossRef]
  31. Gong, J.; Chen, W.; Liu, Y.; Wang, J. The intensity change of urban development land: Implications for the city master plan of Guangzhou, China. Land Use Policy 2014, 40, 91–100. [Google Scholar] [CrossRef]
  32. Tan, S.; Zhang, L.; Qi, R. Research on regional pressure index of cultivated land based on system dynamics—A case study of Hubei province. J. Nat. Resour. 2012, 5, 757–764. [Google Scholar]
  33. Zhao, J.; Yuan, L.; Zhang, M. A study of the system dynamics coupling model of the driving factors for multi-scale land use change. Environ. Earth Sci. 2016, 75, 1–13. [Google Scholar] [CrossRef]
  34. Du, X.; Zhao, X.; Liang, S.; Zhao, J.; Wu, D. Quantitatively Assessing and Attributing Land Use and Land Cover Changes on China’s Loess Plateau. Remote Sens. 2020, 12, 353. [Google Scholar] [CrossRef] [Green Version]
  35. Hengsdijk, H.; Ittersum, M.K.v.; Rossing, W.A.H. Quantitative analysis of farming systems for policy formulation: Development of new tools. Agric. Syst. 1998, 58, 381–394. [Google Scholar] [CrossRef]
  36. Liang, X.; Li, Y.; Zhou, Y. Study on the abandonment of sloping farmland in Fengjie County, Three Gorges Reservoir Area, a mountainous area in China. Land Use Policy 2020, 97, 104760. [Google Scholar] [CrossRef]
  37. He, Y.; Xie, H.; Peng, C. Analyzing the behavioural mechanism of farmland abandonment in the hilly mountainous areas in China from the perspective of farming household diversity. Land Use Policy 2020, 99, 104826. [Google Scholar] [CrossRef]
  38. Benenson, I.; Torrens, P.M. Modeling Urban Land-Use with Cellular Automata; Geosimulation: Brooklyn, NY, USA, 2006. [Google Scholar]
  39. He, C.; Okada, N.; Zhang, Q.; Shi, P.; Zhang, J. Modeling urban expansion scenarios by coupling cellular automata model and system dynamic model in Beijing, China. Appl. Geogr. 2006, 26, 323–345. [Google Scholar] [CrossRef]
  40. Jiao, J. Simulation of Dynamic Urban Expansion under Ecological Constraints Using a Long Short Term Memory Network Model and Cellular Automata. Remote Sens. 2021, 13, 1499. [Google Scholar]
  41. Gidey, E.; Dikinya, O.; Sebego, R.; Segosebe, E.; Zenebe, A. Cellular automata and Markov Chain (CA_Markov) model-based predictions of future land use and land cover scenarios (2015–2033) in Raya, northern Ethiopia. Model. Earth Syst. Environ. 2017, 3, 1245–1262. [Google Scholar] [CrossRef]
  42. Gounaridis, D.; Chorianopoulos, I.; Symeonakis, E.; Koukoulas, S. A Random Forest-Cellular Automata modelling approach to explore future land use/cover change in Attica (Greece), under different socio-economic realities and scales. Sci. Total Environ. 2019, 646, 320–335. [Google Scholar] [CrossRef] [PubMed]
  43. Liu, X.; Liang, X.; Li, X.; Xu, X.; Ou, J.; Chen, Y.; Li, S.; Wang, S.; Pei, F. A future land use simulation model (FLUS) for simulating multiple land use scenarios by coupling human and natural effects. Landsc. Urban Plan. 2017, 168, 94–116. [Google Scholar] [CrossRef]
  44. Verburg, P.H.; Overmars, K.P. Combining top-down and bottom-up dynamics in land use modeling: Exploring the future of abandoned farmlands in Europe with the Dyna-CLUE model. Landsc. Ecol. 2009, 24, 1167. [Google Scholar] [CrossRef]
  45. Zhu, X.; Xiao, G.; Zhang, D.; Guo, L. Mapping abandoned farmland in China using time series MODIS NDVI. Sci. Total Environ. 2021, 755, 142651. [Google Scholar] [CrossRef]
  46. Li, L.; Pan, Y.; Zheng, R.; Liu, X. Understanding the spatiotemporal patterns of seasonal, annual, and consecutive farmland abandonment in China with time-series MODIS images during the period 2005–2019. Land Degrad. Dev. 2022, 33, 1608–1625. [Google Scholar] [CrossRef]
  47. Ustaoglu, E.; Collier, M.J. Farmland abandonment in europe: An overview of drivers, consequences and assessment of the sustainability implications. Environ. Rev. 2018, 26, 396–416. [Google Scholar] [CrossRef]
  48. Zhou, Y. System Driven Analysis of National Economic Growth: Guangdong as an Example. Am. J. Ind. Bus. Manag. 2017, 07, 27–30. [Google Scholar] [CrossRef] [Green Version]
  49. Asselen, S.V.; Verburg, P.H. Land cover change or land-use intensification: Simulating land system change with a global-scale land change model. Glob. Change Biol. 2014, 19, 3648–3667. [Google Scholar] [CrossRef]
  50. Ornetsmüller, C.; Verburg, P.H.; Heinimann, A. Scenarios of land system change in the Lao PDR: Transitions in response to alternative demands on goods and services provided by the land. Appl. Geogr. 2016, 75, 1–11. [Google Scholar] [CrossRef] [Green Version]
  51. Sarah, W.; Schrammeijer, E.A.; Schulp, C.; Verburg, P.H. Meeting global land restoration and protection targets: What would the world look like in 2050? Glob. Environ. Change 2018, 52, 259–272. [Google Scholar]
  52. Pontius Jr, R.G.; Schneider, L.C. Land-cover change model validation by an ROC method for the Ipswich watershed, Massachusetts, USA. Agric. Ecosyst. Environ. 2001, 85, 239–248. [Google Scholar] [CrossRef]
  53. McHugh, M.L. Interrater reliability: The kappa statistic. Biochem. Med. 2012, 22, 276–282. [Google Scholar] [CrossRef]
  54. Fu, B.; Liang, D.; Lu, N. Landscape ecology: Coupling of pattern, process, and scale. Chin. Geogr. Sci. 2011, 21, 385–391. [Google Scholar] [CrossRef]
  55. Šímová, P.; Gdulová, K. Landscape indices behavior: A review of scale effects. Appl. Geogr. 2012, 34, 385–394. [Google Scholar] [CrossRef]
  56. Kuchma, T.; Tarariko, O.; Syrotenko, O. Landscape Diversity Indexes Application for Agricultural Land Use Optimization. Procedia Technol. 2013, 8, 566–569. [Google Scholar] [CrossRef] [Green Version]
  57. Jiang, P.; Li, M.; Lv, J. The causes of farmland landscape structural changes in different geographical environments. Sci. Total Environ. 2019, 685, 667–680. [Google Scholar] [CrossRef]
  58. Liang, X.; Li, Y.; Ran, C.; Li, M.; Zhang, H. Study on the transformed farmland landscape in rural areas of southwest China: A case study of Chongqing. J. Rural. Stud. 2020, 76, 272–285. [Google Scholar] [CrossRef]
  59. Fu, B.-J.; Hu, C.-X.; Chen, L.-D.; Honnay, O.; Gulinck, H. Evaluating change in agricultural landscape pattern between 1980 and 2000 in the Loess hilly region of Ansai County, China. Agric. Eco. Environ. 2006, 114, 387–396. [Google Scholar] [CrossRef]
  60. Mann, H.B. Non-parametric tests against trend. Econometrica 1945, 13, 245–259. [Google Scholar] [CrossRef]
  61. Litchfield Jr, J.T.; Wilcoxon, F. Rank correlation method. Anal. Chem. 1955, 27, 299–300. [Google Scholar] [CrossRef]
  62. Hamed, K.H. Trend detection in hydrologic data: The Mann–Kendall trend test under the scaling hypothesis. J. Hydrol. 2008, 349, 350–363. [Google Scholar] [CrossRef]
  63. Baumann, M.; Kuemmerle, T.; Elbakidze, M.; Ozdogan, M.; Radeloff, V.C.; Keuler, N.S.; Prishchepov, A.V.; Kruhlov, I.; Hostert, P. Patterns and drivers of post-socialist farmland abandonment in Western Ukraine. Land Use Policy 2011, 28, 552–562. [Google Scholar] [CrossRef]
  64. Shi, T.; Li, X.; Xin, L.; Xu, X. The spatial distribution of farmland abandonment and its influential factors at the township level: A case study in the mountainous area of China. Land Use Policy 2018, 70, 510–520. [Google Scholar] [CrossRef]
  65. Yin, H.; Prishchepov, A.V.; Kuemmerle, T.; Bleyhl, B.; Buchner, J.; Radeloff, V.C. Mapping agricultural land abandonment from spatial and temporal segmentation of Landsat time series. Remote Sens. Environ. 2018, 210, 12–24. [Google Scholar] [CrossRef]
  66. lei, Y.Z.; Lei, L.; Hua, Z.; Jinshe, L. Exploring the Factors Driving Seasonal Farmland Abandonment: A Case Study at the Regional Level in Hunan Province, Central China. Sustainability 2017, 9, 187. [Google Scholar]
  67. Keenleyside, C.; Tucker, G. Farmland Abandonment in the EU: An Assessment of Trends and Prospects; Institute for European Environmental Policy: London, UK, 2010. [Google Scholar]
  68. Colin, C. The Conditions of Economic Progress, 2nd ed.; Macmillan: London, UK, 1951. [Google Scholar]
  69. Yang, L. An Empirical Study of Farmers’ Perception and Behavior on Farmland Abandonment in Yunnan Province. Asian Agric. Res. 2017, 3, 63–65. [Google Scholar]
  70. Ruskule, A.; Nikodemus, O.; Kasparinskis, R.; Bell, S.; Urtane, I. The perception of abandoned farmland by local people and experts: Landscape value and perspectives on future land use. Landsc Urban Plan 2013, 115, 49–61. [Google Scholar] [CrossRef]
Figure 1. Five districts in Guangdong Province with a backdrop of the land cover and land use map in 2015 were derived from the Resource and Environment Science and Data Center (https://www.resdc.cn/, accessed on 30 June 2022).
Remotesensing 14 04991 g001
Figure 2. Trends of the landscape indices in Guangdong Province during 2010–2019, NP (a), MPS (b), and AI (c).
Remotesensing 14 04991 g002
Figure 3. Farmland abandonment map (a) and the simulated distribution of farmland abandonment with CLUMondo (b) in Guangdong Province in 2014.
Remotesensing 14 04991 g003
Figure 4. The OA and Kappa for model validation.
Remotesensing 14 04991 g004
Figure 5. Farmland abandonment map (a) and the simulated distribution of farmland abandonment with CLUMondo (b) in Guangdong Province in 2019.
Remotesensing 14 04991 g005
Figure 6. The interaction of arable land policies and farmland abandonment in prefectures with different urbanization levels: (a) AFA and (b) SFA.
Remotesensing 14 04991 g006
Figure 7. Changes in the proportion of the major labour in Guangdong Province from 2010 to 2019.
Remotesensing 14 04991 g007
Table 1. Conversion matrix for land cover types during 2010–2014.
Land Use TypesAFASFACCFOther Land
AFA1111
SFA1111
CCF1111
Other land1111
1 indicates that this type can be converted to another type, and 0 indicates that this type cannot be converted to another type. The horizontal axis represents data from 2010, and the vertical axis represents data from 2014.
Table 2. Formulas for landscape indices of farmland abandonment.
IndicatorsFormulasDefinition of Variables
Number of patches
(NP)
N P = N N   refers to the number of abandoned farmland patches.
Mean patch size
(MPS)
M P S = A N A refers to the area of abandoned farmland patches; N refers to the number of abandoned farmland patches.
Aggregation index
(AI)
A I = 100 × [ i = 1 N ( g i i m a x g i i ) p i ] g i refers to the number of like adjacencies between pixels of farmland abandonment patch type i based on single-count method; m a x g i i refers to the maximum number of like adjacencies between pixels of farmland abandonment patch type I based on the single-count method; p i refers to the proportion of landscape comprised of farmland abandonment of patch type i.
Table 3. Changing rates of landscape indices in different regions during 2010–2014 and 2015–2019.
Landscape IndicatorRegion2010–20142015–2019
Regression Function *R2Significance T/FRegression Function *R2Significance T/F
NPNGy = 27.90x − 53,565.800.01Fy = 55.10x + 113,291.200.18F
EGy = 91.00x − 182,664.400.87Ty = −16.20x + 32,963.000.35F
WGy = 11.30x − 21,655.000.01Fy = −12.40x + 26,169.000.01F
PRDry = 34.80x − 67,884.400.07Fy = 126.90x − 253,179.800.77F
GDy = 376.60x − 751,679.000.92Ty = 138.40x − 272,707.800.52F
MPSNGy = −2.92x + 5944.300.09Fy = 5.68x − 11,346.450.81F
EGy = −51.50x + 103,786.170.93Fy = 0.27x − 364.550.03F
WGy = −2.57x + 5286.600.02Fy = −5.74x + 11,666.060.23F
PRDry = −0.62x + 1287.890.01Fy = −1.191x + 2468.780.16F
GDy = −5.67x + 11,488.110.77Fy = −1.23x + 2562.520.19F
AINGy = −1.05x + 2185.100.31Fy = 0.97x − 1866.860.81F
EGy = −1.90x + 3895.570.69Fy = 0.14x − 194.020.03F
WGy = −0.26x + 602.980.01Fy = −1.52x + 3144.950.23F
PRDry = −4.03x + 8167.790.95Ty = −1.21x + 2468.680.16F
GDy = −0.84x + 1766.730.90Fy = 3.17x − 6285.890.19F
* The regression function here is linear least squares regression.
Table 4. The land use transfer matrix of different farmland abandonment types during 2010–2014 and 2015–2019.
TypeAFA (kha)SFA (kha)CCF (kha)Other Land (kha)Total (kha)
2010–2014AFA1394.17796.036.611227.753424.57
SFA496.58245.082.60390.561134.82
CCF12.662.5363.4153.23131.84
Other land1128.84384.4437.1910,078.2011,628.67
Total3032.251428.08109.8211,749.7416,319.89
2015–2019AFA712.25740.084.24947.502404.07
SFA400.03375.201.92438.371215.53
CCF12.995.3542.0044.95105.29
Other land703.59491.9832.6711,366.7512,595.00
Total1828.871612.6180.8312,797.5816,319.89
Publisher’s Note: MDPI stays neutral with regard to jurisdictional claims in published maps and institutional affiliations.

