Article

Phenological Changes and Driving Forces of Lake Ice in Central Asia from 2002 to 2020

1
State Key Laboratory of Desert and Oasis Ecology, Xinjiang Institute of Ecology and Geography, Chinese Academy of Sciences, Urumqi 830011, China
2
University of Chinese Academy of Sciences, Beijing 100049, China
3
Fukang Station of Desert Ecology, Chinese Academy of Sciences, Fukang 831505, China
*
Author to whom correspondence should be addressed.
Remote Sens. 2022, 14(19), 4992; https://doi.org/10.3390/rs14194992
Submission received: 18 August 2022 / Revised: 16 September 2022 / Accepted: 30 September 2022 / Published: 7 October 2022

Abstract

:
Lake ice phenology is an indicator of past and present climate, it is sensitive to regional and global climate change. In the past few decades, the climate of Central Asia has changed significantly due to global warming and anthropogenic activities. However, there are few studies on the lake ice phenology in Central Asia. In this study, the lake ice phenology of 53 lakes in Central Asia were extracted using MODIS daily LST products from 2002 to 2020. The results show that MODIS-extracted lake ice phenology is generally consistent with Landsat-extracted and AVHRR-extracted lake ice phenology. Generally, lakes in Central Asia start to freeze from October to December. The trends in the lake ice phenology show strong regional differences. Lakes distributed along the Kunlun Mountains show overall delayed trends in all lake ice phenology variables, while lakes located in southwestern Central Asia show clear advancing trends in the freeze-up start dates (7.06 days) and breakup end dates (6.81 days). Correlations between the phenology of lake ice and local and climatic factors suggest that the ice breakup process and the duration of its complete coverage depend more on heat, while precipitation mainly affects the freezing time of the ice. Wind speed mainly affects the time of completely frozen of ice. In general, the breakup process is more susceptible to climatic factors, while local factors have strong influences on the freeze-up process.

1. Introduction

Global climate change is profoundly affecting human survival and development and is one of the major challenges faced by the international community today [1]. Historical records show that the warming trend began in the 1950s and changed abruptly in the mid to late 1980s [2]. In recent years, the global warming trend has become more pronounced. From 2011 to 2020, the average temperature has increased by 1.09 C over the pre-industrial period (1850–1900), while the 2001–2010 period was 0.99 C warmer than the pre-industrial period [3]. This abnormal warming trend has increased evaporation from the land surface and accelerated the melting of glaciers. The increased evaporation from the land surface has reduced the areas of lakes at lower elevations and plains, while the melting of glaciers has led to the formation of new lakes at higher elevations [4]. In the past decades, a widespread water loss occurred in the global endorheic system [5] and the total lake area in Central Asia has shown a decreasing trend [6,7,8]. Previous studies have shown that nine lakes in Central Asia have decreased in area by about 45,352 km 2 , accounting for approximately 49.62% of their total surface areas [6] and the number of lakes decreased from 7309 in 2000 to 6585 in 2015, a decrease of 85 lakes per year [7]. Thus, global climate change has greatly influenced the evolution of lakes.
Global climate change also has a significant impact on lake processes, such as changes in lake size, physical and chemical properties, and lake ice phenology. Among the above processes, lake ice phenology is the most important factor, which directly reflects climate change, thus making it a sensitive indicator of climate change [1,9,10,11,12,13,14]. Lake ice phenology describes the freeze–thaw cycles of lakes and the durations of their ice covers, regulating the chemical, biological, and physical processes in lakes [13,15,16,17,18]. Lakes are particularly important in arid and semi-arid regions. Lakes and their ice covers can provide a number of ecosystem services for people living in Central Asia, such as water supply, agricultural irrigation, and some recreational activities [19]. In addition, lakes play an important role in social and ecological systems in these inland areas where surface flow is scarce [5].
Prior to the widespread use of remote sensing, studies on lake ice phenology relied on traditional methods, including field observations and hydrological studies. However, data collections using these traditional methods were laborious and the data were spatially sparse [20]. Remote sensing data with different spatial and temporal resolutions can fill the data gaps of traditional methods over long time periods. Moderate-resolution imaging spectroradiometer (MODIS) data have temporal resolution of one day and can be important for the long-term monitoring of lake ice. Several MODIS products have been used to detect lake ice phenology, including the MODIS snow product [9,19] and reflectance product [21,22]. In this study, we used the MODIS Land Surface Temperature (LST) product because it contains both daytime and nighttime images and presents more information than other products.
Therefore, we extracted the lake ice phenology from 2002 to 2020 via Google Earth Engine (GEE) and geemap [23]. This study aimed to (1) quantify the changes in lake ice phenology over the past 18 years and (2) analyze the driving factors of changes in lake ice phenology.

2. Materials and Methods

2.1. Study Area and Lake Selection

The study area is located in the mid-latitudes of the Northern Hemisphere, with a spatial extent of 28° N, 61° N, 44° E, and 97° E (Figure 1). The weather in Central Asia is controlled by a continental climate with cold winters and severe droughts in the summer. The overall topography of Central Asia is high in the southeast and low in the northwest, and the numerous inland lakes are unevenly distributed. Annual precipitation in Central Asia is higher in mountainous areas (about 1000 mm) and lower in desert areas (less than 100 mm) [6]. However, in this region, potential evaporation is much higher than annual precipitation [24], making the region one of the world’s most important arid zones. Due to the unique climate, most of the lakes in Central Asia rely on glacial melt, mountain precipitation, and river runoff for their water supply.

2.2. Datasets

2.2.1. MODIS Daily Land Surface Temperature (LST) Products

MODIS is a key instrument installed on the Terra and Aqua satellites; it has provided data since 2000 and 2002, respectively. The MODIS sensor has 36 spectral bands covering wavelengths from 0.405 μ m to 14.385 μ m. Our primary data are daily land surface temperature products from MODIS (MOD11A1, MYD11A1, version 6) for the period from 2002 to 2020, obtained from NASA’s Earth Observing System Data and Information System website via the Google Earth Engine (GEE) platform (https://modis.gsfc.nasa.gov/data/dataprod/mod11.php (accessed on 15 January 2022)). The daily LST product retrieves land surface temperatures using band 31 and band 32 through the split-windows algorithm [25], including daytime LST and nighttime LST of the land surface.
Among the various sensors and products, we chose the MODIS sensor and the MODIS LST daily product because the MODIS sensor has a temporal resolution of 1 day and its LST daily product contains a daytime LST and a nighttime LST with a spatial resolution of 1 km, which can be directly used to create continuous time series for further analysis. The MODIS LST product has the unique advantage of providing more surface information (four images per day) compared to other MODIS products, which increases its priority in this study.

2.2.2. Lake Information

The HydroLAKES database contains freshwater lakes, salt lakes, and artificial reservoirs, and was developed by Global HydroLAB [26]. The main processes used to produce HydroLAKES include manual identification and removal of polygons from rivers and wetlands, removal of duplicate and overlapping polygons, and the correction of damaged or incomplete polygon geometry. Surface area, depth, volume, shoreline length, elevation, and other valuable information for lakes described in the HydroLAKES database are available on the HydroSHEDS website (https://www.hydrosheds.org/page/hydrolakes (accessed on 3 January 2022)).

2.3. Methods

The algorithm for calculating ice–water fraction mainly contains four steps. Firstly, input MODIS datasets and HydroSHEDS datasets; apply quality control to MODIS datasets to remove cloudy pixels and pixels with high LST error values and select lakes. Secondly, merge the lake ice time series data retrieved from the LST_Day_1km band and LST_Night_1km from MOD11A1 and MYD11A1 products from 2002 to 2020. Thirdly, classify lake ice through a LST threshold value and calculate the ice fraction; export the lake ice fraction time series in a csv file. Lastly, use the merged ice fraction time series to extract ice phenology variables, including freeze-up start (FUS), freeze-up end (FUE), breakup start (BUS), breakup end (BUE), freeze-up duration (FUD), ice completely covered duration (ICD), and the breakup duration (BUD).
In this study, FUS represents the first day when the ice fraction is above 0.2, FUE represents the first day when the ice fraction is above 0.8, BUS represents the last day when the ice fraction is above 0.8, and BUE represents the first day when the ice fraction is above 0.2 after BUS. FUD represents the day between FUS and FUE, ICD represents the day between FUE and BUS, and BUD represents the day between the BUS and BUE day of the year.

2.3.1. Quality Control and Lake Selection

Using optical sensors to retrieve lake ice phenology can be largely affected by the clouds. We removed cloud-covered pixels and high LST error pixels through the quality control in the QC_Day and QC_Night bands of MOD11A1 and MYD11A1 datasets. In this study, we set pixels with the quality flag of “LST produced”, “good data quality”, and “average LST error ≤ 1 K” as valid pixels, and classified other pixels as invalid pixels. To simplify the following calculations, we set the value of valid pixels to 1 and the value of invalid pixels to 0. The formula is given as follows in Equations (1) and (2):
M a s k ( t ) = V a l i d P i x = 1 I n v a l i d P i x = 0
I m a g e ( t ) ( c , S ) = I m a g e ( t ) ( r , S ) × M a s k ( t )
where t is the day of the year of the image; S is the name of the satellite (Terra and Aqua); Image r is the LST daily product of the Aqua and Terra satellite; Image c is the image after the quality control operation. By applying Equations (1) and (2) to the whole image collection, we removed most of the low-quality pixels of the whole image collection.
To avoid noise introduced by the mixed pixels, we only chose lakes that had surface areas larger than 30 km 2 . After the selection process, there remained 53 lakes with surface areas ranging from 32.43 to 23,865.91 km 2 .

2.3.2. MODIS Daily LST Combination

Since clouds are constantly moving in the atmosphere, cloud coverage varies with time, making it possible to fill in missing values due to quality control operations by combining images from different times of the day. If a pixel is a cloudy pixel in one satellite observation and a cloudless pixel in another observation, the pixel value of the cloudless pixel is used to fill the cloudy pixel as the final result. Considering that the air temperature varies over time, which means that a valid pixel may have two LST values, we used the largest value as the pixel value. In addition, choosing the largest LST value as the pixel value also reduced the error of water–ice classification, because water freezes when the temperature is below 0 degrees Celsius. Therefore, we used the maximum value combination method to combine the data of MOD11A1 and MYD11A1 (of the same day) after quality control processing. The formula is listed as follows in Equation (3):
M e r g e ( x , y , t ) = M a x ( I m a g e ( x , y , t ) ( c , T ) , I m a g e ( x , y , t ) ( c , A ) )
where x is the index of column (horizontal axis); y is the index of row (vertical axis); T stands for the Terra satellite and A stands for the Aqua satellite. Equation (3) was applied to data from MOD11A1 and MYD11A1 products on the same day. Maximum LST values for daytime and nighttime were obtained from two satellite products.

2.3.3. Lake Ice Penology Variable Extraction

The time series of water–ice transitioning was extracted from the merged image in Section 2.3.2 for the period from 2002 to 2020. The water–ice phases in the MODIS daytime and nighttime merged images were classified by applying a temperature threshold. Most of the lakes in the CA region are saline, which has a lower freezing point. Thus, we selected 272 K as the temperature threshold. If the LST value of the pixel was lower than 272 K, we set the pixel to ice and classified it as P i x e l i c e ; if the LST value was greater than 272 K, we set the pixel to water and classified it as P i x e l w a t e r . The water–ice fraction was calculated by Equation (4):
F r a c t i o n t = N i c e N v a l i d
where t is the index of time and includes daytime and nighttime; N i c e is the total number of P i x e l i c e and N v a l i d is the total number of valid pixels. Equation (4) was applied to data after operation from Section 2.3.2. Daytime and nighttime lake ice fractions were obtained. To further reduce the error of the water–ice fraction, we combined two lake ice fraction time series using Equation (3).

3. Results

3.1. Validation of Ice Phenology Curve

The accuracy of derived ice–water fraction of a lake from the MODIS daily LST combined image was estimated by comparing the ice–water fraction derived from AVHRR daily SST product and Landsat 8. The overall accuracy was calculated as the root mean square error (RMSE) of the time difference and R 2 .
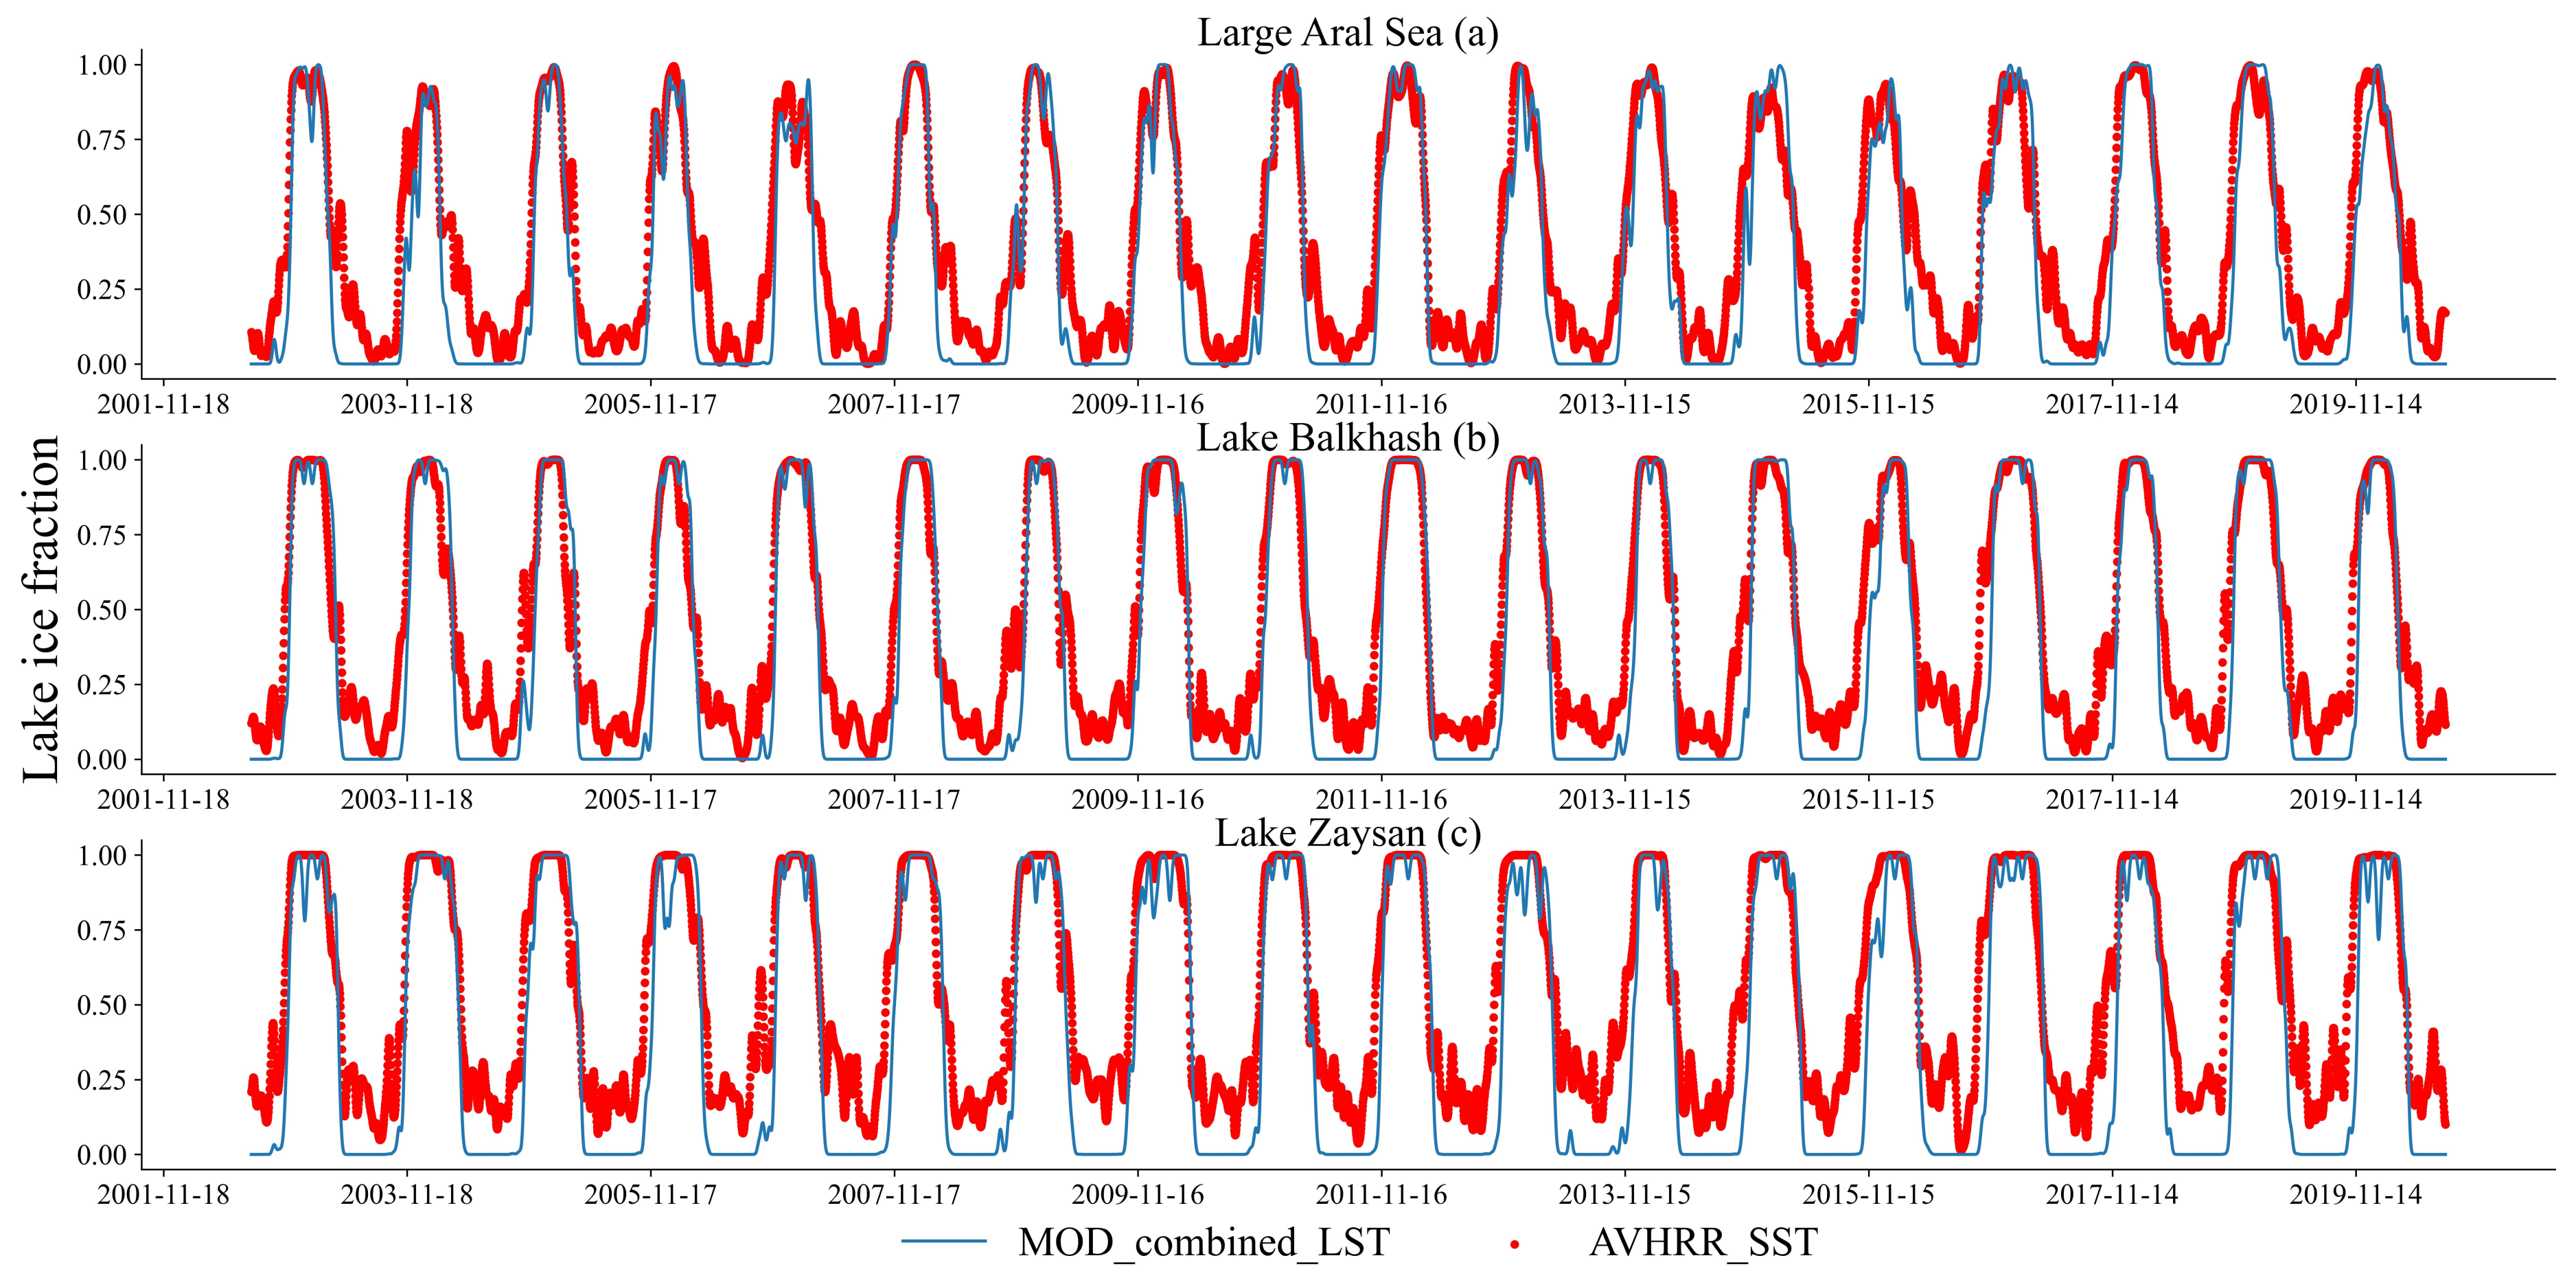
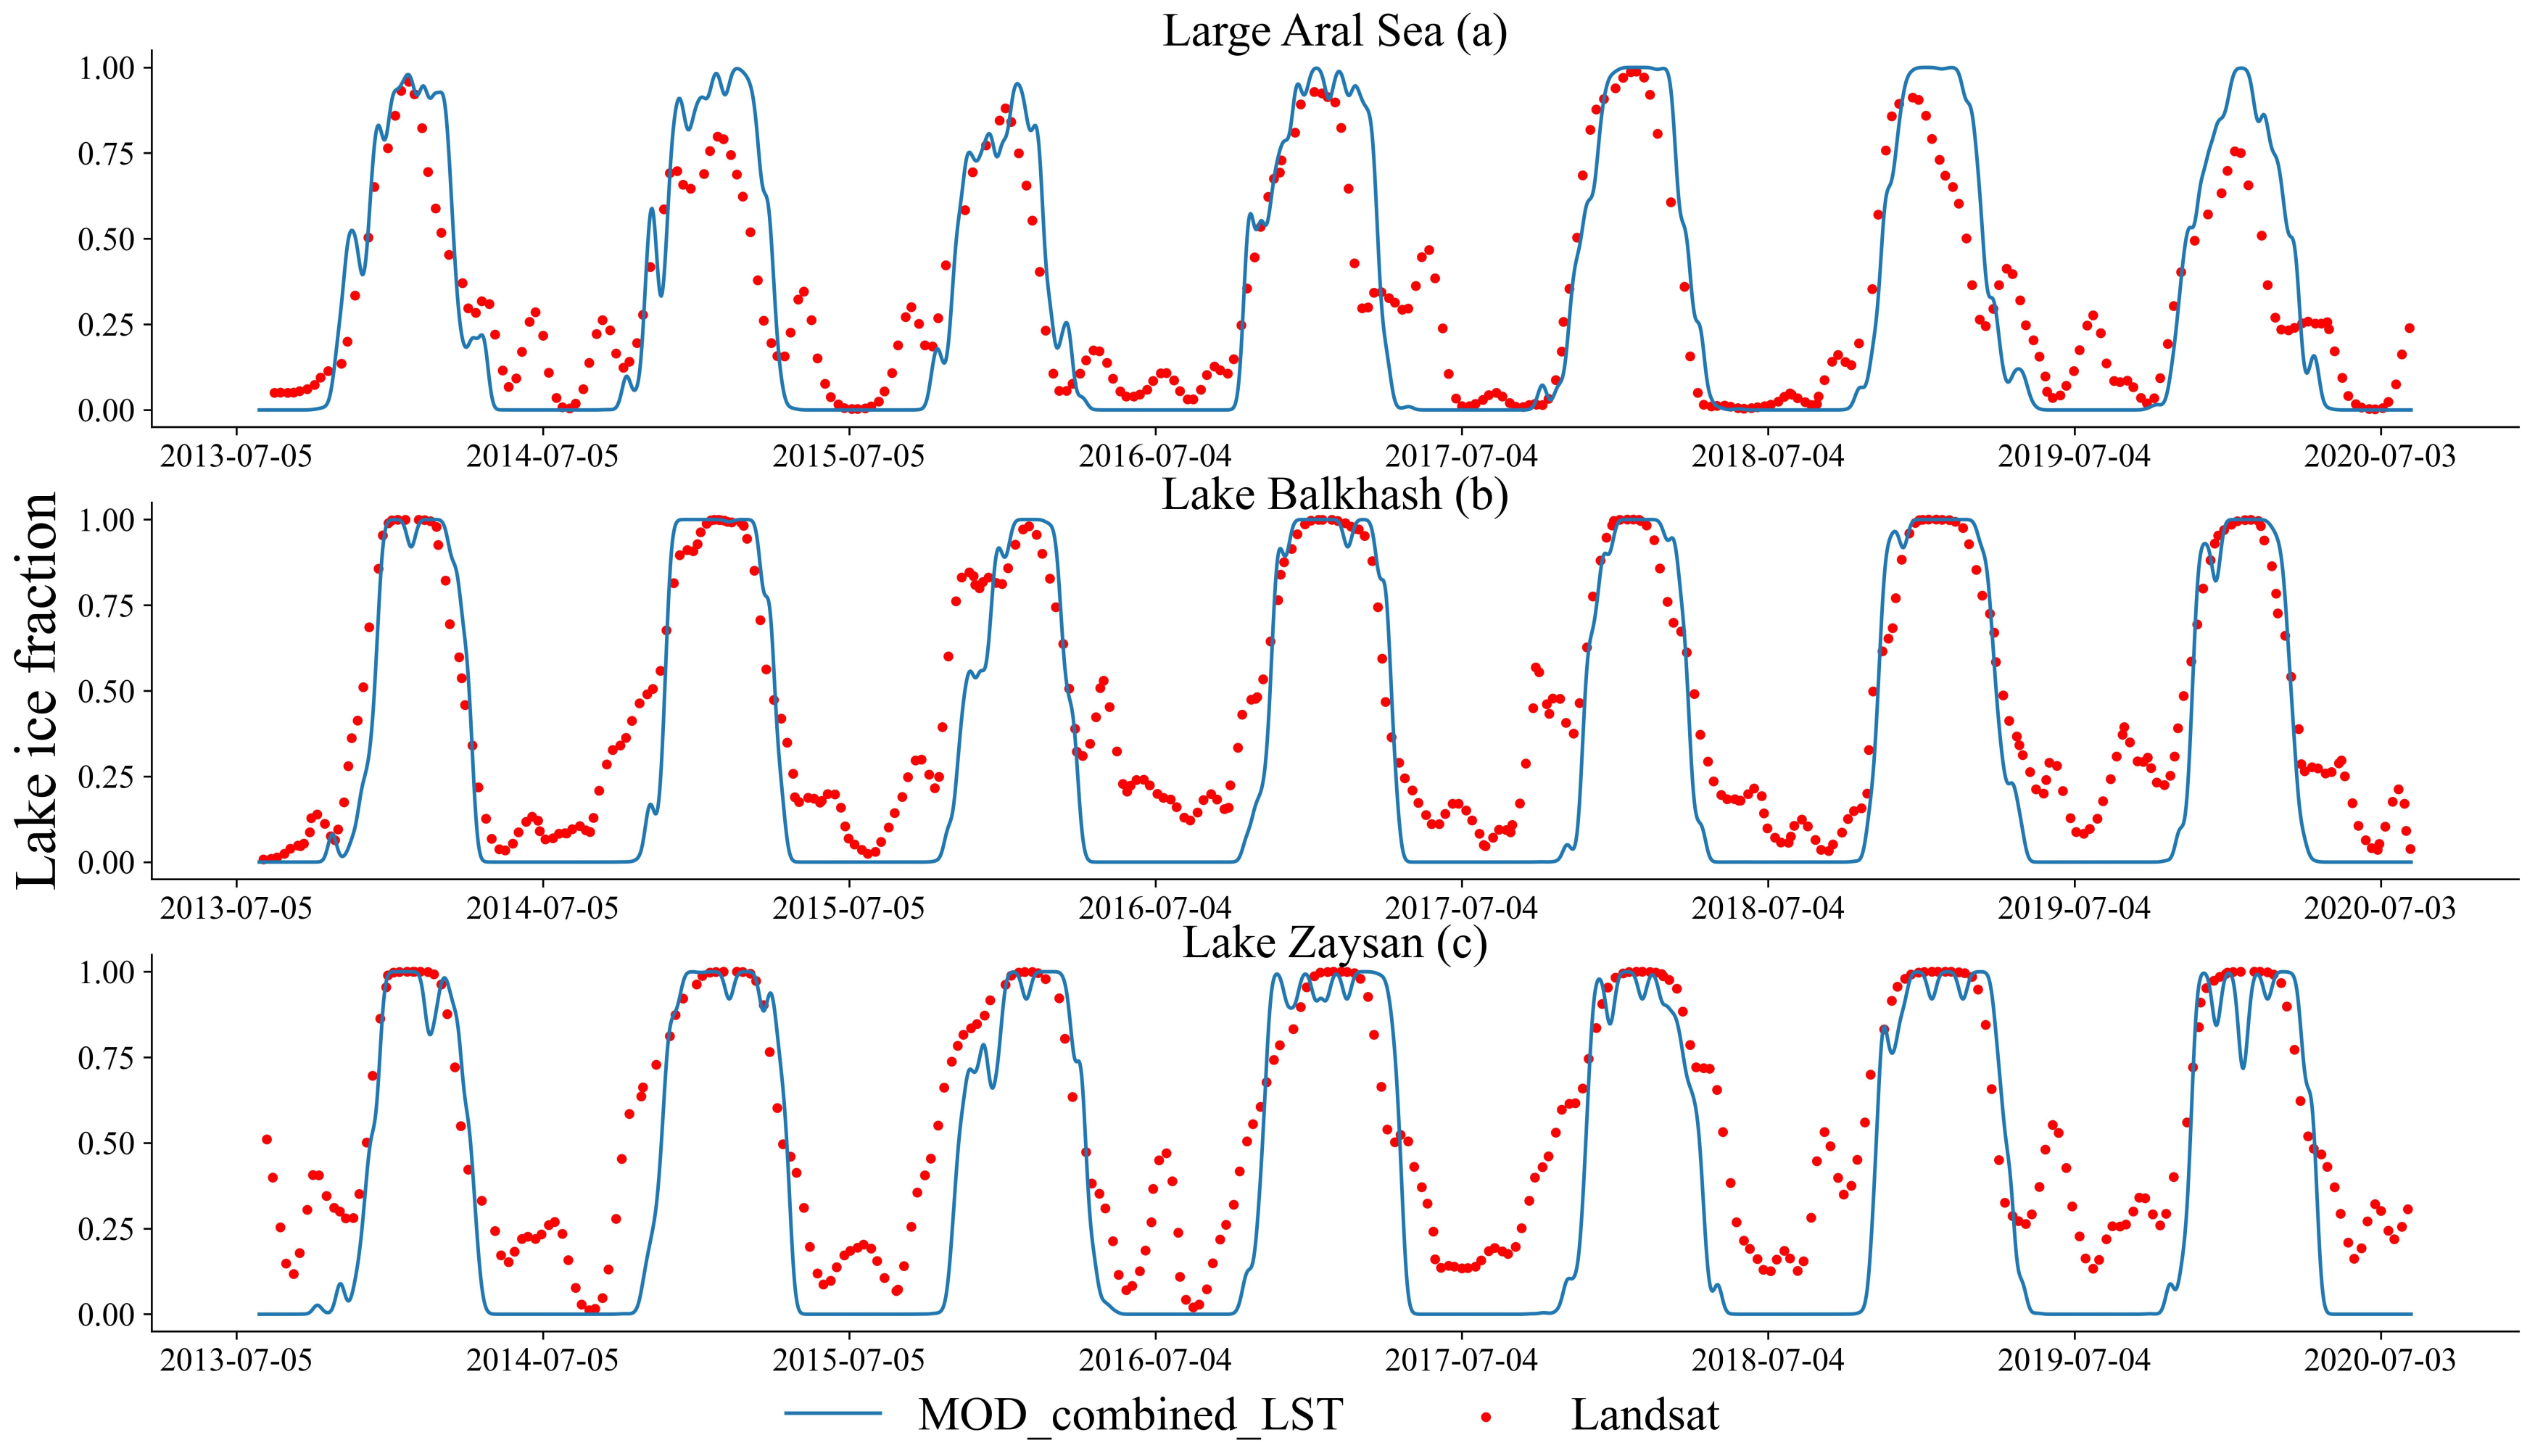
The lake ice fraction time series of three large lakes derived from the MODIS daily LST combined image, AVHRR daily SST image, and Landsat 8 image were compared to access the performance of the method. The lake ice fraction time series derived from the MODIS daily LST combined image was consistent with the AVHRR daily SST image and Landsat8 image (Figure 2 and Figure 3). The R 2 of the comparison ranged from 0.68 to 0.81 and the root mean square error (RMSE) ranged from 0.17 to 0.25 (Table 1), which show that the water–ice fraction derived from the MODIS daily LST combined image had good quality.

3.2. Lake Ice Phenology Characteristics in Central Asia

Remarkable differences in lake ice phenology were found in Central Asia lakes. Some lakes, such as Xiaoxihaiz Shuiku, Kara-Bogaz-Gol, Lake Issyk Kul, Lake Sarygamysh and Lake Aydar, were rarely fully ice-covered in the winter, while some other lakes were frozen all year around. For some lakes, such as Xiaoxihaiz Shuiku, compared to other time periods, the lake ice covers for the period from 2007 to 2008 were significantly increased. This may be due to the occurrence of the La Nina event in 2007. The mean ’day of year’ (doy) of FUS was 106.85 in all lakes; the mean doy of FUS was 137.02 in not completely ice-covered lakes, and the mean doy of FUS was 94.95 in completely ice-covered lakes (Table 2); the mean doy of FUE was 125.26 in completely ice-covered lakes (Table 2); the mean doy of BUS was 227.35 in completely ice-covered lakes (Table 2); the mean doy of BUE was 231.86 in all lakes, the mean doy of BUE was 180.32 in not completely ice-covered lakes, and the mean doy of BUE was 252.20 in completely ice-covered lakes (Table 2).
Lake Seletyteniz had the mean earliest doy of FUS (64.50), Lake Issyk Kul had the mean latest doy of FUS (165.17), Lake Seletyteniz had the mean earliest doy of FUE (89.89), Lake Sarezskoye had the mean latest doy of FUE (165.67), Lake Kaydak had the mean earliest doy of BUS (179.61), Lake Arkatag had the mean latest doy of BUS (271.5), Lake Saryyazin Skoye had the mean earliest doy of BUE (153.33), and Lake Arkatag had the mean latest doy of BUE (310.17).
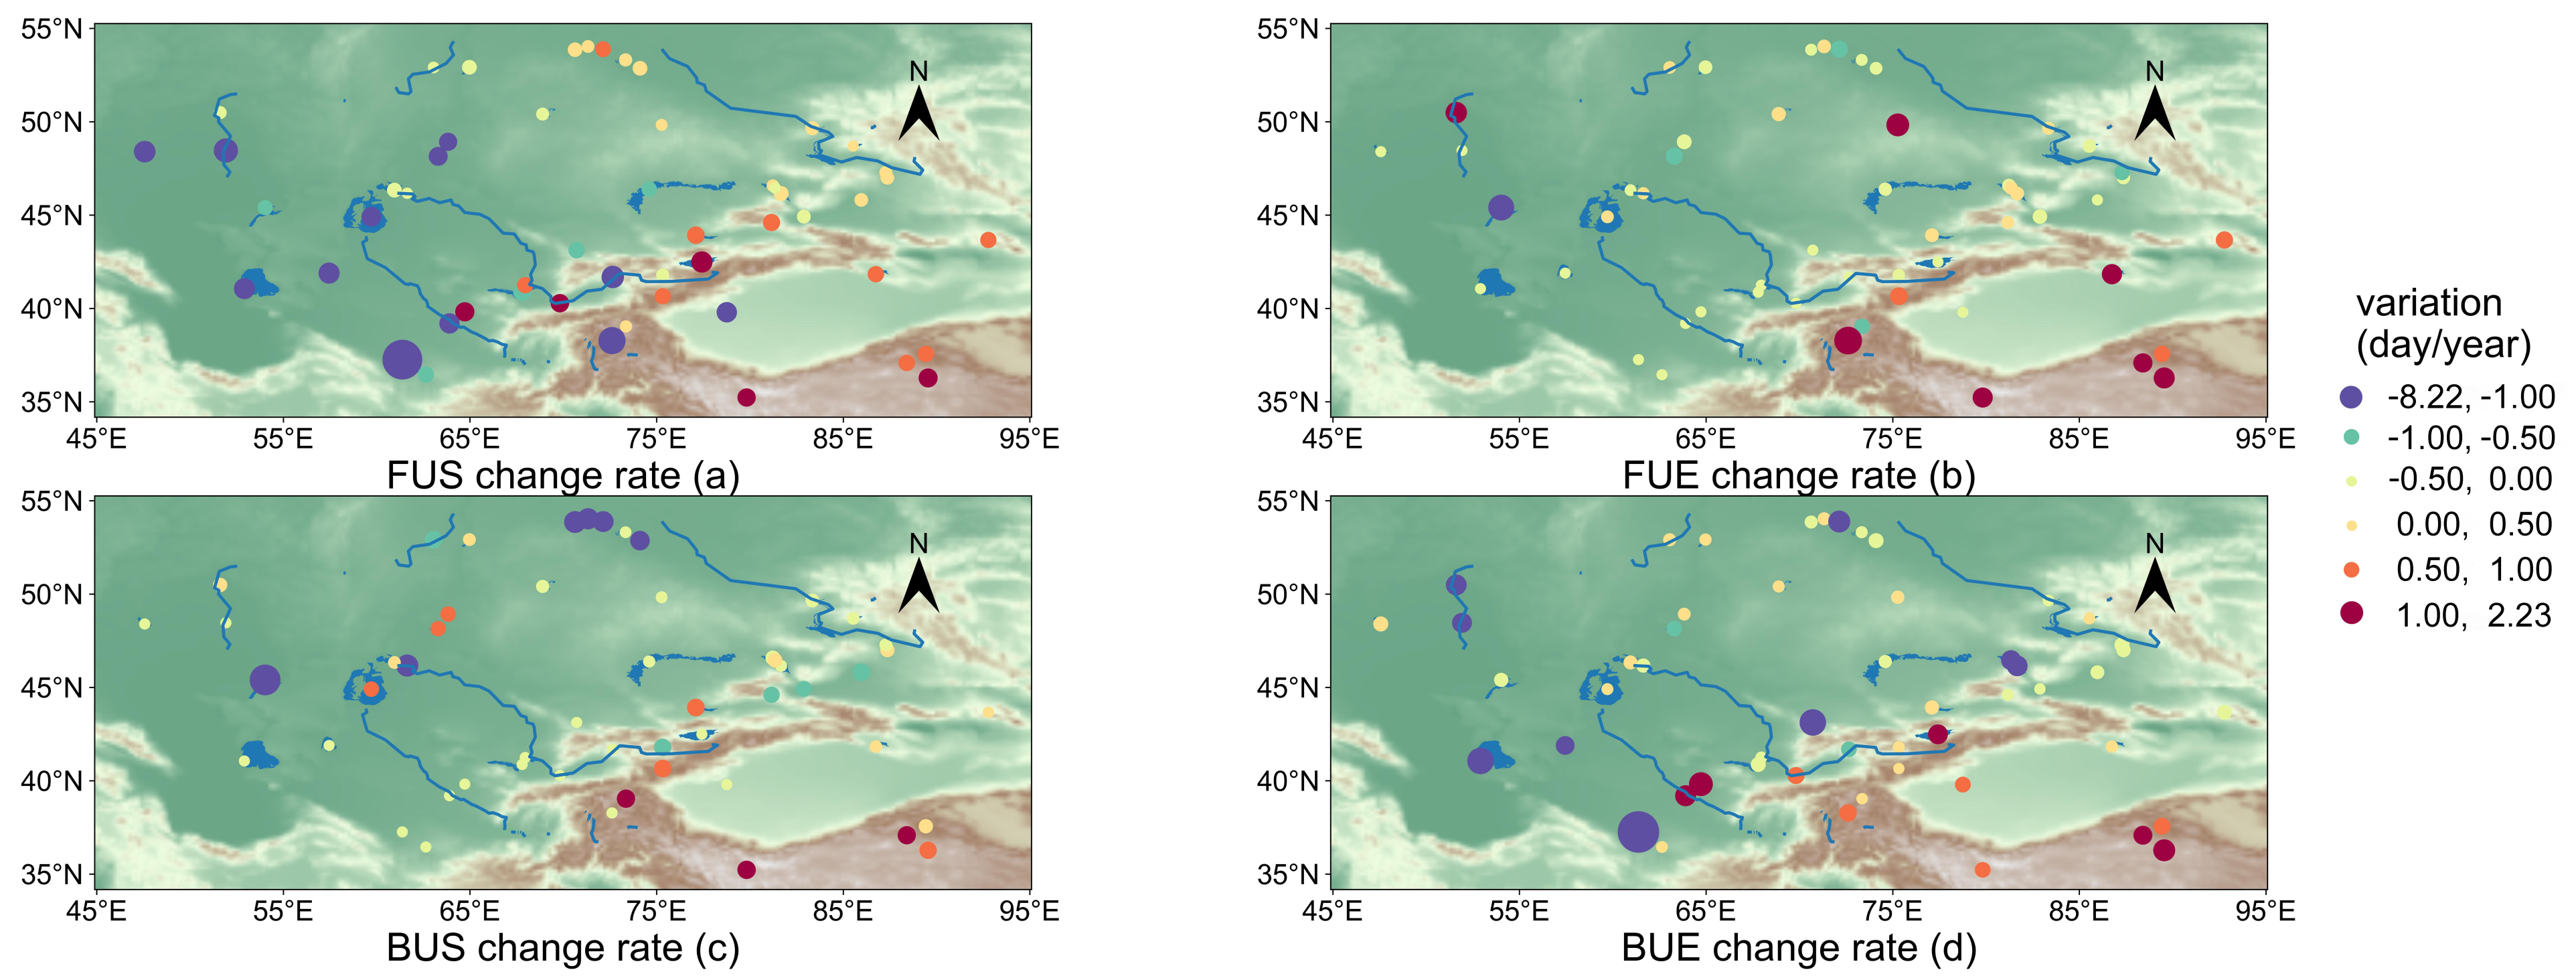
Previous studies have revealed that the lakes in the Northern Hemisphere experienced earlier breakups and later freeze-ups. Not all lakes in Central Asia had the same trend as previous studies [15,27]. The trends of the ice phenology variables are presented in Figure 4. From 2002 to 2020, 26 lakes (49.06%) had advanced FUS dates, and 21 lakes (39.62%) had advanced BUS dates. Due to some lakes rarely being completely frozen in the winter and the ’day of year’ (in FUE and BUS) was too noisy for analysis, we set the trend value to zero in FUE and BUS. Lakes, located in the southwest part of Central Asia had obvious advancing trends in FUS dates. For the BUS dates, lakes in the north and west parts of Central Asia had obvious advancing trends.

3.3. Ice Phenology in Different Elevation Lakes

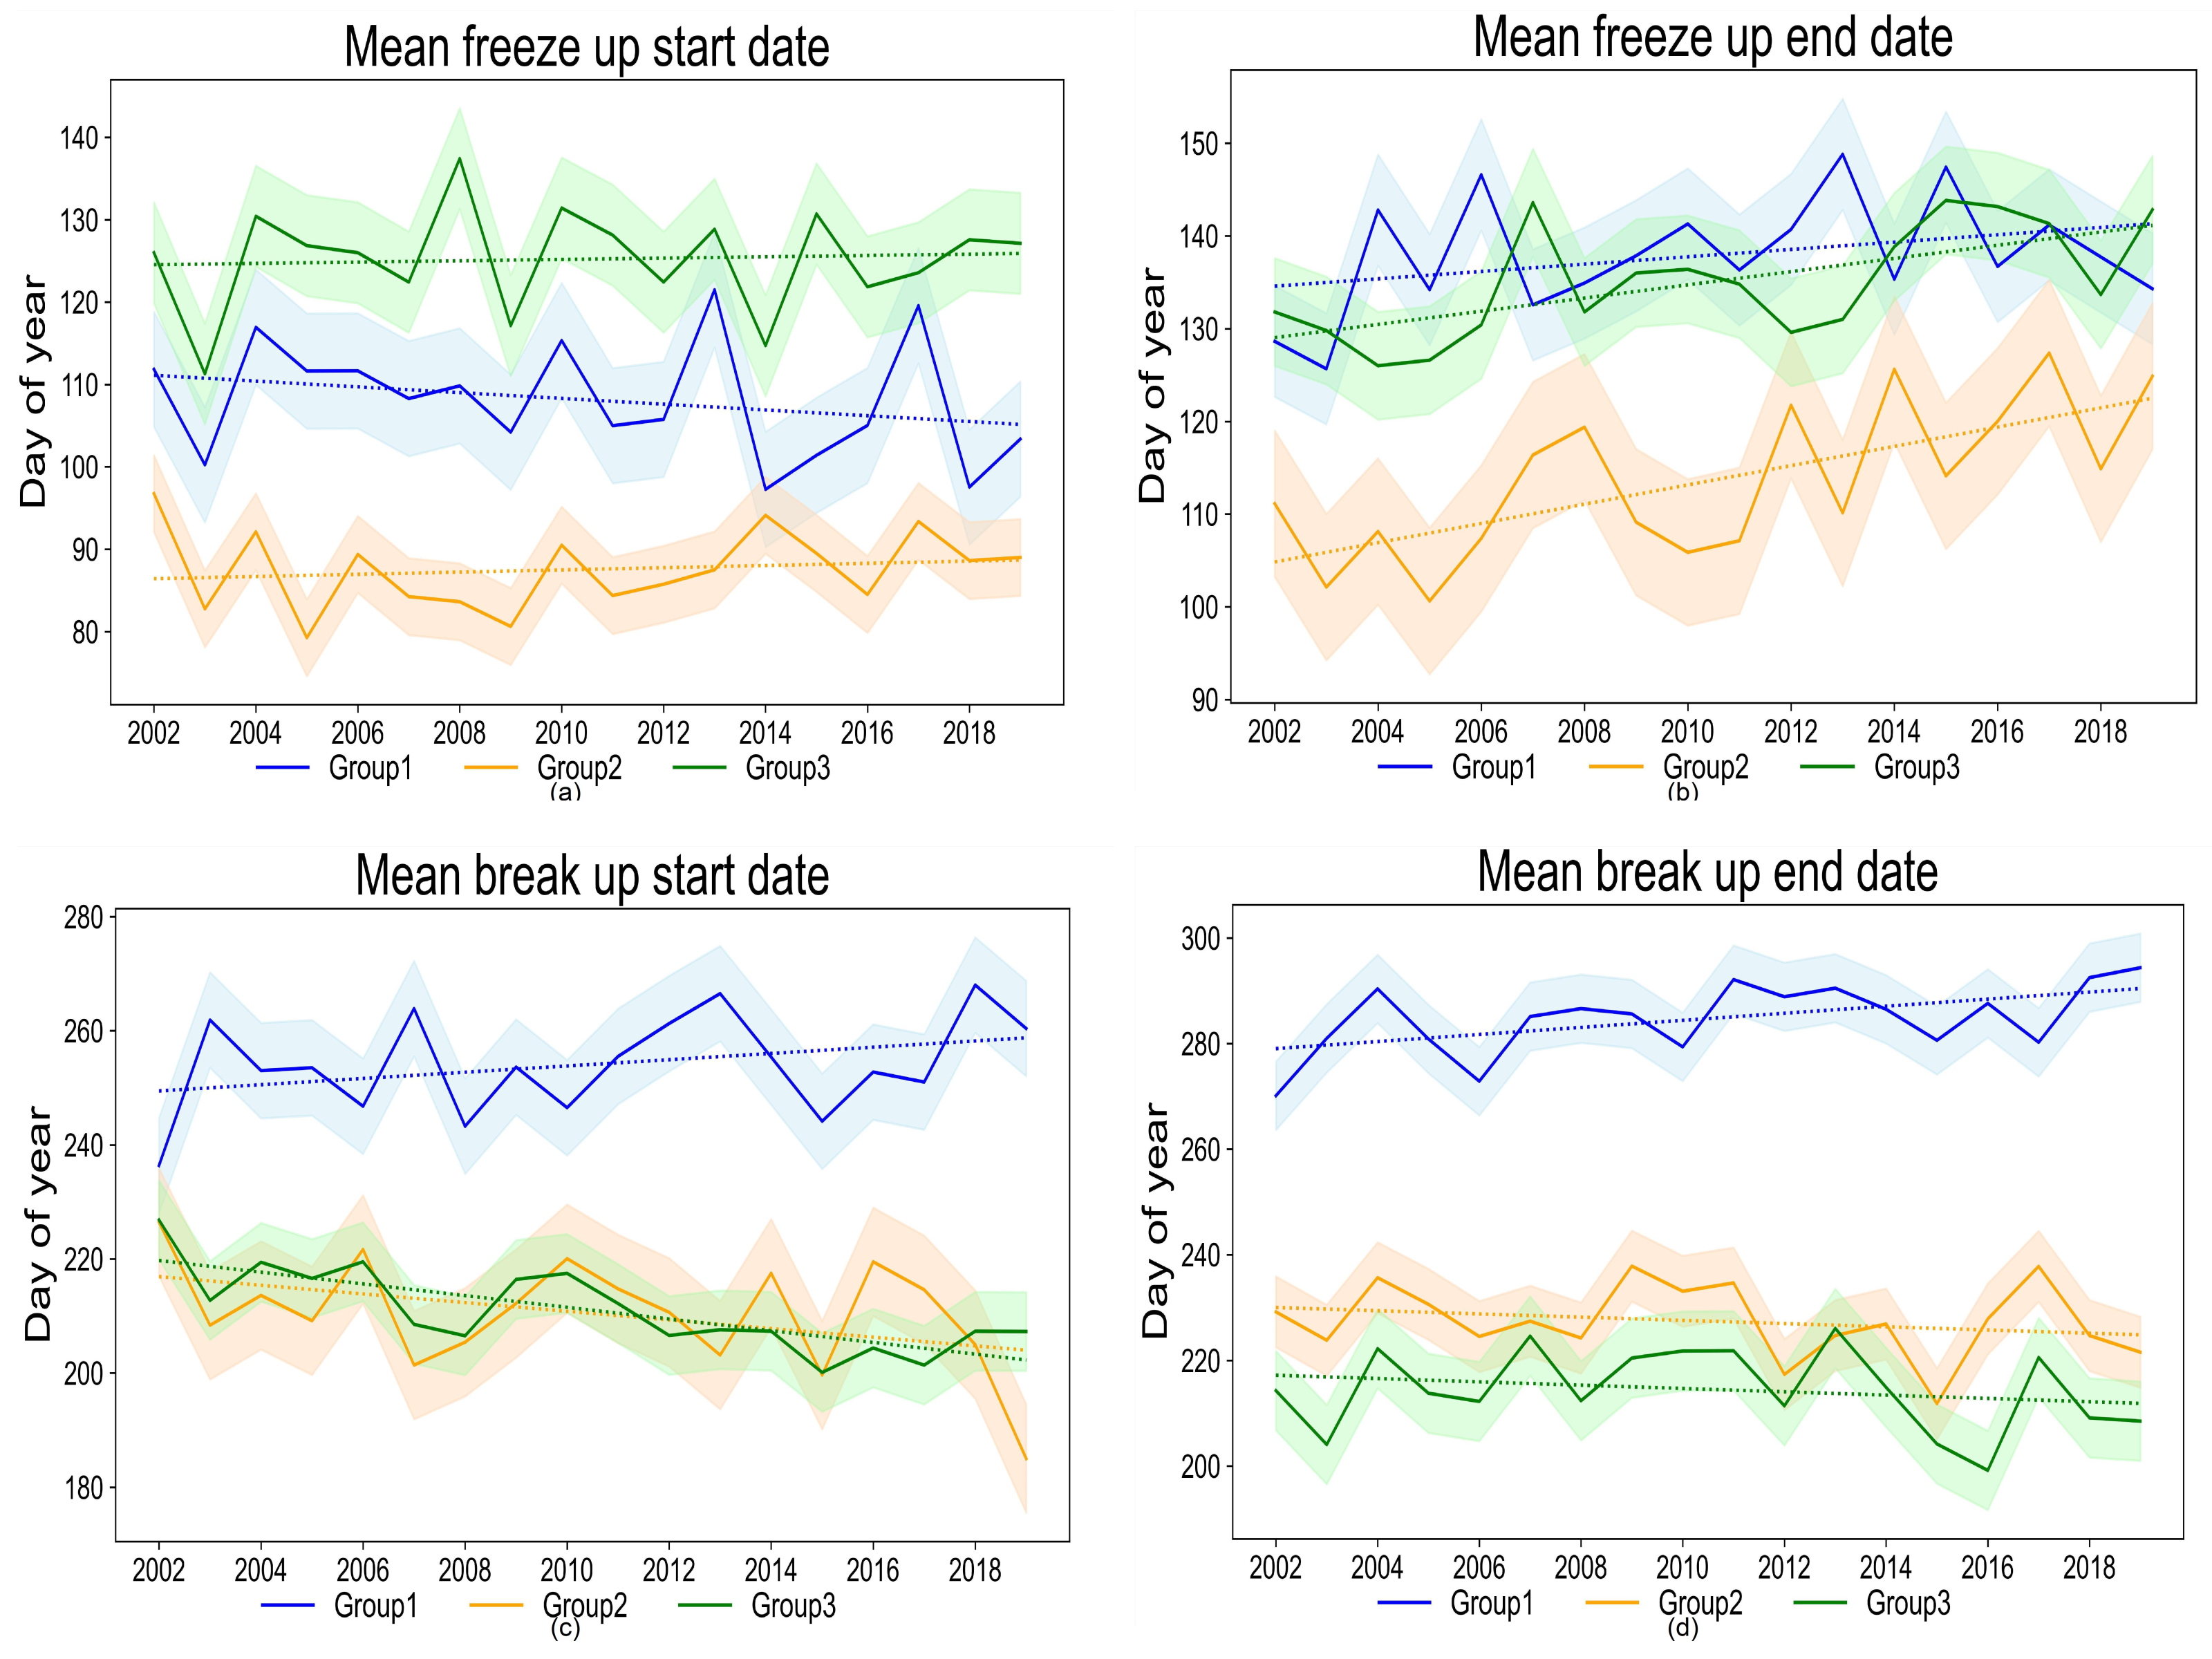
Lakes were clustered into three groups according to the elevation using K-means (Group 1: elevation higher than 3000 m, Group 2: elevation from 1000 to 2000 m, Group 3: elevation lower than 1000 m). The mean temporal patterns and trends of ice phenology of three groups of lakes from 2002 to 2020 are presented in Figure 5 and Table 3. Generally, higher altitude lakes had earlier FUS, FUE dates and later BUS, BUE dates. Compared to Lake Kaydak (elevation −29 m), in group 3, the FUS and FUE in Lake Aksayquin (elevation 4844 m) in group 1 were 27 and 41 days earlier, while the BUS and BUE were 80 and 74 days later. Furthermore, the trends of each lake’s ice phenology variable in the three groups were consistent overall with the trends of earlier breakups and later freeze-ups in the Northern Hemisphere, as revealed by previous studies [12,15,27,28]. The trend of ice phenology in group 2 correlated with previous studies, while the trends in group 1 (an earlier breakup trend) and group 3 (a later freeze-up trend) existed some differences (see Table 3). The FUD, ICD, and BUD are listed in Table 4.

3.3.1. Group 1: Elevation Higher than 3000 m

Lake Karakul in group 1 had the longest average FUD of 33.06 days (see Appendix A Table A1) and the only negative trend of FUD, this might be because Lake Karakul had the second largest area and depth (except for Lake Sarezskoye because the duration of Lake Sarezskoye was too noisy to analyze). Lake Aqqikkol had the shortest average FUD of 13.33 days (see Appendix A Table A1). Lake Arkatag had the longest average ICD of 178.83 days (see Appendix A Table A1), this might be because Lake Arkatag had the shallower lake depth in group 1. Lake Sarezskoye had the shortest average ICD of 79.11 days (see Appendix A Table A1) and the most negative trend of ICD in group 1. Lake Ayakkum had the shortest average BUD of 21.89 days, while Lake Arkatag had the longest average BUD of 38.67 days (see Appendix A Table A1).

3.3.2. Group 2: Elevation from 1000 m to 2000 m

Bosten Lake had the shortest average FUD of 20.56 days (see Appendix A Table A1) and Lake Sailimu had the longest average FUD of 27.83 days (see Appendix A Table A1). For ICD, Bosten Lake had the shortest average ICD of 77.62 days (see Appendix A Table A1), while Markakol had the longest average ICD of 144.55 days (see Appendix A Table A1) and the only positive trend of ICD. For BUD, Bosten Lake had the shortest average BUD of 13.61 days (see Appendix A Table A1), while Lake Barkol had the longest average BUD of 29.89 days (see Appendix A Table A1).

3.3.3. Group 3: Elevation Lower than 1000 m

Lake Balkhash had the shortest average FUD of 16.28 days (see Appendix A Table A1), while Lake Ul’ken-karoy had the longest average FUD of 58.78 days (see Appendix A Table A1). For ICD, the Qapshaghay Bogeni Reservoir had the shortest average ICD of 28.84 days (see Appendix A Table A1), while Lake Seletyteniz had the longest average ICD of 145.28 days (see Appendix A Table A1). For BUD, Lake Balkhash had the shortest average BUD of 14.06 days (see Appendix A Table A1), while Lake Shalkar had the longest average BUD of 28.11 days (see Appendix A Table A1).

4. Discussion

4.1. Correlation of Lake Ice Phenology Variables with Influencing Factors

Both climatic conditions and local factors affect lake ice phenology to varying degrees [15]. Climatic conditions control the heat exchange between lake and air [29], while local factors influence the heat capacity, which ultimately affects the phenology of lake ice. For example, climatic conditions, such as wind speed, can destroy thin ice when a lake with thin ice encounters strong winds [30]. In addition, lakes with larger volumes and areas require more heat to freeze and breakup during a hydrological year [19,31]. Major climatic factors include a mean 2 m of air temperature, mean temperature during deglaciation, wind speed, short-wave radiation, and precipitation [29,30,32,33]. Local factors include latitude, longitude, elevation, depth, and area [19,30,33]. Climatic factors including air temperature, wind speed, and precipitation, are derived from monthly average products of ERA5 and shortwave radiation from TerraClimate.
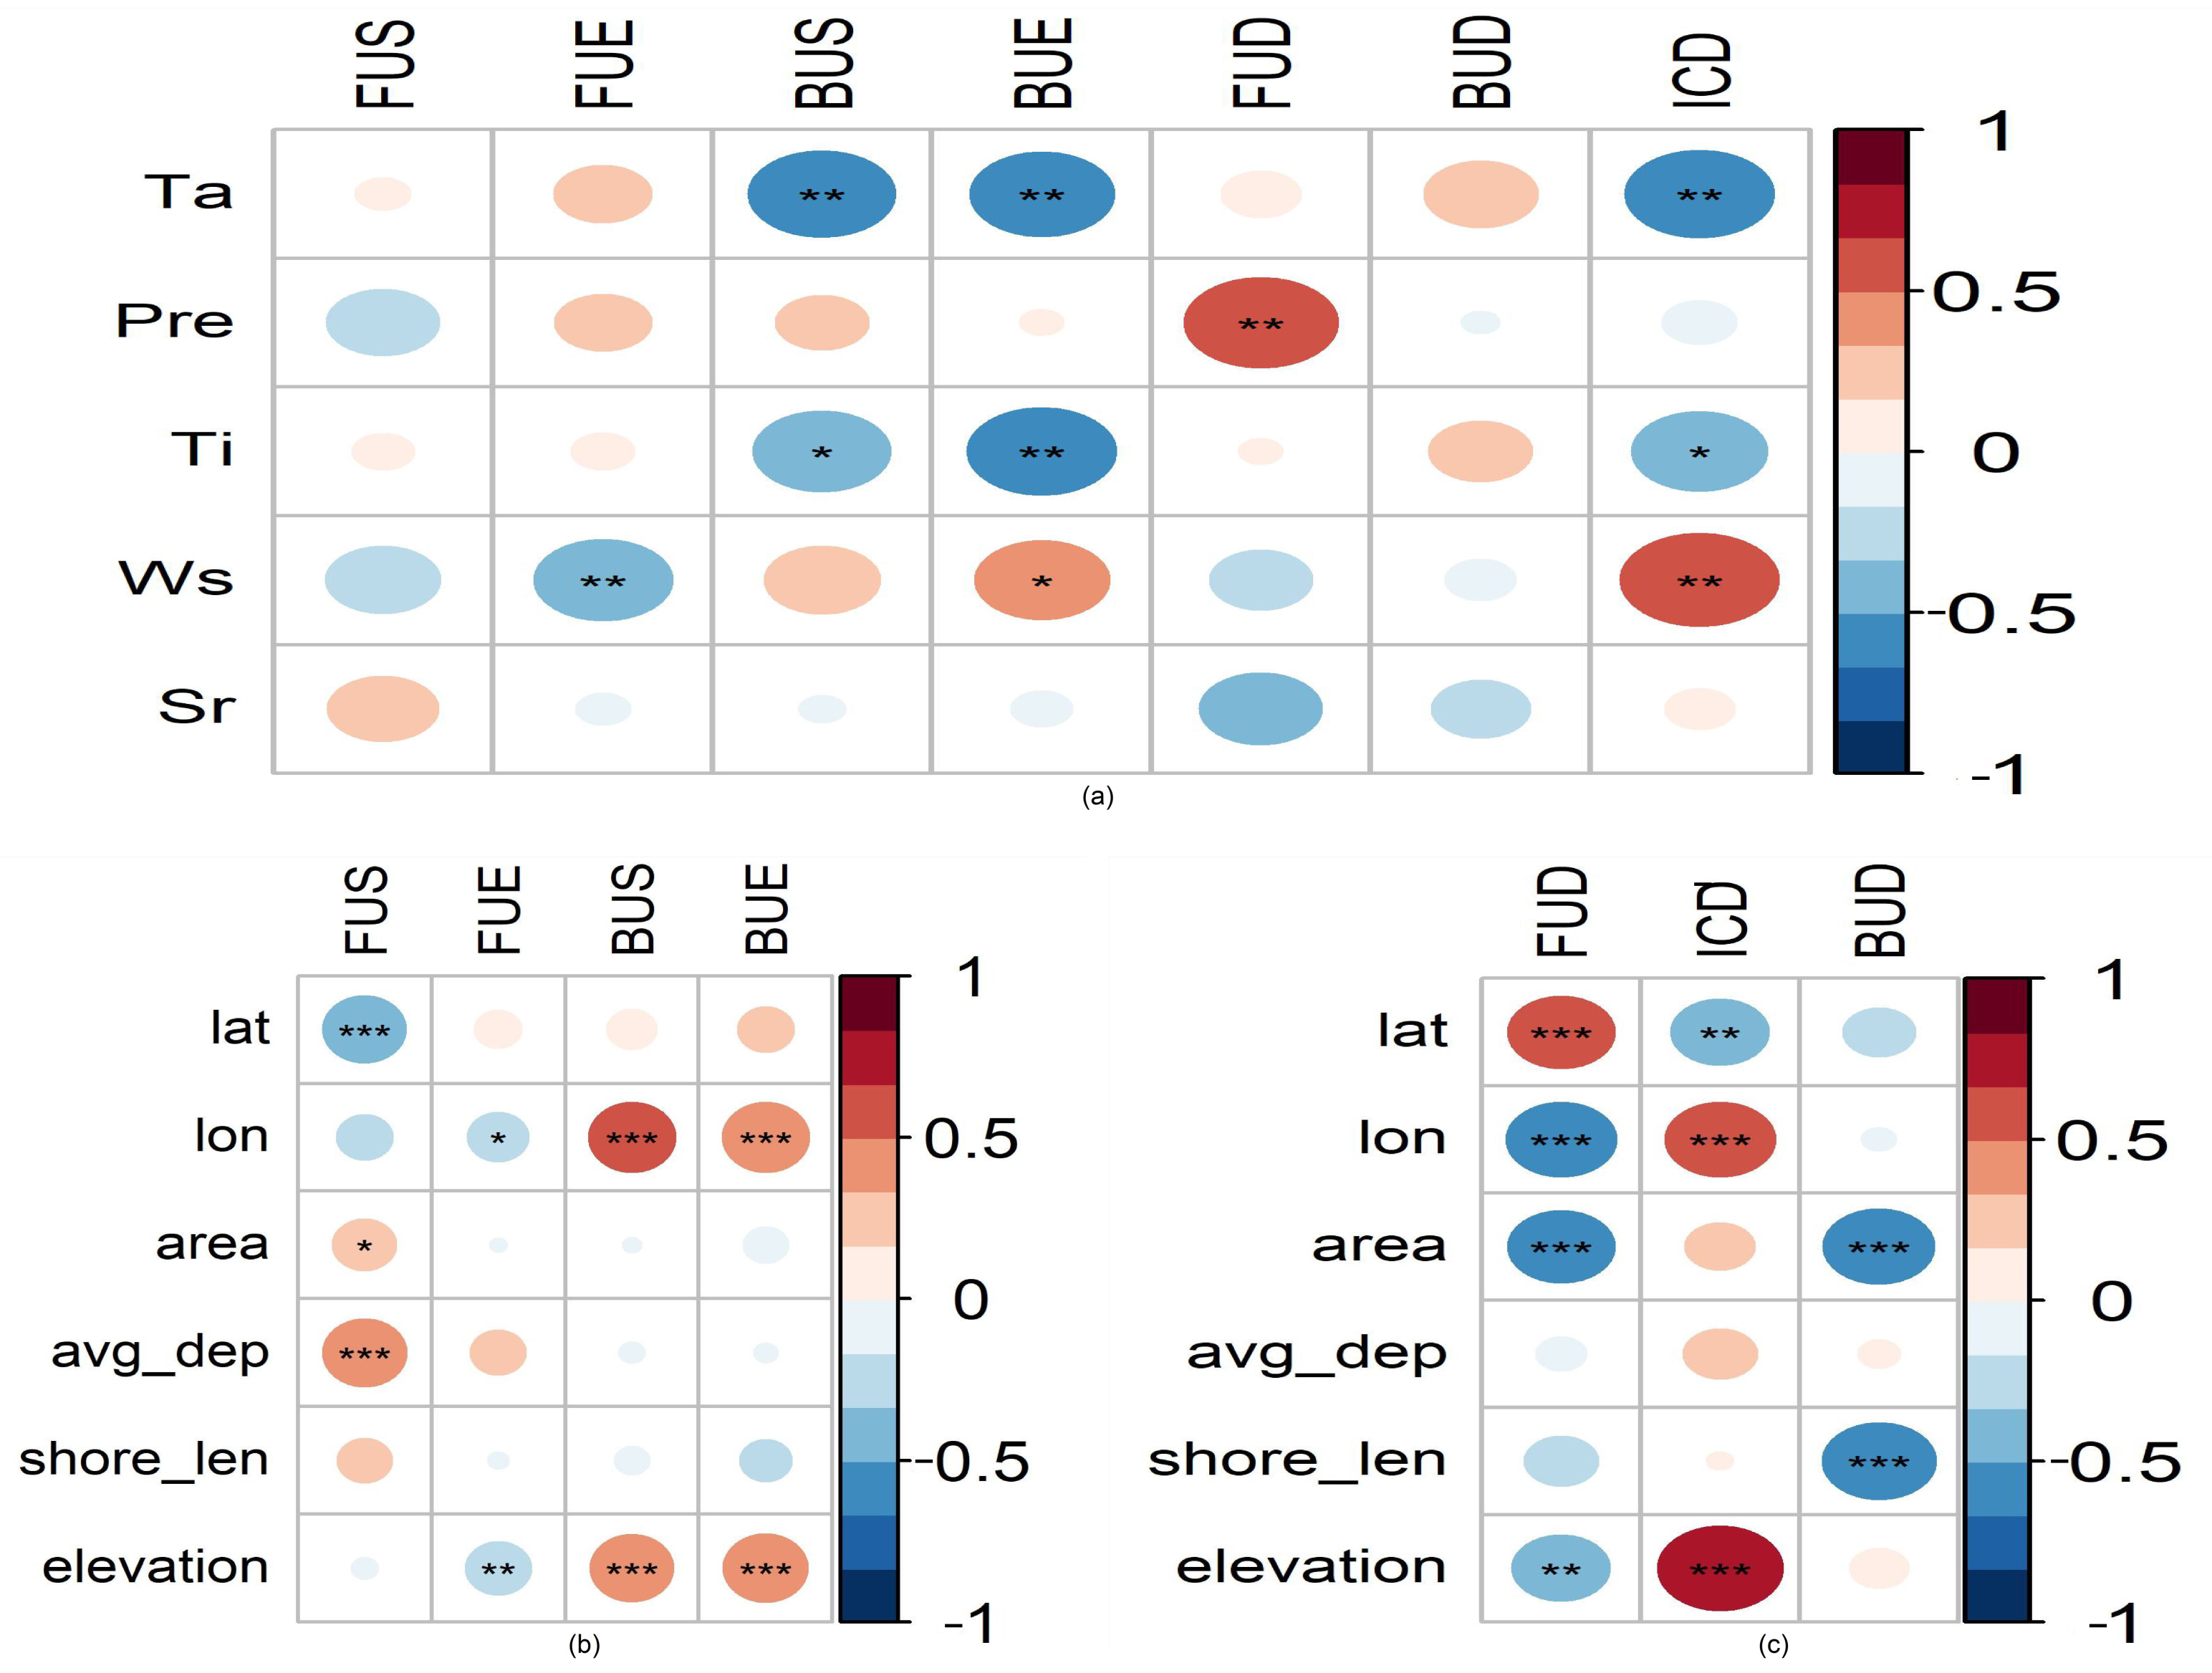
Figure 6a shows that temperature-related climatic factors mainly affect the ice breakup period, which is consistent with previous studies [19,29,34], and the completely frozen period of ice. Precipitation is negatively correlated with FUS and positively correlated with FUE, which has a strong influence on the completely frozen period of ice. This may be due to the fact that precipitation not only decreases the temperature [35,36], but also destroys the thin ice layer on the lake surface, which makes the freezing start earlier and the freezing end later, and finally prolongs the freezing process [30]. Short-wave radiation has a strong effect on FUS and FUD. The higher the wind speed, the earlier the freezing event occurs, the later the breakup event occurs, and the longer the ice completely covers the duration. This may be because wind accelerates convection over the lake surface, bringing cold air above the lake surface, accelerating the freeze-up process, delaying the breakup process [30], and prolonging the ICD. Strong winds may destroy the thin ice layer on the lake surface and prolong the freezing process [34,35,37].
Figure 6b,c, show the correlation between lake ice phenology variables and lake-specific factors. The results in Figure 6b shows that longitude and altitude have a strong influence on BUE, BUS, and FUE. This may be due to the fact that the higher the altitude, the lower the air temperature [38,39], and the altitude of Central Asia is higher in the east and lower in the west, which delays BUS, BUE, and advances FUE. Compared to BUE, BUS, and FUE, FUS is more dependent on latitude, lake area, and lake depth. This is because the temperature at high latitudes is lower than that at low latitudes, making FUS occur earlier. In addition, the larger the lake area and the deeper the average depth of the lake means that more heat needs to be released during the freezing period, thus affecting the date of FUS [9,30,34,40]. The result in Figure 6c shows that the lake area and the length of the lake shore have strong influences on BUD. This may be due to the fact that lakes with large areas and long shores have thinner ice compared to other lakes, which may be the reason for the negative correlation between BUD and lake area and shore length. FUD is negatively correlated with longitude and altitude. This is because the altitude in Central Asia is lower in the west and higher in the east, and the temperature is lower at higher altitudes than at lower altitudes. However, the anomalous relationship between latitude, lake area, and FUD is difficult to explain, probably because of the high salinity of lakes in Central Asia. ICD has a negative correlation with latitude and a positive correlation with longitude and altitude. This may be because the elevation in Central Asia is higher in the south and lower in the north, and elevation may be a more important factor than latitude.

4.2. Limitation and Prospection

The limitations of the study are listed below. First, the daily LST combination process (see Section 2.3.2) was unable to fill the data gaps caused by severe cloud contamination. Second, due to the lack of lake salinity data, using a threshold of 272 K to determine the freezing point of all lakes, instead of using a threshold based on lake salinity for each lake, may lead to some uncertainties in extracting lake ice phenology. In addition, the merging of daytime LST and nighttime LST ignores the temperature variation and may introduce some additional uncertainties [29]. Moreover, lake salinity is an important factor affecting lake ice phenology [33]. Due to the lack of lake salinity, the analysis between lake ice phenology and incluence factors (e.g., lake-specific factors) may not be comprehensive. Furthermore, anthropogenic activities affecting lake ice phenology were not addressed in this study. However, anthropogenic activities are also important factors affecting climate change, as anthropogenic global warming is best estimated at 1.07 C [3], which has a significant impact on terrestrial systems [41,42]. Finally, the anomalous relationship between latitude, lake area, and FUD is difficult to explain, probably because of the high salinity of lakes in Central Asia.
As a sensitive indicator of regional climate change, the phenology of lake ice is still inadequately studied in some regions, especially in Central Asia. In addition, satellite products with long-term and temporal continuities have relatively low spatial resolutions and are weak in monitoring small lakes, while satellites with higher spatial resolutions are not continuous in time. Further studies can be conducted in the following aspects:
(1)
Using multiple satellite data to retrieve lake ice phenology for all lakes, including small lakes.
(2)
Quantifying and evaluating how anthropogenic activities affect lake ice phenology variables.
(3)
Projecting future lake ice variations in different representative concentration pathways (RCPs).

5. Conclusions

In this study, we used a combined method applied to MOD11A1 and MYD11A1 products to obtain daily LST and classified water and ice pixels using temperature thresholds. Based on this approach, we extracted lake ice phenology for 53 lakes in Central Asia for 2002–2020, including FUS and BUE for 53 lakes and FUE and BUS for 38 lakes. The results show that the time series of water–ice components derived from the MODIS daily-combined LST dataset and the AVHRR and Landsat8 datasets are generally highly consistent.
In this study, lakes in Central Asia start to freeze from October to December. The mean FUS and BUE of the Central Asia lakes were 106.85 and 231.86, respectively. Trends in ice phenology for each lake showed strong regional differences. Lakes distributed along the mountains show overall delayed trends among all lake ice phenology variables. In contrast, lakes in southwestern Central Asia showed clear trends of advancing FUS and BUE. From 2002 to 2020, the average advancement rate of FUS was −0.29 days/year for the 53 lakes in Central Asia, the average delay rate of FUE was 0.24 days/year for the 38 lakes in Central Asia, the average advancement rate of BUS was −0.22 days/year for the 38 lakes in Central Asia and the average advancement rate of BUE was −0.25 days/year for the 53 lakes in Central Asia.
Lake ice phenology in Central Asia is influenced by climatic factors (temperature, precipitation, ice age temperature, wind speed, and shortwave radiation) and local factors (latitude, longitude, lake area, mean lake depth, shore length, and altitude). In general, temperature and wind speed have the most direct effects on lake ice phenology, and precipitation mainly affects FUD. Lakes at high elevations tend to have longer ICD. Lake areas mainly affect FUD and BUD.

Author Contributions

G.H.: conceptualization, methodology, software, data curation, visualization, writing—original draft preparation. X.Y.: data curation, writing and editing. X.M.: methodology, writing and editing. Z.Z.: data curation. X.C.: methodology, software. C.X.: data curation. Q.L.: methodology. W.L.: data curation. G.L.: supervision and editing. S.W.: supervision, validation, writing—reviewing and editing. All authors have read and agreed to the published version of the manuscript.

Funding

This research was funded by the Strategic Priority Research Program of the Chinese Academy of Sciences, grant number XDA23100201.

Data Availability Statement

All the data can be accessed on https://modis.gsfc.nasa.gov/data/dataprod/mod11.php and https://www.hydrosheds.org/page/hydrolakes, accessed on 17 August 2022.

Acknowledgments

Thanks to Yanjun Su (Institute of Botany, the Chinese Academy of Sciences) and Yang Zhang (Chengdu University of Information Technology) for the detailed suggestions. We highly appreciate the anonymous reviewers for their helpful comments and suggestions. Special thanks to the open source projects used in this study: IPython, Matplotlib, Numpy, Pandas, earth engine, geemap, geopandas, cartopy, and contextily.

Conflicts of Interest

The authors declare that they have no known competing financial interests or personal relationships that could have appeared to influence the work reported in this paper.

Appendix A

Table A1. Mean Lake ice phenology of 53 lakes in Central Asia.
Lake NameMean FUSMean FUEMean BUSMean BUEMean FUDMean ICDMean BUD
Akkol88.67129213.44242.1640.3384.4428.72
Aksayquin82.0699.61259.39286.8917.56159.7827.5
Alakol125.39144.89219.06236.2819.574.1717.22
Aqqikkol88.39101.72242.33280.3313.33140.6138
Arkatag77.5692.67271.5310.1715.11178.8338.67
Ayakkum94.44105.44234.5256.3911129.0621.89
Aydar146.78NANA164.28NANANA
Balkhash107.78124.06229.06243.1116.2810514.06
Barkol67.590.89218.72248.6123.39127.8329.89
Biylikol132.17NANA178.06NANANA
Bosten122.72143.27220.89234.520.5677.6213.61
Chardarinskoye127.72NANA172.89NANANA
Chatyr-kel’71.72104.39261.72294.2232.67157.3332.5
Ebi102.89124.06209.78231.3321.1785.7221.56
Inder102.39NANA224.78NANANA
Issyk Kul165.17NANA190.33NANANA
Jili110.83136.56221.94250.5625.7285.3828.61
Kamyshlybas111.17144.67196.22231.6133.551.5535.39
Kara-Bogaz-Gol144.67NANA170.39NANANA
Karakul93126.06266.06289.533.0614023.44
Karasor84.06120.06228.67254.2836108.6125.61
Karatomarskoye88.39139.89230.78257.0647.590.8926.28
Kaydak109.67141.89179.61212.7232.2237.7233.11
Kayrakkumskoye134.39NANA159.83NANANA
Kayrakkumskoye1139.11NANA173.25NANANA
Kilibek71.22121.39207.94244.3950.1786.5536.44
Kishi’karoy76.67118.22219.67245.3941.56101.4525.72
Kushmurun73.5113.78236.33254.6140.28122.5518.28
Kuyumazarskoye149NANA166NANANA
Large Aral Sea108.56129.83211.56227.2221.2881.7315.67
Manas93.78119.28209.33230.8325.590.0521.5
Markakol’97.83119.89264.44283.3322.06144.5518.89
Qapshaghay
Bogeni
Reservoir
133.33164.22193.06219.1130.8928.8426.06
Sailimu129.56157.39245.06268.9427.8387.6723.89
Sarezskoye99.06165.67244.78269.3366.6179.1124.56
Sarygamysh150.33NANA194.28NANANA
Saryyazin Skoye136.06NANA153.33NANANA
Sasykkol105.78126.44221.06240.9420.6794.6219.89
Seletyteniz64.589.89235.17251.8925.39145.2816.72
Shalkar101.06157.11208.78236.8956.0551.6728.11
Shalkarteniz72.61123.44212.11237.2850.8379.9425.17
Small Aral Sea110.78132.17215.72240.3921.3983.5524.67
Song-kel94.22113.78252.44291.1119.56138.6638.67
Sor Khaki97.5NANA225.28NANANA
Tengiz74.6196.67234252.2822.06137.3318.28
Toktogul’skoye154.28NANA197.11NANANA
Tudakol144.56NANA167.89NANANA
Ul’ken-karoy72.28131.06224.94244.8958.7893.8819.95
Ulungur108.28131.33230.94252.5623.0699.6121.62
Uyaly113.39148.44208.72232.17355.0660.2823.45
Xiaoxihaiz Shuiku139.5NANA195.56NANANA
Zaysan97.89116.56241.17255.2218.67124.6114.05
Zhalauly82.83118.17218.56245.0635.33100.3926.5

References

  1. Vaughan, D.; Stocker, T.; Qin, D.; Plattner, G.; Tignor, M.; Allen, S.; Boschung, J.; Nauels, A.; Xia, Y.; Bex, V.; et al. Climate Change: The Physical Science Basis. Contribution of Working Group I to the Fifth Assessment Report of the Intergovernmental Panel on Climate Change; Cambridge University Press: Cambridge, UK, 2013. [Google Scholar]
  2. Guo, Z.M.; Miao, Q.L.; Xiong, L.I. Variation Characteristics of Temperature over Northern China in Recent 50 Years. Sci. Geogr. Sin. 2005, 25, 448. [Google Scholar]
  3. Masson-Delmotte, V.; Zhai, P.; Pirani, A.; Connors, S.L.; Péan, C.; Berger, S.; Caud, N.; Chen, Y.; Goldfarb, L.; Gomis, M.; et al. Climate Change 2021: The Physical Science Basis. Contribution of Working Group I to the Sixth Assessment Report of the Intergovernmental Panel on Climate Change; Cambridge University Press: Cambridge, UK, 2021; p. 2. [Google Scholar]
  4. Ma, R.; Duan, H.; Hu, C.; Feng, X.; Li, A.; Ju, W.; Jiang, J.; Yang, G. A half-century of changes in China’s lakes: Global warming or human influence? Geophys. Res. Lett. 2010, 37. [Google Scholar] [CrossRef]
  5. Wang, J.; Song, C.; Reager, J.T.; Yao, F.; Famiglietti, J.S.; Sheng, Y.; MacDonald, G.M.; Brun, F.; Schmied, H.M.; Marston, R.A.; et al. Recent global decline in endorheic basin water storages. Nat. Geosci. 2018, 11, 926–932. [Google Scholar] [CrossRef] [PubMed] [Green Version]
  6. Bai, J.; Chen, X.; Li, J.; Yang, L.; Fang, H. Changes in the area of inland lakes in arid regions of central Asia during the past 30 years. Environ. Monit. Assess. 2011, 178, 247–256. [Google Scholar] [CrossRef]
  7. Che, X.; Feng, M.; Sun, Q.; Sexton, J.O.; Channan, S.; Liu, J. The Decrease in Lake Numbers and Areas in Central Asia Investigated Using a Landsat-Derived Water Dataset. Remote Sens. 2021, 13, 1032. [Google Scholar] [CrossRef]
  8. Liu, H.; Chen, Y.; Ye, Z.; Li, Y.; Zhang, Q. Recent lake area changes in Central Asia. Sci. Rep. 2019, 9, 1–11. [Google Scholar]
  9. Kropáček, J.; Maussion, F.; Chen, F.; Hoerz, S.; Hochschild, V. Analysis of ice phenology of lakes on the Tibetan Plateau from MODIS data. Cryosphere 2013, 7, 287–301. [Google Scholar] [CrossRef] [Green Version]
  10. Wei, Q.; Yao, X.; Zhang, H.; Duan, H.; Jin, H.; Chen, J.; Cao, J. Analysis of the Variability and Influencing Factors of Ice Thickness during the Ablation Period in Qinghai Lake Using the GPR Ice Monitoring System. Remote Sens. 2022, 14, 2437. [Google Scholar] [CrossRef]
  11. Zhang, Y.; Zhang, G.; Zhu, T. Seasonal cycles of lakes on the Tibetan Plateau detected by Sentinel-1 SAR data. Sci. Total. Environ. 2020, 703, 135563. [Google Scholar] [CrossRef] [PubMed]
  12. Surdu, C.M.; Duguay, C.R.; Fernández Prieto, D. Evidence of recent changes in the ice regime of lakes in the Canadian High Arctic from spaceborne satellite observations. Cryosphere 2016, 10, 941–960. [Google Scholar] [CrossRef] [Green Version]
  13. Murfitt, J.; Duguay, C.R. 50 years of lake ice research from active microwave remote sensing: Progress and prospects. Remote Sens. Environ. 2021, 264, 112616. [Google Scholar] [CrossRef]
  14. Cai, Y.; Ke, C.Q.; Duan, Z. Monitoring ice variations in Qinghai Lake from 1979 to 2016 using passive microwave remote sensing data. Sci. Total. Environ. 2017, 607, 120–131. [Google Scholar] [CrossRef]
  15. Sharma, S.; Blagrave, K.; Magnuson, J.J.; O’Reilly, C.M.; Oliver, S.; Batt, R.D.; Magee, M.R.; Straile, D.; Weyhenmeyer, G.A.; Winslow, L.; et al. Widespread loss of lake ice around the Northern Hemisphere in a warming world. Nat. Clim. Change 2019, 9, 227–231. [Google Scholar] [CrossRef]
  16. Hampton, S.E.; Galloway, A.W.; Powers, S.M.; Ozersky, T.; Woo, K.H.; Batt, R.D.; Labou, S.G.; O’Reilly, C.M.; Sharma, S.; Lottig, N.R.; et al. Ecology under lake ice. Ecol. Lett. 2017, 20, 98–111. [Google Scholar] [CrossRef] [PubMed]
  17. Woolway, R.; Merchant, C. Worldwide alteration of lake mixing regimes in response to climate change. Nat. Geosci. 2019, 12, 271–276. [Google Scholar] [CrossRef] [Green Version]
  18. Weyhenmeyer, G.A.; Livingstone, D.M.; Meili, M.; Jensen, O.; Benson, B.; Magnuson, J.J. Large geographical differences in the sensitivity of ice-covered lakes and rivers in the Northern Hemisphere to temperature changes. Glob. Change Biol. 2011, 17, 268–275. [Google Scholar] [CrossRef]
  19. Cai, Y.; Ke, C.Q.; Yao, G.; Shen, X. MODIS-observed variations of lake ice phenology in Xinjiang, China. Clim. Change 2020, 158, 575–592. [Google Scholar] [CrossRef]
  20. Brown, L.; Duguay, C. Modelling lake ice phenology with an examination of satellite-detected subgrid cell variability. Adv. Meteorol. 2012, 2012, 529064. [Google Scholar] [CrossRef] [Green Version]
  21. Zhang, S.; Pavelsky, T.M. Remote sensing of lake ice phenology across a range of lakes sizes, ME, USA. Remote Sens. 2019, 11, 1718. [Google Scholar] [CrossRef] [Green Version]
  22. Wu, Y.; Duguay, C.R.; Xu, L. Assessment of machine learning classifiers for global lake ice cover mapping from MODIS TOA reflectance data. Remote Sens. Environ. 2021, 253, 112206. [Google Scholar] [CrossRef]
  23. Wu, Q. geemap: A Python package for interactive mapping with Google Earth Engine. J. Open Source Softw. 2020, 5, 2305. [Google Scholar] [CrossRef]
  24. Boqiang, Q. A Preliminary Investigation of Lake Evolution in 20-century in Inland Mainland Asia with Relation to the Global Warming. J. Lake Sci. 1999, 11, 11–19. [Google Scholar] [CrossRef]
  25. Wan, Z.; Dozier, J. A generalized split-window algorithm for retrieving land-surface temperature from space. IEEE Trans. Geosci. Remote Sens. 1996, 34, 892–905. [Google Scholar]
  26. Messager, M.L.; Lehner, B.; Grill, G.; Nedeva, I.; Schmitt, O. Estimating the volume and age of water stored in global lakes using a geo-statistical approach. Nat. Commun. 2016, 7, 1–11. [Google Scholar] [CrossRef]
  27. Magnuson, J.J.; Robertson, D.M.; Benson, B.J.; Wynne, R.H.; Livingstone, D.M.; Arai, T.; Assel, R.A.; Barry, R.G.; Card, V.; Kuusisto, E.; et al. Historical trends in lake and river ice cover in the Northern Hemisphere. Science 2000, 289, 1743–1746. [Google Scholar] [CrossRef] [Green Version]
  28. Latifovic, R.; Pouliot, D. Analysis of climate change impacts on lake ice phenology in Canada using the historical satellite data record. Remote Sens. Environ. 2007, 106, 492–507. [Google Scholar] [CrossRef]
  29. Zhang, X.; Wang, K.; Kirillin, G. An Automatic Method to Detect Lake Ice Phenology Using MODIS Daily Temperature Imagery. Remote Sens. 2021, 13, 2711. [Google Scholar] [CrossRef]
  30. Guo, L.; Wu, Y.; Zheng, H.; Zhang, B.; Li, J.; Zhang, F.; Shen, Q. Uncertainty and variation of remotely sensed lake ice phenology across the Tibetan Plateau. Remote Sens. 2018, 10, 1534. [Google Scholar] [CrossRef] [Green Version]
  31. Yao, X.; Li, L.; Zhao, J.; Sun, M.; Li, J.; Gong, P.; An, L. Spatial-temporal variations of lake ice phenology in the Hoh Xil region from 2000 to 2011. J. Geogr. Sci. 2016, 26, 70–82. [Google Scholar] [CrossRef]
  32. Benson, B.J.; Magnuson, J.J.; Jensen, O.P.; Card, V.M.; Hodgkins, G.; Korhonen, J.; Livingstone, D.M.; Stewart, K.M.; Weyhenmeyer, G.A.; Granin, N.G. Extreme events, trends, and variability in Northern Hemisphere lake-ice phenology (1855–2005). Clim. Change 2012, 112, 299–323. [Google Scholar] [CrossRef]
  33. Xiong, C.; Lei, Y.; Qiu, Y. Contrasting Lake Ice Phenology Changes in the Qinghai–Tibet Plateau Revealed by Remote Sensing. IEEE Geosci. Remote Sens. Lett. 2020, 18, 2132–2136. [Google Scholar] [CrossRef]
  34. Kirillin, G.; Leppäranta, M.; Terzhevik, A.; Granin, N.; Bernhardt, J.; Engelhardt, C.; Efremova, T.; Golosov, S.; Palshin, N.; Sherstyankin, P.; et al. Physics of seasonally ice-covered lakes: A review. Aquat. Sci. 2012, 74, 659–682. [Google Scholar] [CrossRef]
  35. Bartosiewicz, M.; Ptak, M.; Woolway, R.I.; Sojka, M. On thinning ice: Effects of atmospheric warming, changes in wind speed and rainfall on ice conditions in temperate lakes (Northern Poland). J. Hydrol. 2021, 597, 125724. [Google Scholar] [CrossRef]
  36. Rooney, G.G.; Van Lipzig, N.; Thiery, W. Estimating the effect of rainfall on the surface temperature of a tropical lake. Hydrol. Earth Syst. Sci. 2018, 22, 6357–6369. [Google Scholar] [CrossRef] [Green Version]
  37. Qu, B.; Kang, S.; Chen, F.; Zhang, Y.; Zhang, G. Lake ice and its effect factors in the Nam Co Basin, Tibetan Plateau. Adv. Clim. Change Res. 2012, 8, 327–333. [Google Scholar]
  38. Palecki, M.; Barry, R. Freeze-up and breakup of lakes as an index of temperature changes during the transition seasons: A case study for Finland. J. Appl. Meteorol. Climatol. 1986, 25, 893–902. [Google Scholar] [CrossRef]
  39. Kouraev, A.V.; Semovski, S.V.; Shimaraev, M.N.; Mognard, N.M.; Legrésy, B.; Rémy, F. The ice regime of Lake Baikal from historical and satellite data: Relationship to air temperature, dynamical, and other factors. Limnol. Oceanogr. 2007, 52, 1268–1286. [Google Scholar] [CrossRef]
  40. Vavrus, S.J.; Wynne, R.H.; Foley, J.A. Measuring the sensitivity of southern Wisconsin lake ice to climate variations and lake depth using a numerical model. Limnol. Oceanogr. 1996, 41, 822–831. [Google Scholar] [CrossRef]
  41. Grant, L.; Vanderkelen, I.; Gudmundsson, L.; Tan, Z.; Perroud, M.; Stepanenko, V.M.; Debolskiy, A.V.; Droppers, B.; Janssen, A.B.; Woolway, R.I.; et al. Attribution of global lake systems change to anthropogenic forcing. Nat. Geosci. 2021, 14, 849–854. [Google Scholar] [CrossRef]
  42. Xie, C.; Wu, S.; Zhuang, Q.; Zhang, Z.; Hou, G.; Luo, G.; Hu, Z. Where Anthropogenic Activity Occurs, Anthropogenic Activity Dominates Vegetation Net Primary Productivity Change. Remote Sens. 2022, 14, 1092. [Google Scholar] [CrossRef]
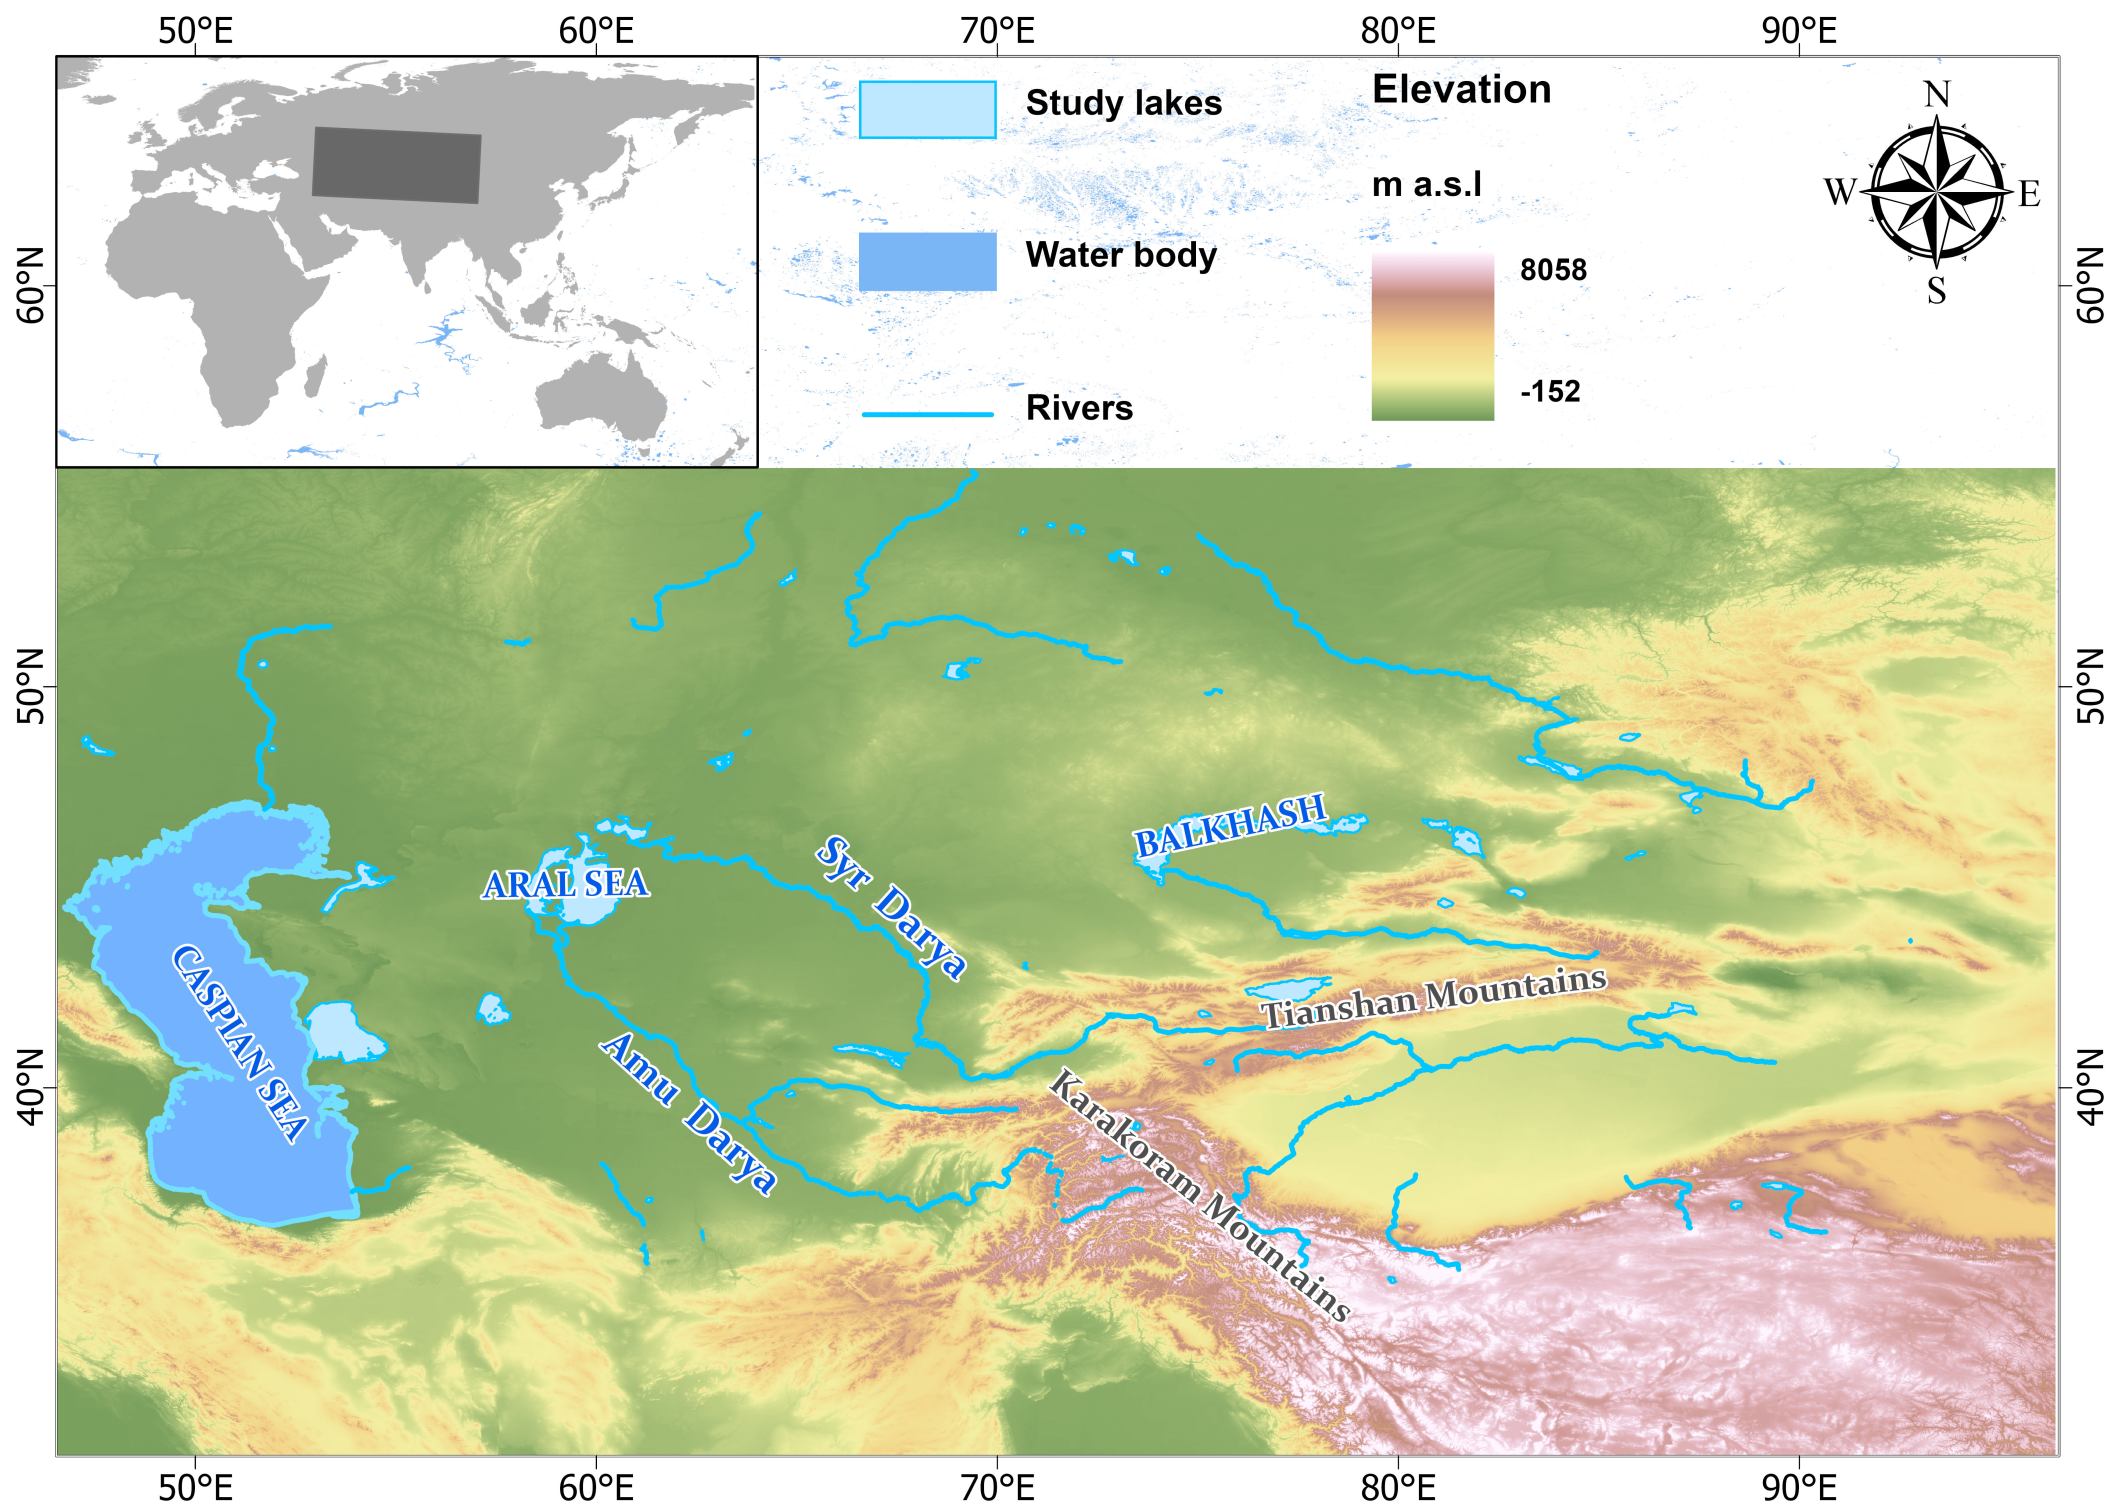
Figure 1. Locations of selected lakes in Central Asia.
Remotesensing 14 04992 g001
Figure 2. Time series of the water–ice fraction in the Large Aral Sea (a), Lake Balkhash (b), and Lake Zaysan (c) derived from the MODIS LST daily-combined image and AVHRR daily SST product from 2002 to 2020.
Remotesensing 14 04992 g002
Figure 3. Time series of the water–ice fraction in the Large Aral Sea (a), Lake Balkhash (b), and Lake Zaysan (c) derived from the MODIS LST daily-combined image and Landsat8 from 2013 to 2020.
Remotesensing 14 04992 g003
Figure 4. Trends of lake ice phenology variables, the sizes of the circle represent the absolute value in the change rate. The red color indicates a positive change rate and the blue indicates a negative change rate.
Remotesensing 14 04992 g004
Figure 5. Temporal change and trends of lake ice phenology variables from 2002 to 2020 of three elevation groups. (a) Freeze-up start day; (b) freeze-up end day; (c) breakup start day; and (d) breakup end day.
Remotesensing 14 04992 g005
Figure 6. Heat map of the Spearman rank correlation between lake ice phenology variables and influencing factors, (a) describes the correlation between lake ice variables and climatic factors; (b,c) describe the correlation between lake ice variables and local factors. The size of the circle represents the absolute value of the correlation coefficient. The red color represents a positive correlation and blue represents a negative correlation; *** represents the significance at a confidence level of 0.01, ** represents the significance at a confidence level of 0.05, * represents the significance at a confidence level of 0.1. Ta is the mean annual 2 m air temperature. Pre is the annual precipitation. Ti is the mean temperature of the period from December to May from the MOD11A1 product. Ws is the annual mean wind speed. Sr is the mean downward surface shortwave radiation. The avg_depth is the average depth of the lake. Shore_len is the shore length of the lake.
Remotesensing 14 04992 g006
Table 1. The R 2 and RMSE for the comparison between the MODIS daily LST combined image, AVHRR and Landsat8.
MODIS vs. AVHRRMODIS vs. Landsat8
Large Aral
Sea
Lake
Balkhash
Lake
Zaysan
Large Aral
Sea
Lake
Balkhash
Lake
Zaysan
R 2 0.800.810.710.770.790.68
RMSE0.170.190.230.180.190.25
Table 2. Lake ice phenology characteristics in Central Asia.
Lake TypeFUS (doy)FUE (doy)BUS (doy)BUE (doy)
Not completely
frozen in winter
137.02NANA180.32
Completely
frozen in winter
94.95125.26227.35252.20
NA means no data, notice that 8 August is referred to day 1 of the hydrological year.
Table 3. Phenology variable change and trend.
GroupFUSFUEBUSBUEElevation (m)
Mean DoyTrend (Day/Year)Mean DoyTrend (Day/Year)Mean DoyTrend (Day/Year)Mean DoyTrend (Day/Year)
187.560.13113.671.04 **254.090.55284.740.67 **3925
2125.220.08135.080.71 **220.32−0.65 **231.200.151535
3108.14−0.35137.950.40210.86−0.82 **217.60−0.31207
** represents the statistical significance at the 0.05 level.
Table 4. Lake ice process duration change and trend.
GroupFUDICDBUD
Mean DurationTrend (Day/Year)Mean DurationTrend (Day/Year)Mean DurationTrend (Day/Year)
126.740.84 **140.42−0.4931.340.05
223.46−0.02109.42−0.71 *21.570.08
332.900.0289.18−0.4124.710.31
** represents the statistical significance at the 0.05 level and * represents the statistical significance at the 0.1 level.
Publisher’s Note: MDPI stays neutral with regard to jurisdictional claims in published maps and institutional affiliations.