Article

Evaluation and Assimilation of FY-3C/D MWHS-2 Radiances in the RMAPS-ST

1
Institute of Urban Meteorology, China Meteorological Administration, Beijing 100089, China
2
Key Laboratory for Meteorological Disaster Monitoring and Early Warning and Risk Management of Characteristic Agriculture in Arid Regions, China Meteorological Administration, Yinchuan 750002, China
3
State Key Laboratory of Remote Sensing Science, Institute of Remote Sensing and Digital Earth, Chinese Academy of Sciences, Beijing 100101, China
4
Key Laboratory of Radiometric Calibration and Validation for Environmental Satellite, FengYun Meteorological Satellite Innovation Center (FY-MSIC), National Satellite Meteorological Center, China Meteorological Administration, Beijing 100081, China
*
Author to whom correspondence should be addressed.
Remote Sens. 2022, 14(2), 275; https://doi.org/10.3390/rs14020275
Submission received: 2 December 2021 / Revised: 31 December 2021 / Accepted: 4 January 2022 / Published: 7 January 2022

Abstract

:
Currently, humidity information can be obtained from the Microwave Humidity Sounder-2 (MWHS-2) mounted on the polar-orbiting satellites FY-3C and FY-3D. However, making full use of the MWHS-2 data remains a challenge, particularly in the application of regional numerical weather models. This study is the first to include MWHS-2 radiance data in the Rapid-refresh Multi-scale Analysis and Prediction System—Short-term (RMAPS-ST) regional model. The results and impact of MWHS-2 radiance data assimilation were investigated and evaluated. It is found that MWHS-2 radiance data can be effectively assimilated in the RMAPS-ST after a series of quality control and variational bias correction. Benefits could be obtained in the reduction of background departures for each humidity sounding channel. Assimilation experiments over a period of one month were carried out, and the impacts of MWHS-2 radiances were quantitatively analyzed on the forecasts of RMAPS-ST system. The results showed that MWHS-2 saw a small but significant improvement for low-level humidity of short-range forecast, by 16.5% and 3.2% in terms of mean bias and root-mean-square error, respectively. The positive impact on short-range forecast also can be found for middle and low level temperature and wind. For quantitative precipitation forecast, the assimilation of MWHS-2 radiances increased the score skills of different rainfall levels in the first 12 h forecast by an average of 1.4%. There was a slight overall improvement in the 24-h precipitation forecast for over-estimation and false alarm of 3-h accumulated rainfall below 1.0 mm, with 0.75% and 0.36%, respectively. The addition of MWHS-2 radiance data gives a small positive impact on low-level humidity, temperature, and wind in the RMAPS-ST regional model, and it also improves short-range forecast of rainfall, particularly in the first 12 h of the forecast.

1. Introduction

Water vapor acts as a key parameter for atmospheric processes. It is an important variable in the numerical weather prediction (NWP) model. The accuracy of initial atmospheric humidity is a major problem since it varies greatly and changes rapidly in space and time [1]. The adjustment made to the initial humidity fields could be retained out to a long time in the forecast model, accompanied by significant large scale changes in synoptic structures of the atmosphere [2]. Microwave humidity sounders from satellite can offer indirect measurements of atmospheric humidity which contained more significant information on the vertical distribution of humidity. However, it is still a major challenge to assimilate humidity information from satellites due to highly uncertain data quality and large biases between calculated and observed values, especially for observations over land and in regional numerical models.
Currently, a large volume of satellite observations is available at operational NWP centers and significantly contributes to the progress of forecast models. They have proven to be successful in improving the accuracy of short- and medium-range forecast [3]. Derber et al. indicated that moisture increments from the direct assimilation of satellite radiances mainly affected stratiform precipitation distributions, resulting in a considerable improvement in the forecast skill of the National Centre for Environmental Prediction (NCEP) in 1995 [4]. Bauer et al. presented that the assimilation of rain-affected satellite observations at the European Centre for Medium-Range Weather Forecasts (ECMWF) might produce a quite large impact on local systems [5]. Masahiro reported that assimilation of satellite radiances in Japan Meteorological Agency (JMA)’s operational mesoscale NWP system brought great improvements for tropospheric geopotential height analysis and short-range precipitation forecasts [6]. Joo et al. developed the method of the adjoint-based forecast sensitivity to observations (FSO) at Met Office operational NWP system to evaluate the contribution of observations in reducing 24-h forecast errors [7], satellite data were found to account for 64% of the short-range global forecast error reduction. In 2008, the direct assimilation of real satellite radiance data was implemented in the China Meteorological Administration (CMA)’s numerical prediction system—Global/Regional Assimilation and Prediction System (GRAPES) [8], the impacts of satellite observations in GRAPES were also evaluated, and the results showed that good analysis information both in the upper troposphere and lower stratosphere could be obtained with satellite measurements.
The majority of satellite radiance data are mainly from instruments operating in microwave and infrared spectrum. Due to being less affected by the presence of clouds than infrared data, microwave radiances can provide important information in areas not sensed by other nadir sounding instruments [9]. Lawrence et al. [10] pointed out that microwave radiances sensitive to atmospheric temperature and humidity successfully reduced error of initial conditions for the forecast models. The direct assimilation of microwave radiance data can give a certain impact on the background filed, such as the temperature, humidity, and flow fields, consequently further improved the quantitative prediction of heavy rainfall [11,12,13]. Even for the forecasting of hurricanes, microwave radiances from polar satellites can also provide unique information on the large scale atmospheric conditions which is crucial and helpful in reducing the time and location errors of a hurricane’s track [14]. Derber et al. indicated that the direct use of the cloud-cleared microwave radiances gave a considerable improvement in the forecast skill compared to the previously operational use of satellite data, especially in the Southern Hemisphere [4]. Geer et al. showed that all-sky data assimilation from microwave humidity sounders, sensitive mainly to the lower troposphere, could better improve mid-latitude humidity and wind fields in the analysis and in shorter-range forecasts [15]. On the one hand, microwave radiance data in particular from the Advanced Microwave Sounding Unit (AMSU) has been established as one of the leading satellite observations contributing to today’s forecasting skill [16]. On the other hand, advancement in understanding the scattering effect of hydrometeors and advances in measurements from satellite microwave instruments are providing new opportunities for improving the accuracy of forecast models continuously.
Since the NOAA’s Polar-Orbiting Environmental Satellites series started in 1998, the first generation of microwave humidity sounders onboard NOAA-15–17, Advanced Microwave Sounding Unit-B (AMSU-B), began to profile the moisture structure of the atmosphere with the 183 GHz water vapor absorption line [17]. In NOAA-18 and 19, the Microwave Humidity Sounder (MHS) replaced the AMSU-B with a slight modification. The MHS is also mounted on the METOP which is the European polar-orbiting satellite series, including METOP-A, B and C [18,19]. For the new generation of operational meteorological polar orbiting satellites of the USA, such as the Suomi National Polar-orbiting Partnership (NPP) satellite and NOAA-20, the Advanced Technology Microwave Sounder (ATMS) replaced its predecessor AMSU-A and MHS, it combined them into a single instrument which profiled both atmospheric temperature and humidity fields [9,20]. In the Feng-Yun (FY) series of Chinese polar-orbiting satellites, FY-3C and FY-3D are the latest operational meteorological satellites launched respectively in 2013 and 2017 [21]. The Microwave Humidity Sounder of second generation (MWHS-2) mounted on the FY-3C and FY-3D is a cross-track radiometer with 8 channels at 118 GHz oxygen band and 5 channels at 183 GHz water vapor band [22], which is similar although not identical to the capability of MHS or ATMS.
A number of studies have been carried out to investigate the performance of MWHS-2 observations and their impact in different operational NWP systems. Lu et al. indicated that MWHS-2 instrument onboard FY-3C overall exhibited good data quality which could be comparable to other instruments with similar capabilities for the 183 GHz channels [23]. Lawrence et al. also assessed the data quality of MWHS-2 from FY-3C, and concluded that assimilating the data of the 118 GHz and 183 GHz channels could bring some improvements in the accuracy of 12-h short-range forecast and 2–4-day wind forecast in the ECMWF’s system [10]. Carminati et al. investigated all-sky radiance data assimilation of the Microwave Temperature Sounder 2 (MWTS-2) and the MWHS-2 from FY-3C and FY-3D satellites in the Met Office global numerical weather prediction system, the result showed a small but significant improvement for the short-range forecasts [24]. Lindskog et al. suggested that the new introduction of MWHS-2 from FY-3C/3D filled the lack of passive microwave radiance data over the northern European domain during midnight and early morning [25], leading to a positive impact on forecast quality.
In this paper, we mainly aim to further explore the use of new MWHS-2 instrument on-board the FY-3C and FY-3D satellites in the regional RMAPS-ST system. Firstly, one-month retrospective runs throughout 1 July 2019–31 July 2019, with and without MWHS-2 radiance data assimilation, were conducted. Secondly, the performance of MWHS-2 humidity sounding channels was investigated based on the assimilation system of RMAPS-ST. Finally, the impact of MWHS-2 radiance data assimilation on forecasts was compared and evaluated against observations. In the following, Section 2 introduces the RMAPS-ST system, satellite radiance data of MWHS-2, assimilation trials, and verification strategy against observations. Section 3 gives the results and the corresponding analysis, followed by a discussion of results in Section 4. Conclusions are presented in Section 5 together with a future outlook.

2. Materials and Methods

2.1. RMAPS-ST System

RMAPS-ST is short for the Rapid-refresh Multi-scale Analysis and Prediction System—Short-term, which is a km-scale regional NWP system developed based on the Weather Research and Forecasting model (WRF) and WRF data assimilation (WRFDA) [26,27,28]. The latest RMAPS-ST has been updated with the version 4.1.2 of WRF. The system of RMAPS-ST focuses on short-range forecast over North China, serving mainly the meteorological decision-making in Beijing area. It has two nested domains, as shown in Figure 1. The outside domain, which covers the entire China region, has 649 × 500 grid points with a resolution of 9 km. It has also more complex terrain features especially in the western, which directly influence its synoptic features. The inner domain locates in North China, with a resolution of 3 km and 550 × 424 grid points. In particular, near real-time green vegetation fraction (GVF) and soil moisture are used in the inner domain [29,30]. Latest land use with finer classification is also employed in the 3-km domain.
There are 51 sigma vertical levels in the RMAPS-ST system. The top pressure of the model has been updated to 10 hPa. A set of physics parameterizations is configured for both domains of the system, including Thompson double moment microphysics, radiation schemes of RRTMG, Kain-Fritsch deep convection, and the scheme of ACM2 PBL. The boundary and initial conditions of the RMAPS-ST system are taken from ECMWF forecast products with the resolution of 0.25°. One important aspect of the RMAPS-ST system is its multi-source data assimilation and analysis. Various observation data preprocessed have been successfully used in the system, including conventional grounded-based synoptic (SYNOP) and sounding data, radiosonde observations (RAOB), aircraft meteorological data relay (AMDAR), pilot balloon system (PILOT), global positioning system derived zenith total delay (GPSZTD), meteorological terminal aviation routine weather report (METAR), ship-based (SHIP) and oceanographic buoys (BUOY) observations, and radar data. Radar data mainly includes radial velocity and reflectivity, which has been used in both 9-km and 3-km domains. Rapidly refreshing is another import aspect of the system. All kinds of these rich observations are assimilated into the system in 3-h cycling runs to provide optimal analysis.

2.2. MWHS-2

The MWHS-2 instrument is the microwave humidity sounder of the second generation flown on-board the FY-3C and FY-3D which are China’s latest operational meteorological polar-orbiting satellites. Except for its additional bands at 118 GHz, it is similar to the MHS and the ATMS humidity-sounding channels. It has 98 FOVs and a wider swath of 2660 km. The MWHS-2 has a total of 15 channels which provide radiometric information around the 118 GHz oxygen band, the 183 GHz water vapor band, and the atmospheric windows at 89 GHz and 150 GHz. Table 1 lists the frequency, weight function peaking, and horizontal resolution of each channel.
The 183 GHz channels (channels 11–15) of MWHS-2 mainly provide information on atmospheric humidity at different heights. They have a resolution of 16 km at nadir and they are also sensitive to cloud and precipitation. The 118 GHz channels (channels 2–9) are primarily sensitive to atmospheric temperature, with a horizontal resolution of 29 km at nadir. Compared to the microwave temperature sounding channels around 50–57 GHz of the AMSU-A and ATMS instruments, the 118 GHz channels are more sensitive to scattering from cloud and precipitation due to their higher frequency [10]. This information may be useful in the all-shy data assimilation, which provides new opportunity and challenge to include such data into NWP models. The window channels at 89 GHz (channel 1) and 150 GHz (channel 10) are surface-sensitive and commonly used for quality control.

2.3. Assimilation Trials

2.3.1. Experiment Design

To evaluate the impact of assimilating MWHS-2 radiances from the satellites of FY-3C and FY-3D in the regional NWP system of RMAPS-ST, two groups of parallel data assimilation and forecast experiment were carried out. In the first group (CTRL), only conventional and radar observations were used over the 9-km domain in the data assimilation system to provide optimal analysis for the forecasts, as run operationally. In the second group (MWHS-2), radiances data from MWHS-2 instruments were also included additionally to produce an improved analysis and subsequent forecasts.
Data assimilation and forecast experiments were performed in 3 h-cycling run for a period of one month, from 1 July 2019 to 31 July 2019. During this period, forecasts up to a range of 24 h were started at 0000, 0300, 0600, 0900, 1200, 1500, 1800, and 2100 UTC. At 1800 UTC of the day before, a cold run of 6-h spin up would be first conducted to produce the initial input fields for the forecast started at 0000 UTC. All observations within the time window of ±1.5 h would be included in the system of data assimilation and the technique of 3D-Var was used.

2.3.2. Handling of Radiance Data

In our experiment of MWHS-2 radiance data assimilation, only clear-sky radiance data from the 183 GHz channels were selected to use in the system of data assimilation. Due to various errors, a series of quality control procedures are performed to remove radiance observations that are considered to be of poor quality. Firstly, surface type check is used to remove radiance observations with mixed surface types. Secondly, limb observations with the scan position below 8 or above 90 are also rejected. Thirdly, cloud liquid water path and scattering index are used to identify observations contaminated by cloud and precipitation. Cloud liquid water path can be derived from background of the model. Scattering index is given as the difference of brightness temperatures between the window channel at 89 GHz and 150 GHz. If the cloud liquid water path is above 0.2 kg/m2 or the scattering index is above 4 K, the corresponding observations will be discarded. Finally, the absolute departure is larger than 15 K or three times the error variance, observations will be eliminated. Additionally, due to the peak of weight function at 800 hPa, radiance observations from channel 15 will be removed if the surface pressure is less than 800 hPa. Since the error correlation in the horizontal direction is not considered in the error covariance of the model, a thinning of 60 km was also applied to all radiances to mitigate the effects of spatially correlated observation errors.
Figure 2 shows the spatial distribution of MWSH-2 channel 11 brightness temperatures before and after all quality control procedures. The first line is from satellite FY-3C at 0300 UTC on 20 July 2019, and the second line is from satellite FY-3D at 0600 UTC on the same day. It can be seen that 1333 observations out of total 3241 are retained at 0300 UTC and 2424 out of total 6121 retained at 0600 UTC. That is, about 1/3 of the total observations are remained for data assimilation after quality control. A polar-orbiting satellite typically passes over a specific region twice per day [31]. The satellites of FY-3C and FY-3D can provide relatively rich measurements over the 9-km domain for the RMAPS-ST system at about 0300, 0600, 1500, and 1800 UTC every day.
Biases are still inevitable in satellite radiance observations with calibration, including systematic errors relative to the assimilation system and air-mass dependent errors. These errors can vary depending on the scan position of satellite instrument, geographical parameters, time and air mass [32]. They are usually error sources in an assimilation system. Therefore, biases between the simulated radiances from the model first guess and those measured from satellite should be corrected. The scheme of variational bias correction (VarBC) developed by Dee and Deber et al. [4,33] was used in this study. The bias correction is accomplished through several predictors in the variational scheme, including the scan position, the layer thicknesses of 1000–300 hPa and 200–50 hPa, total column water vapor and surface skin temperature. The corresponding predictor coefficients can be adaptively updated and optimized based on statistical information in the cycling run. The variational scheme was first used to directly assimilate satellite radiances in most global models. For a regional model, due to non-uniform data coverage over a limited-area in time and space, the number of polar-orbiting satellite observations is highly variable from cycle to cycle. In this study, a preliminary spin-up run over a period of 15 days was carried out to obtain more statistically reliable predictor coefficients for bias correction of all MWHS-2 radiance data. These starting bias coefficients are also adjusted dynamically with cycling analysis in the next experiment of MWHS-2 radiance data assimilation.
Since the systematic errors in both the observations and the background are assumed to be unbiased according to the formulation of the 3D-Var method [4,34], the observation innovations (observation minus background, OMB) should follow a Gaussian error distribution after quality control and bias correction. Figure 3 gives the histograms of the brightness temperature innovations distribution with (red) and without bias correction (blue) for MWHS-2 channels 11 and 14 from FY-3C and FY-3D, respectively. In comparison to the innovations without bias correction, the histograms of the brightness temperature innovations with bias correction exhibit approximate Gaussian distributions and the mean values are closer to zero. The MWHS-2 observations are colder in channel 11 and warmer in channel 14 than the brightness temperatures calculated from the RMAPS-ST background prior to the bias correction. The results indicated that a good bias performance can be achieved through bias correction.

2.4. Verification

To evaluate the impact of MWHS-2 radiances data assimilation on short-range forecasts in the RMAPS-ST system, the forecasts initialized using analyses with and without MWHS-2 radiances are compared and verified against observations.
In this study, the observations used for verification are mainly from national ground automatic weather stations and sounding profiles, which are firstly processed through a series of quality control procedures [35,36]. More than 2000 ground-based stations can provide surface temperature at 2 m, humidity at 2 m, wind at 10 m and rainfall for each hour. For these two-dimension variables at a given time, the value in the forecast grid point will be matched to the nearest observation for comparison. Upper atmospheric temperature, humidity and wind profiles are from about 120 sounding observations which are available only at 0000 UTC, 0600 UTC, 1200 UTC, and 1800 UTC every day. For these three-dimension variables, the forecast value will be interpolated to the level of the observation if they cannot be paired directly at the same level in the vertical direction.
Categorical statistics based on a contingency table are used to evaluate quantitative rainfall forecasts, including the skills of critical success index (CSI), bias score (BIAS), and false alarm ration (FAR) [37,38]. Generally, a rainfall forecast can be separated “yes” or “no” with different thresholds. For example, “yes” means that the rainfall is greater than 50 mm, else it says “no”. The contingency table gives the joint distribution of dichotomous forecasts and observations. It contains four combinations, hits, misses, false alarms, and correct negatives.
The scores of CSI, BIAS, and FAR can be calculated from the elements in the contingency table to describe the performance of a rainfall forecast. The score value of CSI is between 0 and 1. If the CSI score equals 1, the rainfall forecast will be perfect. For BIAS, a score above 1.0 indicates an over-prediction and below 1.0 for an under-prediction. An unbiased rainfall forecast has the BIAS score of 1.0. The range of FAR score is also between 0 and 1. The FAR with the score of 0 suggests no false alarm for the forecast.
C S I = h i t s h i t s + f a l s e   a l a r m s + m i s s e s ,
B I A S = h i t s + f a l s e   a l a r m s h i t s + m i s s e s ,
F A R = f a l s e   a l a r m s h i t s + f a l s e   a l a r m s .
Additionally, mean error and root-mean-square error (RMSE) can be calculated from the differences between forecasts and observations. They are used to evaluate the forecast improvement of temperature, humidity and wind fields due to the assimilation of MWHS-2 radiance data.

3. Results

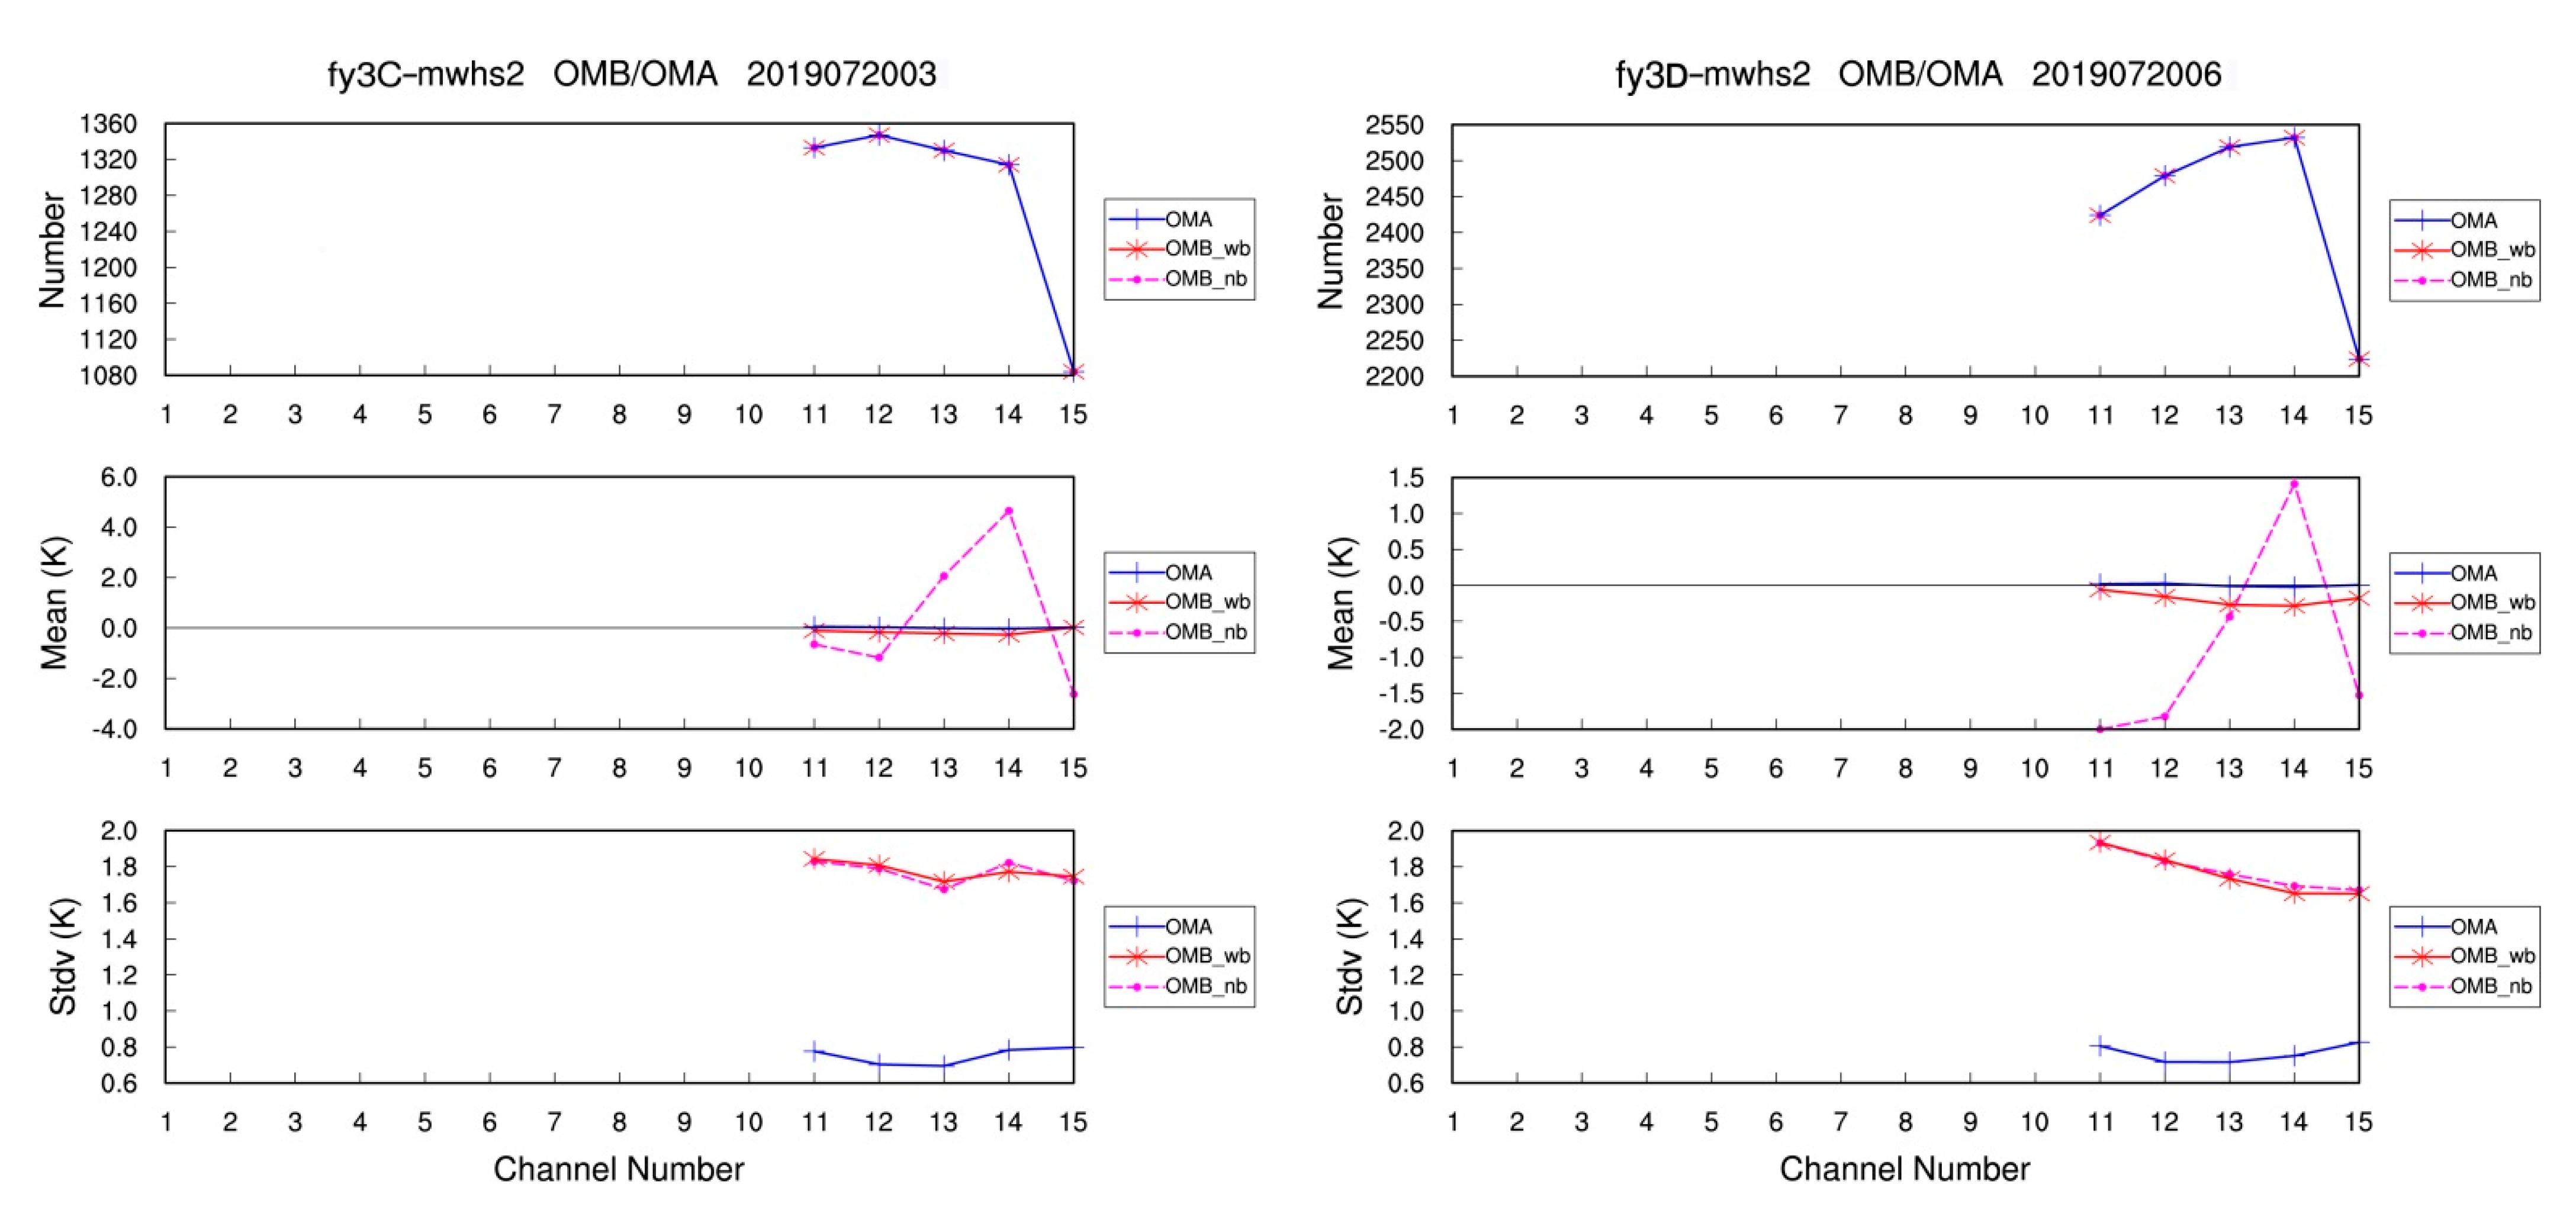
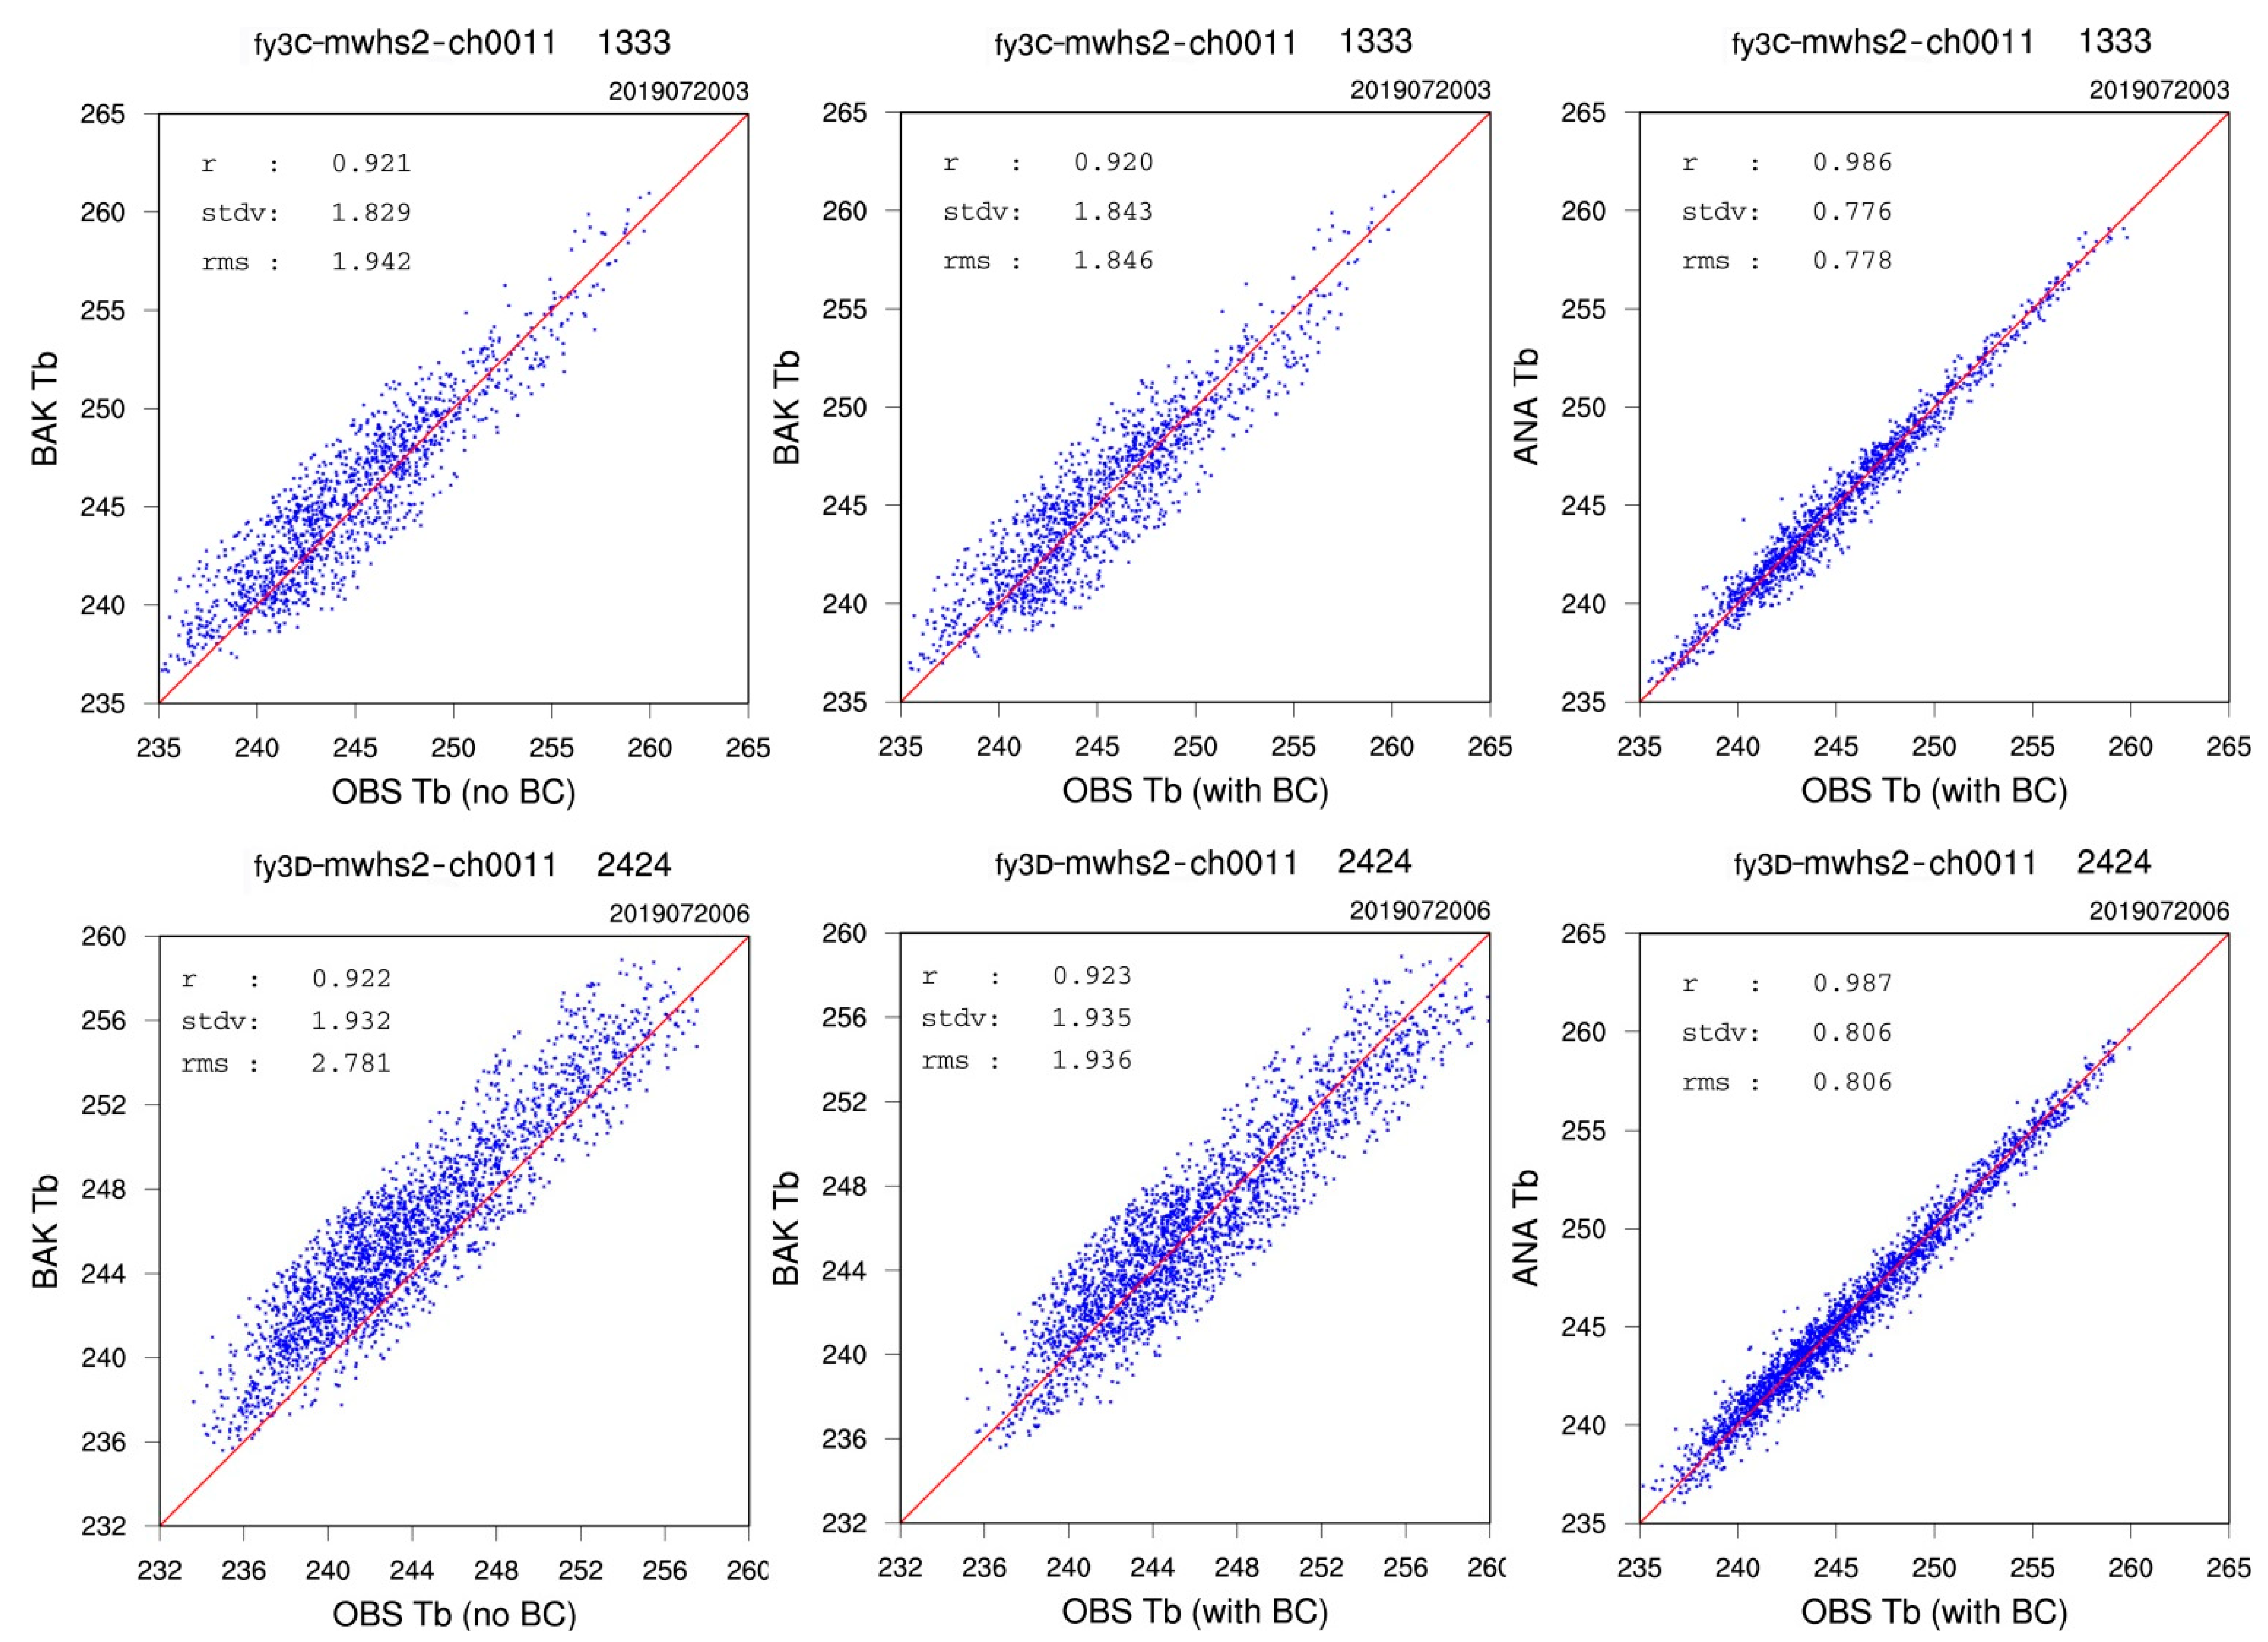
3.1. Departure Statistics

To verify the effectiveness of bias correction, the brightness temperatures calculated from the background are first investigated against observations of MWHS-2. Figure 4 gives the statistics of observation number, background departure and analysis departure for each channel of MWHS-2 on satellite FY-3C at 0300 UTC and FY-3D at 0600 UTC 20 July 2019, respectively. It shows that more than 1000 observations from FY-3C MWHS-2 humidity channels (channel 11–15) are used at 0300 UTC and more than 2200 observations from FY-3D at 0600 UTC in the data assimilation system. The mean bias of background departure without bias correction (OMB_nb) is between 0 K and −2 K for channels 11 and 12 of FY-3C MWHS-2, but a bit large for channels 13–15 with the absolute value above 2 K. The background departure with bias correction (OMB_wb) and the analysis departure are both closed to 0 K for each humidity channel. There is a little difference for the standard deviation of background departure with and without bias correction, but the standard deviations of all humidity channels have a relative large reduction for the analysis departure, less than 1 K. For channels of FY-3D MWHS-2 at 0600 UTC, the mean biases of the background departure without bias correction are between −2 K and 0 K, except for channel 14, which indicates warmer calculated brightness temperatures from the background than observations. The mean bias of channel 14 from FY-3D MWHS-2 is approximately 1.5 K, which is also less than the corresponding value from FY-3C. After bias correction, the mean biases of background departure and analysis departure are both reduced greatly for each channel of FY-3D MWHS-2. The corresponding standard deviation of each channel for FY-3D MWHS-2 is similar to that of FY-3C, with a small value below 1 K.
Figure 5 gives the scatter plots of the calculated brightness temperatures with and without bias correction against observations of MWHS-2 channel 11 on satellite FY-3C and FY-3D. The statistics are computed based on the number of 1333 observations at 0300 UTC and 2424 at 0600 UTC on July 20, 2019, respectively. It can be seen that there is a slight difference between the simulated brightness temperatures from the background with and without bias correction. After bias correction, the root-mean-square (rms) error has been reduced, especially for the channel 11 on FY-3D MWHS-2, from 2.781 K to 1.936 K. The correlation coefficients between the calculated brightness temperature and observations are high for FY-3C and FY-3D, which is greater than 0.92. The corresponding analysis has a much smaller error and a high correlation coefficient up to 0.98 for both FY-3C and FY-3D MWHS-2.
Figure 6 shows the varieties of the mean bias and the standard deviation over time from 0000 UTC on 1 July 2019 to 2300 UTC on 31 July 2019 for the background and the analysis departures in MWHS-2 channel 11. It shows that the mean bias of the background departures before bias correction is mostly between −1 K and 0 K for MWHS-2 channel 11 on the platform of FY-3C, and the value is around −2 K on FY-3D. That is, the calculated brightness temperatures from the background of RMAP-ST system are commonly warmer than the corresponding observations in MWHS-2 channel 11. After bias correction, the error can be effectively reduced in most cases, especially for the platform of FY-3D. The mean biases of the analysis departures are all around 0 K. The standard deviations of the background departures in MWHS-2 channel 11 are similar for both FY-3C and FY-3D, less than 2.3. For the corresponding analysis departures, the standard deviations are further reduced to the value around 0.8 K mostly. The statistics suggest that a good performance can be achieved for MWHS-2 observations used in the data assimilation of the RMAPS-ST system.

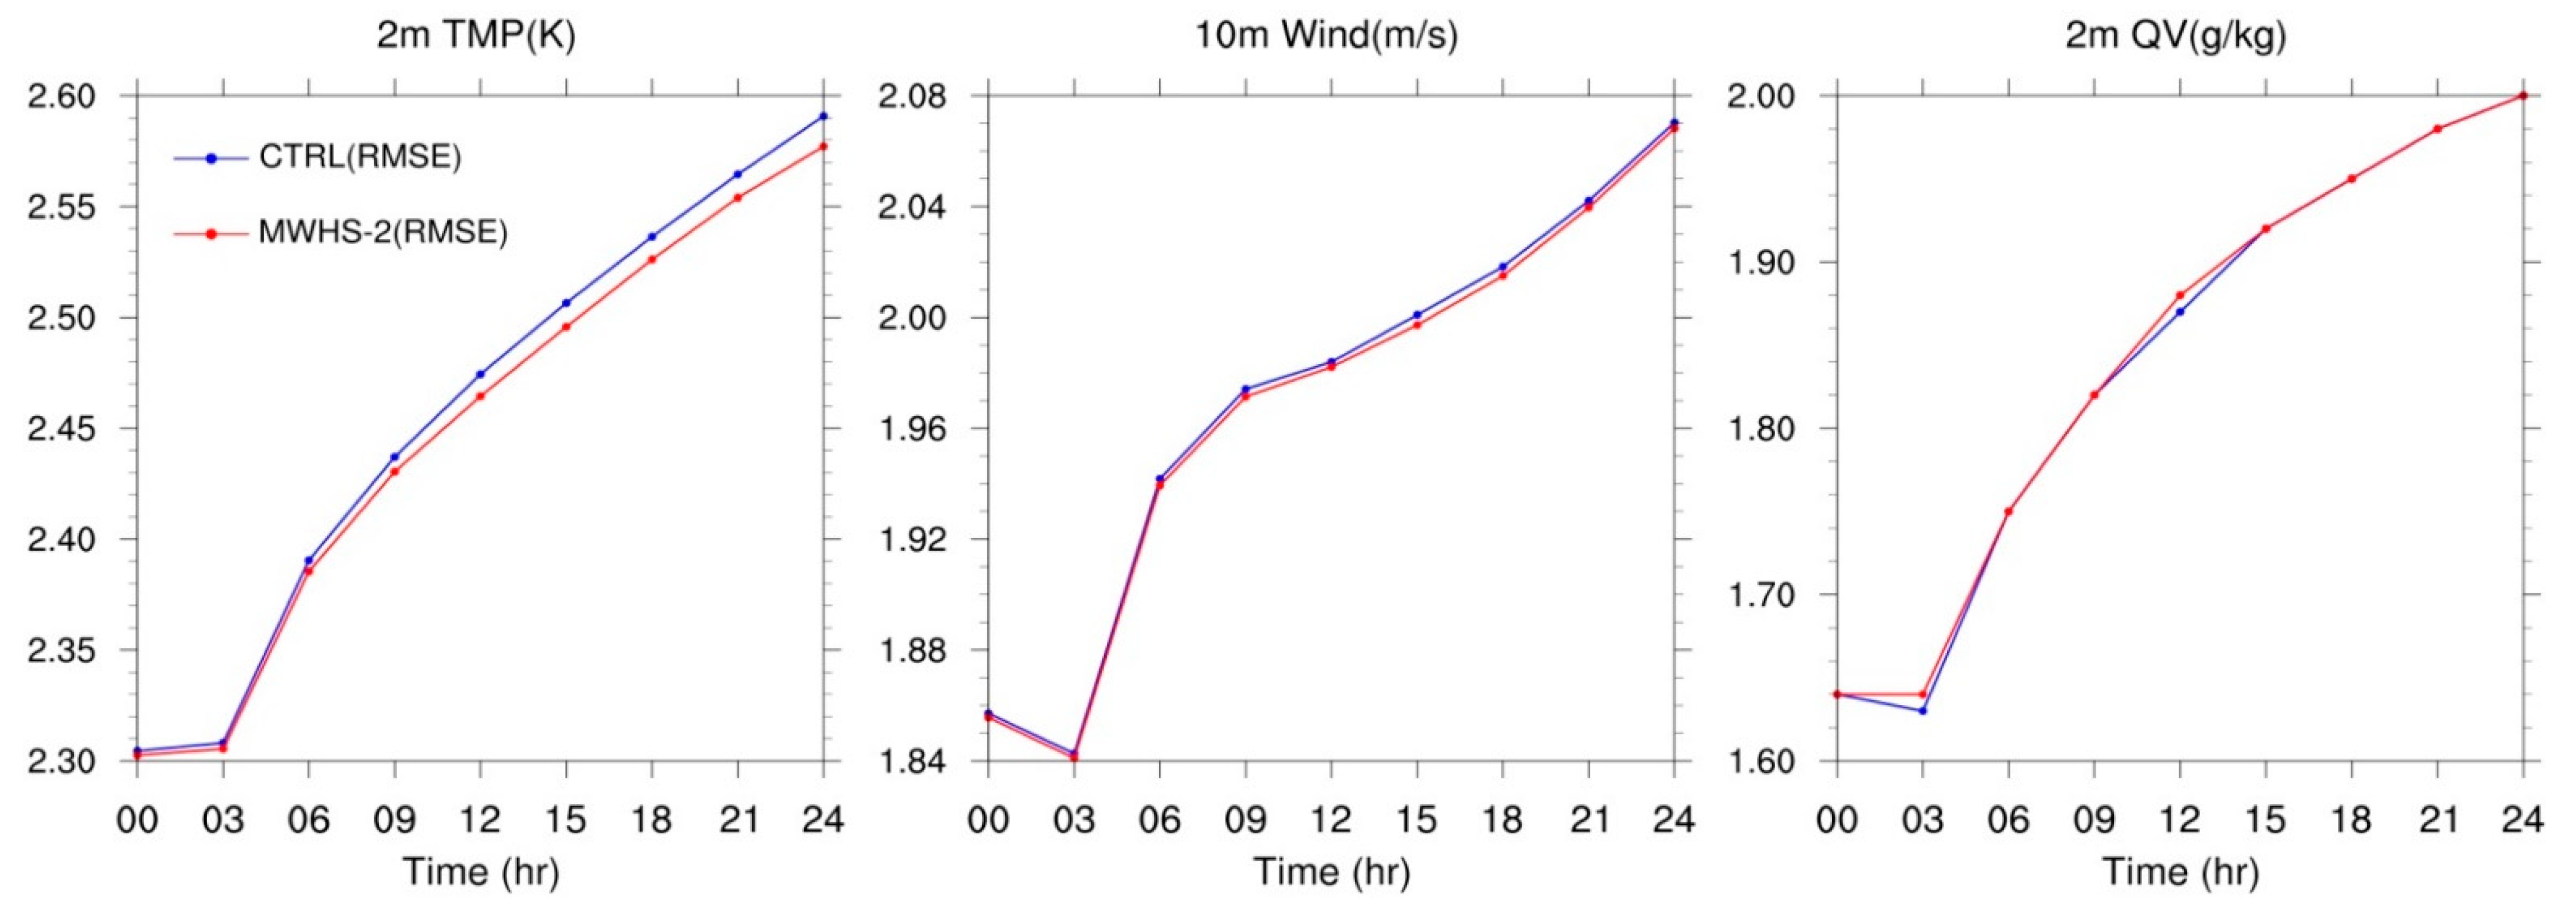
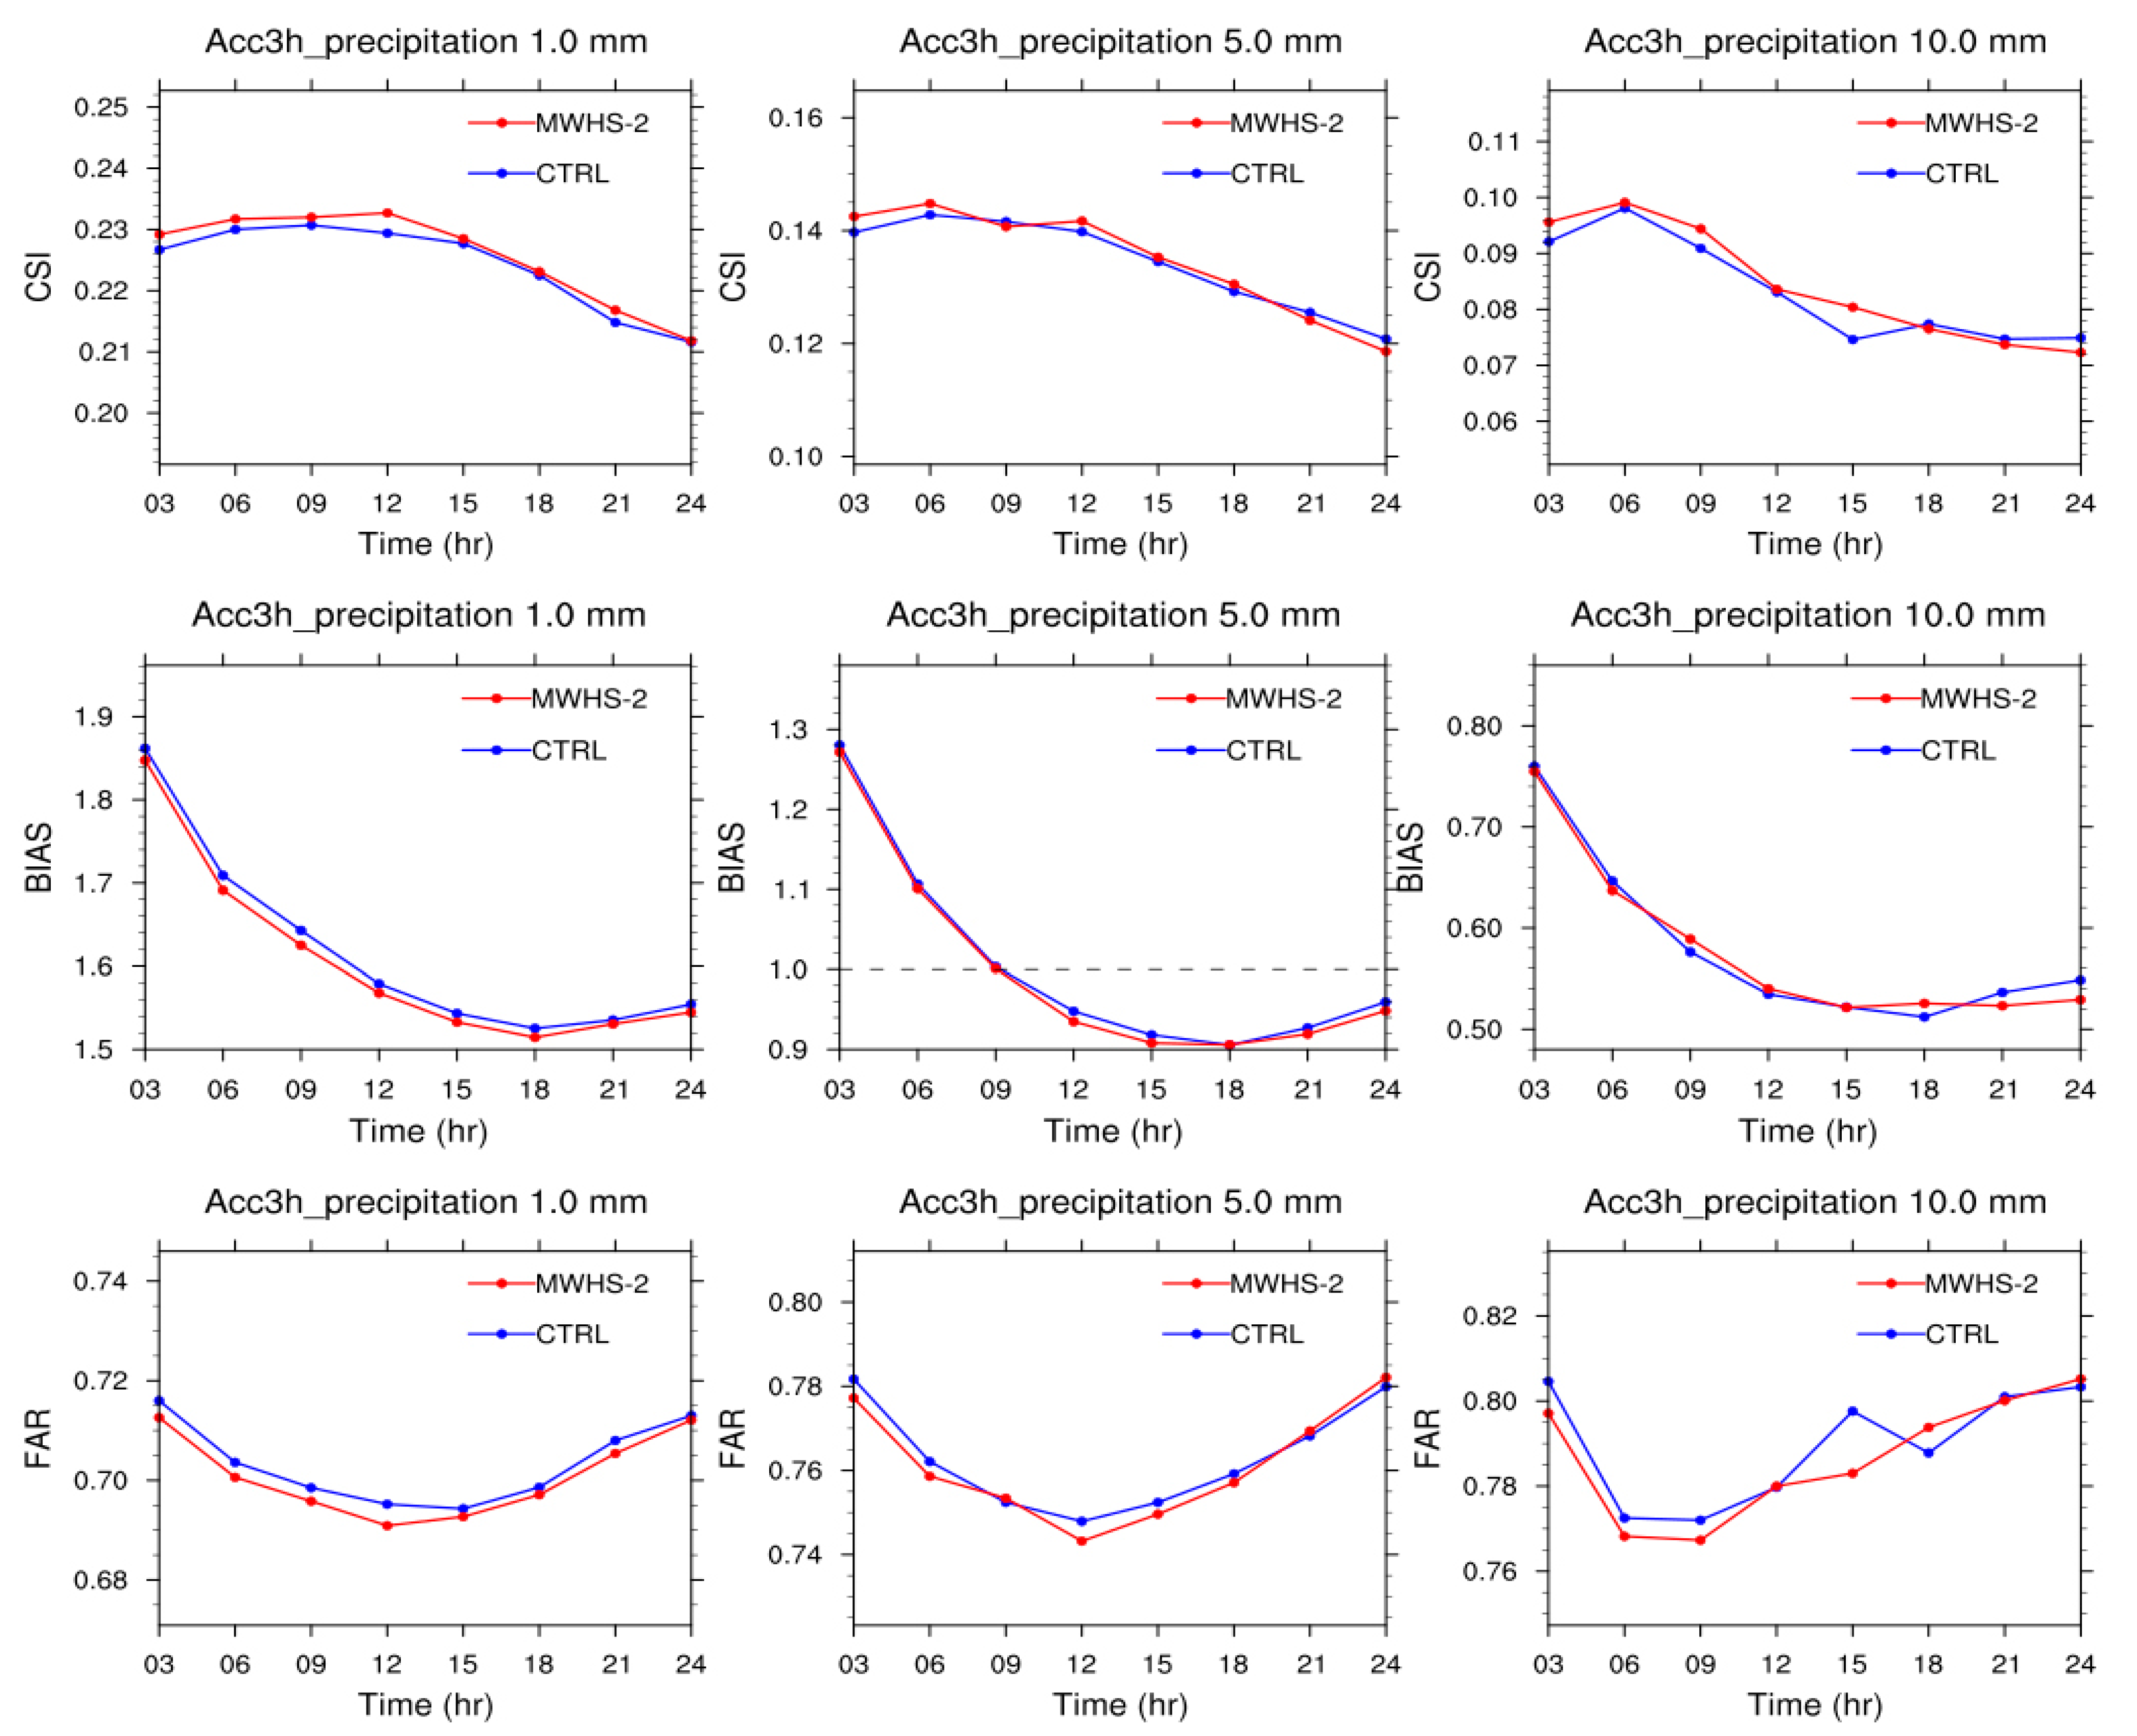
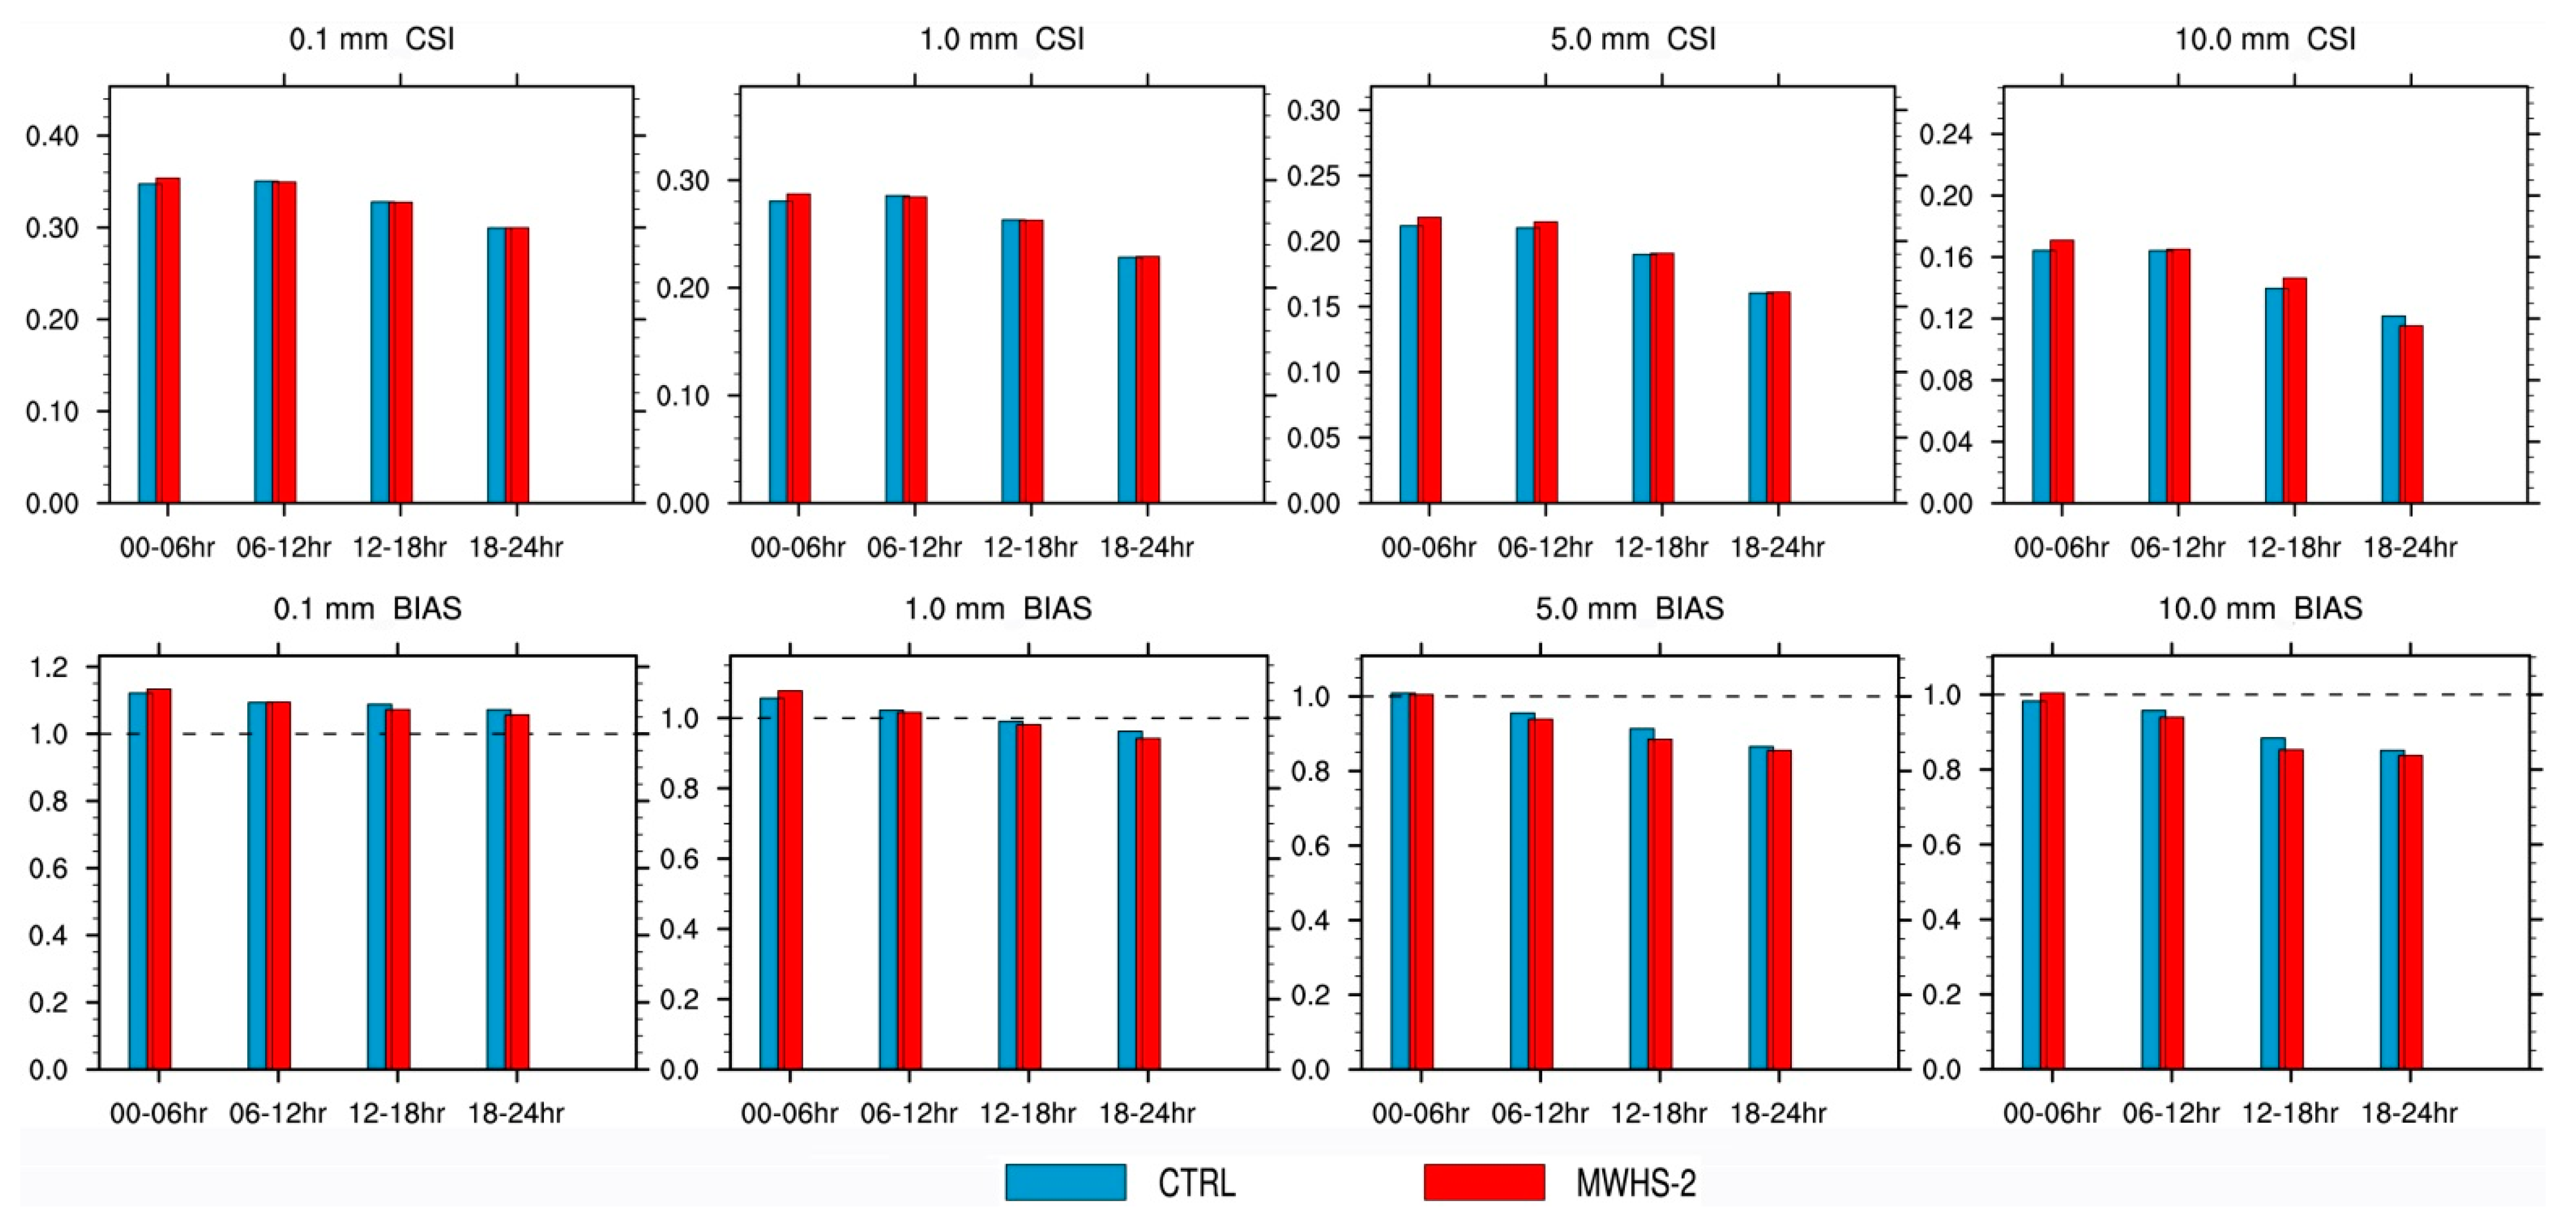
3.2. Verification against Observations

To investigate the impact of MWHS-2 radiance data on the short-range forecast in the system of RMAPS-ST, two groups of the 24-h forecasts with and without MWHS-2 radiance data assimilation are compared and evaluated against observations. Figure 7 gives the mean values of RMSE for humidity and temperature profiles over one month, from 1 July 2019 to 31 July 2019, including 248 forecasts in each group of experiments. At the beginning of the forecast (00 h), there is only a slight improvement at 850 hPa for humidity profile. In the 6–18 h of the forecast, the RMSE of the humidity field around 500 hPa also has a small reduction. For temperature profile, the error of each level has been slightly reduced except for the 700 hPa at the starting time of the forecast. An improvement appears between 300 hPa and 850 hPa in the next 12 h forecast, which is relatively obvious around 400 hPa. The RMSE of temperature at low level of 850 hPa has a continuous reduction during the forecast of 0–18 h. The assimilation of MWHS-2 radiance data can see a small improvement on middle and low levels of both humidity and temperature in the short-range forecast of the RMAPS-ST system.
Adjustments on the initial conditions resulting from MWHS-2 radiances may also influence other atmospheric components. Figure 8 gives the mean values of RMSE for the forecasting wind in zonal (UGRD) and meridional (VGRD) directions against sounding observations. At the starting time 00 h of the forecasts, there is little difference in the error between the CTRL and the MWHS-2, except for a slight reduction of the RMSE on low level in the MWHS-2 experiment. In the short-range forecast of 0–18 h, the RMSE below 200 hPa has an overall small reduction for the zonal wind. And the improvement is more obvious as the forecast time advancing, especially for middle and low levels. For the meridional wind, MWHS-S radiances have a similar effect to the zonal wind, but a smaller improvement on the low levels. Meanwhile, MWHS-2 radiances give a relatively obvious improvement around 200 hPa and 300 hPa at 06 h and 18 h of the forecast for the meridional wind.
Figure 9 gives the RMSE values of near-surface elements over the forecast time of 0–24 h for the CTRL and the MWHS-2 experiments, including the wind at 10 m, the temperature at 2 m and the humidity at 2 m. It can be seen that MWHS-2 radiance data brings a positive impact on the temperature at 2 m height in the range of 0–24 h forecast, and the improvement in the error increases with the forecasting time. Compared to the CTRL, the RMSE of the wind at 10 m also has an overall slight reduction in the MWHS-2 experiments. For the humidity at 2 m, there is little improvement, and the RMSE increases slightly at 03 h and 12 h of the forecasts.
For rainfall, the score skills of quantitative precipitation forecast in the 9-km domain are firstly verified against observations for the CTRL and the MWHS-2 experiments. Figure 10 gives the CSI, BIAS, and FAR scores of 3-h accumulated precipitation for the thresholds of 1.0 mm, 5.0 mm, and 10.0 mm. For the small rainfall of 1.0 mm, the CSI value of the MWHS-2 experiment is a little higher overall than that of the CTRL for the short-range forecast of 0–24 h. The BIAS values are both above 1.5 for the two group experiments, but decrease slightly in the experiment of the MWHS-2, which indicates a slight improvement (about 0.75%) for the over-prediction. The corresponding FAR also has been decreased with the MWHS-2 radiances, leading to an improvement about 0.36% in the misreporting of 3-h accumulated rainfall below 1.0 mm. For the threshold of 5.0 mm, the CSI score of the MWHS-2 experiment has a small increase in the first 18 h of the forecast, except for a little increase at 09 h. The corresponding FAR value has a similar improvement, but the BIAS is even less than that of the CTRL below 1.0 after 09 h of the forecast, which indicates an underestimated rainfall forecast in the MWHS-2 experiments. For the threshold of 10.0 mm, the values of CSI score are low for both the CTRL and the MWHS-2, but there is a slight increase in the 0–15 h of the forecast for the MWHS-2 experiments. The corresponding FAR values also have been reduced in the 0–15 h forecast range with the MWHS-2 radiances. In the first 12 h of the forecasts, the assimilation of MWHS-2 radiances increases the score skill of different rainfall levels by up to 1.44% on average. The assimilation of MWHS-2 radiance data can obtain a positive impact on the rainfall forecast of 0–12 h in the system of RMAPS-ST, although the improvement is relatively small.
Figure 11 gives the CSI and BIAS scores of 6-h accumulated precipitation from the CTRL and the MWHS-2 forecasts in the nested 3-km domain for the threshold of 0.1 mm, 1.0 mm, 5.0 mm, and 10.0 mm. Compared with the CTRL, there is a small improvement in the CSI scores of the 0–6 h rainfall forecasts for all these four thresholds in the MWHS-2 experiment. For the thresholds of 0.1 mm and 1.0 mm, the BIAS is greater than 1.0 for both two groups of the experiments in the forecast of 0–6 h, and the value is a little higher in the MWHS-2 experiment resulting in an over-prediction and a correspondingly higher value of the CSI score. For the threshold of 5.0 mm, the CSI score has a little increase in the first 12 h of forecasts in the MWHS-2 experiment, but the forecasting rainfall is under-estimated after 6 h with the corresponding BIAS value below 1.0. For the threshold of 10.0 mm, the improvement of the CSI score can be found for the first 18 h of forecasts in the MWHS-2 experiment. The corresponding BIAS score is closed to the perfect value of 1.0 in the first 6 h and has a little decrease below 1.0 after 6 h. The assimilation of MWHS-2 radiances can also bring a similar positive impact on the rainfall forecasts for different thresholds in the nested 3-km domain.

4. Discussion

The MWHS-2 instrument on the platform of satellites FY-3C and FY-3D can provide humidity information below 400 hPa for NWP models. Clear-sky radiance data assimilation of MWHS-2 has a good performance after a series of quality control and bias correction in the 3 h-cycling regional model of RMAPS-ST. It can bring a small improvement for humidity forecast at low levels, and indirectly lead to an improvement in temperature and wind of short-rang forecast.
Due to the different Equator crossing times of the polar orbiting satellites, the data coverage of MWHS-2 onboard FY-3C and FY-3D and distribution in time is dependent on the geographical location of the area. In the 9-km domain of the RMAPS-ST system there is relatively rich MWHS-2 observations data coverage at 03, 06, 12, and 18 UTC. Therefore, these forecasts with and without MWHS-2 radiances are further investigated against observations. Figure 12 gives the mean bias and RMSE of humidity forecasts which start at 03, 06, 12, and 18 UTC. It can be seen that the mean biases of humidity forecasts with MWHS-2 decrease at 500 hPa, 850 hPa and 925 Pa in the first 12 h of the forecast, but a little increase at 700 hPa. Compared with that of the CTRL, the improvement in humidity bias further increases with the forecast time at these low levels in the experiment of the MWHS-2. At 00 h of the forecasts, MWHS-2 radiances also reduced the RMSE of humidity forecasts at low levels, especially for the 925 hPa. A small reduction also appears in the humidity forecasts of 500 hPa and 700 hPa at 06 h of the forecasts. At 12 h of the forecasts, the RMSE value of forecasting humidity in the MWHS-2 experiment has a relative obvious improvement at 500 hPa, 850 hPa, and 925 hPa. That is, a benefit can be obtained for the humidity fields in the short-range forecast with rich data coverage and distribution of MWHS-2 radiance observations at initial time.
However, the evaluation of the results is dependent on the accuracy of observation data and the verification method. First, there might still be some problems in the quality of observations and their matching with model grids, although the observation data has undergone a series of quality control processing. If a grid value of the forecast is matched to a nearest observation with great difference, but it is not a truth, there will be a large error. For example, due to the lack and problems of observation data, there is an abnormal error appearing in the humidity field at the level of 400 hPa where the corresponding result and its evaluation are not given. In this situation, the verification based on the observation data is unreliable. Second, the spatial distribution of the observations is also an important factor which directly affects the evaluation of the results. It determines which grid data of the forecast will be verified. Finally, many different methods have been developed for forecast verification. In this study, the score skills of CSI, BIAS, and FAR are employed for quantitative precipitation forecast, which can just give an assessment from a certain point.
In addition, only MWHS-2 radiances in clear-sky conditions are assimilated in the experiments. The scattering index developed by Bennartz et al. [39] is used to perform cloud and precipitation detection. It is simply defined as the difference between two window channels, which cannot accurately identify all clouds. Future research could focus on a new method of cloud detection using cloud products, or MWHS-2 radiance data assimilation in all-sky conditions. Meanwhile, extension of the experiments to other seasons should be also considered and investigated in the future.

5. Conclusions

Available observations from the MWHS-2 instrument on board the satellites of FY-3C and FY-3D can provide potential benefits for the NWP systems. This study describes the application of clear-sky MWHS-2 radiances in the RMAPS-ST regional system. Two groups of assimilation experiments with and without MWHS-2 radiances are carried out over one month from 1 July 2019 to 31 July 2019 in 3 h-cycling run, including 248 24 h-forecasts in each group. The performance of MWHS-2 radiances assimilated in the RMAPS-ST system is analyzed. Furthermore, the forecast results from the two groups of experiments are compared and verified against the observations.
It is found that the brightness temperatures calculated by the background fields of the RMAPS-ST system are mostly higher than the corresponding observations on channels 11, 12, and 15, and lower than the corresponding observations on channel 14 for the MWHS-2 instrument. After a series of quality control and bias correction, the deviations can be greatly reduced and the analysis departures are closer to zero. That is, a good performance can be obtained for the assimilation of MWHS-2 radiance data in the RMAPS-ST system. Assimilating MWHS-2 radiances brings a small but significant improvement for humidity forecast at low levels, with 16.5% and 3.2% in terms of mean bias and RMSE, respectively. A positive impact on the temperature and wind forecast at middle and low levels can be also obtained indirectly. For quantitative precipitation forecast, the assimilation of MWHS-2 radiances increased the score skills of different rainfall levels by up to 1.44% in the first 12 h forecast. There was a slight overall improvement in the 24-h short-term forecast for over-prediction and misreporting of 3-h accumulated rainfall below 1.0 mm, with 0.75% and 0.36%, respectively. These encouraging results can serve as a foundation for operationally incorporating MWHS-2 radiances into the RMAPS-ST system.
However, further work needs to be done regarding the handling of MWHS-2 radiance data affected by clouds, and the corresponding application in the regional model of RMAPS-ST should be also investigated. We intend to use a new method of cloud detection based on cloud products and then further investigate the impact of MWHS-2 radiance data assimilation.

Author Contributions

Conceptualization, Y.X. and M.C.; software, Y.X. and L.M.; validation, Y.X. and L.M.; formal analysis, Y.X. and M.C.; investigation, Y.X.; writing—original draft preparation, Y.X.; writing—review and editing, J.S., S.F. and R.L.; funding acquisition, Y.X. All authors have read and agreed to the published version of the manuscript.

Funding

This research was funded by the National Natural Science Foundation of China (Grant No. 42005119) and the Natural Science Foundation of Beijing, China (Grant No. 8202021).

Institutional Review Board Statement

Not applicable.

Informed Consent Statement

Not applicable.

Data Availability Statement

The data presented in this study are available on request from the corresponding author.

Acknowledgments

The author acknowledges anyone who provided us with guidance and help. We also thank RMAPS-ST Authority for code support and sharing valuable data.

Conflicts of Interest

The authors declare no conflict of interest.

References

  1. Chen, M.; Rood, R.B.; Joiner, J. Assimilating TOVS Humidity into the GEOS-2 Data Assimilation System. J. Clim. 1999, 12, 2983–2995. [Google Scholar] [CrossRef]
  2. McNally, A.P.; Vesperini, M. Variational analysis of humidity information feom TOVS radiances. Q. J. R. Meteorol. Soc. 1996, 122, 1521–1544. [Google Scholar] [CrossRef]
  3. English, S.J.; Renshaw, R.J.; Dibben, P.C.; Smith, A.J.; Rayer, P.J. A comparison of the impact of TOVS arid ATOVS satellite sounding data on the accuracy of numerical weather forecasts. Quart. J. Roy. Meteorol. Soc. 2000, 126, 2911–2931. [Google Scholar] [CrossRef]
  4. Derber, J.C.; Wu, W.S. The use of TOVS cloud-cleared radiances in the NCEP SSI analysis system. Mon. Wea. Rev. 1998, 126, 2287–2299. [Google Scholar] [CrossRef]
  5. Bauer, P.; Lopez, P.; Benedetti, A.; Salmond, D.; Moreau, E. Implementation of 1D+4D-Var assimilation of precipitation-affected microwave radiances at ECMWF. I: 1D-Var. Q. J. R. Meteorol. Soc. 2006, 132, 2277–2306. [Google Scholar] [CrossRef]
  6. Masahiro, K. Operational use of satellite radiance in JMA mesoscale analysis. In Proceedings of the 2012 IEEE International Geoscience and Remote Sensing Symposium, Munich, Germany, 22–27 July 2012; pp. 2442–2445. [Google Scholar] [CrossRef]
  7. Joo, S.; Eyre, J.; Marriott, R. The impact of MetOp and other satellite data within the Met Office global NWP system using an adjoint-based sensitivity method. Mon. Weather Rev. 2013, 141, 3331–3342. [Google Scholar] [CrossRef]
  8. Zhu, G.; Xue, J.; Zhang, H.; Liu, Z.; Zhuang, S.; Huang, L.; Dong, P. Direct assimilation of satellite radiance data in GRAPES variational assimilation system. Chin. Sci. Bull. 2008, 53, 3465–3469. [Google Scholar] [CrossRef]
  9. Bormann, N.; Fouilloux, A.; Bell, W. Evaluation and assimilation of ATMS data in the ECMWF system. J. Geophys. Res. Atmos. 2013, 118, 12970–12980. [Google Scholar] [CrossRef]
  10. Lawrence, H.; Bormann, N.; Geer, A.; Lu, Q.; English, S.J. Evaluation and Assimilation of the Microwave Sounder MWHS-2 Onboard FY-3C in the ECMWF Numerical Weather Prediction System. IEEE Trans. Geosci. Remote Sens. 2018, 56, 3333–3349. [Google Scholar] [CrossRef]
  11. Qi, L.; Sun, J. Application of ATOVS Microwave Radiance Assimilation to Rainfall Prediction in Summer 2004. Adv. Atmos. Sci. 2006, 23, 815–830. [Google Scholar] [CrossRef]
  12. Sagita, N.; Hidayati, R.; Hidayat, R.; Gustari, I. Satellite radiance data assimilation for rainfall prediction in Java Region. IOP Conf. Ser. Earth Environ. Sci. 2017, 54, 012037. [Google Scholar] [CrossRef]
  13. Xie, Y.H.; Shi, J.C.; Fan, S.Y.; Chen, M.; Dou, Y.J.; Ji, D.B. Impact of radiance data assimilation on the prediction of heavy rainfall in RMAPS: A case study. Remote Sens. 2018, 10, 1380. [Google Scholar] [CrossRef] [Green Version]
  14. Mcnally, T.; Bonavita, M.; Thépaut, J.N. The role of satellite data in the forecasting of Hurricane Sandy. Mon. Wea. Rev. 2014, 142, 634–646. [Google Scholar] [CrossRef]
  15. Geer, A.J.; Baordo, F.; Bormann, N.; English, S.J. All-sky Assimilation of Microwave Humidity Sounders; ECMWF: Reading, UK, 2014; p. 741. [Google Scholar] [CrossRef]
  16. Radnoti, G.; Bauer, P.; McNally, A.; Cardinali, C.; Healy, S.; Rosnay, P.d. ECMWF Study on the Impact of Future Developments of the Space-Based Observing System on Numerical Weather Prediction; ECMWF: Reading, UK, 2010; p. 638. [Google Scholar] [CrossRef]
  17. Guan, L.; Zou, X.; Weng, F.; Li, G. Assessments of FY-3A Microwave Humidity Sounder measurements using NOAA-18 Microwave Humidity Sounder. J. Geophys. Res. 2011, 116. [Google Scholar] [CrossRef] [Green Version]
  18. Bonsignori, R. The microwave humidity sounder (MHS): In-orbit performance assessment. In Proceedings of the Sensors, Systems, and Next-Generation Satellites XI, Florence, Italy, 17–20 September 2007; p. 67440A. [Google Scholar] [CrossRef]
  19. Klaes, K.D.; Cohen, M.; Buhler, Y.; Schlüssel, P.; Munro, R.; Luntama, J.P.; von Engeln, A.; Clérigh, E.Ó.; Bonekamp, H.; Ackermann, J.; et al. An introduction to the EUMETSAT Polar system. Bull. Amer. Meteor. Soc. 2007, 88, 1085–1096. [Google Scholar] [CrossRef]
  20. Ma, Y.; Zou, X. Striping noise mitigation in ATMS brightness temperatures and its impact on cloud LWP retrievals. J. Geophys. Res. Atmos. 2015, 120, 6634–6653. [Google Scholar] [CrossRef]
  21. Zhang, P.; Lu, Q.; Hu, X.; Gu, S.; Yang, L.; Min, M.; Chen, L.; Xu, N.; Sun, L.; Bai, W.; et al. Latest progress of the chinese meteorological satellite program and core data processing technologies. Adv. Atmos. Sci. 2019, 36, 1027–1045. [Google Scholar] [CrossRef]
  22. He, J.Y.; Zhang, S.W.; Wang, Z.Z. Advanced Microwave Atmospheric Sounder (AMAS) Channel Specifications and T/V Calibration Results on FY-3C Satellite. IEEE Trans Geosci Remote Sens. 2015, 53, 481–493. [Google Scholar]
  23. Lu, Q.; Lawrence, H.; Bormann, N.; English, S.; Lean, K.; Atkinson, N.; Bell, W.; Carminati, F. An evaluation of FY-3C satellite data quality at ECMWF and the Met Office; ECMWF: Reading, UK, 2015; p. 767. [Google Scholar] [CrossRef]
  24. Carminati, F.; Migliorini, S. All-sky data assimilation of MWTS-2 and MWHS-2 in the Met Office global NWP system. Adv. Atmos. Sci. 2021, 38, 1682–1694. [Google Scholar] [CrossRef]
  25. Lindskog, M.; Dybbroe, A.; Randriamampianina, R. Use of microwave radiances from Metop-C and Fengyun-3 C/D satellites for a northern European limited-area data assimilation system. Adv. Atmos. Sci. 2021, 38, 1415–1428. [Google Scholar] [CrossRef]
  26. Skamarock, W.C.; Klemp, J.B.; Dudhia, J.; Gill, D.O.; Barker, D.M.; Duda, M.G.; Huang, X.Y.; Wang, W.; Powers, J.G. A Description of the Advanced Research WRF Version 3; NCAR Technical Note; University Corporation for Atmospheric Research: Boulder, CO, USA, 2008. [Google Scholar]
  27. Barker, D.; Huang, X.Y.; Liu, Z.; Auligné, T.; Zhang, X.; Rugg, S.; Ajjaji, R.; Bourgeois, A.; Bray, J.; Chen, Y.; et al. The weather research and forecasting model's community variational/ensemble data assimilation system: WRFDA. Bull. Amer. Meteor. Soc. 2012, 93, 831–843. [Google Scholar] [CrossRef] [Green Version]
  28. Xie, Y.; Fan, S.; Chen, M.; Shi, J.; Zhong, J.; Zhang, X. An assessment of satellite radiance data assimilation in RMAPS. Remote Sens. 2019, 11, 54. [Google Scholar] [CrossRef] [Green Version]
  29. Zhong, J.; Lu, B.; Wang, W.; Huang, C.; Yang, Y. Impact of Soil Moisture on Winter 2-m Temperature Forecasts in Northern China. J. Hydrometeorol. 2020, 21, 597–614. [Google Scholar] [CrossRef]
  30. Lu, B.; Zhong, J.; Wang, W.; Tang, S.; Zheng, Z. Influence of Near Real-Time Green Vegetation Fraction Data on Numerical Weather Prediction by WRF over North China. J. Meteor. Res. 2021, 35, 505–520. [Google Scholar] [CrossRef]
  31. Collard, A.; Hilton, F.; Forsythe, M.; Candy, B. From Observations to Forecasts—Part 8: The use of satellite observations in numerical weather prediction. Weather 2011, 66, 31–36. [Google Scholar] [CrossRef] [Green Version]
  32. Harris, B.A.; Kelly, G.A. A satellite radiance bias correction scheme for data assimilation. Q. J. R. Meteorol. Soc. 2001, 127, 1453–1468. [Google Scholar] [CrossRef]
  33. Dee, D.P. Bias and data assimilation. Q. J. R. Meteorol. Soc. 2005, 131, 3323–3343. [Google Scholar] [CrossRef] [Green Version]
  34. Dee, D.P.; Uppala, S. Variational bias correction of satellite radiance data in the ERA-Interim reanalysis. Q. J. R. Meteorol. Soc. 2009, 135, 1830–1841. [Google Scholar] [CrossRef]
  35. Wang, H.; Yang, Z.; Yang, D.; Gong, X. The method and application of automatic quali ty control for real time data from Automatic Weather Stations. Meteorol. Mon. 2007, 33, 102–109. [Google Scholar]
  36. Ren, Z.; Zhang, Z.; Sun, C.; Liu, Y.; Li, J. Development of three-step quality control system of real-time observation data from AWS in China. Meteorol. Mon. 2015, 41, 1265–1277. [Google Scholar]
  37. Schaffer, J.T. The critical success index as an indicator of warning skill. Wea. Forecast. 1990, 5, 570–575. [Google Scholar] [CrossRef] [Green Version]
  38. Casati, B.; Wilson, L.J.; Stephenson, D.B.; Nurmi, P.; Ghelli, A.; Pocernich, M.; Damrath, U.; Ebert, E.E.; Brown, B.G.; Mason, S. Forecast verification: Current status and future directions. Meteorol. Appl. 2008, 15, 3–18. [Google Scholar] [CrossRef]
  39. Bennartz, R.; Thoss, A.; Dybbroe, A.; Michelson, D.B. Precipitation analysis using the Advanced Microwave Sounding Unit in support of nowcasting applications. Meteor. Appl. 2002, 9, 177–189. [Google Scholar] [CrossRef]
Figure 1. RMAPS-ST domains with topographic features.
Remotesensing 14 00275 g001
Figure 2. The spatial distribution of MWSH-2 channel 11 brightness temperatures before and after all quality control procedures at 0300 UTC 20 July 2019 for satellite FY-3C and at 0600 UTC 20 July 2019 for FY-3D, respectively.
Remotesensing 14 00275 g002
Figure 3. Histogram of the brightness temperature innovations distribution with (red) and without bias correction (blue) for MWHS-2 channels 11 and 14 from FY-3C and FY-3D, respectively.
Remotesensing 14 00275 g003
Figure 4. The statistics of observation number, background departure and analysis departure for each channel of MWHS-2 on satellite FY-3C (left) at 0300 UTC and FY-3D (right) at 0600 UTC 20 July 2019, respectively.
Remotesensing 14 00275 g004
Figure 5. The scatter plots of the calculated brightness temperatures with and without bias correction vs. observations for MWHS-2 channel 11 on satellite FY-3C and FY-3D. The first row is for MWHS-2 of FY-3C at 0300 UTC and the second row for that of FY-3D at 0600 UTC 20 July 2019.
Remotesensing 14 00275 g005
Figure 6. Varieties of the mean bias and the standard deviation over time from 0000 UTC on 1 July 2019 to 2300 UTC on 31 July 2019 for the background and the analysis departures in MWHS channle 11 on the satellite of FY-3C and FY-3D.
Remotesensing 14 00275 g006
Figure 7. RMSEs of the forecast humidity (first row) and temperature (second row) profiles for CTRL (blue line) and MWHS-2 (red line) experiments against observations at 00 h, 06 h, 12 h and 18 h of the forecasts.
Remotesensing 14 00275 g007
Figure 8. RMSEs of the forecasting zonal (UGRD: first row) wind and meridional (VGRD: second row) wind for CTRL (blue line) and MWHS-2 (red line) experiments against observations at 00 h, 06 h, 12 h, and 18 h of the forecasts.
Remotesensing 14 00275 g008
Figure 9. RMSEs of the temperature (TMP) at 2 m (left), the wind at 10 m (middle), and the humidity (Qv) at 2 m (right) over the forecast time of 0–24 h against observations for CTRL (blue) and MWHS-2 (red) experiments.
Remotesensing 14 00275 g009
Figure 10. The CSI, BIAS and FAR scores of 3-h accumulated precipitation from the CTRL and the MWHS-2 forecasts in the 9-km domain for the threshold of 1.0 mm, 5.0 mm and 10.0 mm.
Remotesensing 14 00275 g010
Figure 11. The CSI and BIAS scores of 6-h accumulated precipitation from the CTRL and the MWHS-2 forecasts in the nested 3-km domain for the threshold of 0.1 mm, 1.0 mm, 5.0 mm, and 10.0 mm.
Remotesensing 14 00275 g011
Figure 12. Mean bias (dash line in the first row) and RMSE (solid line in the second row) of humidity at 00 h, 06 h and 12 h of the forecasts starting at 03 UTC, 06 UTC, 12 UTC and 18 UTC against observations.
Remotesensing 14 00275 g012
Table 1. Channel frequency and the peaks of weight function (WF) for MWHS-2.
ChannelFrequency (GHz)Peak WF 1 (hPa)Horizontal Resolution (km)
189.0 (QH) 2Surface29
2118.75 ± 0.08 (QV) 3-29
3118.75 ± 0.2 (QV)-29
4118.75 ± 0.3 (QV)-29
5118.75 ± 0.8 (QV)-29
6118.75 ± 1.1 (QV)-29
7118.75 ± 2.5 (QV)-29
8118.75 ± 3.0 (QV)-29
9118.75 ± 5.0 (QV)-29
10150.0 (QH)Surface16
11183.31 ± 1.0 (QV)400 hPa16
12183.31 ± 1.8 (QV)500 hPa16
13183.31 ± 3.0 (QV)600 hPa16
14183.31 ± 4.5 (QV)700 hPa16
15183.31 ± 7.0 (QV)800 hPa16
1 WF: weight function; 2 QH: quasi-horizontal; 3 QV: quasi-vertical.
Publisher’s Note: MDPI stays neutral with regard to jurisdictional claims in published maps and institutional affiliations.

