Abstract
The Doppler lidar system can accurately obtain wind profiles with high spatiotemporal resolution, which plays an increasingly important role in the research of atmospheric boundary layers and sea–land breeze. In September 2019, Doppler lidars were used to carry out observation experiments of the atmospheric wind field and pollutants in Shenzhen. Weather Research and Forecasting showed that the topography of Hongkong affected the sea breeze to produce the circumfluence flow at low altitudes. Two sea breezes from the Pearl River Estuary and the northeast of Hong Kong arrived at the observation site in succession, changing the wind direction from northeast to southeast. Based on the wind profiles, the structural and turbulent characteristics of the sea breeze were analyzed. The sea breeze front was accurately captured by the algorithm based on fuzzy logic, and its arrival time was 17:30 on 25 September. The boundary between the sea breeze and the return flow was separated by the edge enhancement algorithm. From this, the height of the sea breeze head (about 1100 m) and the thickness of the sea breeze layer (about 700 m) can be obtained. The fluctuated height of the boundary and the spiral airflow nearby revealed the Kelvin–Helmholtz instability. The influence of the Kelvin–Helmholtz instability could be delivered to the near-surface, which was verified by the spatiotemporal change of the horizontal wind speed and momentum flux. The intensity of the turbulence under the control of the sea breeze was significantly lower than that under the land breeze. The turbulent intensity was almost 0.1, and the dissipation rate was between 10−4 and 10−2 m2·s−3 under the land breeze. The turbulent intensity was below 0.05, and the dissipation rate was between 10−5 and 10−3 m2·s−3 under the sea breeze. The turbulent parameters showed peaks and large gradients at the boundary and the sea breeze front. The peak value of the turbulent intensity was around 0.3, and the dissipation rate was around 0.1 m2·s−3. The round-trip effect of sea–land breeze caused circulate pollutants. The recirculation factor was maintained at 0.5–0.6 at heights where the sea and land breeze alternately controlled (below 600 m), as well as increasing with a decreasing duration of the sea breeze. The factor exceeded 0.9 under the control of the high-altitude breeze (above 750 m). The convergence and rise of the airflow at the front led to collect pollutants, causing a sharp decrease in air quality when the sea breeze front passed.
1. Introduction
The sea breeze is the local mesoscale circulation occurring in coasts worldwide, originating from the difference in thermal properties between land and sea [1]. During the day, the land surface heats up faster than the sea, and the thermal contrast produces the pressure gradient force between the sea and the land. Therefore, the air flows from the ocean to the land at the near-surface during the sea breeze. On the contrary, the land surface temperature at night is usually lower than the sea surface temperature, so the air flows from the land to the ocean during the land breeze. The earliest application of the sea breeze in the military is the Battle of Salamis in the Hippo War [2]. The Greek military chose to drive in the strait between Salamis and Greece after the sea breeze had begun. The sturdy ships gave them an advantage in the rough waters caused by the sea breeze and eventually defeated the Persians. Meteorologists have focused on sea breeze circulation as a key research field in modern times. The sea breeze can provide dynamic and thermal conditions for triggering violent convective precipitation [3,4]. Moreover, it is significant to study the connection between the sea breeze and the diffusion of atmospheric pollutants [5]. Without the large-scale background wind, the sea–land breeze is an essential wind energy source. Therefore, it is also attractive to scholars in the field of energy [6]. Studying the sea–land breeze can improve wind energy utilization and ease the energy shortage problem in the developed coastal city.
Lidar combined with the numerical model is the most common method to analyze physical processes in the atmosphere. The Weather Research and Forecasting (WRF) model is an effective method to study the interaction between the land and the atmosphere. Moreover, it can simulate mesoscale weather, such as the sea–land breeze. The sea breeze is closely related to the landing surface. The urban heat island (UHI) significantly affects the sea breeze and restricts the diffusion of air pollutants. Lin et al. [7] used WRF to study the impact of UHI on the atmospheric boundary layer (ABL) height and compared the ABL height under the sea breeze from the lidar backscatter coefficient with the model result. They also pointed out that the WRF model can show the sea–land breeze. Clappier et al. [8] used the differential absorption lidar to obtain ozone concentration profiles and simulated the impact of the sea breeze on photochemical smog using the model.
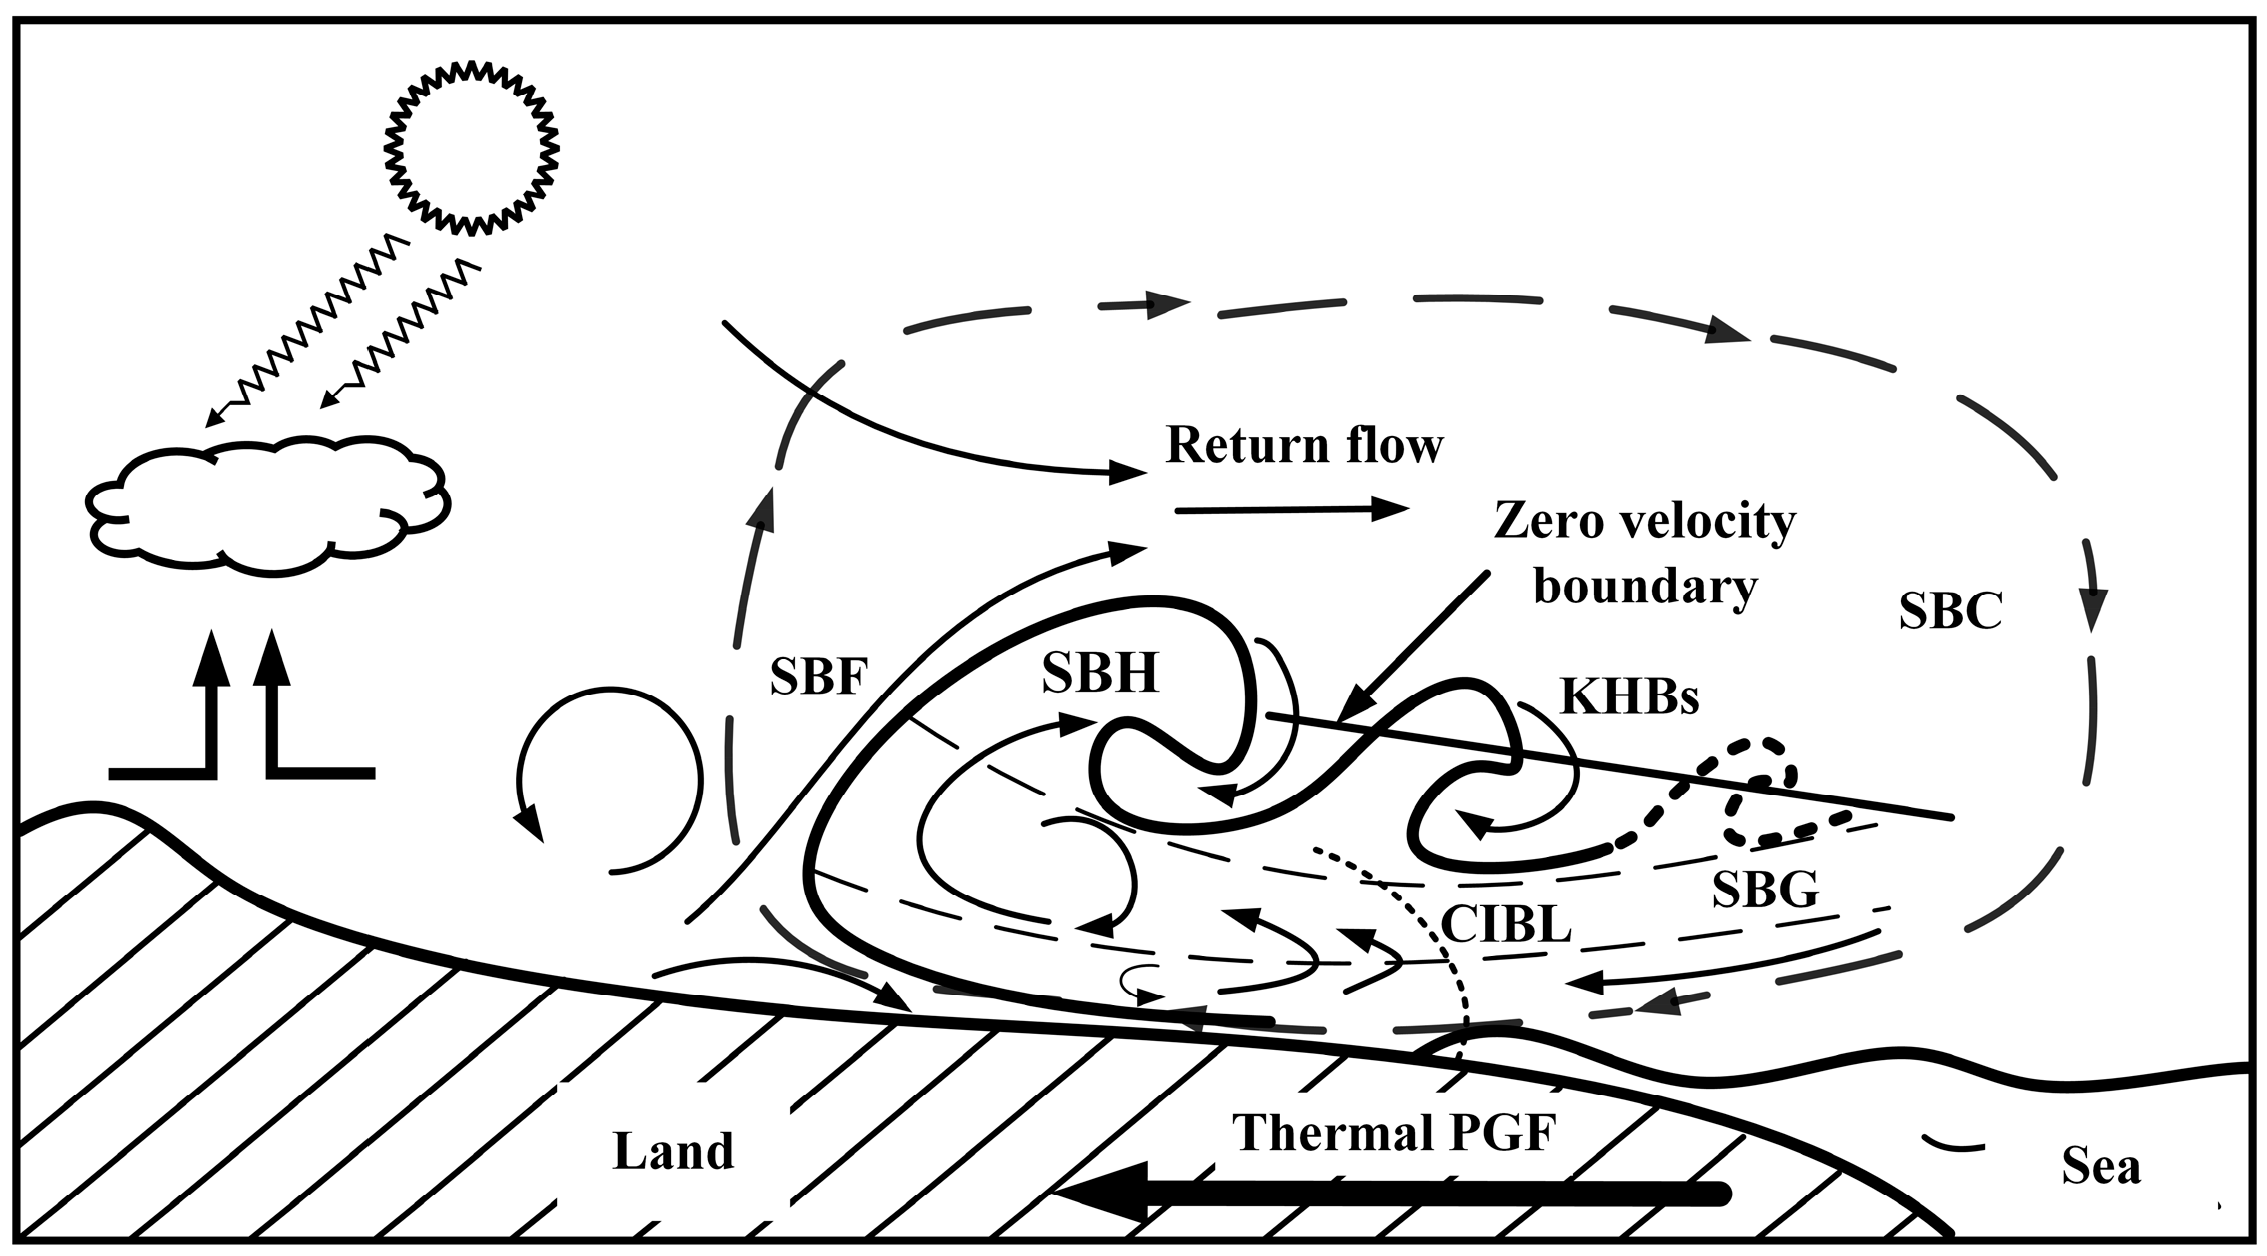
As shown in Figure 1, the sea breeze consists of the following parts [1]: sea breeze circulation (SBC), sea breeze gravity current (SBG), sea breeze front (SBF), sea breeze head (SBH), convective internal boundary layer (CIBL), and Kelvin–Helmholtz billows (KHBs). The SBF is the leading edge of the SBG and SBC moving toward the land, and its head is SBH. The zero-velocity boundary layer (ZBL) is the boundary between the SBG and the sea breeze high-altitude return flow, where the horizontal wind speed is close to zero. The Kelvin–Helmholtz instability is a feature of the turbulent structure of the sea breeze. When the shear between the sea breeze and the return flow reaches the critical value, slight fluctuations begin to appear at the boundary. As the wave amplitude increases and reaches the extreme height, the wave starts to roll and break. The breaking wave is called the KHBs. The interaction of static instability and dynamic instability turns the laminar flow into turbulent flow.
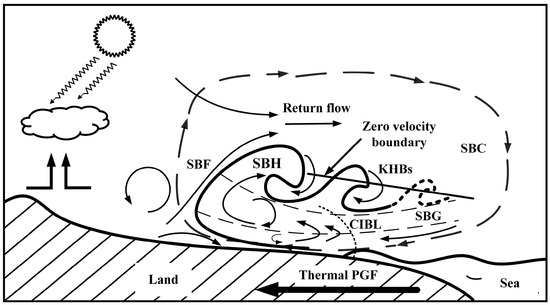
Figure 1.
The structure of sea breeze and airflow trajectory.
Due to the differences in latitude location, topography, and coastline characteristics [9,10], the sea breezes in different regions have both common features and typical local characteristics. The Pearl River Delta locates in low latitude and is affected by the sea breeze. Urbanization has hastened in the Pearl River Delta after the reform and opening up. The urban heat island effect has significantly impacted atmospheric circulation at local and regional scales [11]. The rapid economic development accompanies a series of environmental problems. The frequency of severe pollution events has increased sharply [12]. Local pollution has transformed into the region scope under the sea breeze, which harms human health [13]. The high resolution of Doppler lidar makes it possible to view the complex and fast-moving sea breeze. It gains the turbulent structure in the sea breeze and provides valuable data for studying the ABL. The research on the sea breeze can improve the understanding of climate changes, help improve the local circulation model, and contribute to building pollutant warnings in coastal regions.
2. Experiment and Methods
2.1. Experimental Site and Equipment
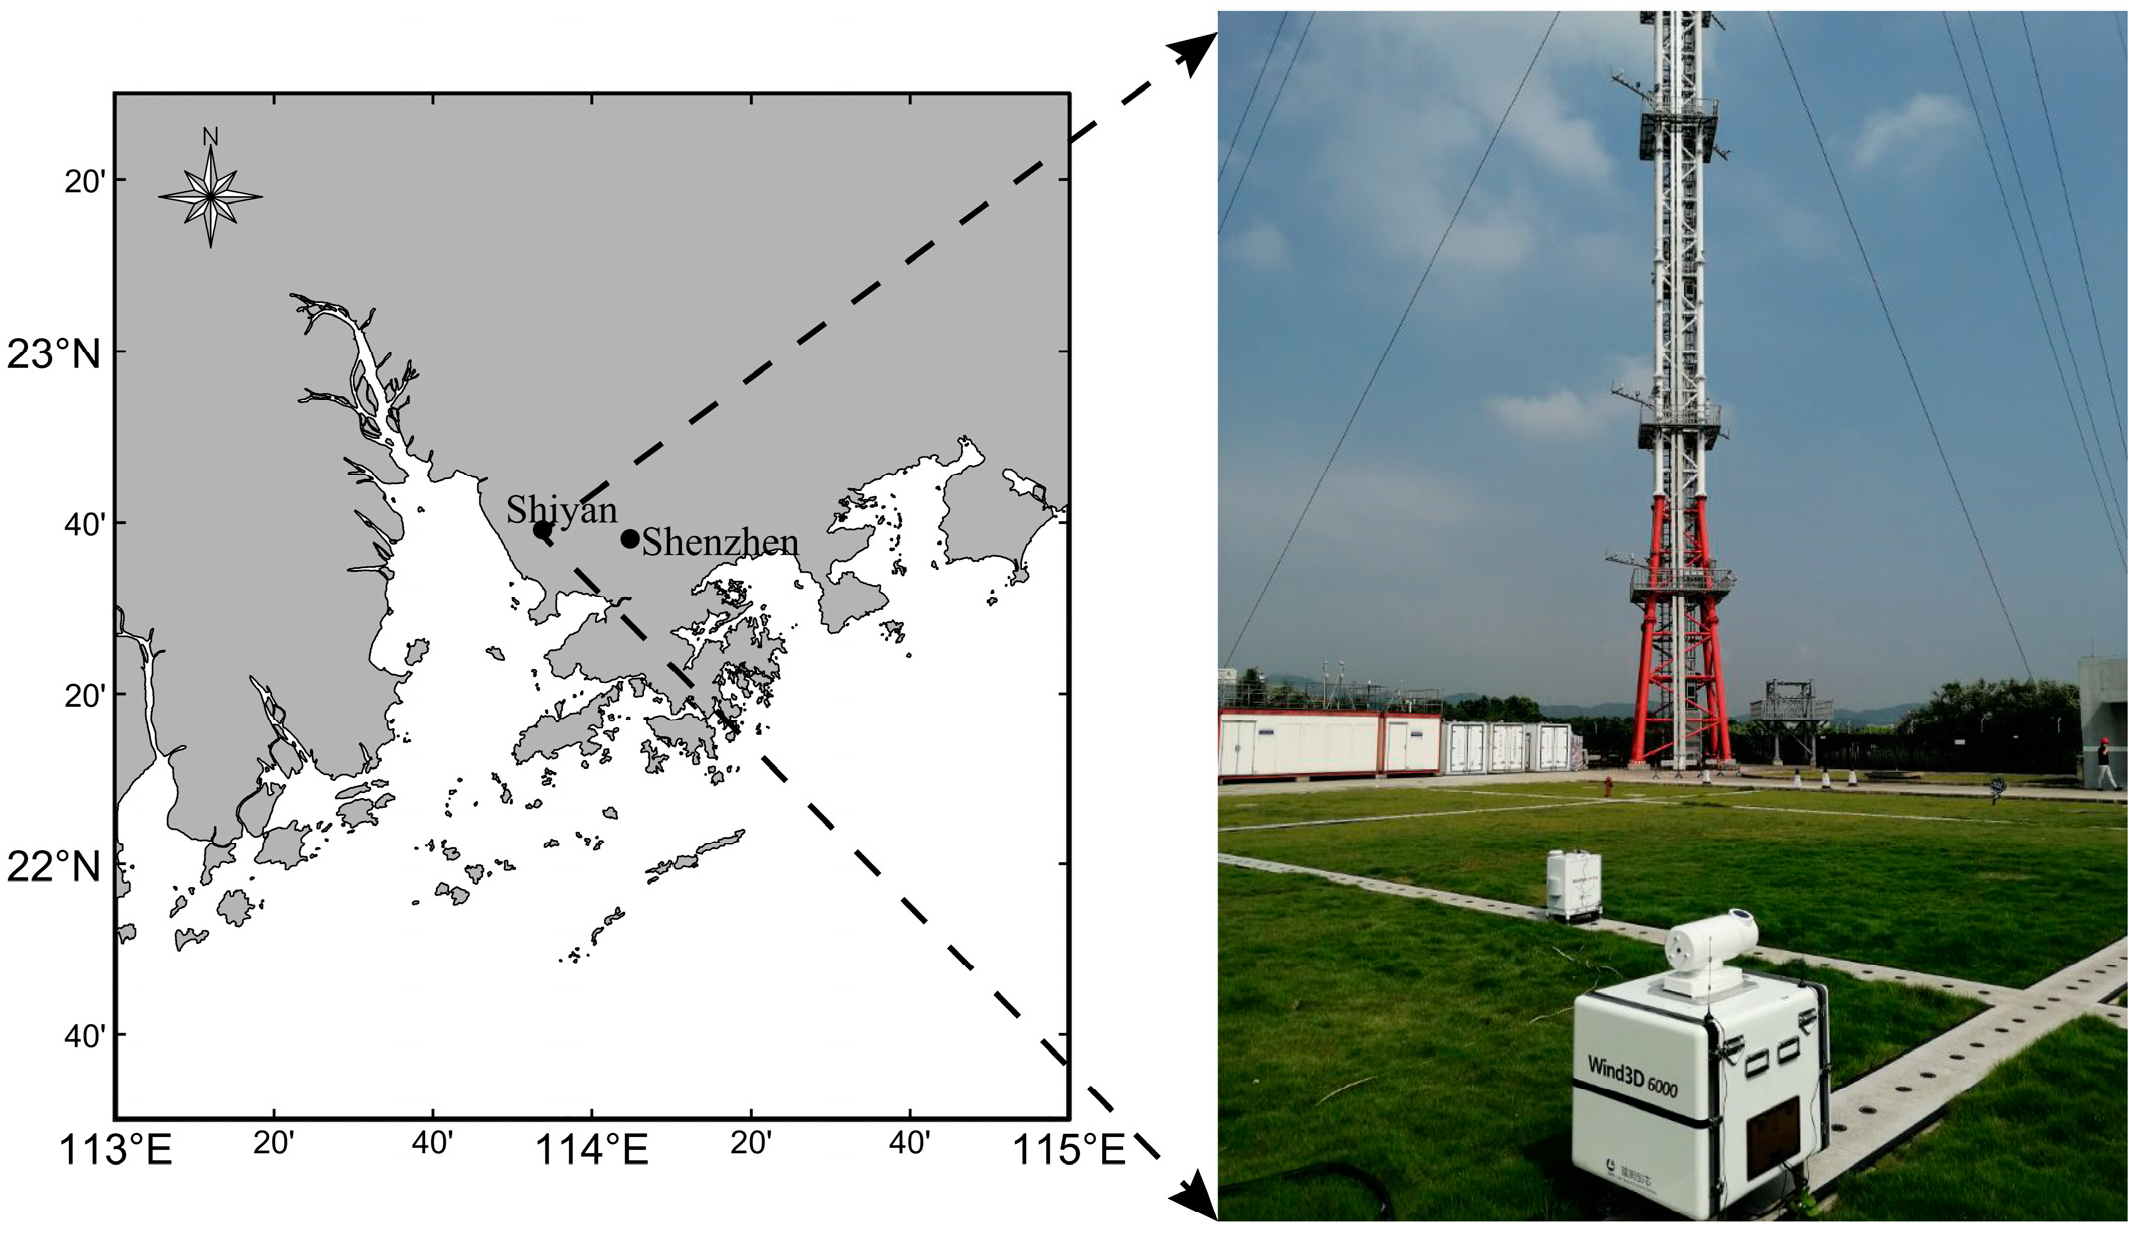
From 2 August to 21 October 2019, the Doppler lidar Wind3D 6000 and WindMast WP350 were used to observe the atmosphere and pollutants near the Shiyan Meteorological Observation Tower (N 22°38.8′, E 113°53.9′, altitude about 40 m above sea level) in Shenzhen. As shown in Figure 2, the tower was found in the northwest of Shenzhen. The distance between it and the nearest coastline is about 10 km. The underlying surface is relatively complex with arboreal forest. The closest distance to the reservoir in the south is only 360 m, which significantly affects the change in local temperature and humidity. The observation site is surrounded by urban areas, especially in the northeast, and is just over 1 km from the nearest residential area. The air quality stations at eight layers are installed on the tower to monitor pollutions, such as Gas Chromatography-Mass Spectrometer and Volatile Organic Compounds analyzers. Besides these, there are cup anemometers, wind vanes, ultrasonic anemometers, temperature sensors, etc. for obtaining conventional meteorological data. The acquisition overview of meteorological and pollutant elements from the equipment on the tower is shown in Table 1.
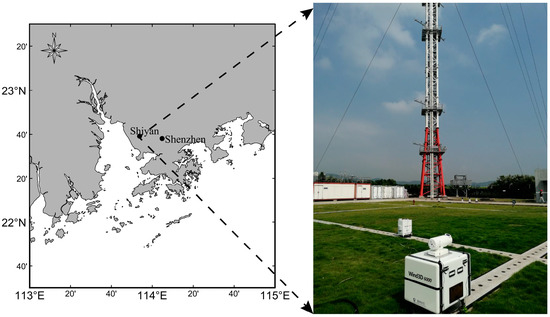
Figure 2.
The geographical location and experimental apparatus.

Table 1.
Overview of meteorological and pollutant elements from the equipment on the tower.
Ocean University of China and Qingdao Leice Transient Technology Co. LTD. [14] jointly developed the scanning lidar Wind3D 6000 and WindMast WP350. Table 2 shows the technical specifications of the lidars. The Wind3D 6000 worked in the Doppler Beam Swinging five-beam (DBS5) scanning, and the laser emitted slantingly at an elevation angle of 71.38° to gain the Doppler shift. The radial wind speed was calculated using the relationship between the Doppler shift caused by the aerosol particles and the particle movement velocity. Based on five consecutive measurements of the radial wind speeds, the 3D wind profiles were calculated. The WindMast WP350 equipped with temperature, humidity, and pressure sensors can obtain wind vectors with a higher spatial resolution and a lower detection blind spot. Both have new applications in the research of low-level jets, sea–land breeze, and ABL. Since the tower is located northwest of the lidar, the effect on the observation of the lidars is mainly affected by the northwest wind. The wind direction of the sea breeze was southeast, and the wind direction of the land breeze was northeast during the observation period. Therefore, the influence of the tower shadow effect is lesser.

Table 2.
Technical specifications of two lidars.
2.2. Configurations of WRF Model
There are limitations to analyzing the sea breeze based on the wind profiles at only one location in Shiyan. Therefore, the WRF V3.9.1 model is used to simulate the development and evolution of the sea breeze. The mesoscale WRF model is developed by the National Centers for Environmental Prediction (NCEP) and the National Center for Atmospheric Research (NCAR) of the United States [15], which can effectively simulate the weather background fields [16,17].
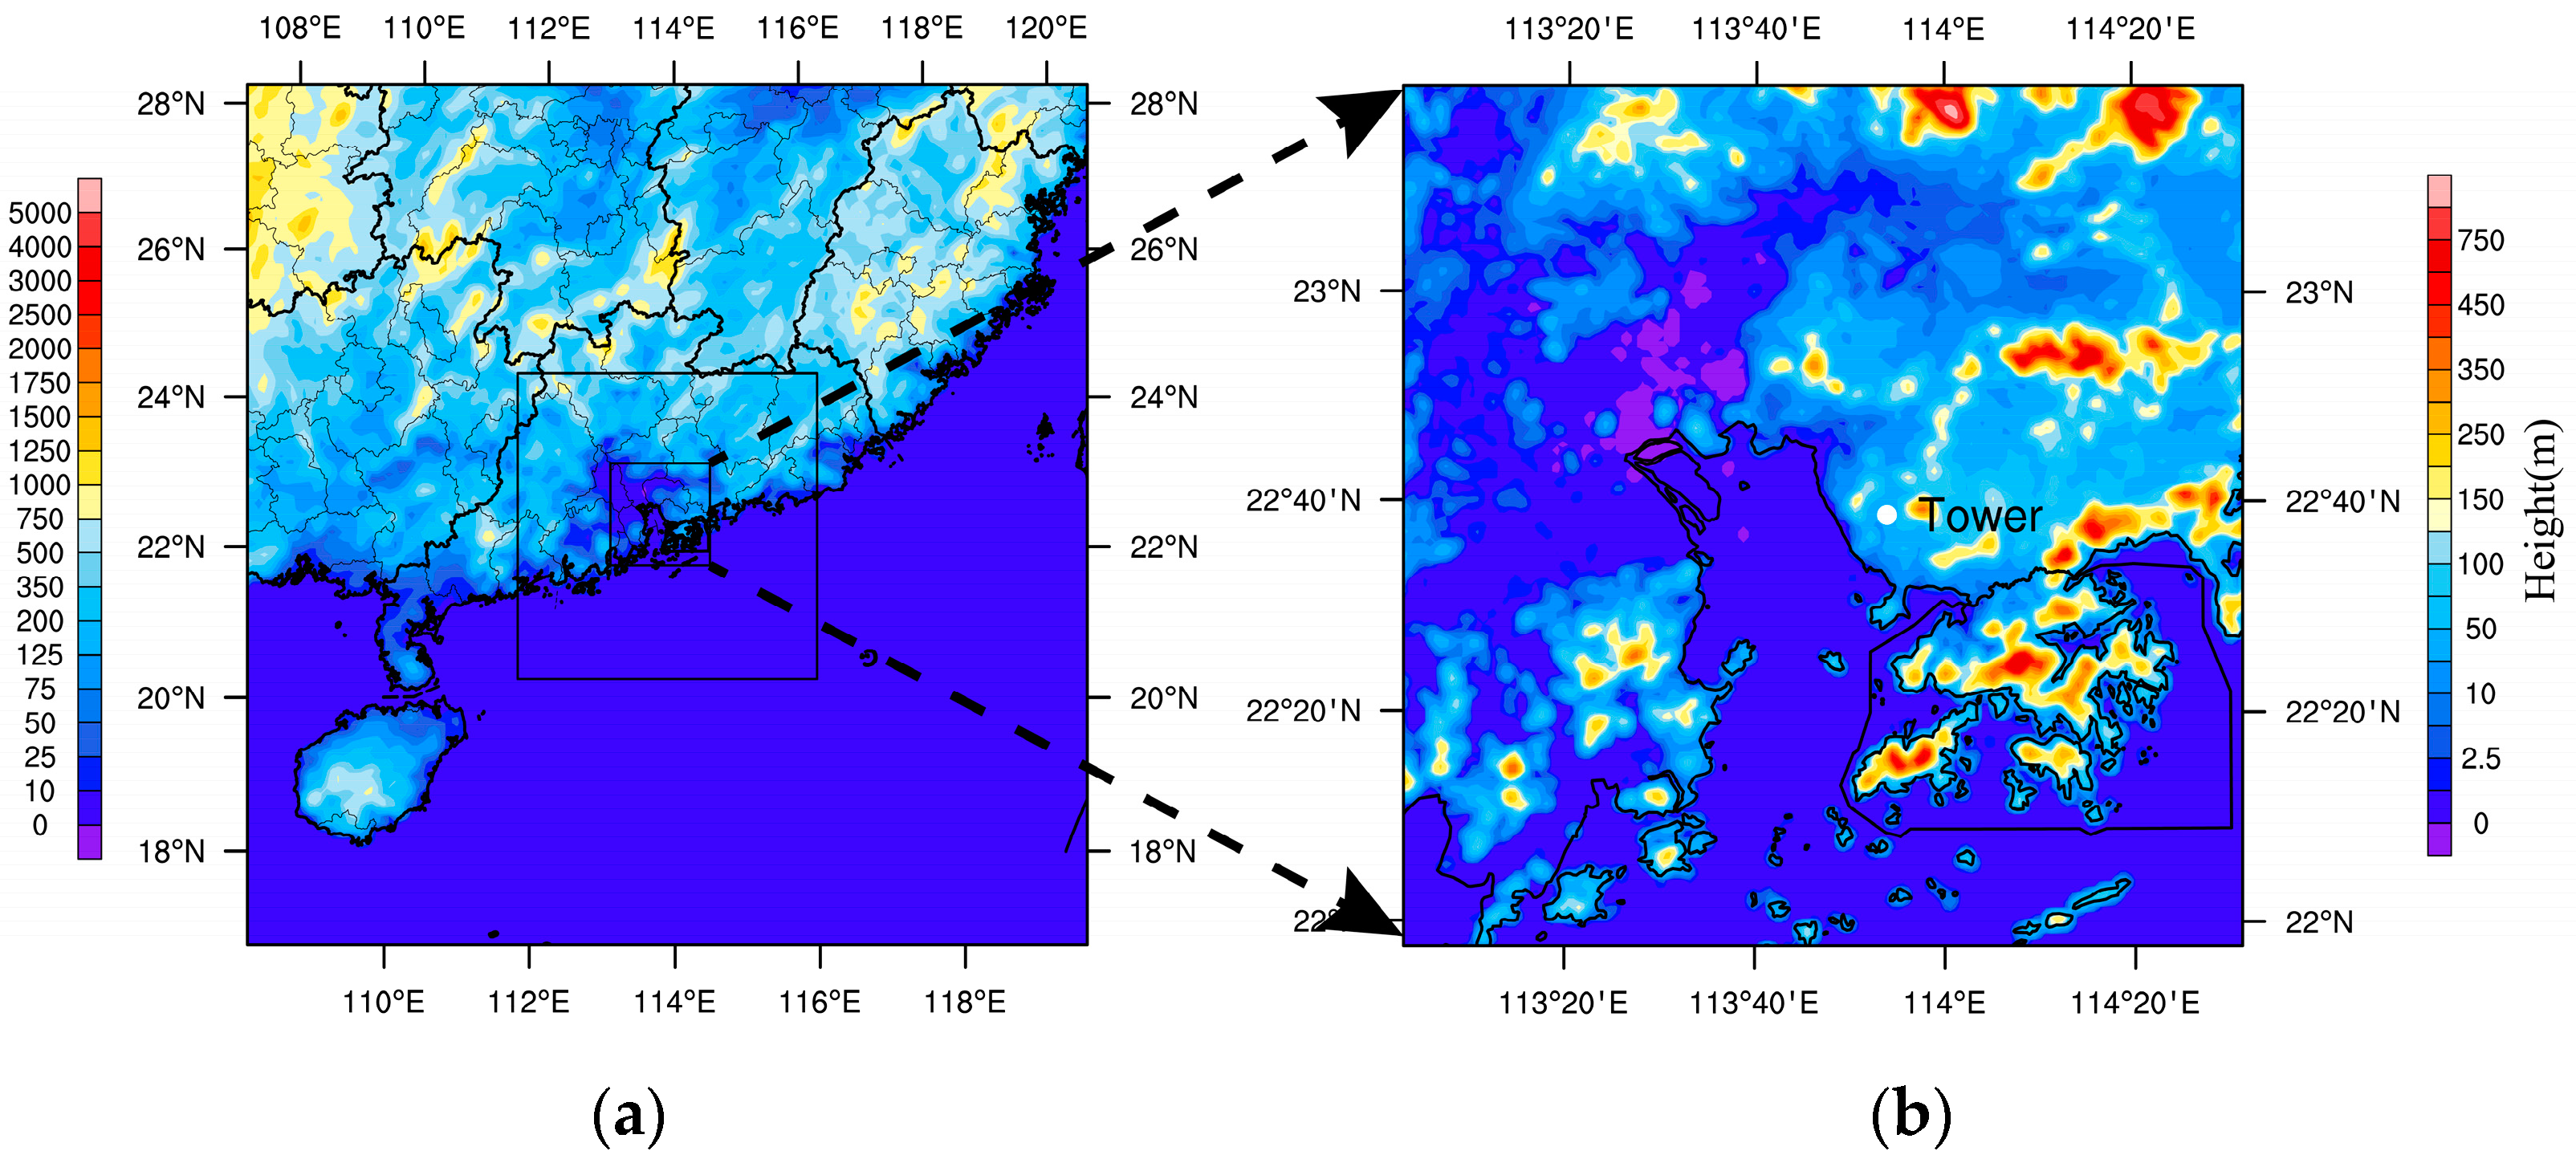
In this study, the model was nested in three domains, with the horizontal grids spacing of 9 km, 3 km, and 1 km, respectively, as shown in Figure 3. From the ground to the model top level (50 hPa), there are 35 sigma layers. The meteorological initial field and lateral boundary conditions used the Global Data Assimilation System (GDAS)/Final(FNL) grid data (0.25° × 0.25° horizontal resolution). The NCEP provides the data with a six-hour time interval. Table 3 shows the physical parameterization schemes referring to the studies of Liu et al. [18,19] in the Pearl River Delta. The terrain in the vicinity of the observation site is relatively flat, mostly with low hills and plains.
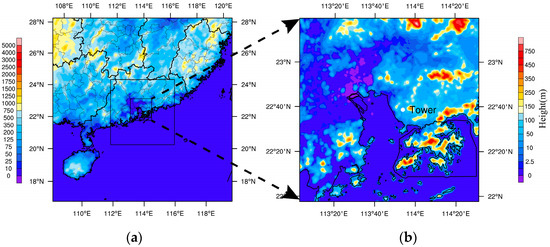
Figure 3.
The scope and topography in the WRF model. (a) the three nested domains and (b) the innermost domain. The white dot represents the location of the observation site.

Table 3.
The physical parameterization schemes in the WRF model.
2.3. Fuzzy Logic Algorithm
The sea breeze front is the leading front of the sea breeze circulation advancing towards the land, which takes on characteristics similar to those of a synoptic-scale cold front. The passage of the SBF is usually accompanying strong convective weather and arouses the changes in wind direction, wind speed, relative humidity, and temperature [27]. Therefore, it has been focused on by many researchers. Due to the limitation of detection height, the previous studies have mostly focused on ground observation. Alpert et al. [28] set thresholds for conventional ground meteorological elements to detect the arrival of the SBF, and took turbulent intensity as an added criterion to improve the accuracy of detection. However, using different meteorological parameters, the arrival times of SBF defined by the threshold method may be far away. Coceal et al. [29] proposed the fuzzy logic algorithm, which can fit the arrival times based on different parameters to the minimum span.
This research extended the fuzzy logic algorithm to the meteorological data on the gradient tower. According to Coceal et al. [29], the wind vectors, temperature, and humidity were processed with a 30-min sliding average, which could remove the variations caused by turbulence on small time scales. The fuzzy function of each element was calculated according to the Equation (1).
Among them, is the fuzzy function, and its value is between and . For each meteorological element, is the changing amount in time compared to the previous moment. The thresholds of wind direction are and , where and represent the maximum and minimum value of the changing amount during the experiment, respectively. The thresholds for other elements are set as and , respectively.
When the front is passing, the horizontal wind speed is relatively low due to the convergence of the land breeze and sea breeze. After the front passes, the wind speed will increase relatively, and wind direction will also change. Because the sea breeze front takes on the characteristics of a cold front, the temperature after the sea breeze passes is relatively lower than before, and the relative humidity is relatively higher. Therefore, the single fuzzy functions corresponding to each parameter will show an extremum at this moment. The total fuzzy function is obtained by averaging the fuzzy functions of the four meteorological parameters, which means that each fuzzy function is multiplied by 0.25 and then added. As shown in Equation (2):
Among them, is the total fuzzy function; , , , and represent the single fuzzy functions of wind speed, wind direction, temperature, and relative humidity, respectively. There will be only one peak in the total fuzzy function at the moment of the sea breeze front’s arrival. Although the fuzzy function of each meteorological parameter has other peaks before and after the arrival of the sea breeze front, which may be caused by gravity waves or KH-instability, these peaks will be smooth by the average weighting in the total fuzzy function.
2.4. Turbulent Parameters
Turbulence is a crucial factor in the development of sea breeze and the transformation of structure. Shimada et al. [30] used a single scanning lidar to view the sea breeze and compared the application of lidar in turbulent intensity with the ultrasonic anemometer. Turbulent intensity is calculated as follows:
where is the standard deviation of the vertical airflow speed , and is the average vertical airflow speed. is the average horizontal wind speed. The parameters above were calculated using the data within 10 min.
Due to the divergence and convergence of the local wind field, the turbulence is rotational during the front passage. The turbulent dissipation rate represents the intensity of the small-scale rotational motion. Smalikho et al. [31] estimated the turbulent dissipation rate by the cone-scanning pulsed coherent Doppler lidar. O’Connor et al. [32] proposed the method to calculate turbulent dissipation rate from a vertically pointing Doppler lidar, and Bodini et al. [33] compared the differences between lidar and anemometer in the results of the dissipation rate. According to the method proposed by O’Connor et al. [32], using Doppler lidar estimates the turbulent dissipation rate :
Among them, is the Kolmogorov constant for one-dimensional turbulent spectra, is the variance of vertical airflow speed, and is the variance of the instrumental noise. and are the length scale for a single sample interval and the length scale for samples interval.
Among, them, is the signal spectral width, SNR is the signal-to-noise ratio, is the number of lidar pulses that are averaged to obtain a profile, and is the number of points sampled within a single range gate to obtain a velocity estimate, and is the bandwidth. According to Wildmann et al. [34], the uncertainty in can be estimated from the uncertainty in the velocity variance:
where is the uncertainty in the sample variance whose value is set to the value of . The length scale for and are:
Among them, is the dwell time which is equal to the time resolution of the data, is the height above the surface, and is the half-angle divergence of the lidar beam. As the half-angle divergence is very small, can be typically negligible. This method requires that both wavenumbers and must be within the inertial sub-region. As the sampling length increases, the median absolute error between estimates from sonic anemometer and lidar first decreases and then increases. According to Bodini et al. [33], is set.
3. Results
3.1. Development of Sea Breeze and Arrival Time of Front
From the observation of lidar, similar sea breeze phenomenons repeatedly occurred on the east coast of the Pearl River Estuary from 25 to 30 September 2019. The sea breeze on 25 September is chosen as a study case to analyze. Lidar clearly and completely captured the spatial and temporal evolution and structural characteristics of the sea–land breeze (SLB).
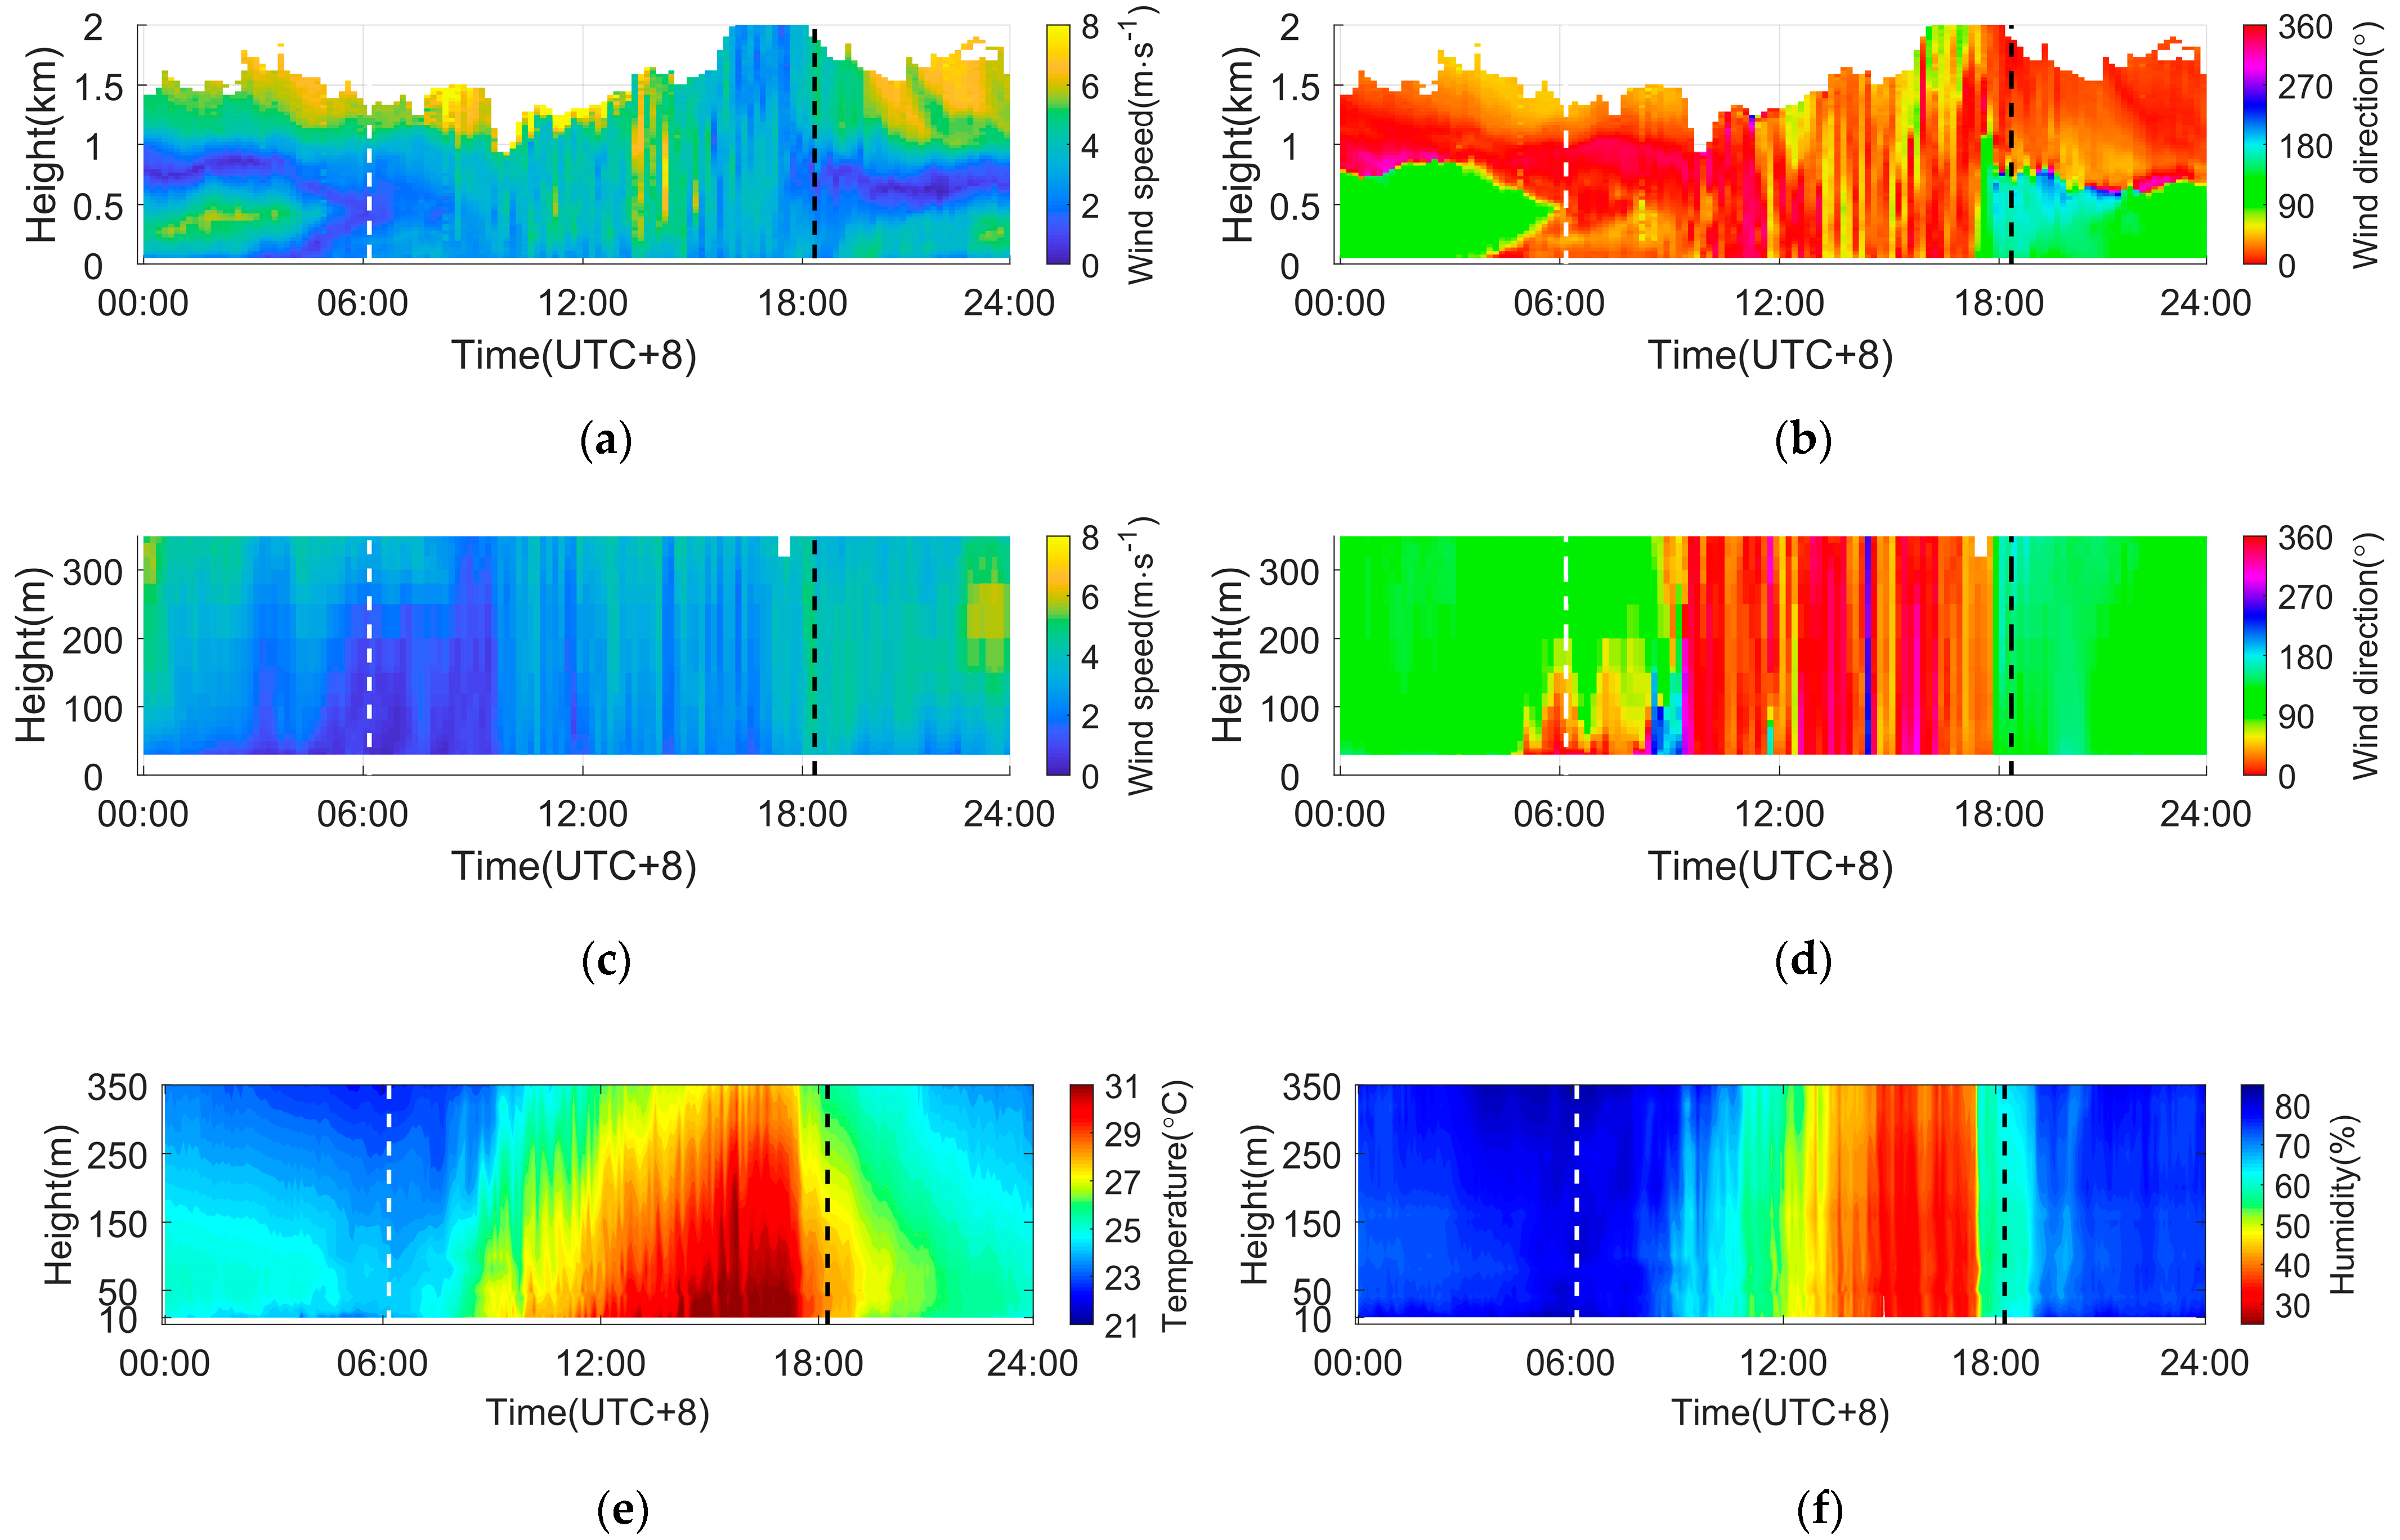
Figure 4a–d shows the wind profiles obtained by two lidars on 25 September, and (e,f) shows the temperature and relative humidity measured by the sensors on the tower—adopting Beijing Time (UTC+8), the same later. The sunrise time was 06:13, and the sunset time was 18:17. The sea breeze whose main wind direction is southeast is expressed as green in Figure 4b. It occurred on 24 September and lasted until 04:00 on 25 September. The land breeze whose main wind direction is northeast is expressed as red in Figure 4b. It started to form at low altitudes at 04:00, and the thickness of the land breeze gradually increased. Due to the background wind field or the limitation of detection height, the land breeze return flow at high altitudes was not observed. The observation site was controlled by land breeze until 17:30. The transition of the land breeze to sea breeze and sea breeze return flow at high altitudes can be noted. The temperature also showed a precipitous drop when the wind direction changed. The relative humidity increased at all heights at the same time. After the sea breeze arrived, there was a temperature inversion at around 100 m.
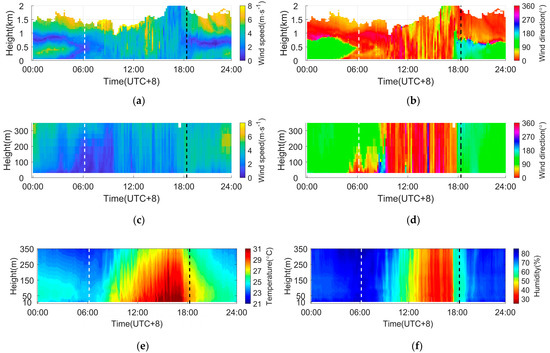
Figure 4.
The observation results of conventional meteorological data on 25 September 2019. (a) wind speed by Wind3D 6000; (b) wind direction by Wind3D 6000; (c) wind speed by WindMast WP350; (d) wind direction by WindMast WP350; (e) temperature and (f) humidity by sensors on the tower. The white dotted line represents the sunrise time and the black one represents the sunset time.
The meteorological fields in the development of the sea breeze are provided by the WRF. Figure 5 shows the wind streamlines and temperature field at 18:00 from the WRF model. The sea breeze originated from the southeast of Hong Kong. However, the topography of Hong Kong divided the sea breeze into two branches and created the island circumfluence flow near the surface. Among them, one sea breeze arrived at the observation site through the Pearl River Estuary first. At 18:00, the experimental site had been controlled by the sea breeze. Due to the strong background wind field, the distance of invading land is relatively short. At 925 hPa, the northeast wind over the land turned into the southeast wind after passing through the north of Hong Kong. It did not flow over the ocean and then reached the observation site. At 850 hPa, the sea breeze over the observation site completely disappeared and was replaced by the sea breeze return flow.

Figure 5.
The wind streamlines and temperature field at 18:00 from the WRF model. (a) surface; (b) at 925 hPa; (c) at 850 hPa. The black dot represents the observation site.
Figure 6 shows the evolution of wind streamlines and temperature near the surface after the sea breeze arrived. At 19:00, the sea breeze from the Pearl River Estuary continued to control the observation site and pushed inland. At 20:00, the second sea breeze arrived at the observation site via the northeast side of Hong Kong. The complex underlying surface of land might slow down the advancing speed of the sea breeze, so the arrival time was late. The distance of this sea breeze intruding inland can reach 60 km.

Figure 6.
The wind streamlines and temperature field near the surface from the WRF model on 25 September 2019. (a) at 19:00; (b) at 20:00; (c) at 21:00. The black dot represents the observation site.
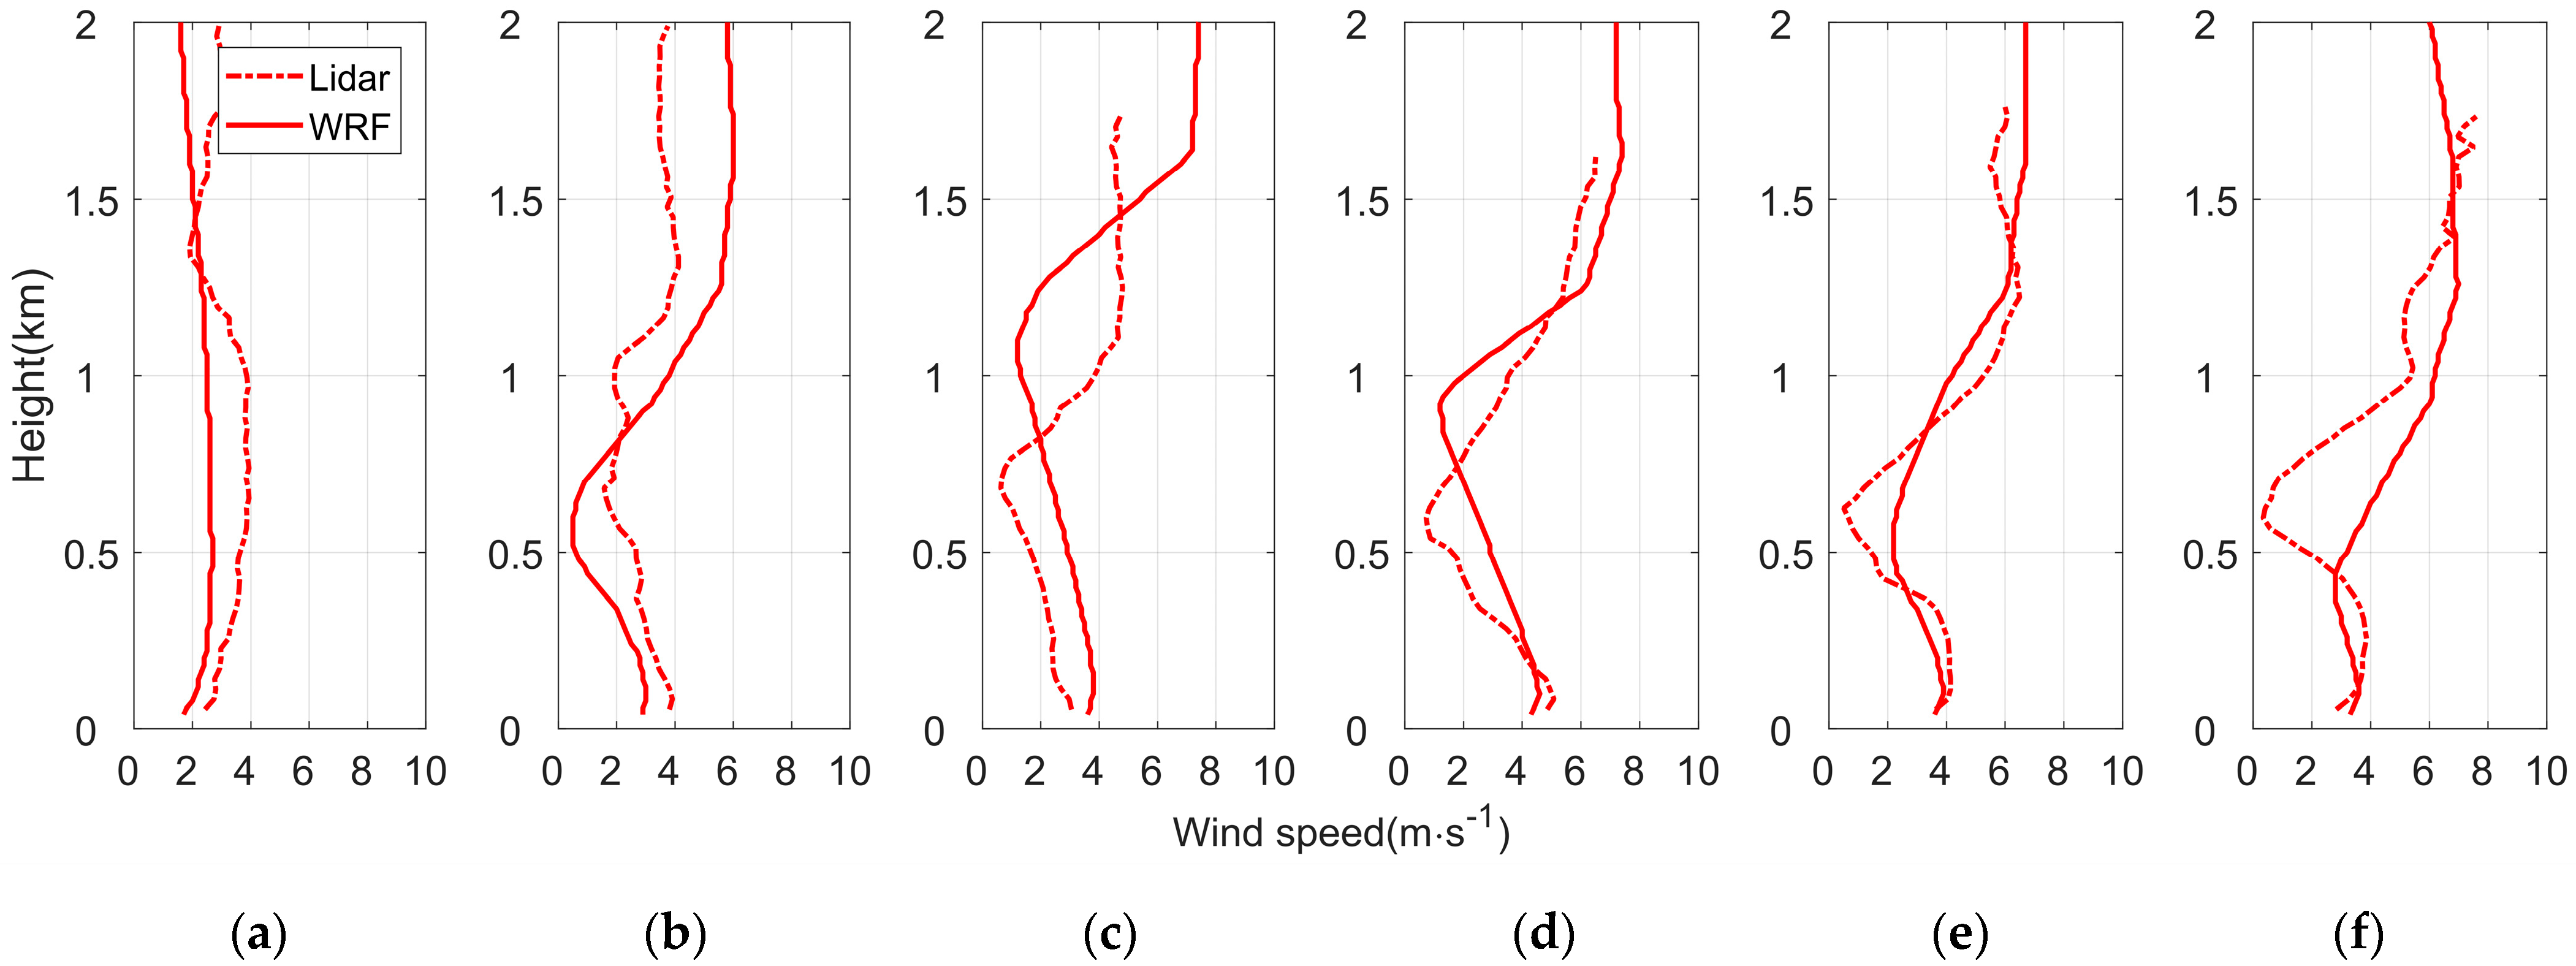
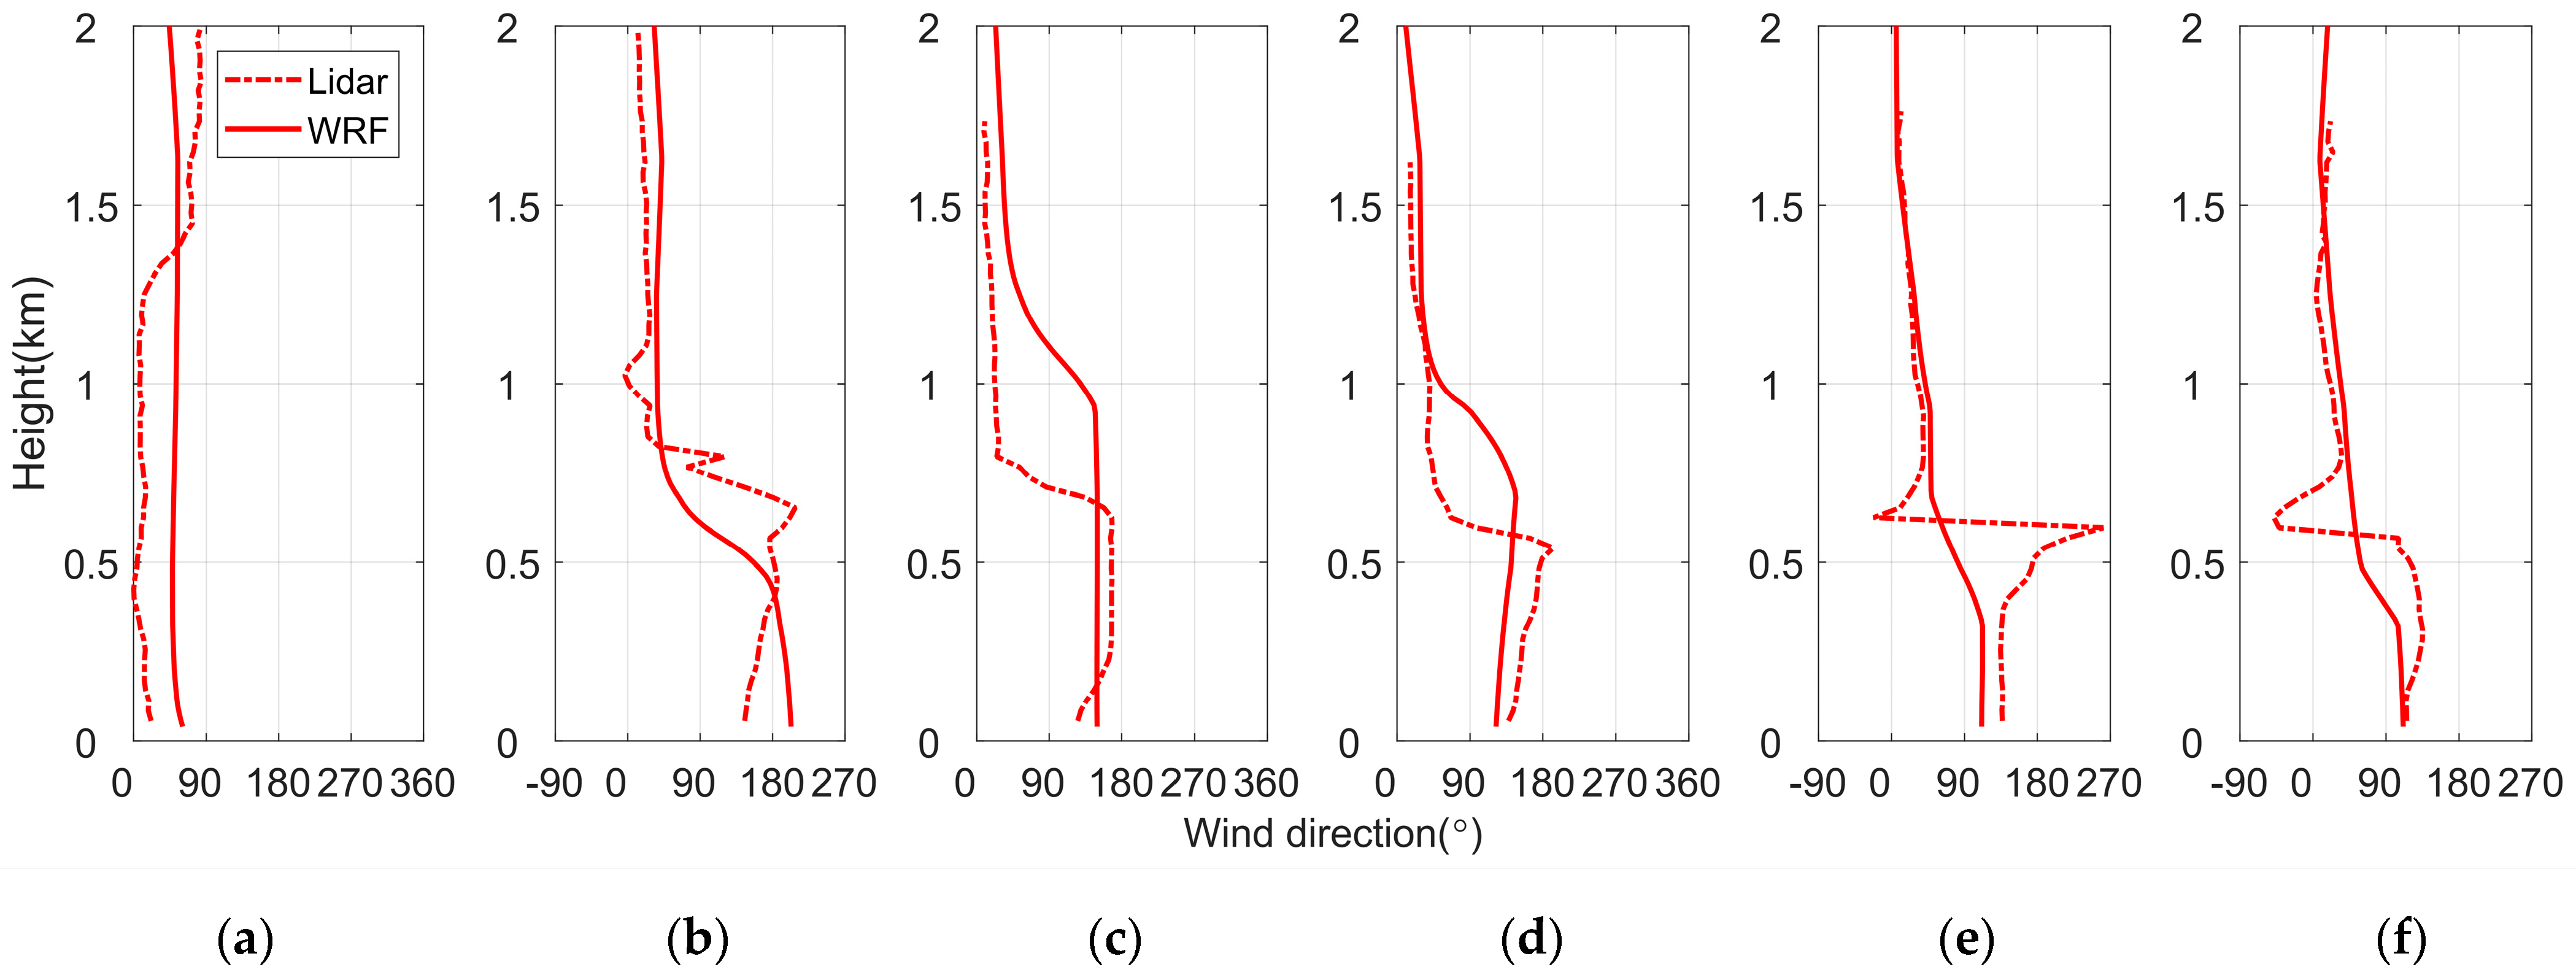
The simulation results of wind from WRF are validated using observations from lidar. Figure 7 and Figure 8 show the comparison of wind speed and wind direction between lidar observation and WRF at 17:00–22:00. Before the sea breeze appeared, the results of WRF were relatively accurate. At 18:00, the wind direction near the surface was SSW at the observation site from WRF, but the result of lidar was SE. The deviation of simulated wind direction decreases with the altitude increases. Therefore, the deviation near the surface may be caused by the complex underlying surface and the urban heat island effect. The sea breeze layer thickness simulated by WRF is about 400 m higher than the observation from 19:00 to 20:00, and the simulated thickness is lower than the observation at 22:00. As a result, the wind speed has large deviations at certain heights. The comparison results prove that WRF can simulate the evolution during the sea breeze. These deviations may be caused by limitations of the model parameterization schemes or the differences between the topography of the model and the actual environment of the experimental site.
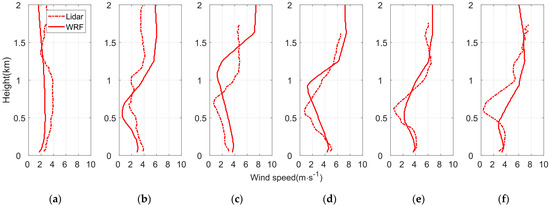
Figure 7.
Comparison of lidar measurements and WRF results in horizontal wind speed on 25 September 2019. (a) at 17:00 (b) at 18:00 (c) at 19:00 (d) at 20:00 (e) at 21:00 (f) at 22:00.
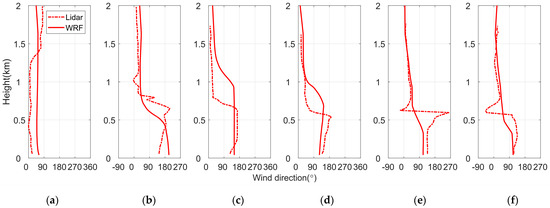
Figure 8.
Comparison of lidar measurements and WRF results in wind direction on 25 September 2019. (a) at 17:00 (b) at 18:00 (c) at 19:00 (d) at 20:00 (e) at 21:00 (f) at 22:00.
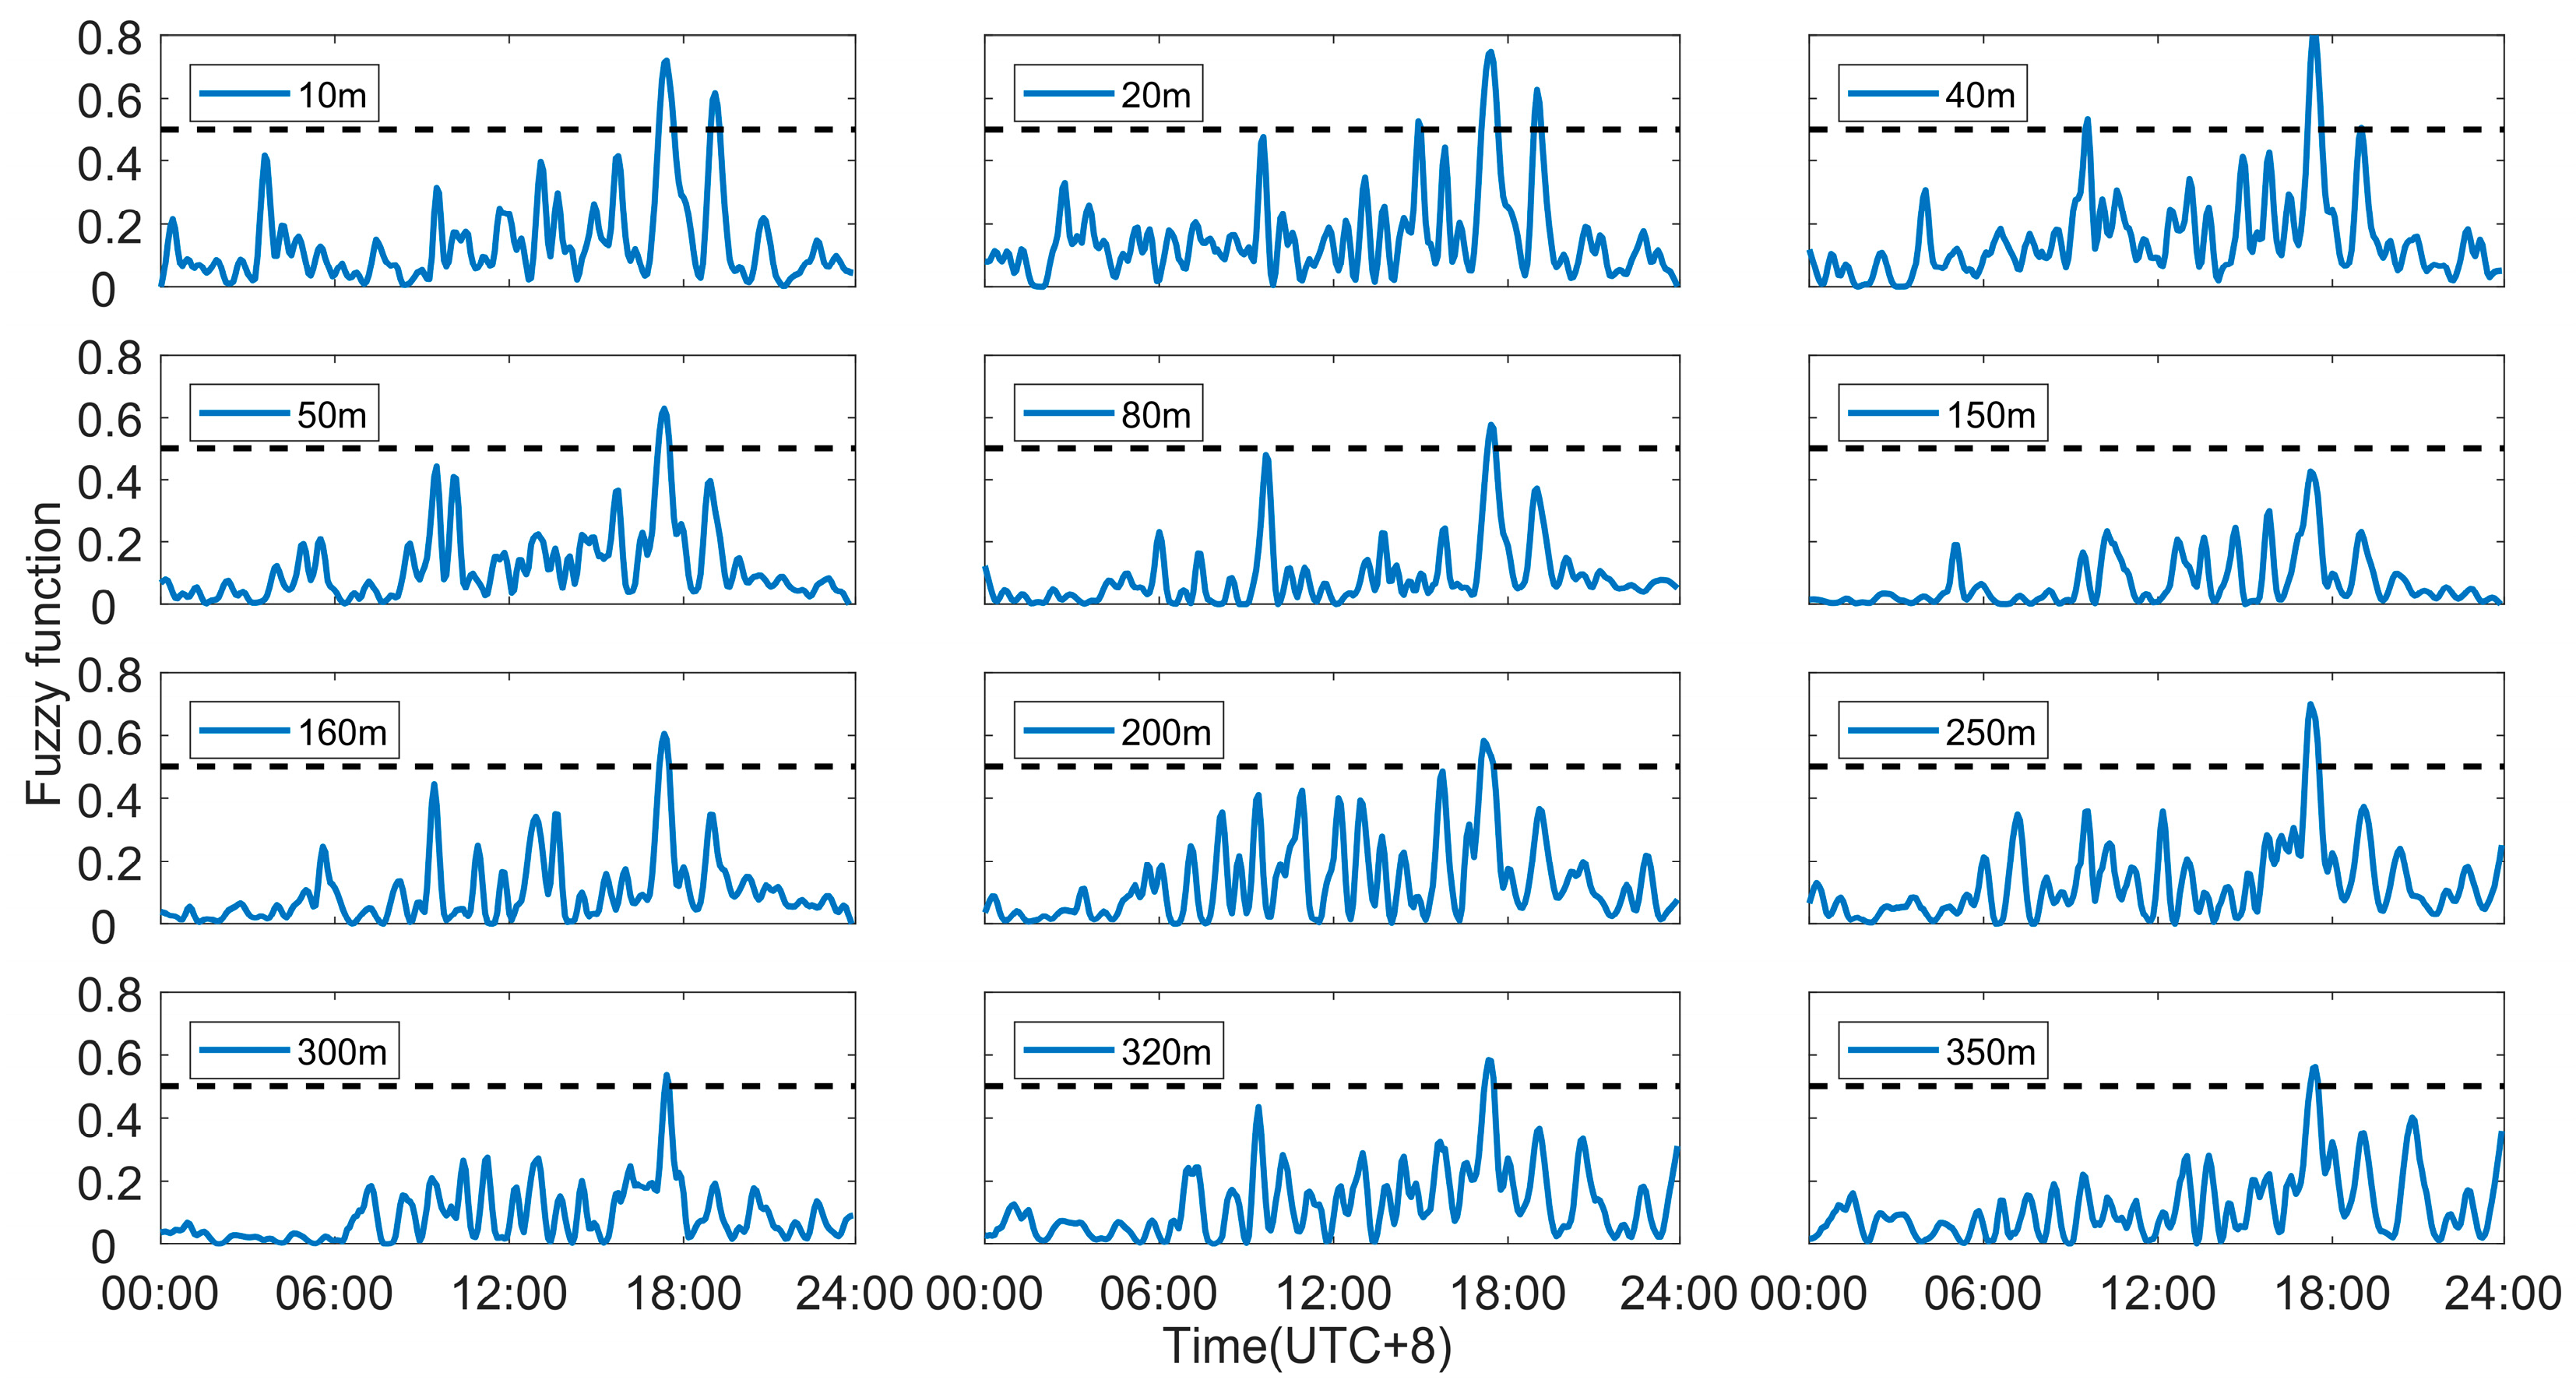
The identification of sea breeze front based on lidar wind profiles is susceptible to subjective factors, such as the delineation of sea breeze wind direction ranges and color code. The fuzzy logic front recognition technique is extended from ground-based automatic station data to apply to gradient tower meteorological data. In this way, the arrival of SBF in height-by-height is identified. Figure 9 shows the total fuzzy function of average weighted based on the four meteorological elements obtained on the tower. The maximum value of the function higher than the specific threshold is the arrival moment of the SBF. The threshold which is set to 0.5 in this article can avoid the misjudgment (other peaks) generated by the algorithm as far as possible, and accurately determine the arrival moment of the front. There are multiple peaks above the threshold at several heights (10 m, 20 m, and 40 m) and maximum values not reaching the threshold (150 m). Although the anemometers on the tower were limited to the surrounding experimental conditions (terrain and sub-bedding vegetation, etc.), the threshold still manages to isolate the outliers from background fluctuations at most heights. The arrival time of the SBF is identified at all altitudes, which can match the moment when the wind directions obtained by lidar changed drastically at 17:30.
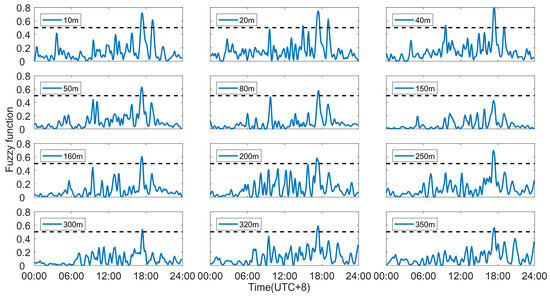
Figure 9.
The total fuzzy function of wind, temperature, and relative humidity elements at different heights on the tower on 25 September 2019.
3.2. Kelvin–Helmholtz Instability and Its Influence
At low static stability, the Kelvin–Helmholtz instability exists at the boundary of the sea breeze and the return flow. By tilting and restoring the two layers of fluids with different densities, Thorpe et al. [35] formed shear between fluids and observed KHBs in the laboratory. Using the lidar worked in the scanning mode of Plan Position Indicator (PPI) and Range Height Indicator (RHI), Nakane et al. [36] processed the volume extinction coefficient from lidar that characterized the aerosol concentration with the differential edge enhancement technique [37], and proved the Kelvin–Helmholtz instability caused the fluctuations of the aerosol concentration around the SBH.
The edge enhancement technology is a kind of image enhancement. It can highlight the edges where the values of adjacent pixels of the image differ greatly. As shown in the Equation (8):
Among them, represents the gradient of the pixels value in the middle pixel, is the average of three connected pixel values in the horizontal or vertical direction, and the coordinates of the pixels are . At the height of the boundary, the wind speed still has relatively large gradients when the sea breeze occurred, even though KHBs will erode the gradients of wind speed and make them smoother. The wind profiles are processed to separate the boundary using the edge enhancement technique, that is, the pixel value is the horizontal wind speed measured by the lidar. Figure 10 shows the normalized results. The structure above the front and whose height is higher than the general thickness of the sea breeze layer is the sea breeze head. Similar to the boundary between the sea breeze and the sea breeze return flow, the wind speed also has a relatively large gradient at the boundary between the top of the sea breeze head and the sea breeze return flow. The height of the SBH reached around 1100 m at 17:50, and the thickness of the sea breeze layer kept about 700 m from 18:00 to 20:30 and gradually decreased with time. The KHBs caused the dynamic inner boundary layer to oscillate in the height range of 650–850 m.

Figure 10.
Using edge enhancement technology for horizontal wind speed during the sea breeze penetration on 25 September 2019. (a) vertical direction; (b) horizontal direction.
Plant et al. [38] speculated gravity waves and Kelvin–Helmholtz instability caused the oscillations of near-surface meteorological data. Still, they did not verify this due to the lack of vertical observation. Figure 11 shows the spatiotemporal distribution of horizontal wind speed and the echo signal-to-noise ratio (SNR) of lidar. The boundary obtained by the edge enhancement technology separated the sea breeze and the high-altitude return flow. It overlapped with the region of the zero-velocity boundary layer, which shows dark blue in Figure 11a after the SBH. The spiral flow of the air in this region and fluctuated boundary height proved the influence of Kelvin–Helmholtz instability, and its influence could be transmitted down to the near-surface, such as in the region surrounded by the red box. The SNR of lidar also showed a trend of high and low oscillations. The SNR is related to the concentration of aerosol particles in the air. Because KHBs caused the air to oscillate up and down at the boundary, which affected the distribution of aerosol particles. Besides wind speed, the KHBs can also cause oscillations of temperature and humidity on the surface, but the effect on wind direction is not obvious.

Figure 11.
The influence of Kelvin–Helmholtz instability during the sea breeze penetration on 25 September 2019. (a) The oscillation of horizontal wind speed. The black line with circles represents the boundary between the sea breeze and the high-altitude return flow, the same later; (b) The SNR of lidar.
3.3. Turbulent Parameters and Sea Breeze
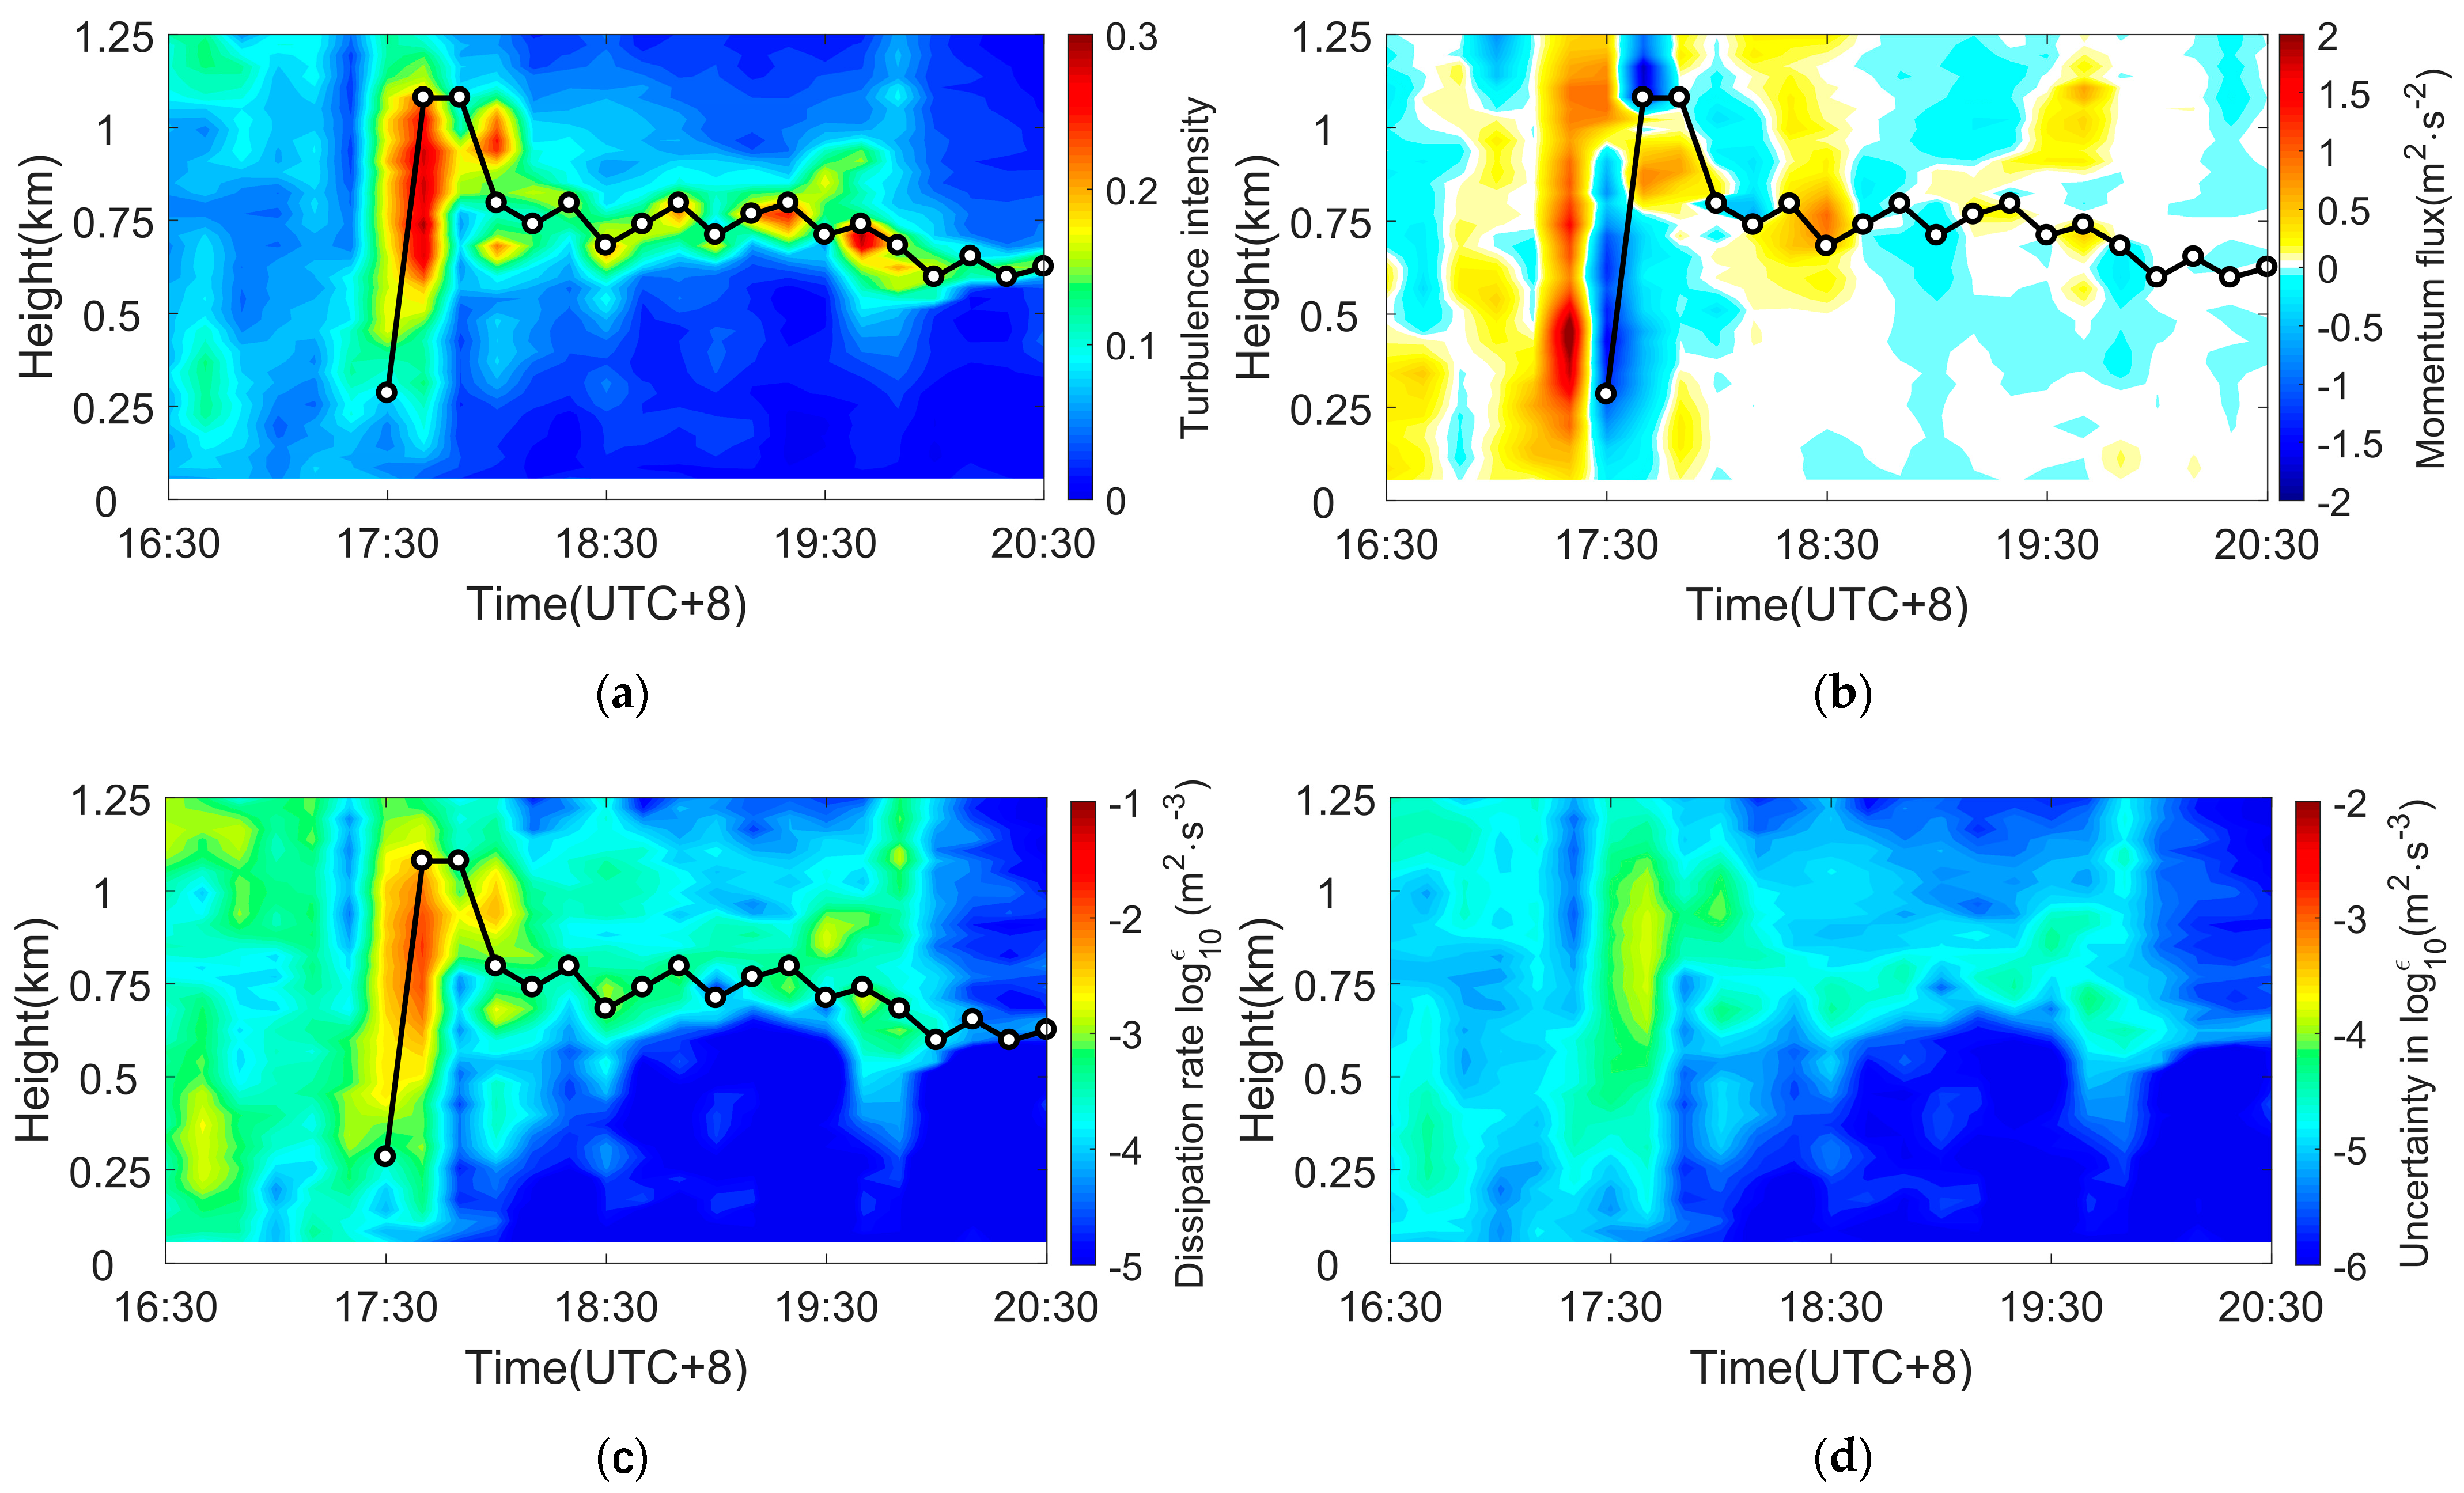
The sea breeze can cause changes in turbulent parameters within the ABL, and conversely, the turbulence will also affect the development of the sea breeze structure. Chiba et al. [39] analyzed the vertical airflow, turbulent dissipation rate, and wind shear at the near-surface when the SBF passed. Novitskii et al. [40] compared the turbulent characteristics in windless circulation and sea–land breeze circulation. Due to the limit of detection height, previous studies focused on the sea breeze and turbulence near the surface. The wind profiles obtained by Doppler lidar provide the possibility to study the interaction between the distribution of dynamic turbulence in the ABL with the sea breeze. Using the horizontal wind speed and vertical airflow speed obtained by Wind 3D6000, the turbulent movement and characteristics can be studied. Figure 12 shows the spatiotemporal distribution of turbulent parameters during the passage of the sea breeze. After the sea breeze front arrived, the wind direction changed from northeast to southeast, so the momentum flux will show obvious frontal features. and represent the fluctuation of the meridional wind speed and the vertical airflow speed , respectively. The fluctuation of the wind speed is obtained by making the difference with the 10-min average wind speed. After calculating , performing a 10-min averaging process to calculate .
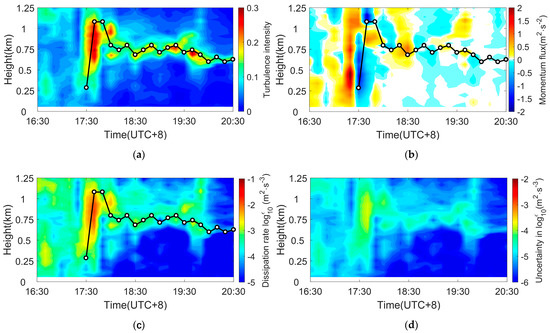
Figure 12.
Turbulent parameters during the sea breeze penetration on 25 September 2019. (a) the turbulent intensity; (b) the momentum flux (c) the turbulent dissipation rate; (d) the uncertainty in turbulent dissipation rate.
Turbulent intensity characterizes the intensity of wind pulsation. As KHBs transformed the laminar flow into turbulence, the turbulent intensity increased to 0.1–0.3, and the turbulent dissipation rate increased to 10−3–10−2 m2·s−3 at the height of KHBs occurrence. The terrain of the experiment site is relatively flat, so the turbulence in the vertical is mainly affected by thermal factors. Due to the strong solar radiation, the vertical convection was strong before the sea breeze arrived. Therefore, with the weakening of solar radiation, the turbulent intensity after the arrival of the sea breeze (0.01–0.05) was significantly lower than that was controlled by the land breeze (0.05–0.13). The temporal distribution characteristics of the dissipation rate also have consistent trends with the turbulent intensity. As the solar radiation weakened, the intensity of turbulent motion was significantly weakened. The turbulent dissipation rate was reduced from 10−4–10−2 m2·s−3 to 10−5–10−3 m2·s−3. Due to the dynamic factors at the front of the sea breeze, the maximum value of turbulent parameters appeared in the front. The magnitude of turbulent intensity could reach above 0.3, and the dissipation rate reached 0.1 m2·s−3.
3.4. Pollutants and Sea Breeze
There is a close connection between air pollution and the low-level circulation of the sea–land breeze. The mesoscale atmospheric diffusion models have shown great potential for studying sea breeze and local air quality issues. Ohashi et al. [41] used a Lagrangian particle model to explore the pollutant’s transport under the sea breeze. Perez et al. [42] used lidar to measure the backscattering of aerosols during the sea breeze and mountain-induced wind. They found that aerosols were injected into the return flow at different heights and finally formed an aerosol layer.
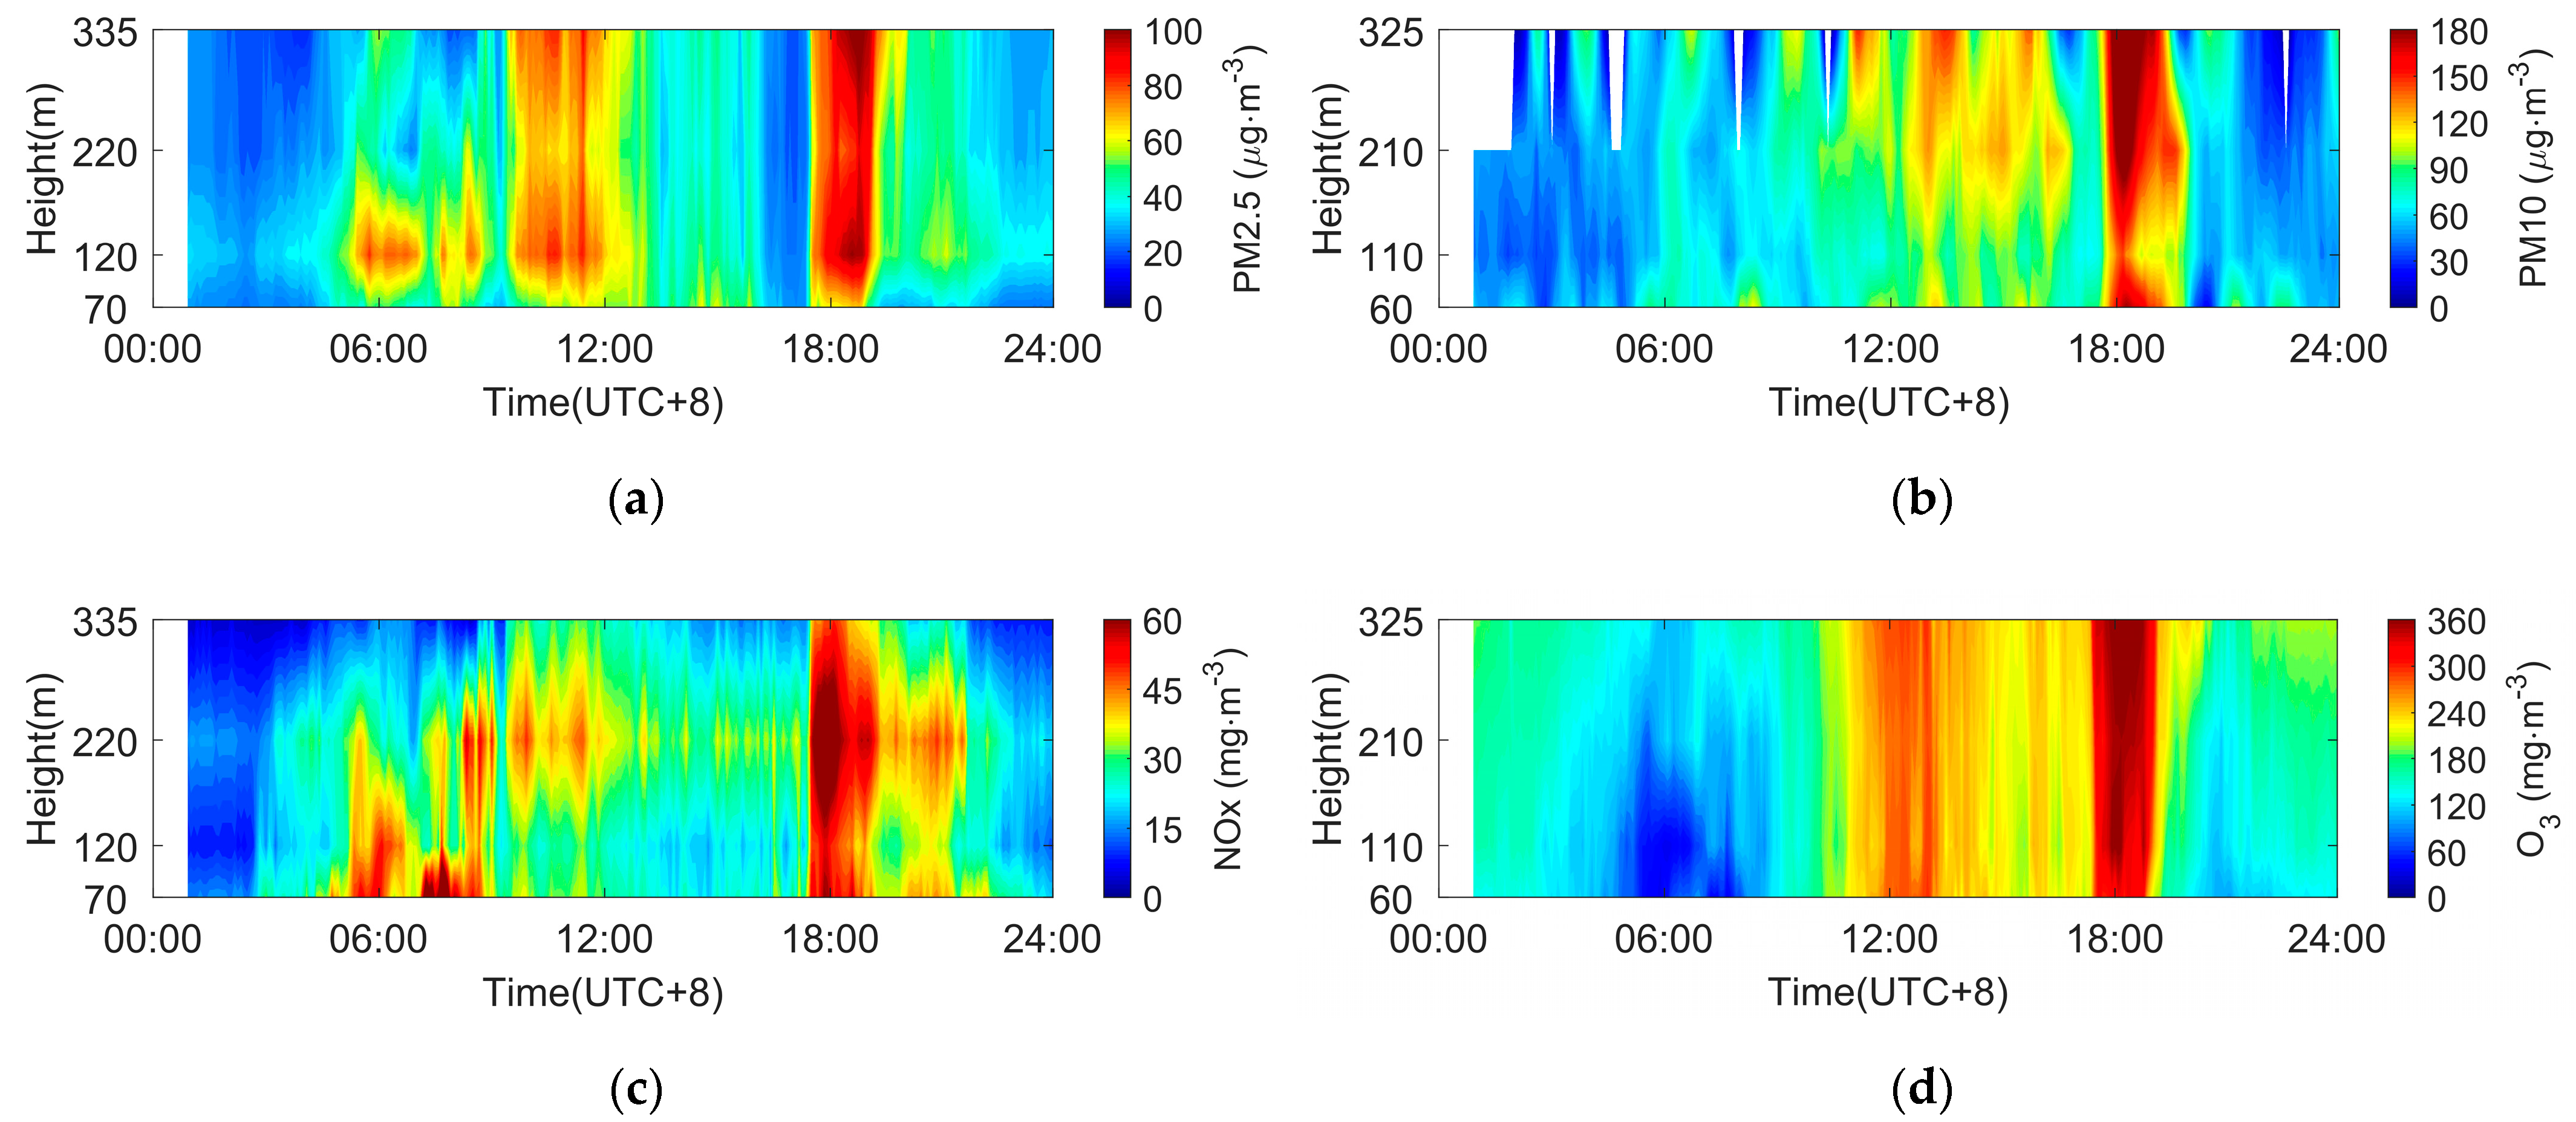
In terms of dynamics, the sea–land breeze affects the diffusion of pollutants by changing the wind speed and direction, which leads to obvious double peaks of pollutants concentration. Figure 13 shows the concentration of the pollutants at different heights on the tower. The concentration of pollutants such as PM2.5 and ozone present a clear bimodal, and the second peak occurred from 17:30 to 19:00, which was the period after the arrival of the SBF. From 4 to 17 o’clock, the pollutants were transported from the inland sources to the observation site. After the sea breeze occurred, the first sea breeze transported the pollutants gathered on the coast of Pearl River Estuary and ocean surface to the inland and gradually collected. At the same time, the land breeze continued to transport pollutants from land to the sea, which led to the continuous accumulation of pollutants on the front along with the convergent airflow. When the SBF passed the observation site at 17:30, the pollution at each height was severe. The hourly average concentration of PM2.5 reached 3 times (from 25 to 79 µg·m−3) more than the concentration before the SBF, and PM10 also reached 1.9 times (from 76 to 149 µg·m−3) than that before the SBF. Due to the convergence of airflow, ozone and ozone precursors accumulated at the SBF. Even though the solar radiation had become weak, the hourly average concentration of ozone at all heights reached 1.46 times (from 228 to 335 mg·m−3) more than the concentration before the SBF. The maximum ozone concentration (325 m at 18:10) reached 10 times (from 37 to 375 mg·m−3) the minimum concentration (110 m at 06:05) of the day.
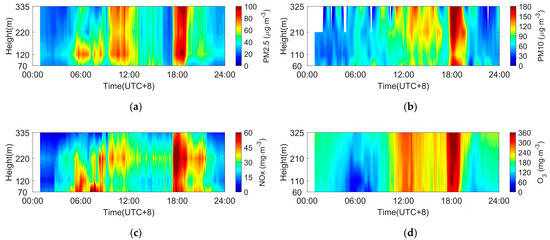
Figure 13.
The pollutants concentrations were obtained by sensors on the tower on 25 September 2019. (a) PM2.5; (b) PM10; (c) NOx; (d) O3.
The air motion discharged the pollutants to the high altitude, causing high altitude pollution incidents. The high-altitude hourly average ozone concentration (358 mg·m−3 at 325 m) at the SBF was higher than that near the surface (307 mg·m−3 at 60 m). After the sea breeze front passed, with the weakened solar radiation, the concentration of ozone precursors (NOx) behind the SBF was significantly higher than that in front of the SBF, which inhibited the generation of ozone. Therefore, the ozone concentration of the sea breeze was significantly lower than that of the land breeze near the surface.
Allwine et al. [43] proposed the local recirculation factor (RF), which measured the conveying capacity of wind. The RF is equal to the ratio of the vector distance to the scalar distance of the wind motion. It could characterize the local return of pollutants under the alternate control of sea–land breeze.
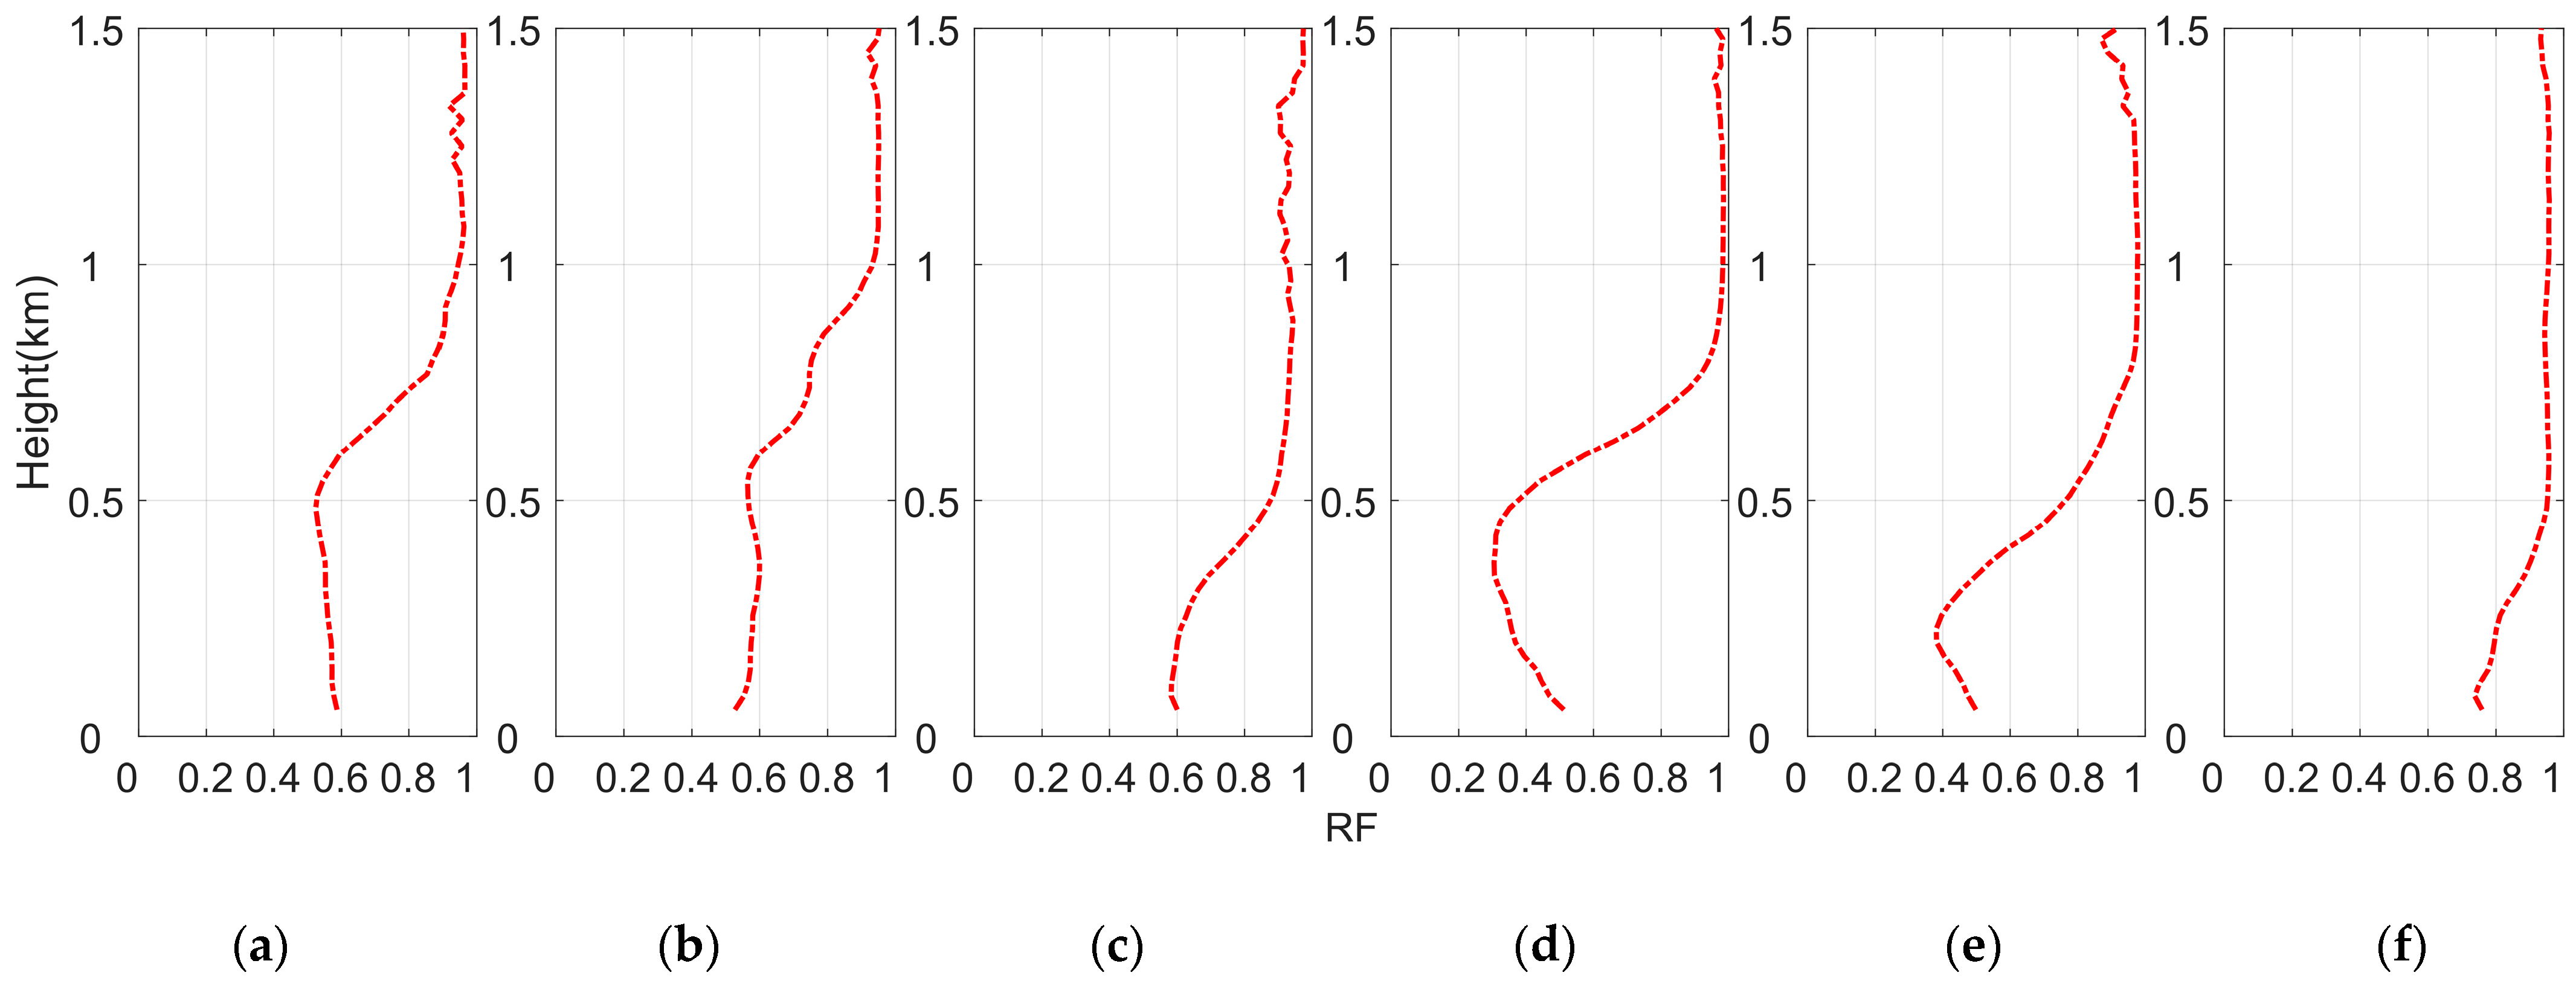
Among them, is the local recirculation factor. is the net displacement of the trajectory, which is the distance between the start-point with the end-point. is the scalar summation of transport distance according to the horizontal wind vectors. and are an hourly average zonal and meridional wind speed. As shown in Figure 14, the RF indexes from 25 to 30 September had similar characteristics. The RF was mainly distributed between 0.5–0.6 below 600 m on 25 September. Therefore, the effective transport capacity of low-level is poor under the influence of sea–land breeze, which is not conducive to the diffusion and transport of pollutants in the horizontal direction. The RF is above 0.9 above 750 m where the wind is mainly stable and straight conveying, which promotes the transportation of high-altitude pollutants. With the increase of the background wind field intensity (northeast wind), the sea breeze phenomenon weakened on 30 September. Compared with the sea breeze lasting about 11 h on 25 September, the sea breeze on 30 September lasted for a relatively shorter period, lasting only 5.5 h, and the rest of the time behaved as the offshore wind under the action of the background wind field. The values of RF are even above 0.7 at low altitudes, and the wind field has a strong capacity to transport pollutants out continuously.
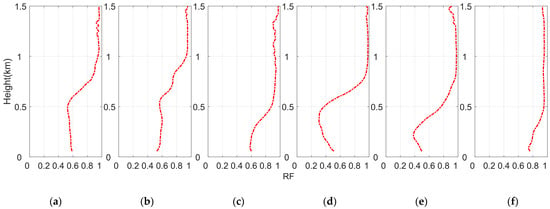
Figure 14.
The recirculation factor on 25–30 September 2019. (a) 25 September (b) 26 September (c) 27 September (d) 28 September (e) 29 September (f) 30 September.
4. Discussion
The local sea breeze appeared late and lasted until night during the test period, which is not in line with our experience. This situation may be due to the strong prevailing wind (northeast wind) suppressing and the urban heat island effect. The strong background wind delayed the development of the sea breeze circulation and prevented the intrusion of the sea breeze to land. The movement speed of the sea breeze front is slow, and the slope of it is large. The period for the sea breeze front completely passing over the lidar is about 12 min (17:27–17:39). The horizontal wind speed around the sea breeze front is about 2.6 m·s−1, so the distance of the horizontal movement of the front is about 1800 m. During this period, the height of the front observed by lidar changed by about 1050 m, from near the surface (50 m) to the top of the head of the sea breeze (1100 m). The overall slope of the sea breeze front is about 30 degrees. The arrival time of SBF below 350 m is around 17:30, which is identified by the fuzzy logic algorithm. The algorithm has successfully been extended from the surface to capture the arrival time of the sea breeze in the vertical direction. However, the rationality of the fuzzy function threshold setting still needs further studying. The degree of urbanization and industrialization is high in the Pearl River Delta. The urban heat island effect delayed surface cooling, which provided thermal support for the development of sea breeze and increased the advancing distance. Therefore, the temperature of the land might be still higher than that of the sea at night, which caused the sea breeze to last until night.
The sea breeze front arrives 50 min before sunset, so due to the difference in solar radiation factors, the turbulent parameter value in the sea breeze is lower than that of the land breeze. In front of and behind the SBF, the extreme values of turbulent parameters are mainly affected by dynamic factors. The air strongly mixed in front of the SBF with the sea breeze moving inland. In addition, the continuous heating of the ground made the near-surface airflow unstable, which formed swirling convection elements that rolled up at the SBH. It also caused the edge of the SBF to be towering. The height of the top of the sea breeze head is about 1100 m and is about 300 m higher than the thickness of the sea breeze layer. Due to the mutual blocking effect of the sea–land breeze, the airflows in front and behind the front were turned and resulted in large wind shear. Therefore, the maximum value of turbulent parameters appeared in the front.
Since the horizontal wind speed was small (the minimum value is 0.45 m·s−1) at the ZBL, the local maximum of turbulent intensity was coincident with the ZBL. At the height of the boundary layer, the maximum standard deviation of the vertical airflow speed is only 0.31 m·s−1, which is still smaller than the minimum value of horizontal wind speed. Therefore, even under strong convection conditions, the magnitude of turbulent intensity generally stays near 0.3 rather than tending to infinity. Unlike the usual turbulent intensity that decreases with the increase in altitude, the turbulent intensity after the arrival of the sea breeze first increased and then decreased with the altitude. What is more, The turbulent parameters exhibit large gradients at the boundary. The spatiotemporal distribution of the parameters proves the accuracy of boundary height based on the edge enhancement algorithm. In the vertical direction, the boundary divided the dissipation rate into two parts along. Due to the upward transportation of momentum flux, the dissipation rate inside the sea breeze is slightly lower than that of the sea breeze return flow.
The air movement and vertical structure near the SBF had a great impact on the transport of pollutants. The convergent airflow at the front led to the accumulation of pollutants. In addition, the sea breeze formed the updraft running through the entire air boundary layer at the front, which may promote the vertical transportation of contaminants. The maximum vertical speed could reach above 1 m·s−1. The air motion discharged the pollutants to the high altitude, causing high altitude pollution incidents. After the arrival of the sea breeze, the temperature inversion layer appears near 100 m. Due to the existence of temperature inversion, the atmospheric layer structure near the surface is more stable and the air convection movement is weakened. The static situation is not conducive to the diffusion of pollutants at low altitudes, so concentrations accumulate under the inverse thermosphere. The weak turbulent exchange in the vertical direction behind the sea breeze front is not conducive to the diffusion of low-level pollution to high-level.
5. Conclusions
Doppler lidar provides high-precision wind profiles for the study of sea breeze structure and turbulent characteristics. It makes up for the shortcomings of traditional observation instruments in terms of temporal and spatial resolution. This study uses lidar data, conventional meteorological data, and pollutant monitoring data on the tower to discuss the structural and turbulent characteristics of the sea breeze and the influence of the sea breeze on pollutants. The judgment of the arrival of the sea breeze front is no longer based on subjective factors, such as the division of wind direction, but a quantitative judgment is made using the fuzzy function of the weighted combination of wind, temperature, and relative humidity. This algorithm can also be applied to the gradient data on the tower, which expands the application area of this algorithm. The front inspection algorithm based on fuzzy logic accurately determines the arrival time of the SBF, which is consistent with the change time of wind direction profiles by lidar and the result from WRF.
The edge enhancement technology in image processing can identify the edges where the values of adjacent pixels show large differences. Similarly, the horizontal wind speed also has large differences above and below the dynamic inner boundary. Here, the pixel value in the image is the horizontal wind speed. The boundary between the sea breeze and the return flow can be viewed clearly. The thickness of the sea breeze layer and the height of the sea breeze head are also obtained from it. The fluctuated boundary height reveals the existence of the Kelvin–Helmholtz instability. The Kelvin–Helmholtz instability causes the spiral flow of the air at the boundary, where the turbulent intensity exhibits extreme values, and all turbulent parameters have large gradients. The aerosol particles entrained by the air fluctuate in the temporal and spatial distribution. These can be viewed from the wind profiles and the echo signal-to-noise ratio of lidar. The horizontal wind speed in spatial and temporal distribution verified that the influence of the Kelvin–Helmholtz instability could cause the oscillations of near-surface meteorological parameters by the downward transmission of momentum flux.
Studies have shown that the round-trip effect of the sea–land breeze at low altitude causes the cyclic of pollutants. The sea breeze can transport some air pollutants from the coast back to the inland it passes through. The time for the convergent airflow of the sea–land breeze to pass is closely consistent with the time when the high pollutant concentration appeared. Therefore, the pollutant concentrations have a sharp increase for a short time in the areas where the sea breeze front passed. After moving to the back of the sea breeze front, the pollutant concentrations tend to decrease. The sea breeze circulation has an important influence on the ozone pollution process. The convergent airflow of the sea–land breeze contributes to the accumulation of ozone and the ozone precursors. The ozone precursors gathered at the sea breeze front promote the ozone generation reaction, and the high concentration of ozone is transported to the middle and upper boundary layer by the updraft at the convergence zone. Under the control of the sea breeze, the magnitude of turbulent parameters is significantly smaller than that under the land breeze, which is mainly caused by solar radiation. The turbulent motion in the vertical direction is weakened after the sea breeze arrived, which is not conducive to the diffusion of low-level atmospheric pollution to high altitudes. The research on the internal connection between sea breeze and pollutants will promote the establishment of an early warning for urban pollution and also provide references for formulating effective pollution reduction strategies.
Author Contributions
Conceptualization, X.S. and J.L.; methodology, J.L. and X.S.; software, J.L.; formal analysis, J.L.; data curation, J.L., W.L., Y.F., L.Y. and M.Z.; writing—original draft preparation, J.L.; writing—review and editing, X.S.; project administration, X.S.; funding acquisition, X.S. All authors have read and agreed to the published version of the manuscript.
Funding
This research was jointly supported by the National Key and Development Program of China (2018YFC0213101, 2016YFC1400905); National Natural Science Foundation of China (NSFC, No. 61775200).
Data Availability Statement
Due to confidentiality agreements, supporting data can only be made available to bona fide researchers subject to a non-disclosure agreement. To get the data please contact to songxq@ouc.edu.cn at Ocean University of China. The public available datasets can be found from the link: https://rda.ucar.edu/datasets/ds083.3/ (accessed on 28 November 2021).
Acknowledgments
The authors gratefully acknowledge NCEP/NCAR for the provision of the Weather Research and Forecasting (WRF) Model and acknowledge the Meteorological Bureau of Shenzhen Municipality and Meteorological Observation Center of China Meteorological Administration for equipment provision and venue support.
Conflicts of Interest
The authors declare no conflict of interest.
References
- Miller, S.; Keim, B.D.; Talbot, R.W.; Mao, H. Sea breeze: Structure, forecasting, and impacts. Rev. Geophys. 2003, 41, 1011. [Google Scholar] [CrossRef]
- Simpson, J.E. Sea Breeze and Local Wind; Cambridge University: New York, NY, USA, 1969; 234p. [Google Scholar]
- Miao, J.; Yang, M. A modeling study of the severe afternoon thunderstorm event at Taipei on 14 June 2015: The roles of sea breeze, microphysics, and terrain. J. Meteorol. Soc. Jpn. 2020, 98, 129–152. [Google Scholar] [CrossRef]
- Laird, N.F.; Kristovich, D.; Rauber, R.M.; Ochs, H.T.; Miller, L.J. The Cape-Canaveral sea and river breezes-kinematic structure and convective initiation. Mon. Weather Rev. 1995, 123, 2942–2956. [Google Scholar] [CrossRef]
- Steele, C.J.; Dorling, S.R.; von Glasow, R.; Bacon, J. Modelling sea-breeze climatologies and interactions on coasts in the southern North Sea: Implications for offshore wind energy. Q. J. R. Meteorol. Soc. 2015, 141, 1821–1835. [Google Scholar] [CrossRef]
- Wilczak, J.M.; Gossard, E.E.; Neff, W.D.; Eberhard, W.L. Ground-based remote sensing of the atmospheric boundary layer: 25 years of progress. Bound.-Layer Meteorol. 1996, 78, 321–349. [Google Scholar] [CrossRef]
- Lin, C.; Chen, F.; Huang, J.C.; Chen, W.C.; Liou, Y.A.; Chen, W.N.; Liu, S. Urban heat island effect and its impact on boundary layer development and land-sea circulation over northern Taiwan. Atmos. Environ. 2008, 42, 5635–5649. [Google Scholar] [CrossRef]
- Clappier, A.; Martilli, A.; Grossi, P.; Thunis, P.; Pasi, F.; Krueger, B.C.; Calpini, B.; Graziani, G.; van den Bergh, H. Effect of sea breeze on air pollution in the Greater Athens Area. Part I: Numerical simulations and field observations. J. Appl. Meteorol. 2000, 39, 546–562. [Google Scholar] [CrossRef]
- Yoshikado, H. Statistical analyses of the sea breeze pattern in relation to general weather conditions. J. Meteorol. Soc. Jpn. 1981, 59, 98–107. [Google Scholar] [CrossRef][Green Version]
- Papanastasiou, D.K.; Melas, D. Climatology and impact on air quality of sea breeze in an urban coastal environment. Int. J. Climatol. 2009, 29, 305–315. [Google Scholar] [CrossRef]
- Wang, T.; Poon, C.N.; Kwok, Y.H.; Li, Y.S. Characterizing the temporal variability and emission patterns of pollution plumes in the Pearl River Delta of China. Atmos. Environ. 2003, 37, 3539–3550. [Google Scholar] [CrossRef]
- Lo, J.C.F.; Lau, A.K.H.; Chen, F.; Fung, J.C.H.; Leung, K.K.M. Urban modification in a mesoscale model and the effects on the local circulation in the Pearl River Delta region. J. Appl. Meteorol. Climatol. 2007, 46, 457–476. [Google Scholar] [CrossRef]
- Augustin, P.; Billet, S.; Crumeyrolle, S.; Deboudt, K.; Dieudonne, E.; Flament, P.; Fourmentin, M.; Guilbaud, S.; Hanoune, B.; Landkocz, Y.; et al. Impact of sea breeze dynamics on atmospheric pollutants and their toxicity in industrial and urban coastal environments. Remote Sens. 2020, 12, 648. [Google Scholar] [CrossRef]
- Qingdao Leice Transient Technology Co., Ltd. Available online: http://www.leice-lidar.com/en/index.html (accessed on 21 May 2021).
- Skamarock, W.C.; Klemp, J.B.; Dudhia, J.; Gill, D.O.; Barker, D.M.; Duda, M.G.; Huang, X.Y.; Wang, W.; Powers, J.G. A Description of the Advanced Research WRF Version 3. NCAR Tech Notes-475+STR. 2008. Available online: https://opensky.ucar.edu/islandora/object/technotes:500 (accessed on 1 October 2020).
- Papanastasiou, D.K.; Melas, D.; Lissaridis, I. Study of wind field under sea breeze conditions; an application of WRF model. Atmos. Res. 2010, 98, 102–117. [Google Scholar] [CrossRef]
- Arrillaga, J.A.; Yague, C.; Sastre, M.; Roman-Cascon, C. A characterisation of sea-breeze events in the eastern Cantabrian coast (Spain) from observational data and WRF simulations. Atmos. Res. 2016, 181, 265–280. [Google Scholar] [CrossRef]
- Zhu, K.; Xie, M.; Wang, T.; Cai, J.; Li, S.; Feng, W. A modeling study on the effect of urban land surface forcing to regional meteorology and air quality over South China. Atmos. Environ. 2017, 152, 389–404. [Google Scholar] [CrossRef]
- Liu, Y.; Hong, Y.; Fan, Q.; Wang, X.; Chan, P.; Chen, X.; Lai, A.; Wang, M.; Chen, X. Source-receptor relationships for PM2.5 during typical pollution episodes in the Pearl River Delta city cluster, China. Sci. Total Environ. 2017, 596, 194–206. [Google Scholar] [CrossRef]
- Lin, Y.; Farley, R.; Orville, H. Bulk parameterization of the snow field in a cloud model. J. Appl. Meteorol. 1983, 22, 1065–1092. [Google Scholar] [CrossRef]
- Mlawer, E.J.; Taubman, S.J.; Brown, P.D.; Iacono, M.J.; Clough, S.A. Radiative transfer for inhomogeneous atmospheres: RRTM, a validated correlated-k model for the longwave. J. Geophys. Res. Atmos. 1997, 102, 16663–16682. [Google Scholar] [CrossRef]
- Kim, H.; Wang, B. Sensitivity of the WRF model simulation of the East Asian summer monsoon in 1993 to shortwave radiation schemes and ozone absorption. Asia-Pac. J. Atmos. Sci. 2011, 47, 167–180. [Google Scholar] [CrossRef]
- Janjić, Z.I. The step-mountain eta coordinate model: Further developments of the convection, viscous sublayer, and turbulence closure schemes. Mon. Weather Rev. 1994, 122, 927–945. [Google Scholar] [CrossRef]
- Chen, F.; Dudhia, J. Coupling an advanced land surface–hydrology model with the Penn State–NCAR MM5 modeling system. Part I: Model implementation and sensitivity. Mon. Weather Rev. 2001, 129, 569–585. [Google Scholar] [CrossRef]
- Janjic, Z.I. The surface layer in the NCEP Eta Model. In Proceedings of the Eleventh Conference on Numerical Weather Prediction, Norfolk, VA, USA, 19–23 August 1996; American Meteorological Society: Boston, MA, USA, 1996; pp. 354–355. [Google Scholar]
- Grell, G.A.; Dévényi, D. A generalized approach to parameterizing convection combining ensemble and data assimilation techniques. Geophys. Res. Lett. 2002, 29, 38-1–38-4. [Google Scholar] [CrossRef]
- Wakimoto, R.M.; Atkins, N.T. Observations of the sea-breeze front during CaPE. Part I: Single-Doppler, satellite, and cloud photogrammetry analysis. Mon. Weather Rev. 1994, 122, 1092–1114. [Google Scholar] [CrossRef][Green Version]
- Alpert, P.; Rabinovich-Hadar, M. Pre- and post-sea-breeze frontal lines—A meso-γ-scale analysis over south Israel. J. Atmos. Sci. 2003, 60, 2994–3008. [Google Scholar] [CrossRef]
- Coceal, O.; Bohnenstengel, S.I.; Kotthaus, S. Detection of sea-breeze events around London using a fuzzy-logic algorithm. Atmos. Sci. Lett. 2018, 19, e846. [Google Scholar] [CrossRef]
- Shimada, S.; Goit, J.P.; Ohsawa, T.; Kogaki, T.; Nakamura, S. Coastal wind measurements using a single scanning lidar. Remote Sens. 2020, 12, 1347. [Google Scholar] [CrossRef]
- Smalikho, I.N.; Banakh, V.A. Effect of wind transport of turbulent inhomogeneities on estimation of the turbulence energy dissipation rate from measurements by a conically scanning coherent Doppler lidar. Remote Sens. 2020, 12, 2802. [Google Scholar] [CrossRef]
- O’Connor, E.J.; Illingworth, A.J.; Brooks, I.M.; Westbrook, C.D.; Hogan, R.J.; Davies, F.; Brooks, B.J. A method for estimating the turbulent kinetic energy dissipation rate from a vertically pointing Doppler lidar, and independent evaluation from balloon-borne in situ measurements. J. Atmos. Ocean. Technol. 2010, 27, 1652–1664. [Google Scholar] [CrossRef]
- Bodini, N.; Lundquist, J.; Newsom, R. Estimation of turbulence dissipation rate and its variability from sonic anemometer and wind Doppler lidar during the XPIA field campaign. Atmos. Meas. Tech. Discuss. 2018, 11, 4291–4308. [Google Scholar] [CrossRef]
- Wildmann, N.; Bodini, N.; Lundquist, J.K.; Bariteau, L.; Wagner, J. Estimation of turbulence dissipation rate from Doppler wind lidars and in situ instrumentation for the Perdigao 2017 campaign. Atmos. Meas. Tech. 2019, 12, 6401–6423. [Google Scholar] [CrossRef]
- Thorpe, S.A. A method of producing a shear flow in a stratified fluid. J. Fluid Mech. 1968, 32, 693–704. [Google Scholar] [CrossRef]
- Nakane, H.; Sasano, Y. Structure of a sea-breeze front revealed by scanning lidar observation. J. Meteor. Soc. Jpn. 1986, 64, 787–792. [Google Scholar] [CrossRef]
- Sasano, Y.; Shimizu, H.; Takeuchi, N. Convective cell structures revealed by Mie laser radar observations and image data processing. Appl. Opt. 1982, 21, 3166–3169. [Google Scholar] [CrossRef]
- Plant, R.S.; Keith, G.J. Occurrence of Kelvin-Helmholtz billows in sea-breeze circulations. Bound.-Layer Meteorol. 2007, 122, 1–15. [Google Scholar] [CrossRef]
- Chiba, O. The turbulent characteristics in the lowest part of the sea-breeze front in the atmospheric surface-layer. Bound.-Layer Meteorol. 1993, 65, 181–195. [Google Scholar] [CrossRef]
- Novitskii, M.A.; Gaitandzhiev, D.E.; Mazurin, N.F.; Matskevich, M.K. Turbulence characteristics in the coastal zone with breeze circulation. Russ. Meteorol. Hydrol. 2011, 36, 580–589. [Google Scholar] [CrossRef]
- Ohashi, Y.; Kida, H. Local circulations developed in the vicinity of both coastal and inland urban areas: A numerical study with a mesoscale atmospheric model. J. Appl. Meteorol. 2002, 41, 30–45. [Google Scholar] [CrossRef]
- Perez, C.; Sicard, M.; Jorba, O.; Comeron, A.; Baldasano, J.M. Summertime re-circulations of air pollutants over the north-eastern Iberian coast observed from systematic earlinet lidar measurements in Barcelona. Atmos. Environ. 2004, 38, 3983–4000. [Google Scholar] [CrossRef]
- Allwine, K.J.; Whiteman, C.D. Single-station integral measures of atmospheric stagnation, recirculation and ventilation. Atmos. Environ. 1994, 28, 713–721. [Google Scholar] [CrossRef]
Publisher’s Note: MDPI stays neutral with regard to jurisdictional claims in published maps and institutional affiliations. |
© 2022 by the authors. Licensee MDPI, Basel, Switzerland. This article is an open access article distributed under the terms and conditions of the Creative Commons Attribution (CC BY) license (https://creativecommons.org/licenses/by/4.0/).

