Abstract
The leaf area index (LAI) is of great significance for crop growth monitoring. Recently, unmanned aerial systems (UASs) have experienced rapid development and can provide critical data support for crop LAI monitoring. This study investigates the effects of combining spectral and texture features extracted from UAS multispectral imagery on maize LAI estimation. Multispectral images and in situ maize LAI were collected from test sites in Tongshan, Xuzhou, Jiangsu Province, China. The spectral and texture features of UAS multispectral remote sensing images are extracted using the vegetation indices (VIs) and the gray-level co-occurrence matrix (GLCM), respectively. Normalized texture indices (NDTIs), ratio texture indices (RTIs), and difference texture indices (DTIs) are calculated using two GLCM-based textures to express the influence of two different texture features on LAI monitoring at the same time. The remote sensing features are prescreened through correlation analysis. Different data dimensionality reduction or feature selection methods, including stepwise selection (ST), principal component analysis (PCA), and ST combined with PCA (ST_PCA), are coupled with support vector regression (SVR), random forest (RF), and multiple linear regression (MLR) to build the maize LAI estimation models. The results reveal that ST_PCA coupled with SVR has better performance, in terms of the VIs + DTIs (R2 = 0.876, RMSE = 0.239) and VIs + NDTIs (R2 = 0.877, RMSE = 0.236). This study introduces the potential of different texture indices for maize LAI monitoring and demonstrates the promising solution of using ST_PCA to realize the combining of spectral and texture features for improving the estimation accuracy of maize LAI.
1. Introduction
The leaf area index (LAI), which is defined as the ratio of one-sided leaf area per unit of ground area [1], is closely related to the respiration, transpiration, and photosynthesis of vegetation [2,3,4,5]. An accurate estimation of LAI is of great significance for monitoring crop growth, health, and yield prediction [6,7,8]. Traditional LAI monitoring methods require destructive sampling, which is time-consuming and labor-intensive [9,10]. The remote sensing inversion method can realize the non-destructive, fast, and accurate LAI estimation [11,12]. Satellite platforms, which can obtain spectral information for a wide range of ground objects, have been widely applied in crop LAI monitoring in recent years [13,14]. For example, Landsat-8 OLI satellite image data have been used for LAI estimations of tropical forests in India [15]. Mao et al. [16], based on the Sentinel-2 satellite image data, compared the differences of different machine learning algorithms for cotton LAI inversion. However, effective management during the crop growing season requires large amounts of timely and multi-temporal data, whereas satellites are limited by weather and revisit cycles [17]. Thus, data obtained from satellites are difficult to be applied to high temporal and spatial resolution vegetation LAI estimation [18].
The unmanned aerial system (UAS) is increasingly used for crop monitoring due to its flight flexibility and diverse sensor settings [19]. UASs can obtain remote sensing imagery of crops with a high temporal and spatial resolution, and achieve accurate image acquisition with less impact of clouds during the critical growth period [20]. Vegetation indices (VIs) have been proved to be an effective method for extracting spectral features of remote sensing images [21]. Zhou and Jiang [22] carried out maize LAI inversion based on hyperspectral data and found that the ratio spectral vegetation index had the best comprehensive performance. Tunca et al. [23] used the normalized differential vegetation index (NDVI) extracted from UAS multi-spectral imagery to estimate sunflower LAI, obtaining high accuracy (R2 = 0.91). However, the spectral reflectance and VIs of optical data tend to be saturated when the density of canopy leaves is high [24].
In essence, the spectral information contained in multispectral remote sensing images is limited [25]. In addition to spectral features, UAS images also have many texture features related to crop growth information. The texture features of the image can describe the spatial correlation of pixels, reflecting the change of vegetation structure [26]. Texture features have been used in the estimation of vegetation LAI; for example, Duan et al. [21] developed a rice LAI monitoring method based on the Fourier spectrum texture features of UAS images and analyzed the correlation between the Fourier spectrum texture and LAI. Their research results showed that the Fourier spectrum texture could effectively improve the estimation accuracy of rice LAI. Zhang et al. [27] found that combining the VIs, color indices and texture features of fixed-wing UAS images could improve the estimation performance of wheat LAI and leaf dry matter. However, to date, limited research has been carried out to comprehensively evaluate the performance of combining spectral and texture information of UAS multispectral imagery for maize LAI monitoring.
To make full use of the comprehensive information in remote sensing data, applying a multivariate regression algorithm is an essential approach for establishing the relationship between remote sensing features and crop growth parameters [28,29,30], including multiple linear regression (MLR), support vector regression (SVR), and random forest (RF). However, the potential multicollinearity among multiple variables is still an issue in multivariate regression [31]. Consequently, Li et al. [32] have adopted the principal component analysis (PCA) method to reduce the dimension of the predictor space in rice LAI estimation. Meanwhile, the stepwise selection (ST) approach has been proved to be an effective technique for predictor screening [33]. In light of the above, ST and PCA are combined to further reduce the multicollinearity between VIs and texture features.
In this study, the main objectives were (1) to determine the quantitative relationships between maize LAI and remote sensing variables (i.e., VIs and texture features), (2) to evaluate the combination of VIs and texture features in estimating maize LAI with different multiple regression methods (i.e., MLR, SVR, and RF) and explore the impact of data dimensionality reduction and feature selection (i.e., PCA, ST, and ST_PCA) on LAI estimation, and (3) to explore the influence of different types of texture features combined with VIs on LAI estimation. This study provided a reference for effectively combining texture features with VIs and exploring the influence of texture features on maize LAI estimation.
2. Materials and Methods
2.1. Experimental Site
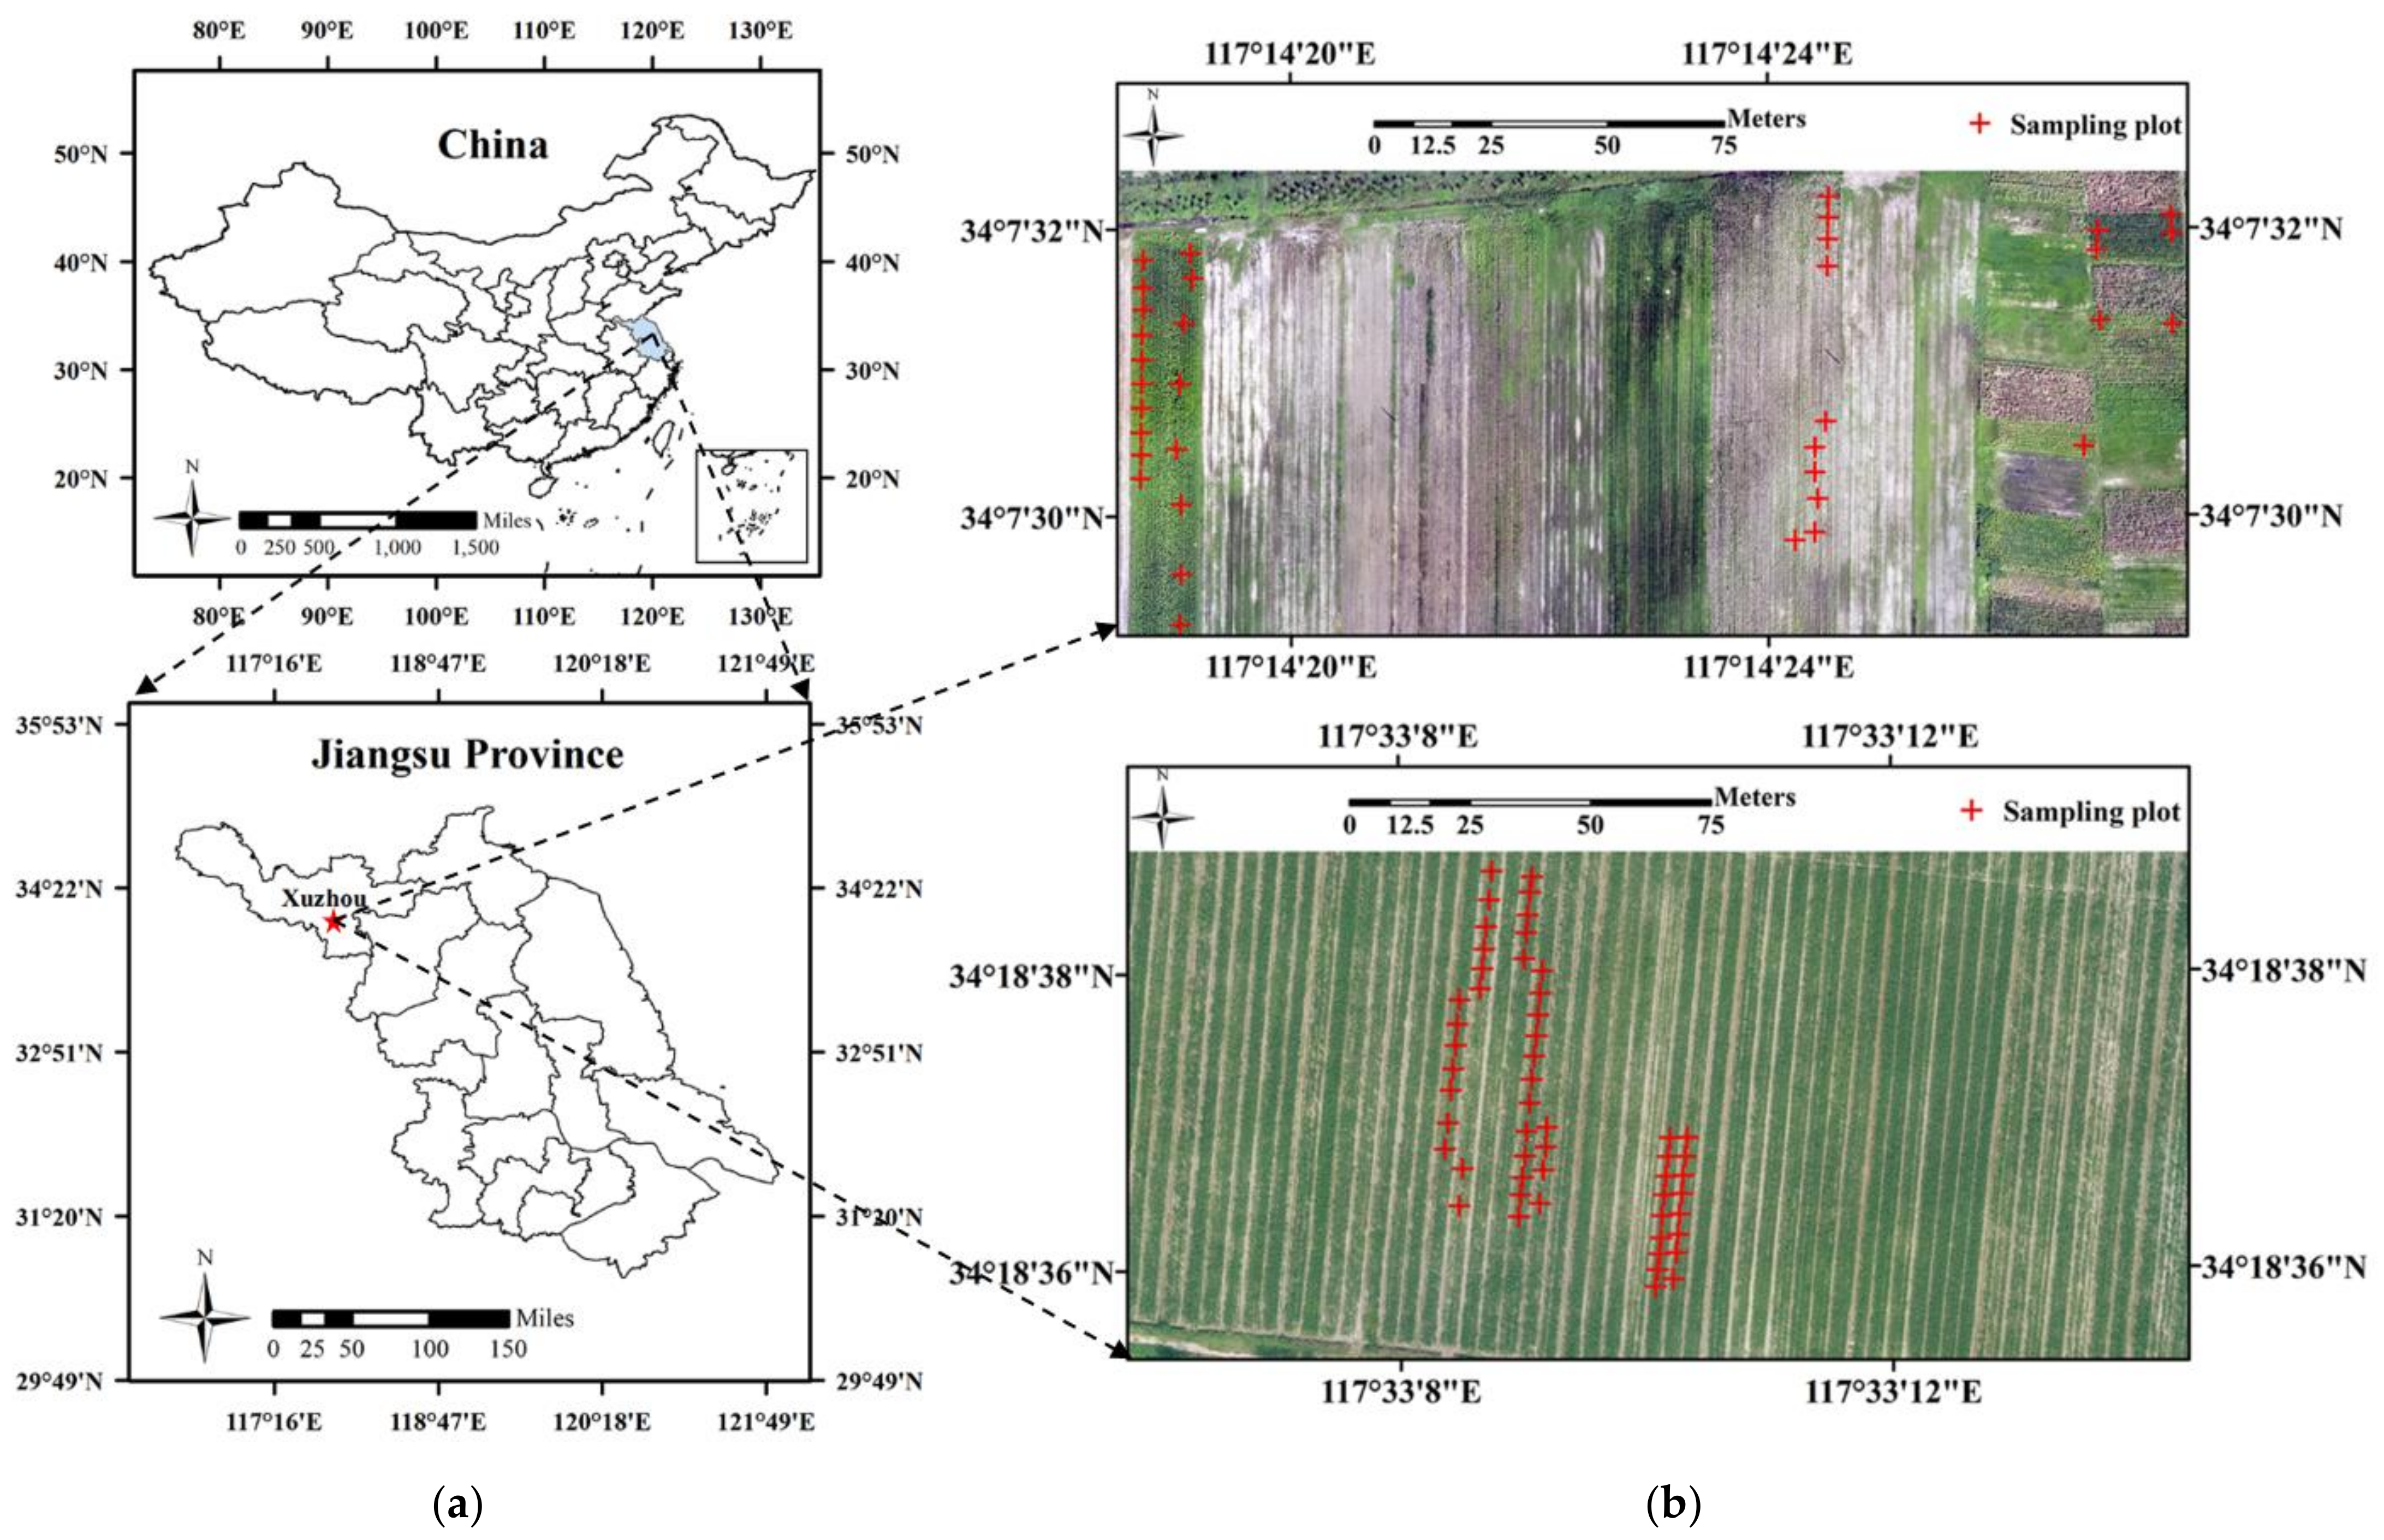
The study sites were located in the fields around Tongshan, Xuzhou, Jiangsu Province, China (117°34′22″ E, 34°13′58″ N, 30 m above sea level; see Figure 1a). The research area is flat with the temperate monsoon climate, and the main crop in the field was maize.

Figure 1.
(a) Location of the experimental farm in this study and (b) general situation of some experimental fields and the distribution of LAI ground sampling points.
2.2. UAS-Based Image Acquisition and LAI Measurements
In this study, a multi-rotor UAS—a DJI Innovations 4 multispectral version (DJI-Innovations Inc., Shenzhen, China)—was used to acquire multispectral imagery at four pre-determined growth stages (see Table 1). The multispectral DJI Innovations 4 camera consists of a 2-megapixel (1600 × 1300) true-color camera (Visible light; R, G, B) and five multi-spectral sensors (see Table 2). All UAS images were obtained from 11:00 am to 2:00 pm on sunny days with sufficient sunshine and low wing speed. The UAS was automatically flown controlled by the DJI GS Pro station application with 75% forward overlap and 60% side overlap. The multispectral UAS images were obtained with a ground resolution of 5.4 cm at a flight altitude of 100 m.

Table 1.
Summary of field experiments.
Table 2.
Multispectral image acquisition system parameters.
The in situ LAI data were indirectly measured by an LAI-2200C (Li-Cor, Inc., Lincoln, NE, USA) on the same day when the multispectral images were taken (Table 1). For row crops, measurements were taken at each sampling location, with one reading taken above and ten readings below the canopy (depending on the density of maize) [34]. The mean value of the measurement results was taken as the LAI of the plot, and the GPS information of the central position of each quadrat was recorded (see Figure 1b). The LAI-2200C was operated at sunset, in order to avoid direct sunlight, thus obtaining more uniform illumination conditions [35]. Large-angle masking was selected for measurement in a few cases with poor illumination conditions, and scattering correction was carried out using the LI-COR FV2200 software (v2.1) to achieve the final LAI measurements.
2.3. Vegetation Index (VI) Calculation
Six published optical VIs were calculated, according to the formulas listed in Table 3, which have been widely used in the estimation of key parameters of crops [36,37,38].
Table 3.
Definition of the selected VIs.
2.4. Texture Analysis
A common statistical analysis method, the gray-level co-occurrence matrix (GLCM) [45], was used to extract the texture features of the UAS multispectral images. The GLCM provides gray direction, interval variation, and speed information related to an image, but cannot directly provide the characteristics to distinguish textures, so it is necessary to extract the statistical attributes used to quantitatively describe texture features based on the GLCM. Seven GLCM-based texture features, including energy (ENE), contrast (CON), entropy (ENT), variance (VAR), mean (MEA), homogeneity function (HOM), and dissimilarity (DIS), were calculated for each plot and each band of the multispectral images. To obtain the texture features with the highest correlation to the ground-measured LAI, we calculated the correlation between the LAI and GLCM-based texture features, extracted under the sliding window size of 7 × 7 pixels with varying steps (2, 4, 6, 8), angles (0, π/4, π/2, 3π/4), and image bands (B, G, R, RE, NIR). Meanwhile, in order to express the influence of two different texture features on LAI monitoring at the same time, the normalized texture index (NDTI) [46], ratio texture index (RTI), and difference texture index (DTI) were calculated, according to the construction methods for normalized, ratio, and difference cropping indices described in Equations (1)–(3), respectively:
where T1 and T2 represent two different GLCM-based texture features.
2.5. Principal Component Analysis (PCA) and Stepwise Selection (ST)
As a common statistical method, PCA can convert a group of variables that may have a high correlation into a group of linearly uncorrelated variables through orthogonal transformation. The converted group of variables is called principal components (PCs) [31]. The first PC explains most of the variation in the data, and each subsequent one explains the largest proportion of variation that its predecessors could not explain. PCA is generally written as follows [47]:
where is the th principal component and is the loading of the observed variable .
ST is an automated algorithm for selecting subsets from datasets with extraneous variables. The procedure of stepwise selection is basically a forward selection algorithm; however, at each step, the procedure also checks to see whether variables can be dropped from the model using a backward elimination process [48]. The p-value of the F-statistic is calculated as the rule for entering or deleting variables from a model. In this study, the maximum p-value for a remote-sensing feature to be included was defined as 0.1, while the minimum p-value for a remote-sensing feature to be removed was defined as 0.15.
2.6. Modeling Methods
Simple linear regression (LR), SVR, and RF were used to establish LAI estimation models with a remote sensing characteristic as independent variables and the maize LAI as a dependent variable to express the quantitative relationship between a single remote sensing feature and the maize LAI. Different multivariate regression modeling methods, including MLR, SVR, and RF, were used to explore the potential of combining texture features with VIs for maize LAI estimation.
The LR method uses the least-squares approach for the regression analysis and expresses the linear relationship between the remote-sensing feature and the maize LAI. The LR formula (Equation (5)) is as follows:
where LAI represents the maize LAI, x represents the single input remote sensing variable, and b and a represent the slope and the intercept of the fitted line of the LR model, respectively.
MLR is the most common form of linear regression, which practically utilizes multiple variables. The MLR formula (Equation (6)) is as follows:
where , , …, are the different remote sensing features, , , …, are the regression coefficients for the MLR model, and is the number of independent variables.
RF is a method developed from the concept of decision trees and multiple decision trees are used to improve the accuracy. RF method has relatively stable performance in the presence of noise [49] and can address the issue of overfitting well. The most important parameter of RF is the number of trees (ntrees) [50]—considering that, when ntrees is adjusted to a large enough value, it mainly affects the execution time, rather than the modeling accuracy [51]. Therefore, for this study, ntrees was set to 500, as has commonly been used in previous studies [52].
SVR is the support vector machine implementation for regression and function approximation, which has yielded good results in estimating biophysical parameters [53]. In this study, the radial basis kernel function (RBF) was selected as the kernel function, and the optimal kernel parameter gamma (g) and regularization parameter (c) were obtained through model adjustment.
2.7. Statistical Methods
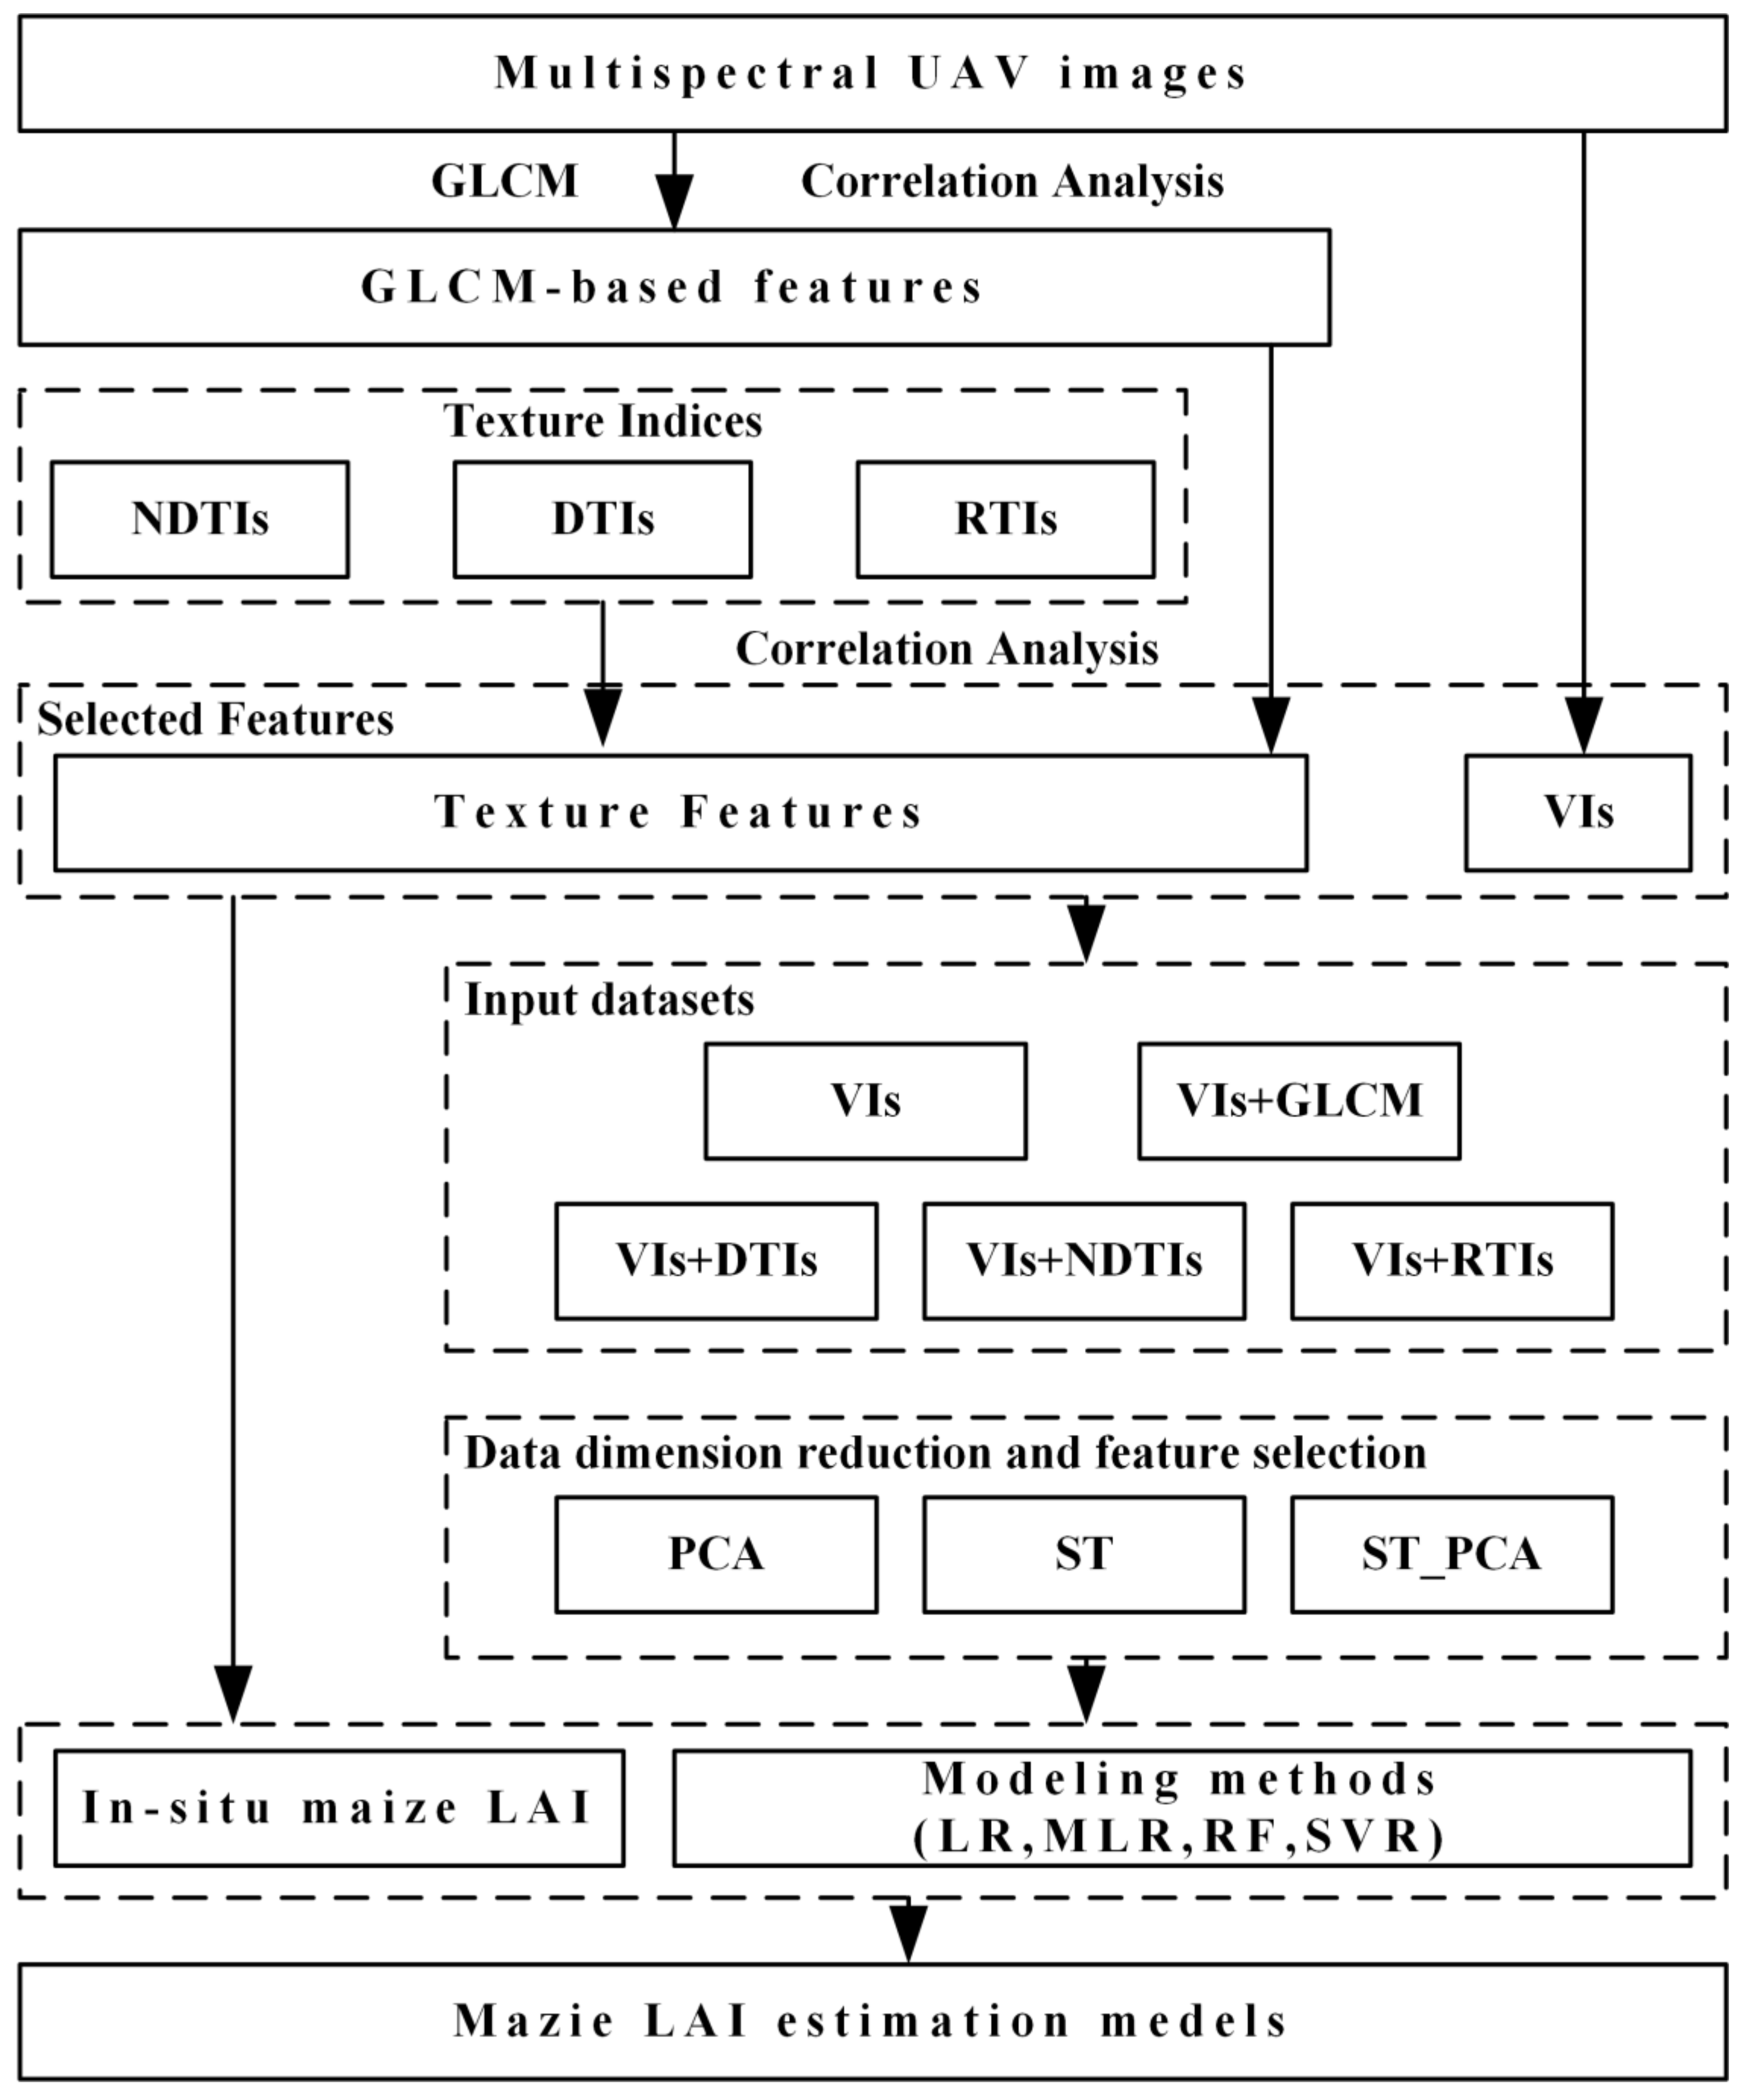
The procedure of statistical analysis after data collection is summarized by the flowchart shown in Figure 2.
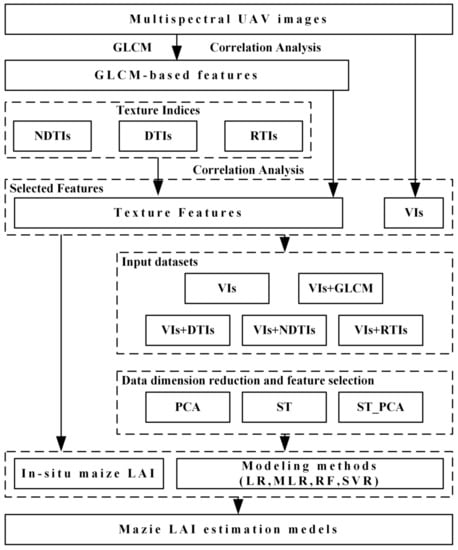
Figure 2.
Experimental methodology and procedure of the statistical analysis in this study.
2.7.1. Correlation Analysis
In this study, all potential variables were selected as effective predictor variables mostly related to maize LAI, according to the Pearson correlation analysis [54]. The calculation method for the Pearson correlation coefficient is as follows:
where r is the correlation between features and maize LAI, n is the number of samples, x corresponds to the remote sensing features, and y corresponds to the measured values of maize LAI.
2.7.2. Validation of the Regression Models
LR, SVR, and RF models were first established using each selected VI and texture feature as inputs to determine quantitative relationships between maize LAI and remote sensing features. MLR, SVR, and RF multiple regression models were then constructed and adjusted using the training set with inputs consisting of all the VIs, VIs + GLCM, VIs + NDTIs, VIs + DTIs, or VIs + RTIs. At the same time, the PCA, ST, and ST_PCA methods were used for data dimension reduction and feature screening of the input sets. Two statistical criteria under 10-fold cross-validation were used to evaluate the performance of each model, i.e., the coefficient of determination (R2, Equation (8)) and the root mean squared error (RMSE, Equation (9)):
where and are the observed and predicted LAI values, respectively, is the mean value of the observed LAI values, and n is the number of samples.
3. Results
3.1. Correlation Analysis of Features and In Situ LAI Data
To determine the relationship between in situ maize LAI and spectral features derived from multispectral UAS data, a correlation analysis between the LAI and six VIs was conducted. The results indicated that most VIs had a good correlation with LAI (Table 4), among which NDVIRE and MSRRE had higher correlation.
Table 4.
Correlation analysis results between VIs and in situ LAI.
The optimal GLCM-based texture feature extraction parameters and the correlation analysis results of GLCM-based texture features and maize LAI are shown in Table 5. Except for the weak correlation between DIS and LAI (r < 0.4), the other texture features were moderately or strongly correlated with LAI, where MEA had the highest correlation with LAI (r = 0.754).
Table 5.
The optimal parameter combination of texture features extracted based on GLCM.
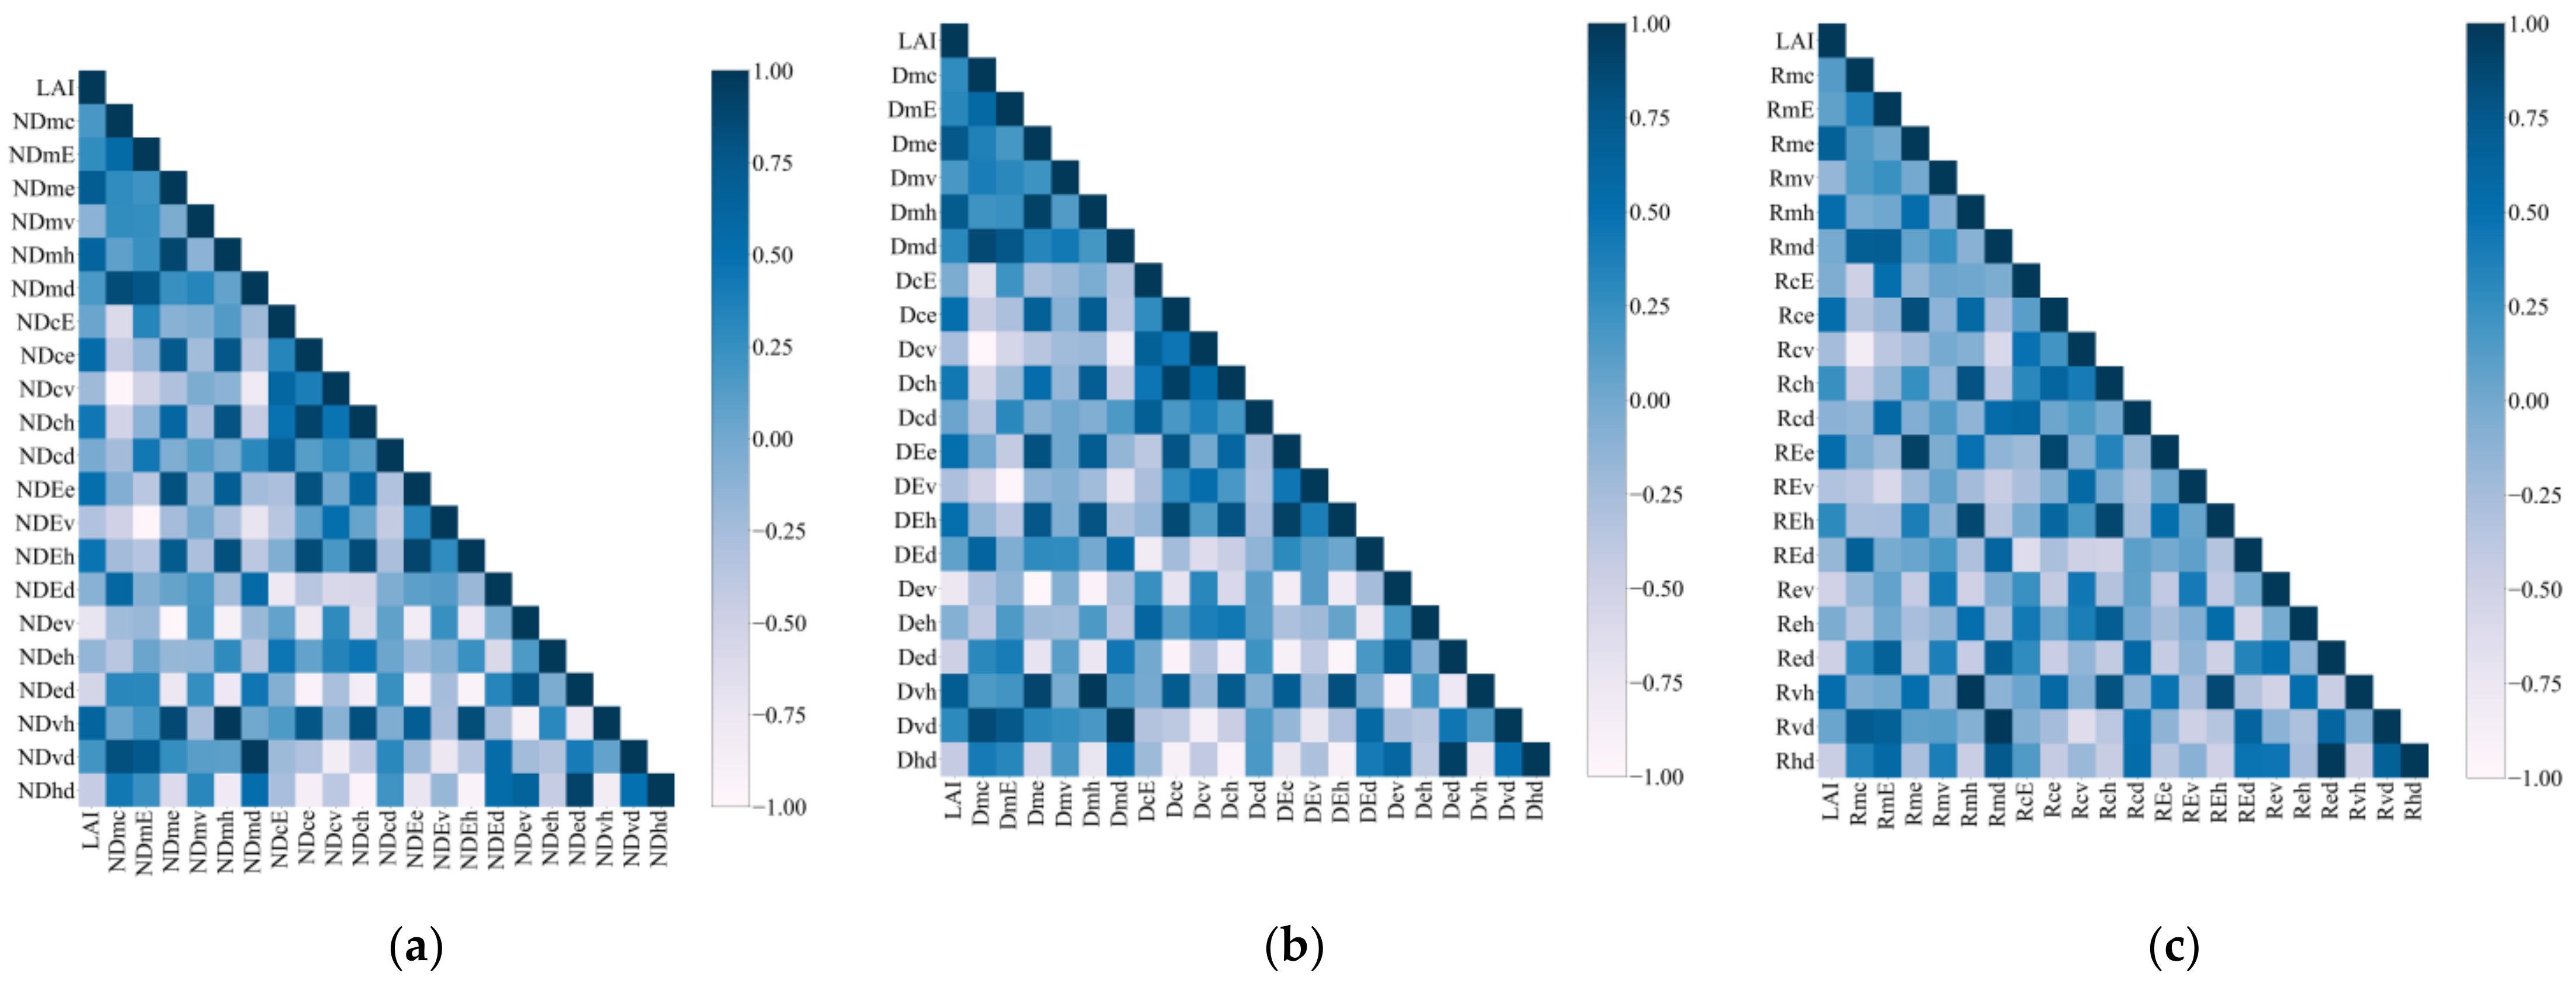
To investigate the common influence of two GLCM-based texture features on maize LAI estimation, three kinds of texture features indexes (NDTI, DTI, and RTI) were constructed. The results of the correlation analysis considering maize LAI and texture features indices are shown in Figure 3. Among the NDTIs, NDme, NDmh, NDev, and NDvh showed higher correlation with LAI (rNDme = 0.711, rNDmh = 0.633, rNDev = −0.718, rNDvh = 0.630). The correlation between DTIs and LAI were generally good, among which Dme, Dmh, Dev, and Dvh were the four DTIs with the highest correlation with LAI (rDme = 0.762, rDmh = 0.739, rDev = −0.751, rDvh = 0.718). Compared with the other two texture feature construction methods, the correlation between RTIs and LAI were lower, among which Rme, Rmh, Rce, and REe had higher correlations with LAI (rRme = 0.668, rRmh = 0.525, rRce = 0.531, rREe = 0.532).
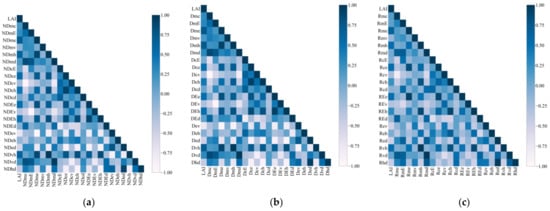
Figure 3.
The results of correlation analysis of maize LAI and texture feature indices: (a) NDTIs; (b) DTIs; and (c) RTIs.
3.2. Analysis of the Results of Maize LAI Estimation Model Based on Single Features
Based on the analyses of the correlation between all the features and LAI, all the VIs and the four texture features with the highest correlation with LAI in each type of texture features (GLCM-based texture features and three kinds of texture feature indices) were selected to construct a single feature estimation model of LAI, based on the three regression algorithms of LR, SVR, and RF. The R2 and RMSE of the models under 10-fold cross-validation are shown in Table 6. It can be seen that the RVI-SVR model had the best fitting effect (R2 = 0.773, RMSE = 0.326), while models with the texture features as input sets for maize LAI estimation were not ideal, with the best model of MEA-SVR (R2 = 0.456, RMSE = 0.521). Therefore, it seems critical to combine the VIs and texture features to make full use of the image spatial information for LAI estimation.
Table 6.
LAI estimation results based on single remote sensing factors.
3.3. Analysis of the Results of LAI Estimation Model Based on Multiple Regression
Without feature selection or data dimension reduction, the LAI estimation results of different multiple regression models with five input sets (VIs, VIs + GLCM, VIs + RTIs, VIs + NDTIs, and VIs + DTIs) are summarized in Table 7. It was found that the multiple regression model could effectively improve the monitoring accuracy of the model. Compared with the estimation accuracy of single-factor based models, combining the VIs and texture features achieved better estimation accuracy than using VIs alone. However, the estimation accuracy of models may have been affected by the high correlation within model predictors (Figure 4).
Table 7.
Ten-fold cross-validated R2 and RMSE of the multiple regression models without feature selection or data dimension reduction for maize LAI estimation.
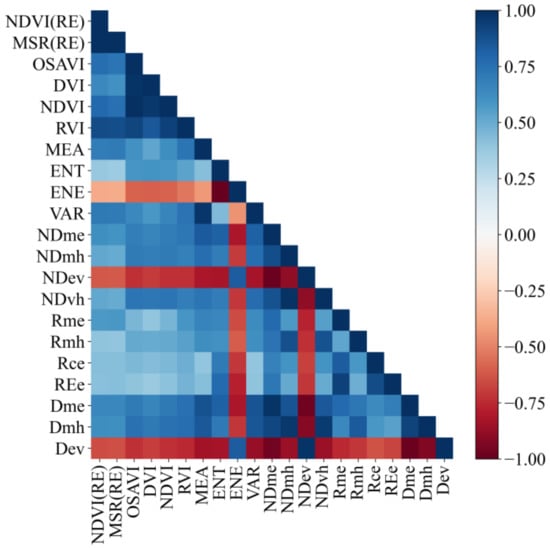
Figure 4.
Correlation analysis results of maize LAI and model predictors.
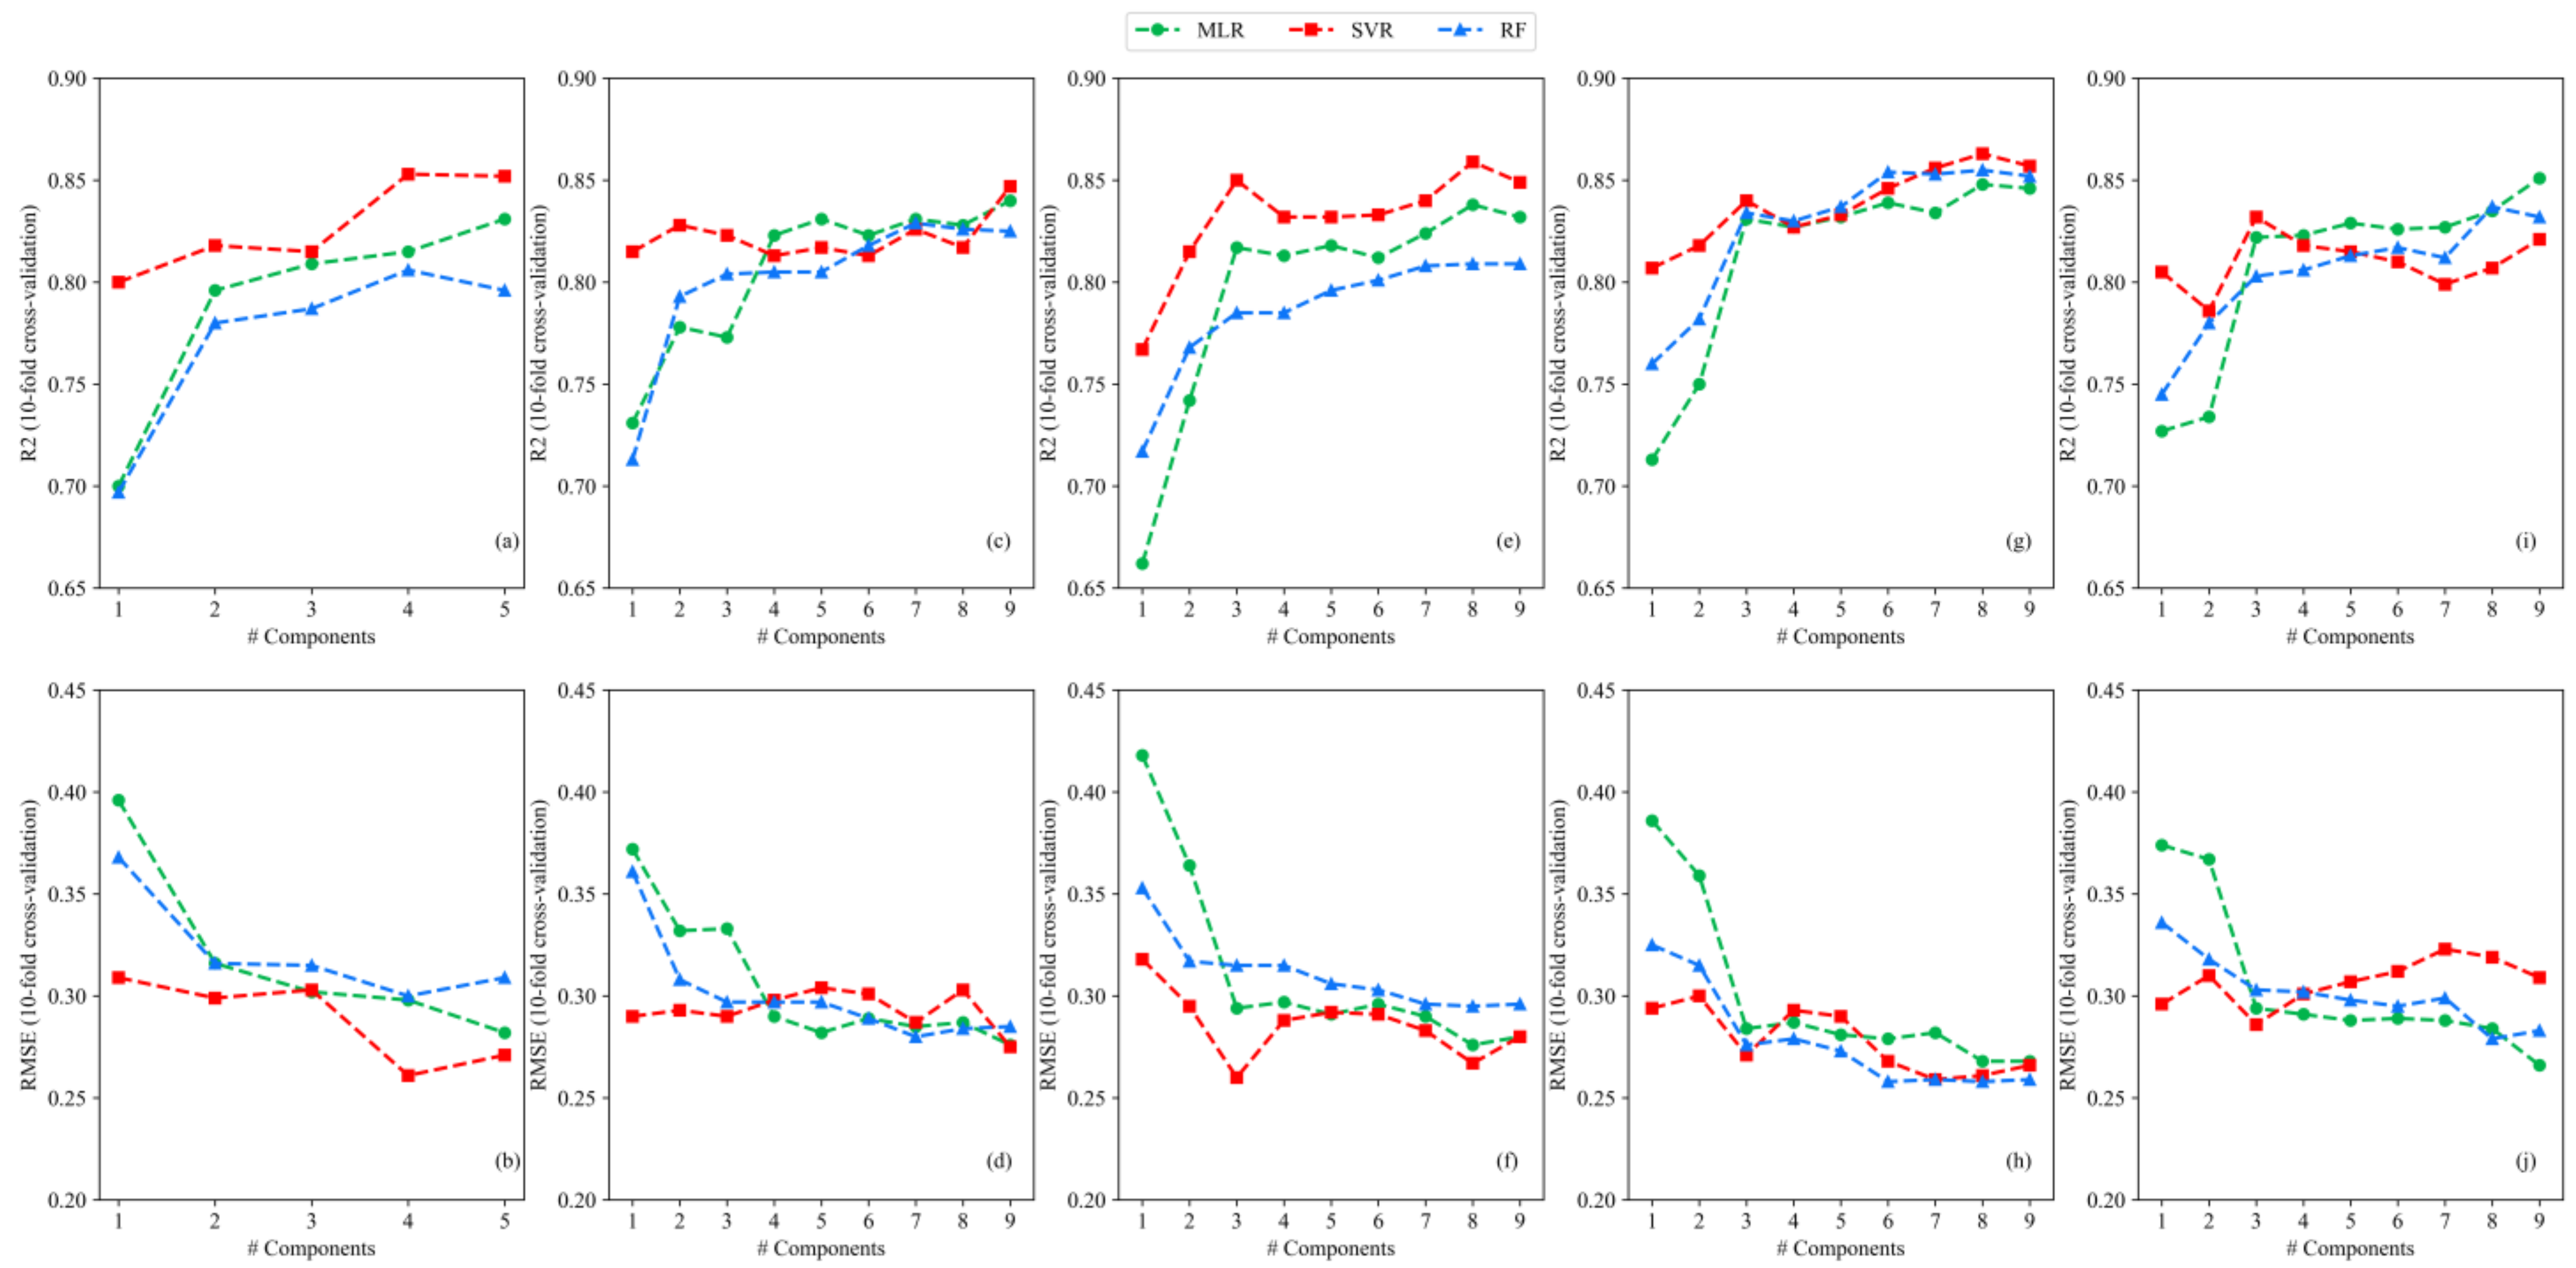
The performance of multiple regression models combined with PCA was depicted in Figure 5. With all the VIs as an input set, the PCA-SVR model achieved the best accuracy with four components (R2 = 0.853, RMSE = 0.261). When combining VIs and GLCM-based texture features as an input set, the PCA-SVR model achieved the best accuracy with nine components (R2 = 0.847, RMSE = 0.275). When combining VIs and NDTIs as an input set, the PCA-SVR model achieved the best accuracy with nine components (R2 = 0.859, RMSE = 0.267). When combining VIs and DTIs as an input set, the PCA-SVR model achieved the best accuracy with nine components (R2 = 0.863, RMSE = 0.261). When combining VIs and RTIs as an input set, the PCA-MLR model achieved the best accuracy with nine components (R2 = 0.851, RMSE = 0.266). The training results of different multiple regression models combined with PCA demonstrated that combining the VIs and DTIs provided a better LAI estimation model than using VIs alone.
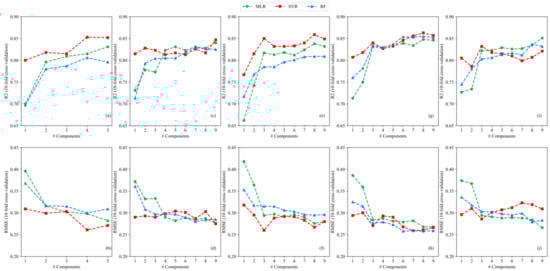
Figure 5.
Ten-fold cross-validated R2 and RMSE values under different PCA components with input sets of VIs (a,b), combined VIs and GLCM-based texture features (c,d), combined VIs and NDTIs (e,f), combined VIs and DTIs (g,h), and combined VIs and RTIs (i,j).
Table 8 shows the selected features based on ST with all five input sets and the accuracy of LAI estimation models by three multiple regression algorithms based on those selected features. When using ST-based VIs as an input set, there was no significant improvement for maize LAI estimation among three multiple techniques compared to the estimation results of the models without feature selection. For VIs + GLCM, the accuracy of models based on MLR and SVR was improved and RF achieved the same estimation result as the original VIs + GLCM input, which demonstrated that ST could effectively filter the model variables for this input set. When using the combination of VIs and NDTIs selected by ST as the input set, MLR and SVR had better performance for LAI estimation, but the estimation accuracy of RF was reduced. Compared to the initial VIs + DTIs input set, the features selected based on ST were a more suitable input set for maize LAI estimation for all three multiple regression methods. However, all regression algorithms had the obvious decline in LAI estimation with ST-based VIs + RTIs as the input set.
Table 8.
Results of ST-based multiple regression with five input sets.
It is noteworthy that compared with the performance of the PCA-SVR method with VIs as an input set (R2 = 0.853, RMSE = 0.261), the accuracy of the best model obtained by the ST-based method (ST-MLR method with VIs + DTIs as input set: R2 = 0.857, RMSE = 0.260) was not significantly improved. Therefore, ST_PCA was adopted, in order to further improve the accuracy of LAI estimation in this study. Based on the best features selected for each dataset obtained by ST, PCA-based multiple regression models were constructed.
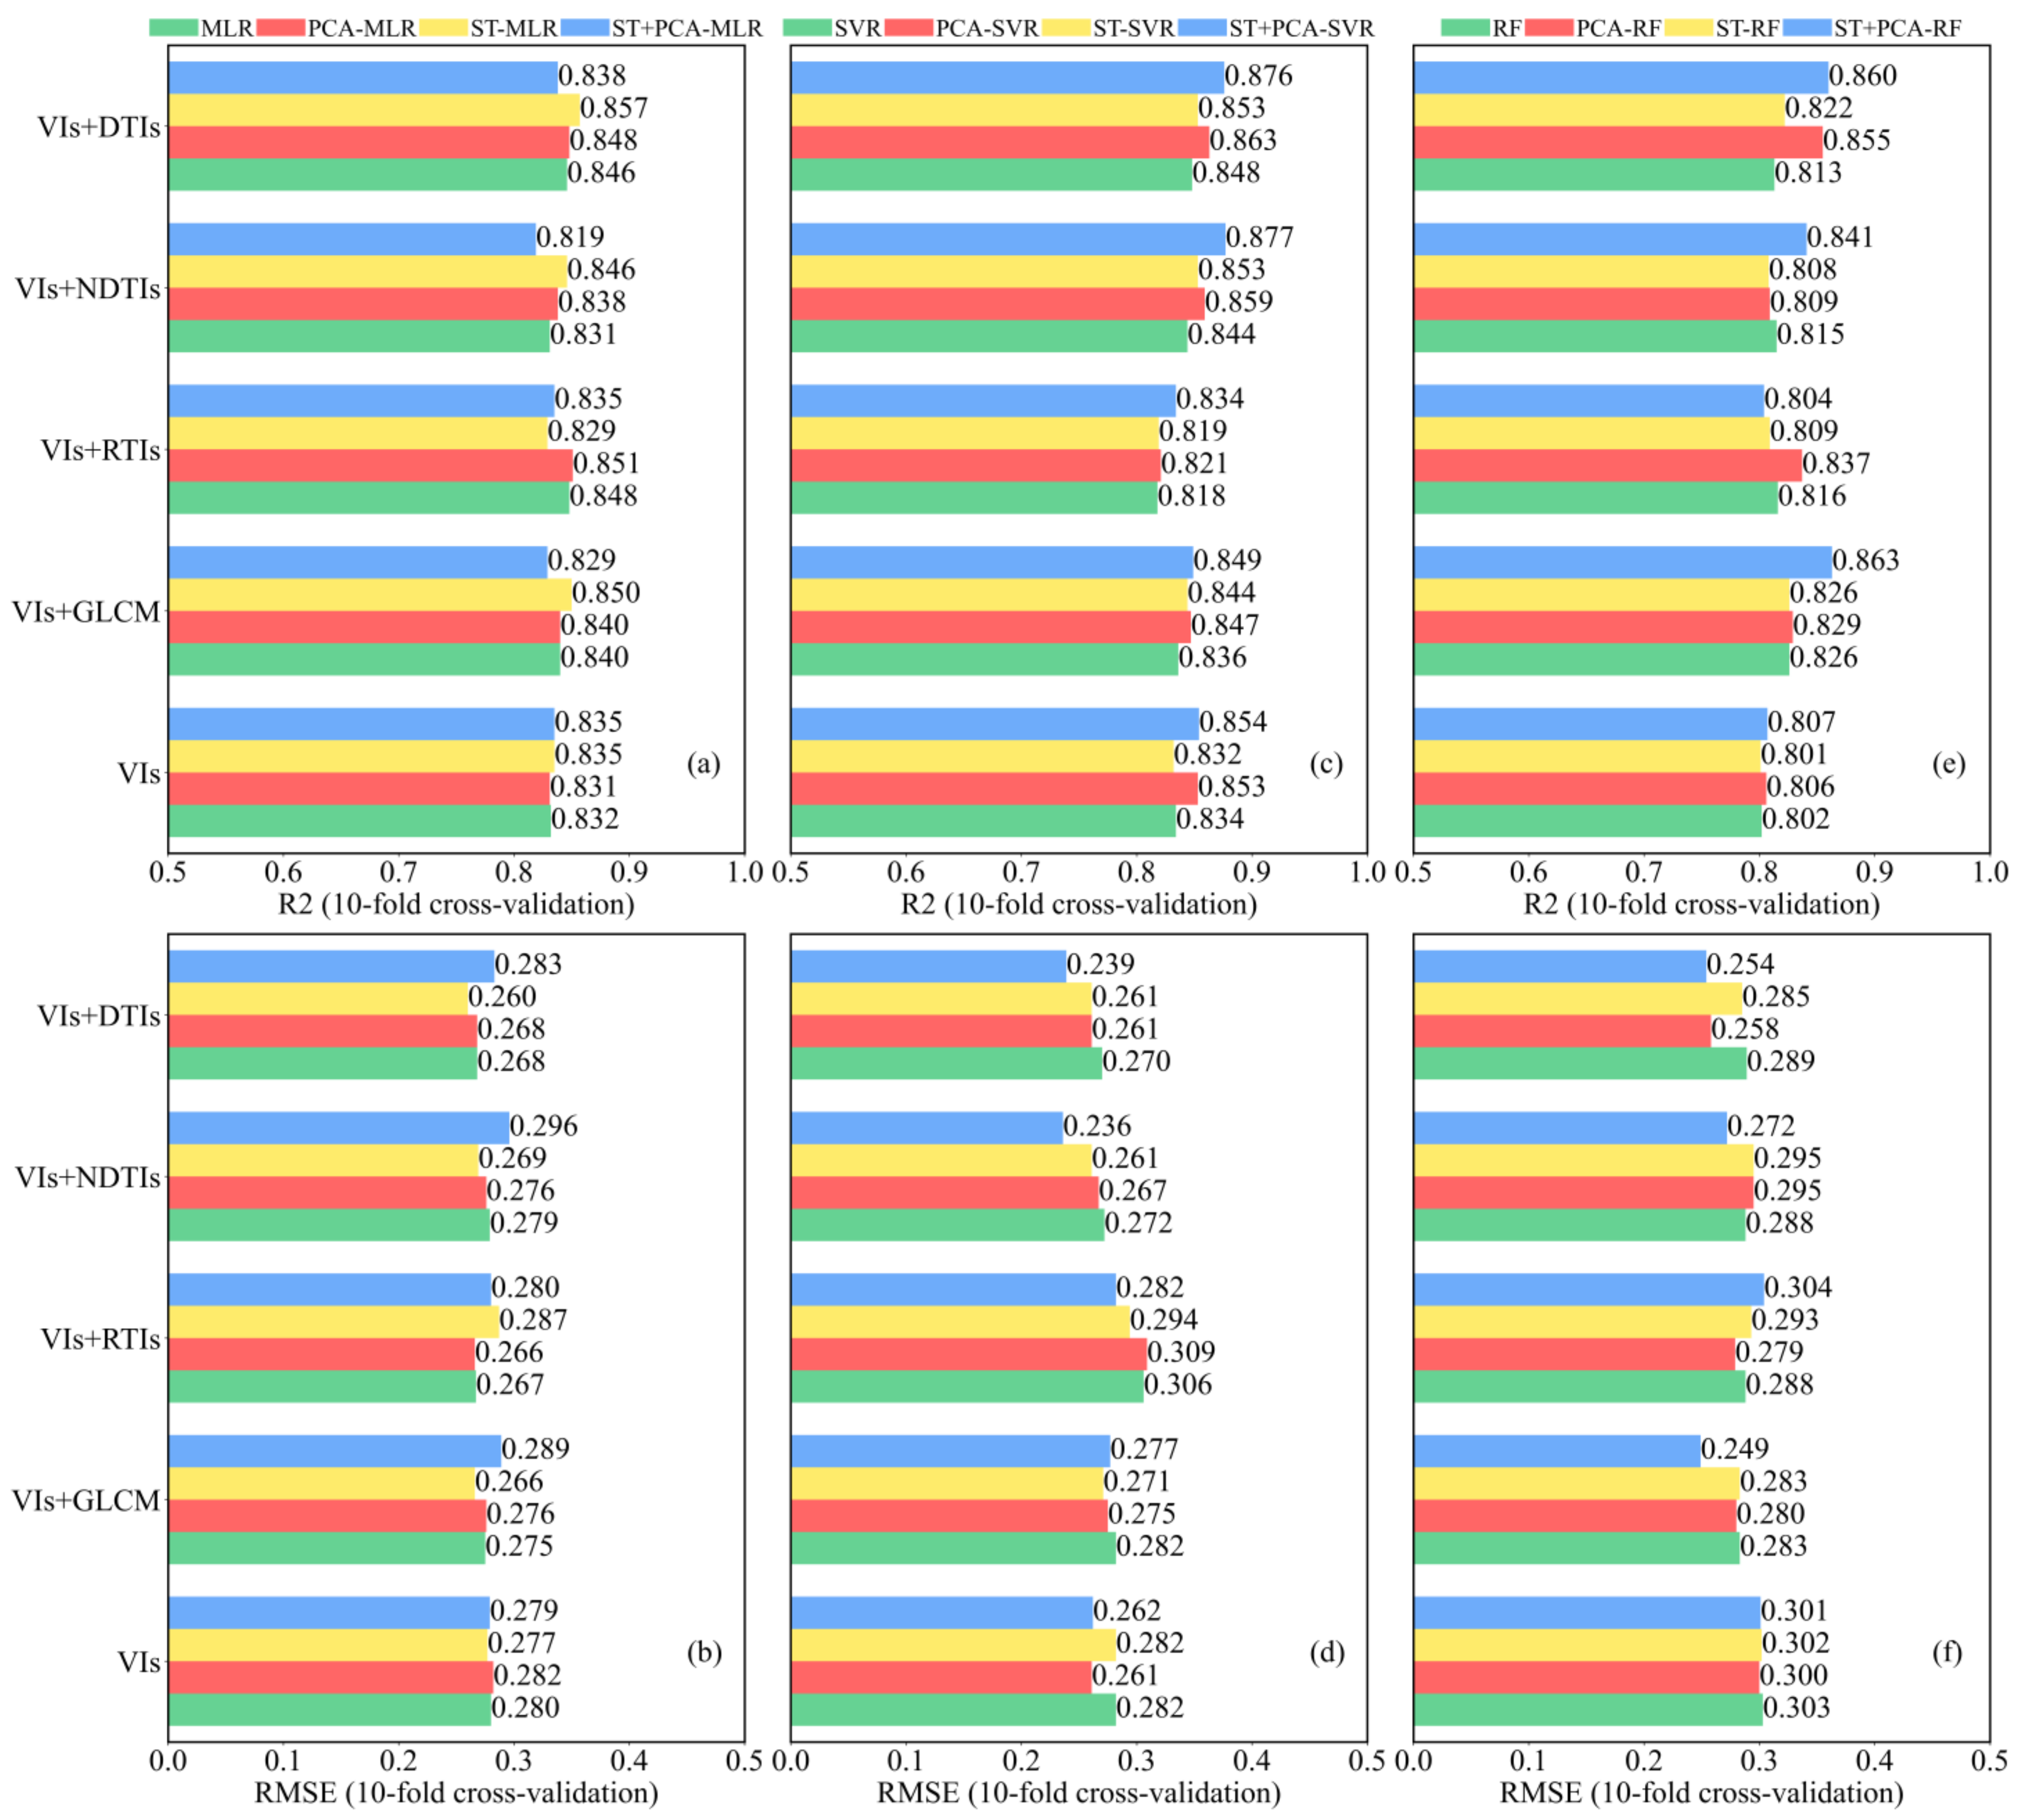
Figure 6 shows the accuracy of LAI estimation models established with all five input sets based on three multiple regression algorithms and different data dimensionality reduction or feature selection methods (PCA, ST, ST_PCA). For MLR, it was found that ST_PCA had a negative impact on the LAI estimation models for all five input sets. Unlike MLR, ST_PCA combined with RF and SVR could effectively improve the accuracy of the model on most input sets, and compared with other models, ST_PCA combined with the SVR method showed better performance with VIs + DTIs (R2 = 0.876, RMSE = 0.239) and VIs + NDTIs (R2 = 0.877, RMSE = 0.236) as input sets.
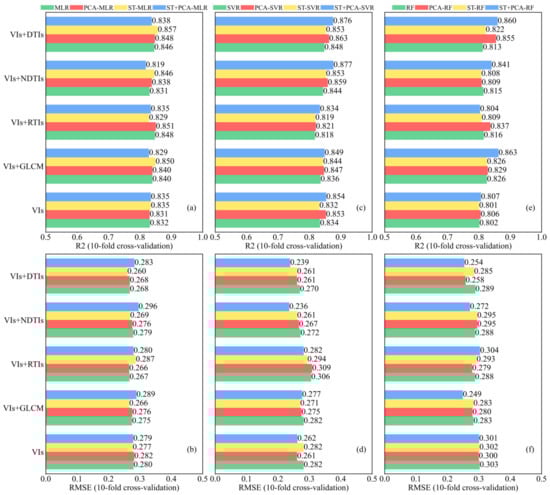
Figure 6.
Ten-fold cross-validated R2 (a,c,e) and RMSE (b,d,f) of multiple regression models for maize LAI estimation.
4. Discussion
4.1. The Effect of Spectral Features and Texture Features for Maize LAI Estimation
Six commonly used VIs were selected to build single-feature LAI estimation models to test the applicability of spectral features for maize LAI estimation in this study. It was found that NDVIRE, MSRRE, NDVI, and RVI showed good performance in maize LAI estimation. These results were consistent with those of Mananze et al. [55], who demonstrated that VIs had excellent feasibility for maize LAI estimation.
The texture features extracted based on GLCM were used to explore the influence of texture information of multispectral UAS imagery on maize LAI estimation. The correlation analysis results of LAI and GLCM-based texture features showed that, except for textures from Red (VAR, r = 0.749) and NIR (MEA, r = 0.754) bands, most texture features were weakly related to the maize LAI. Furthermore, NDTIs, RTIs, and DTIs were calculated to express the influence of two different texture features on maize LAI monitoring at the same time. As shown in the results of the single-parameter LAI estimation models, texture features maybe not be as stable as VIs in maize LAI estimation. Therefore, similar to the opinion of Zhang et al. [27], it was found that texture features were not suitable for estimating maize LAI as independent remote sensing variables.
In this study, multiple regression models were used to explore the influence of combining VIs and texture features on the estimation of maize LAI, due to the good ability of multiple regression to describe the common impact of multiple variables on the model. The maize LAI estimation models were established based on different multiple regression algorithms using five input sets (VIs, VIs + GLCM, VIs + RTIs, VIs + NDTIs, and VIs + DTIs). According to the comparison of the accuracy of different models, it was found that combining texture features and VIs can improve the estimation accuracy of maize LAI.
We analyzed the influence of combining VIs and texture features for maize LAI estimation under datasets with different sizes; the results are shown in Table 9. Seven datasets (of size 40–100) were randomly selected from all the samples, with 10 samples as intervals, and the R2 of 10-fold cross-validation was taken to evaluate the model accuracy for each sample set. The above process was repeated ten times, and the accuracy mean of each sample set was taken as the final estimation result. It can be seen, from Table 9, that the model coupled with texture features and VIs had an obvious effect on the improvement of the model accuracy under differently sized sample sets.
Table 9.
The LAI estimation results of PCA_ST + SVR models with sample sets of different sizes.
4.2. Comparison of Different Multivariate Regression Methods
Among the three multivariate regression algorithms used for maize LAI estimation, the SVR showed clearly better performance over the RF and MLR. The RF model is based on a large sample decision tree for high-dimensional data training, and it is difficult to effectively train RF models with a small sample size [50]. Thus, the sub-optimal performance of the RF models may have been due to the small data size in our experiments. When the relationship between the dependent variable and the independent variable is obviously linear, the MLR method can be used to reflect the linear relationship between variables [12]. However, the non-linear relationships between LAI and the input predictors (VIs or texture features) could not be overlooked, which are difficult to estimate using MLR models [32]. The SVR method had a strong learning ability when using small datasets, and can solve high-dimensional and non-linear problems by transforming them into linear problems through the use of a non-linear transformation [56], which made it the most suitable algorithm for monitoring maize LAI in this study.
Due to the multicollinearity between model predictors, PCA has increasingly been applied in studies to reduce data dimensionality in recent years [24,49]. In our work, the multivariate regression algorithms coupled with PCA achieved accuracy improvements over the models without feature selection or data dimension reduction. Different from other studies, the ST and ST_PCA methods were also used to reduce the influence of multicollinearity between input sets in this study. As shown in Figure 6, the features obtained based on ST had higher accuracy than the original feature, when used in the input set for most models. However, it is worth noting that the model with VIs + RTIs as the input set had a significant decrease in model accuracy after ST. This might be because the ST method used mainly did not attempt to identify the ‘best’ subset models, in that the model with the minimum residual sum of squares was not necessarily located [48]. Therefore, when there were a large number of noise features (RTIs) in the input set, the selected features were unreliable for LAI estimation. Furthermore, the ST_PCA method was proposed to better combine texture indices and VIs. As shown in Figure 6, the RF and SVR algorithms coupled with the ST_PCA method had higher accuracy than the models based on PCA or ST methods for most input sets. However, the ST_PCA method in the MLR algorithm did not effectively improve the accuracy of the model. This might be due to the relationship between the variables selected by ST and LAI not being linear.
4.3. Effects of Different Kinds of Texture Features on Maize LAI Estimation Models
In this study, three methods were used to construct the texture indices. In addition to the widely used NDTIs [27,32,46,57], RTIs and DTIs were firstly constructed, in order to explore the effect of the combined texture features and VIs on maize LAI monitoring.
The SVR model coupled with NDme and VIs as the input set achieved the best accuracy (R2 = 0.877, RMSE = 0.236), indicating that the texture index extraction method for NDTI could effectively extract the spatial information of the image for maize LAI monitoring. As shown in Figure 6, the SVR model coupled with Dmh and VIs as the input set also had a good performance in LAI monitoring (R2 = 0.876, RMSE = 0.239), where the DTIs had better stability than NDTIs under different multiple regression algorithms. In MLR multiple regression models, the model with RTIs and VIs as input set had the best accuracy performance, compared with other input sets (R2 = 0.851, RMSE = 0.266), but the combination of VIs and RTIs had no significant effect on the improvement of model accuracy in SVR and RF models. Moreover, the accuracy of the MLR model with VIs and RTIs was lower than the performance of the ST_PCA-SVR model with VIs as the input set (R2 = 0.854, RMSE = 0.262), which could not be explained as the combination of RTI and VIs had significantly improved the accuracy of the LAI estimation. Although the ST_PCA-RF model coupled with VIs and GLCM as the input set had good accuracy (R2 = 0.863, RMSE = 0.249), the model with VIs + NDTIs or VIs + DTIs as the input set had more stable and higher accuracy on the whole.
5. Conclusions
In this study, the influence of combining multispectral UAS spectral and texture features with different modeling methods, texture feature extraction methods, data dimension reduction methods, and sample sizes on maize LAI estimation have been studied. The spectral features included the VIs extracted from multispectral UAS data, while the texture features included the GLCM-based variables extracted from multispectral UAS data and the NDTIs, RTIs, and DTIs calculated based on those GLCM-based texture features. To reduce the information redundancy among these features, PCA, ST, and ST_PCA were adopted to eliminate unnecessary information and select effective features. Furthermore, LR, SVR, RF, and MLR methods were used to establish estimation models of maize LAI. It is shown that the combination of UAS multispectral and NDTIs (or DTIs) could obtain better estimation results than those obtained by only using spectral or texture features. The SVR coupled with ST_PCA showed the best ability to combine VIs and texture features for maize LAI estimation.
This study provides insights into combining UAS spectral and texture features for estimating maize LAI. Our future investigations will take the effects of UAS image resolution and texture feature extraction methods into consideration in the estimation process. Additionally, the difference in the effects of texture features between different growing periods of the same crop and different kinds of crops need to be studied.
Author Contributions
Conceptualization, X.Z. and K.Z.; methodology, X.Z. and Y.C.; software, X.Z. and S.C.; validation, X.Z. and Y.S.; formal analysis, X.Z., W.B. and H.Z.; investigation, X.Z., Y.Z. and H.Z.; resources, X.Z., E.F. and H.Z.; data curation, X.Z. and S.C.; writing—original draft preparation, X.Z. and K.Z.; writing—review and editing, X.Z., E.F. and K.Z.; visualization, X.Z., Y.H. and J.L.; supervision, K.Z.; project administration, K.Z. and Y.S. All authors have read and agreed to the published version of the manuscript.
Funding
This research was funded by the Fundamental Research Funds for the Central Universities (Grant No.2017XKQY019), China University of Mining and Technology.
Institutional Review Board Statement
Not applicable.
Informed Consent Statement
Not applicable.
Data Availability Statement
The data presented in this study are available within the article.
Conflicts of Interest
The authors declare no conflict of interest.
References
- Watson, D.J. Comparative Physiological Studies on the Growth of Field Crops: II. The Effect of Varying Nutrient Supply on Net Assimilation Rate and Leaf Area. Ann. Bot. 1947, 11, 375–407. [Google Scholar] [CrossRef]
- Li, X.; Zhang, Y.; Luo, J.; Jin, X.; Xu, Y.; Yang, W. Quantification winter wheat LAI with HJ-1CCD image features over multiple growing seasons. Int. J. Appl. Earth Obs. Geoinf. 2016, 44, 104–112. [Google Scholar] [CrossRef]
- Padalia, H.; Sinha, S.K.; Bhave, V.; Trivedi, N.K.; Senthil Kumar, A. Estimating canopy LAI and chlorophyll of tropical forest plantation (North India) using Sentinel-2 data. Adv. Space Res. 2020, 65, 458–469. [Google Scholar] [CrossRef]
- Zhao, J.; Li, J.; Liu, Q.; Fan, W.; Zhong, B.; Wu, S.; Yang, L.; Zeng, Y.; Xu, B.; Yin, G. Leaf Area Index Retrieval Combining HJ1/CCD and Landsat8/OLI Data in the Heihe River Basin, China. Remote Sens. 2015, 7, 6862–6885. [Google Scholar] [CrossRef] [Green Version]
- Yu, D.; Zha, Y.; Shi, L.; Ye, H.; Zhang, Y. Improving sugarcane growth simulations by integrating multi-source observations into a crop model. Eur. J. Agron. 2022, 132, 126410. [Google Scholar] [CrossRef]
- Dong, T.; Liu, J.; Shang, J.; Qian, B.; Ma, B.; Kovacs, J.M.; Walters, D.; Jiao, X.; Geng, X.; Shi, Y. Assessment of red-edge vegetation indices for crop leaf area index estimation. Remote Sens. Environ. 2019, 222, 133–143. [Google Scholar] [CrossRef]
- Kaplan, G.; Rozenstein, O. Spaceborne Estimation of Leaf Area Index in Cotton, Tomato, and Wheat Using Sentinel-2. Land 2021, 10, 505. [Google Scholar] [CrossRef]
- Hu, Q.; Yang, J.; Xu, B.; Huang, J.; Memon, D.-M.S.; Yin, G.; Zeng, Y.; Zhao, J.; Ke, L. Evaluation of Global Decametric-Resolution LAI, FAPAR and FVC Estimates Derived from Sentinel-2 Imagery. Remote Sens. 2020, 12, 912. [Google Scholar] [CrossRef] [Green Version]
- Darvishzadeh, R.; Skidmore, A.; Schlerf, M.; Atzberger, C.; Corsi, F.; Cho, M. LAI and chlorophyll estimation for a heterogeneous grassland using hyperspectral measurements. ISPRS J. Photogramm. Remote Sens. 2008, 63, 409–426. [Google Scholar] [CrossRef]
- Yamaguchi, T.; Tanaka, Y.; Imachi, Y.; Yamashita, M.; Katsura, K. Feasibility of Combining Deep Learning and RGB Images Obtained by Unmanned Aerial Vehicle for Leaf Area Index Estimation in Rice. Remote Sens. 2020, 13, 84. [Google Scholar] [CrossRef]
- Zheng, G.; Moskal, L.M. Retrieving Leaf Area Index (LAI) Using Remote Sensing: Theories, Methods and Sensors. Sensors 2009, 9, 2719–2745. [Google Scholar] [CrossRef] [Green Version]
- Li, J.; Mao, X. Comparison of Canopy Closure Estimation of Plantations Using Parametric, Semi-Parametric, and Non-Parametric Models Based on GF-1 Remote Sensing Images. Forests 2020, 11, 597. [Google Scholar] [CrossRef]
- Cohrs, C.W.; Cook, R.L.; Gray, J.M.; Albaugh, T.J. Sentinel-2 Leaf Area Index Estimation for Pine Plantations in the Southeastern United States. Remote Sens. 2020, 12, 1406. [Google Scholar] [CrossRef]
- Huang, D.; Yang, W.Z.; Tan, B.; Rautiainen, M.; Zhang, P.; Hu, J.N.; Shabanov, N.V.; Linder, S.; Knyazikhin, Y.; Myneni, R.B. The importance of measurement errors for deriving accurate reference leaf area index maps for validation of moderate-resolution satellite LAI products. IEEE Trans. Geosci. Remote Sens. 2006, 44, 1866–1871. [Google Scholar] [CrossRef]
- Middinti, S.; Thumaty, K.C.; Gopalakrishnan, R.; Jha, C.S.; Thatiparthi, B.R. Estimating the leaf area index in Indian tropical forests using Landsat-8 OLI data. Int. J. Remote Sens. 2017, 38, 6769–6789. [Google Scholar] [CrossRef]
- Mao, H.; Meng, J.; Ji, F.; Zhang, Q.; Fang, H. Comparison of Machine Learning Regression Algorithms for Cotton Leaf Area Index Retrieval Using Sentinel-2 Spectral Bands. Appl. Sci. 2019, 9, 1459. [Google Scholar] [CrossRef] [Green Version]
- Maimaitijiang, M.; Sagan, V.; Sidike, P.; Hartling, S.; Esposito, F.; Fritschi, F.B. Soybean yield prediction from UAV using multimodal data fusion and deep learning. Remote Sens. Environ. 2020, 237, 111599. [Google Scholar] [CrossRef]
- Tian, J.; Wang, L.; Li, X.; Gong, H.; Shi, C.; Zhong, R.; Liu, X. Comparison of UAV and WorldView-2 imagery for mapping leaf area index of mangrove forest. Int. J. Appl. Earth Obs. Geoinf. 2017, 61, 22–31. [Google Scholar] [CrossRef]
- Gong, Y.; Yang, K.; Lin, Z.; Fang, S.; Wu, X.; Zhu, R.; Peng, Y. Remote estimation of leaf area index (LAI) with unmanned aerial vehicle (UAV) imaging for different rice cultivars throughout the entire growing season. Plant Methods 2021, 17, 88. [Google Scholar] [CrossRef] [PubMed]
- Lan, Y.; Huang, Z.; Deng, X.; Zhu, Z.; Huang, H.; Zheng, Z.; Lian, B.; Zeng, G.; Tong, Z. Comparison of machine learning methods for citrus greening detection on UAV multispectral images. Comput. Electron. Agric. 2020, 171, 105234. [Google Scholar] [CrossRef]
- Duan, B.; Liu, Y.; Gong, Y.; Peng, Y.; Wu, X.; Zhu, R.; Fang, S. Remote estimation of rice LAI based on Fourier spectrum texture from UAV image. Plant Methods 2019, 15, 124. [Google Scholar] [CrossRef] [Green Version]
- Zhou, Y.-M.; Jiang, M.-J. Comparison of inversion method of maize leaf area index based on UAV hyperspectral remote sensing. Multimed. Tools Appl. 2019, 79, 16385–16401. [Google Scholar] [CrossRef]
- Tunca, E.; Koksal, E.S.; Cetin, S.; Ekiz, N.M.; Balde, H. Yield and leaf area index estimations for sunflower plants using unmanned aerial vehicle images. Environ. Monit. Assess. 2018, 190, 682. [Google Scholar] [CrossRef] [PubMed]
- Luo, P.; Liao, J.; Shen, G. Combining Spectral and Texture Features for Estimating Leaf Area Index and Biomass of Maize Using Sentinel-1/2, and Landsat-8 Data. IEEE Access 2020, 8, 53614–53626. [Google Scholar] [CrossRef]
- Ghasemi, N.; Sahebi, M.R.; Mohammadzadeh, A. Biomass Estimation of a Temperate Deciduous Forest Using Wavelet Analysis. IEEE Trans. Geosci. Remote Sens. 2013, 51, 765–776. [Google Scholar] [CrossRef]
- Zhou, J.; Yan Guo, R.; Sun, M.; Di, T.T.; Wang, S.; Zhai, J.; Zhao, Z. The Effects of GLCM parameters on LAI estimation using texture values from Quickbird Satellite Imagery. Sci. Rep. 2017, 7, 7366. [Google Scholar] [CrossRef]
- Zhang, J.; Qiu, X.; Wu, Y.; Zhu, Y.; Cao, Q.; Liu, X.; Cao, W. Combining texture, color, and vegetation indices from fixed-wing UAS imagery to estimate wheat growth parameters using multivariate regression methods. Comput. Electron. Agric. 2021, 185, 106138. [Google Scholar] [CrossRef]
- Guo, Y.H.; Fu, Y.S.; Hao, F.H.; Zhang, X.; Wu, W.X.; Jin, X.L.; Bryant, C.R.; Senthilnath, J. Integrated phenology and climate in rice yields prediction using machine learning methods. Ecol. Indic. 2021, 120, 106935. [Google Scholar] [CrossRef]
- Chang, C.C.; Lin, C.J. LIBSVM: A Library for Support Vector Machines. ACM Trans. Intell. Syst. Technol. 2011, 2, 1–27. [Google Scholar] [CrossRef]
- Joachims, T. Making large-scale support vector machine learning practical. In Advances in Kernel Methods: Support Vector Learning; MIT Press: Cambridge, MA, USA, 1999; pp. 169–184. [Google Scholar]
- Zhai, L.; Li, S.; Zou, B.; Sang, H.; Fang, X.; Xu, S. An improved geographically weighted regression model for PM2.5 concentration estimation in large areas. Atmos. Environ. 2018, 181, 145–154. [Google Scholar] [CrossRef]
- Li, S.; Yuan, F.; Ata-Ui-Karim, S.T.; Zheng, H.; Cheng, T.; Liu, X.; Tian, Y.; Zhu, Y.; Cao, W.; Cao, Q. Combining Color Indices and Textures of UAV-Based Digital Imagery for Rice LAI Estimation. Remote Sens. 2019, 11, 1763. [Google Scholar] [CrossRef] [Green Version]
- Karpouzli, E.; Malthus, T.J.; Place, C.J. Hyperspectral discrimination of coral reef benthic communities in the western Caribbean. Coral Reefs 2004, 23, 141–151. [Google Scholar] [CrossRef]
- Afrasiabian, Y.; Noory, H.; Mokhtari, A.; Nikoo, M.R.; Pourshakouri, F.; Haghighatmehr, P. Effects of spatial, temporal, and spectral resolutions on the estimation of wheat and barley leaf area index using multi- and hyper-spectral data (case study: Karaj, Iran). Precis. Agric. 2020, 22, 660–688. [Google Scholar] [CrossRef]
- Shao, G.; Han, W.; Zhang, H.; Liu, S.; Wang, Y.; Zhang, L.; Cui, X. Mapping maize crop coefficient Kc using random forest algorithm based on leaf area index and UAV-based multispectral vegetation indices. Agric. Water Manag. 2021, 252. [Google Scholar] [CrossRef]
- He, Y.; Bo, Y.; Chai, L.; Liu, X.; Li, A. Linking in situ LAI and fine resolution remote sensing data to map reference LAI over cropland and grassland using geostatistical regression method. Int. J. Appl. Earth Obs. Geoinf. 2016, 50, 26–38. [Google Scholar] [CrossRef] [Green Version]
- Richetti, J.; Boote, K.J.; Hoogenboom, G.; Judge, J.; Johann, J.A.; Uribe-Opazo, M.A. Remotely sensed vegetation index and LAI for parameter determination of the CSM-CROPGRO-Soybean model when in situ data are not available. Int. J. Appl. Earth Obs. Geoinf. 2019, 79, 110–115. [Google Scholar] [CrossRef]
- Zhang, M.; Su, W.; Fu, Y.; Zhu, D.; Xue, J.-H.; Huang, J.; Wang, W.; Wu, J.; Yao, C. Super-resolution enhancement of Sentinel-2 image for retrieving LAI and chlorophyll content of summer corn. Eur. J. Agron. 2019, 111, 125938. [Google Scholar] [CrossRef]
- Becker, F.; Choudhury, B.J. Relative sensitivity of normalized difference vegetation Index (NDVI) and microwave polarization difference Index (MPDI) for vegetation and desertification monitoring. Remote Sens. Environ. 1988, 24, 297–311. [Google Scholar] [CrossRef]
- Gitelson, A.; Merzlyak, M.N. Spectral Reflectance Changes Associated with Autumn Senescence of Aesculus hippocastanum L. and Acer platanoides L. Leaves. Spectral Features and Relation to Chlorophyll Estimation. J. Plant Physiol. 1994, 143, 286–292. [Google Scholar] [CrossRef]
- Wu, C.; Niu, Z.; Tang, Q.; Huang, W.J.A.; Meteorology, F. Estimating chlorophyll content from hyperspectral vegetation indices: Modeling and validation. Agric. For. Meteorol. 2008, 148, 1230–1241. [Google Scholar] [CrossRef]
- Rondeaux, G.; Steven, M.; Baret, F. Optimization of soil-adjusted vegetation indices. Remote Sens. Environ. 1996, 55, 95–107. [Google Scholar] [CrossRef]
- Peñuelas, J.; Isla, R.; Filella, I.; Araus, J.L. Visible and near-infrared reflectance assessment of salinity effects on barley. Crop Sci. 1997, 37, 198–202. [Google Scholar] [CrossRef]
- Jordan, C.F. Derivation of Leaf-Area Index from Quality of Light on the Forest Floor. Ecology 1969, 50, 663–666. [Google Scholar] [CrossRef]
- Haralick, R.M.; Shanmugam, K.; Dinstein, I. Textural Features for Image Classification. IEEE Trans. Syst. Man Cybern. 1973, SMC-3, 610–621. [Google Scholar] [CrossRef] [Green Version]
- Zheng, H.; Cheng, T.; Zhou, M.; Li, D.; Yao, X.; Tian, Y.; Cao, W.; Zhu, Y. Improved estimation of rice aboveground biomass combining textural and spectral analysis of UAV imagery. Precis. Agric. 2018, 20, 611–629. [Google Scholar] [CrossRef]
- Ul-Saufie, A.Z.; Yahaya, A.S.; Ramli, N.A.; Rosaida, N.; Hamid, H.A. Future daily PM10 concentrations prediction by combining regression models and feedforward backpropagation models with principle component analysis (PCA). Atmos. Environ. 2013, 77, 621–630. [Google Scholar] [CrossRef]
- Derksen, S.; Keselman, J. Backward, Forward and Stepwise Automated Subset Selection Algorithms: Frequency of Obtaining Authentic and Noise Variables. Br. J. Math. Stat. Psychol. 1992, 45, 265–282. [Google Scholar] [CrossRef]
- Li, Z.-W.; Xin, X.-P.; Tang, H.; Yang, F.; Chen, B.-R.; Zhang, B.-H. Estimating grassland LAI using the Random Forests approach and Landsat imagery in the meadow steppe of Hulunber, China. J. Integr. Agric. 2017, 16, 286–297. [Google Scholar] [CrossRef]
- Yuan, H.; Yang, G.; Li, C.; Wang, Y.; Liu, J.; Yu, H.; Feng, H.; Xu, B.; Zhao, X.; Yang, X. Retrieving Soybean Leaf Area Index from Unmanned Aerial Vehicle Hyperspectral Remote Sensing: Analysis of RF, ANN, and SVM Regression Models. Remote Sens. 2017, 9, 309. [Google Scholar] [CrossRef] [Green Version]
- Qu, Y.; Gao, Z.; Shang, J.; Liu, J.; Casa, R. Simultaneous measurements of corn leaf area index and mean tilt angle from multi-directional sunlit and shaded fractions using downward-looking photography. Comput. Electron. Agric. 2021, 180, 105881. [Google Scholar] [CrossRef]
- Wang, L.A.; Zhou, X.; Zhu, X.; Dong, Z.; Guo, W. Estimation of biomass in wheat using random forest regression algorithm and remote sensing data. Crop J. 2016, 4, 212–219. [Google Scholar] [CrossRef] [Green Version]
- Camps-Valls, G.; Bruzzone, L.; Rojo-Rojo, J.L.; Melgani, F. Robust Support Vector Regression for Biophysical Variable Estimation from Remotely Sensed Images. IEEE Geosci. Remote Sens. Lett. 2006, 3, 339–343. [Google Scholar] [CrossRef]
- Pearson, K. LIII. On lines and planes of closest fit to systems of points in space. Lond. Edinb. Dublin Philos. Mag. J. Sci. 2010, 2, 559–572. [Google Scholar] [CrossRef] [Green Version]
- Mananze, S.; Pôças, I.; Cunha, M. Retrieval of Maize Leaf Area Index Using Hyperspectral and Multispectral Data. Remote Sens. 2018, 10, 1942. [Google Scholar] [CrossRef] [Green Version]
- Zhang, J.; Cheng, T.; Guo, W.; Xu, X.; Qiao, H.; Xie, Y.; Ma, X. Leaf area index estimation model for UAV image hyperspectral data based on wavelength variable selection and machine learning methods. Plant Methods 2021, 17, 49. [Google Scholar] [CrossRef] [PubMed]
- Zheng, H.; Cheng, T.; Li, D.; Yao, X.; Tian, Y.; Cao, W.; Zhu, Y. Combining Unmanned Aerial Vehicle (UAV)-Based Multispectral Imagery and Ground-Based Hyperspectral Data for Plant Nitrogen Concentration Estimation in Rice. Front. Plant. Sci. 2018, 9, 936. [Google Scholar] [CrossRef] [PubMed]

Publisher’s Note: MDPI stays neutral with regard to jurisdictional claims in published maps and institutional affiliations. |
© 2022 by the authors. Licensee MDPI, Basel, Switzerland. This article is an open access article distributed under the terms and conditions of the Creative Commons Attribution (CC BY) license (https://creativecommons.org/licenses/by/4.0/).