Article

Jitter Detection Method Based on Sequence CMOS Images Captured by Rolling Shutter Mode for High-Resolution Remote Sensing Satellite

1
School of Electrical and Information Engineering, Hubei Key Laboratory of Optical Information and Pattern Recognition, Wuhan Institute of Technology, Wuhan 430205, China
2
State Key Laboratory of Information Engineering in Surveying, Mapping, and Remote Sensing, Wuhan University, Wuhan 430079, China
3
Shanghai Institute of Satellite Engineering, Shanghai 201109, China
*
Author to whom correspondence should be addressed.
Remote Sens. 2022, 14(2), 342; https://doi.org/10.3390/rs14020342
Submission received: 9 December 2021 / Revised: 4 January 2022 / Accepted: 10 January 2022 / Published: 12 January 2022

Abstract

:
Satellite platform jitter is a non-negligible factor that affects the image quality of optical cameras. Considering the limitations of traditional platform jitter detection methods that are based on attitude sensors and remote sensing images, this paper proposed a jitter detection method using sequence CMOS images captured by rolling shutter for high-resolution remote sensing satellite. Through the three main steps of dense matching, relative jitter error analysis, and absolute jitter error modeling using sequence CMOS images, the periodic jitter error on the imaging focal plane of the spaceborne camera was able to be measured accurately. The experiments using three datasets with different jitter frequencies simulated from real remote sensing data were conducted. The experimental results showed that the jitter detection method using sequence CMOS images proposed in this paper can accurately recover the frequency, amplitude, and initial phase information of satellite jitter at 100 Hz, 10 Hz, and 2 Hz. Additionally, the detection accuracy reached 0.02 pixels, which can provide a reliable data basis for remote sensing image jitter error compensation.

1. Introduction

Satellite platform jitter is a micro-vibration phenomenon that is caused by internal and external factors [1,2]. Many high-resolution satellites, such as QuickBird [3], ALOS [4], Pleiades [5], Ziyuan1–02C (ZY1–02C) [6], ZiYuan-3 (ZY-3) [7,8], and Gaofen-1 [9] have suffered from satellite jitter-related problems. For example, two different jitters at 6~7 Hz and 60~70 Hz in frequency were extracted by stereo images on the ALOS satellite, which caused about 1 pixel distortion on images [4]. According to space photogrammetry, a 1-arcsecond platform jitter event can induce a distortion error of about 2.5 m on an image if the satellite is in a 500-km orbit [10]. As spatial resolution continues to improve, the influence of platform jitter will become more obvious. For ultra-high-resolution optical satellites with a spatial resolution that is better than 0.3 m, the angular resolution of a single pixel is less than 0.1 arcsecond, which means that the platform jitter of 0.1 arcsecond will cause more than 1 pixel of image distortion. This makes it difficult to achieve the intended high-precision applications [11].
Satellite jitter has been a common challenge for remote sensing satellite processing, and many researchers have created platform jitter detection methods that are based on attitude sensors and remote sensing images [12]. An attitude sensor with high frequency and high precision is a direct means through which the jitter attitude of a platform can be measured. The means through which these methods are implemented require gyroscopes and angle sensors with high measurement frequencies and accuracies in order to obtain relative attitude information such as angular displacement, angular velocity, or angular acceleration, after which absolute attitude measurement sensors such as high-precision but low-frequency star sensors are used to obtain the absolute attitude of the satellite. Finally, high- frequency and high-precision attitude measurements are realized through attitude fusion methods, such as the Kalman filter [13,14,15]. Many high-resolution optical satellites such as the IKONOS satellite, the QuickBird satellite, the worldview series satellite, the Pleiades satellite, and the ALOS satellite all use this method to conduct high-precision and high-frequency attitude measurements [16,17,18,19,20]. Jitter with 100 Hz in both the across the track and the along the track directions was measured by means of high-frequency angular displacement for the Yaogan-26 satellite [15].
Satellite platform jitter detection that is based on remote sensing images is another important platform jitter processing method that can determine jitter distortion using images by means of parallax observation (such as multispectral imagery, staggered CCD images, and stereo image pairs) [21,22,23], ortho-images [24,25,26], and edge features in images [27,28]. Jitter at 0.65 Hz in both the across track and along track directions of ZY-3 was detected using multispectral imagery with parallax observation and triplet stereo image pairs [29,30,31,32]. Jitter with three different frequencies was found on mapping satellite-1 by staggered CCD images with parallax observation [33]. Ortho-images were used to find two different frequency jitter events for the QuickBird satellite [24]. A jitter event occurring at 200 Hz in the across track direction was extracted by means of linear objects in images that were taken by Beijing-1 [27].
Considering that high-resolution satellite imaging is more sensitive to satellite jitter as the spatial resolution improves, the traditional jitter processing methods present certain limitations. One concern is that the jitter parameters that are set during the installation of the attitude sensor and the focal plane parameters of the camera are not exactly the same, which makes it difficult to accurately compensate for the jitter error that appears on the high-resolution images. The other limitation is that the traditional image-based jitter detection methods are limited to imaging load design and reference data, which makes it difficult to completely acquire the jitter error.
In recent years, the area array CMOS (Complementary Metal Oxide Semiconductor) image sensor has gradually begun to take on an irreplaceable role in the aerospace engineering industry due to its various advantages, such as its low cost, fast speed, on-ship integrated image processing unit, strong anti-radiation ability, and lower power consumption [34,35]. The rolling shutter (RS) is one of common imaging mode of area array CMOS sensor, in which each row of the CMOS sensor is exposed and output at a certain time interval. Due to the fact that each row has a different exposure time, when the CMOS moves rapidly relative to the scene, the image will produce a corresponding deformation, which is called the RS effect. For this reason, the area array CMOS sensor with rolling shutter has become a new satellite platform jitter detection device installed on the same imaging focal place as the linear array CCD (Charge-Coupled Device). The jitter errors on the imaging focal plane can be obtained using the RS effect and can be further applied to compensate jitter error for the linear array CCD image to improve the geometric accuracy. Liu et al. has conducted simulation experiments using one pairwise set of CMOS images by rolling shutter to extract the jitter parameters. The relative error of the detected frequency did not exceed 2%, and the absolute amplitude error was about one pixel [36]. Zhao et al. applied the method on a high-resolution satellite that was launched in 2020 and found satellite jitter with 156 Hz [37].
In this paper, the sequence CMOS images captured by rolling shutter mode were used to obtain corresponding points in overlapping regions of adjacent sequence images by means of a dense matching algorithm, and they were then used to obtain the relative jitter error curve of the imaging focal plane. The frequency, amplitude, and initial phase information of the absolute jitter error can be calculated by the Fourier transform and sinusoidal function models. The method proposed in this paper can accurately recover the absolute jitter error on the imaging focal plane of the optical camera, which provides a reliable data basis for jitter error compensation for high-resolution remote sensing imagery. Experiments using three groups of sequence COMS images suffering from satellite jitter with different frequencies were conducted to verify the accuracy and reliability of the proposed method.

2. Materials and Methods

2.1. Jitter Detection Principle of CMOS Image by Rolling Shutter

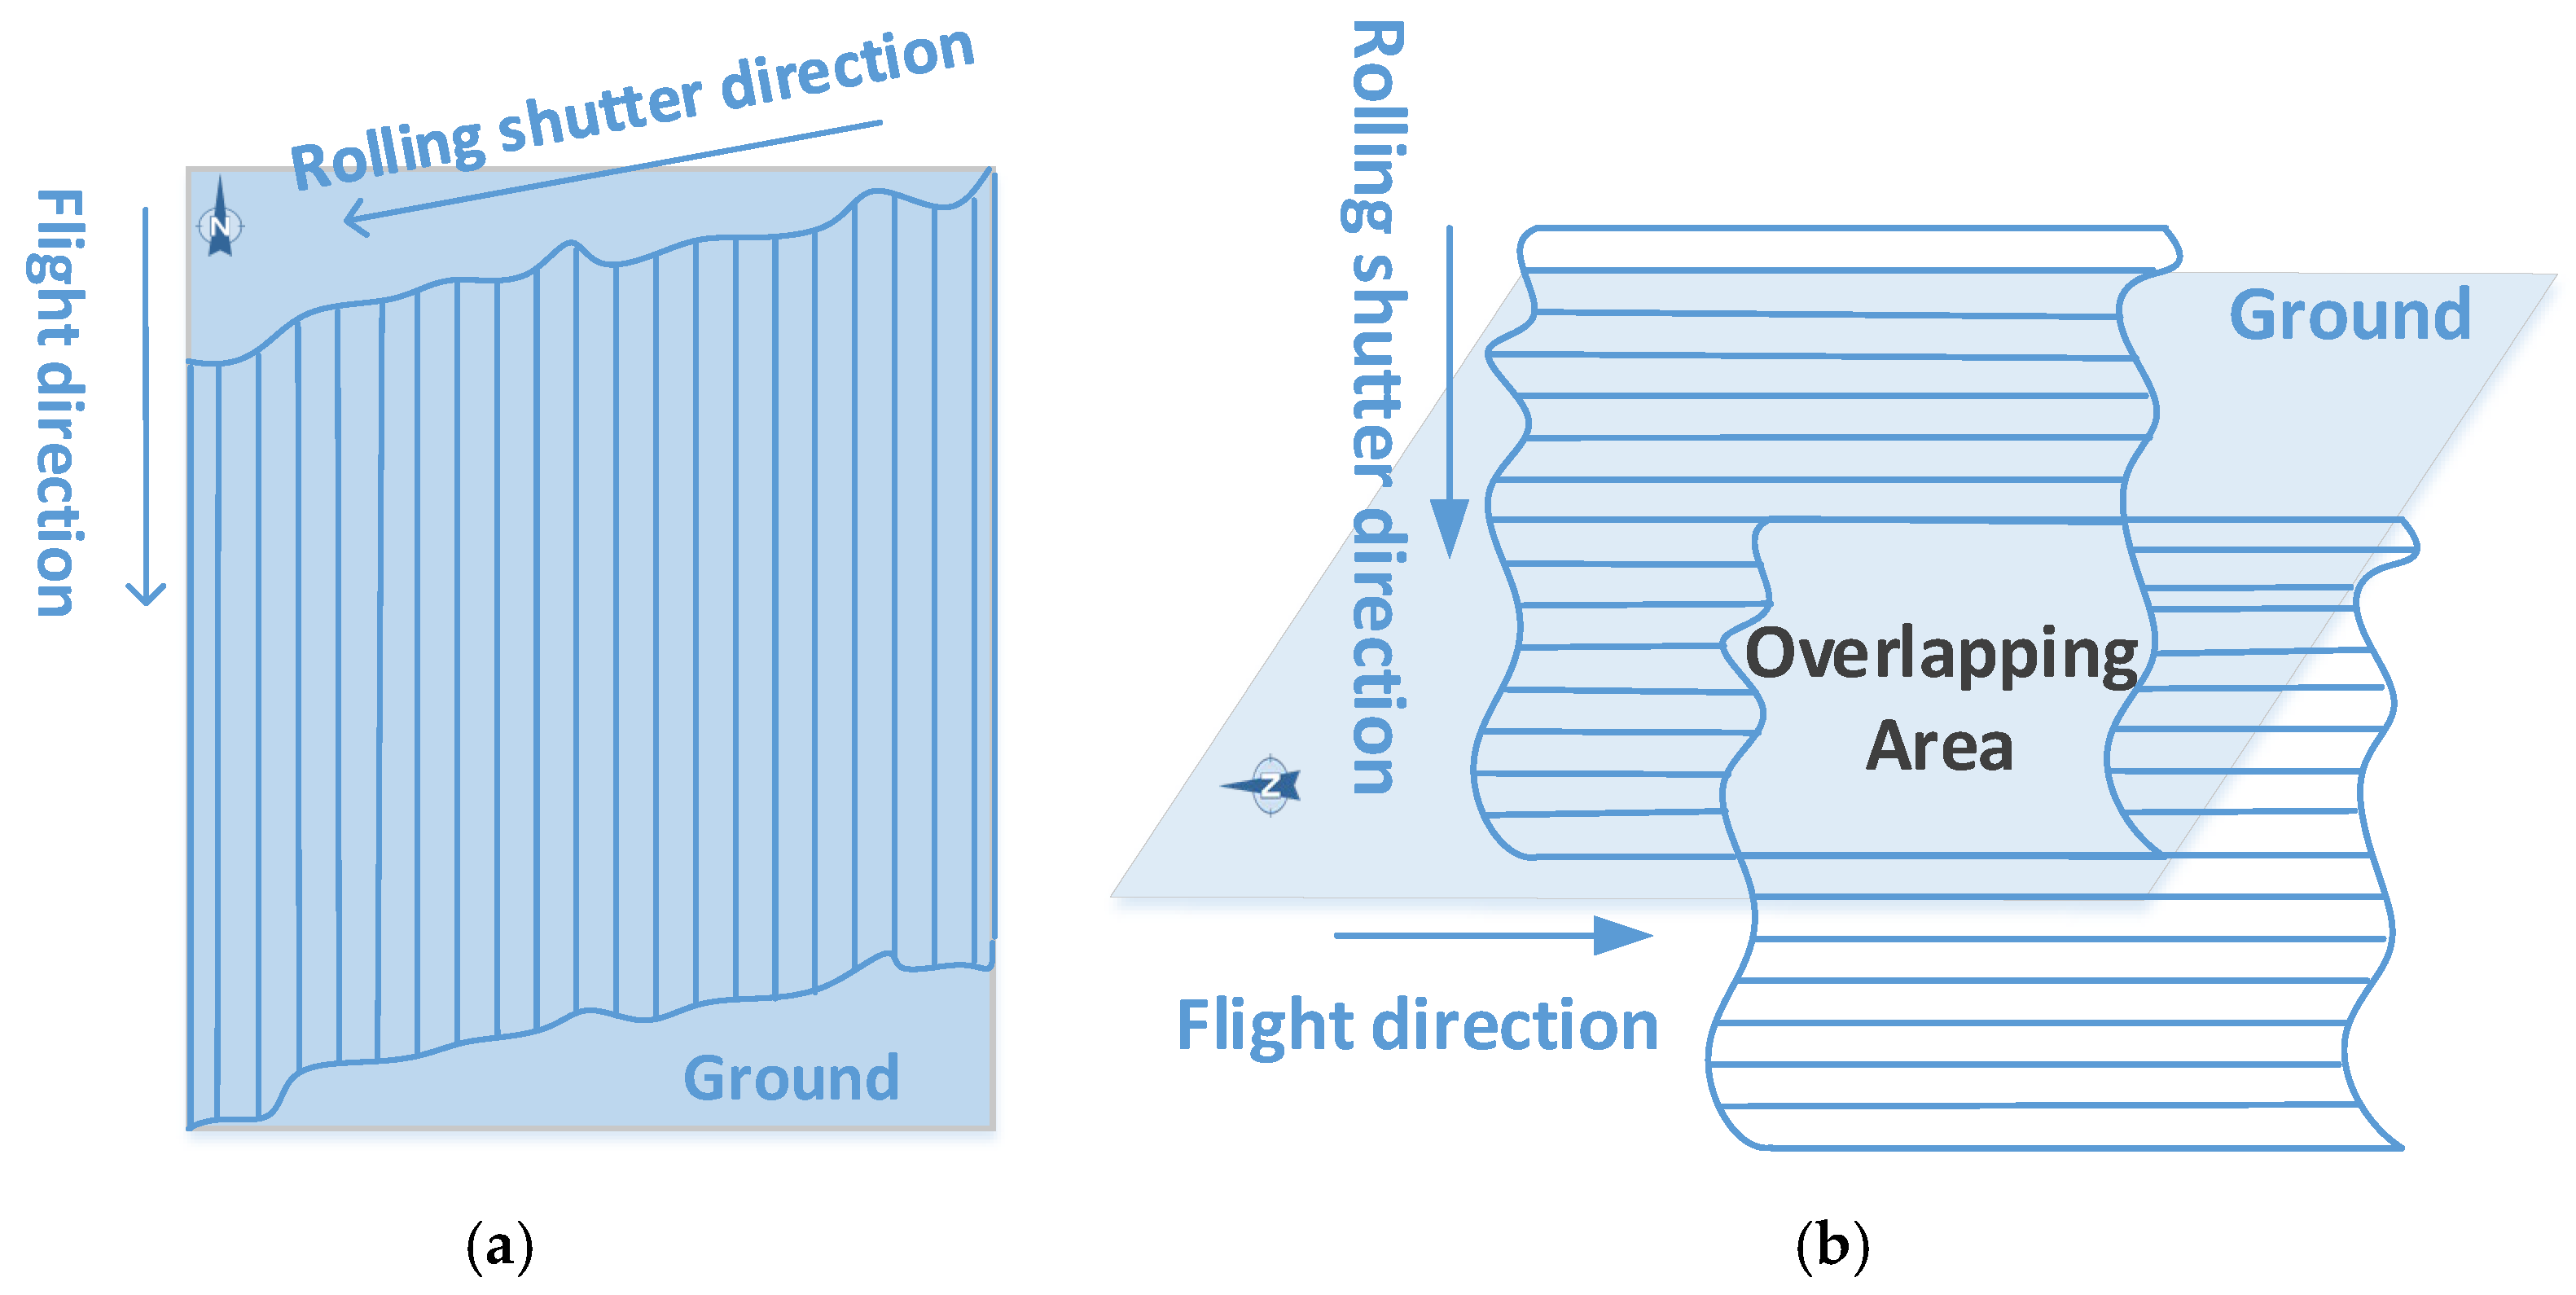
2.1.1. Imaging Characteristics of CMOS Sensor with Rolling Shutter

As each image line has a different imaging time, the CMOS sensor with rolling shutter will create image deformation when imaging moving objects or stationary objects if the sensor is moving. There are two imaging situations with rolling shutter: One situation entails that the rolling shutter is perpendicular to the motion direction. The other one entails that the roller shutter direction is parallel to the motion direction. For the first situation, considering that the CMOS image sensor is installed on the remote sensing satellite, the flight direction of remote sensing satellite is generally oriented from North to South, so the rolling shutter direction of the CMOS sensor will be oriented from East to West, as shown in Figure 1a. When the satellite is flying, the sensor takes images starting from the right column of its field of view, forming a parallelogram-shaped ground coverage range, as shown in Figure 1b. The corresponding relationship between the output CMOS image by rolling shutter and the ground range is shown in Figure 1c.
When the rolling shutter direction of the CMOS sensor is parallel to the direction of motion, the deformation law of the image is more complicated. If the rolling direction is parallel but reverse to the direction of motion, then the scene in the captured image is shortened. If the rolling shutter direction is parallel and is the same as the movement direction, then the scenery in the image is stretched. Further considering the moving speed and rolling exposure speed, the scenery in the image is positive if the movement speed is slower than the rolling exposure speed; otherwise, the scenery in the image is in reverse.
Due to the line-by-line imaging characteristics of the CMOS sensor with rolling shutter, it provides the possibility of vibration parameter detection because of its sensitivity to micro-vibrations. Comparing these two imaging designs, the first imaging design mode is better suited for jitter detection, as the deformation is much simpler; so, it can be adopted to extract the image distortion from the deformation image.

2.1.2. The Principle of Jitter Detection Using CMOS Images by Rolling Shutter

Since satellite jitter is usually an attitude fluctuation that changes over time, it will lead to different deviations of each imaging line of the CMOS sensor with rolling shutter. As shown in Figure 2a, the ground coverage is deformed, consisting of parallelogram-shaped deformation and time-varying distortion of the edges. The former one is caused by the rolling shutter characteristics while the latter one is caused by the satellite jitter. Therefore, the corresponding image contains a time-varying distortion induced from satellite jitter. Conversely, satellite jitter can be detected through the distortion on the CMOS images by rolling shutter. As mentioned in the introduction, determining jitter distortion using images with parallax observation is an effective method. By controlling the angular velocity of the satellite, there is overlap between two consecutive frames, as shown in Figure 2b, which constructs parallax observation-like multispectral images [9]. Considering that the flight direction and speed are steady in a short time, the parallelogram-shaped deformation caused by the rolling shutter characteristics is almost the same for each imaging line, and the parallax between the adjacent images is fixed if satellite jitter does not exist. When satellite jitter appears, the parallax of the overlapping area between two images will change with the imaging lines.
Considering that satellite jitter is a periodic micro-vibration that changes over time, the image distortion that is caused by it also presents time-varying characteristics. As the two adjacent frames are not simultaneously imaged, the effect of the platform jitter is not synchronized. According to the principle of motion synthesis, the relative error that is caused by platform jitter between the two frames also changes with time if platform jitter appears, a phenomenon that can be expressed by Equation (1):
g ( t ) = f ( t + Δ t ) f ( t )
where g ( t ) is the function of the relative error of the platform jitter as it changes over time, f ( t ) is the function of absolute error of the platform jitter as it changes over time, and Δ t is the imaging time interval between two images that correspond to the same ground objects.
Since the small CMOS sensor can be installed on the same focal plane as the main linear CCD sensors, the detected jitter parameters can be easily and accurately used for the CCD images.

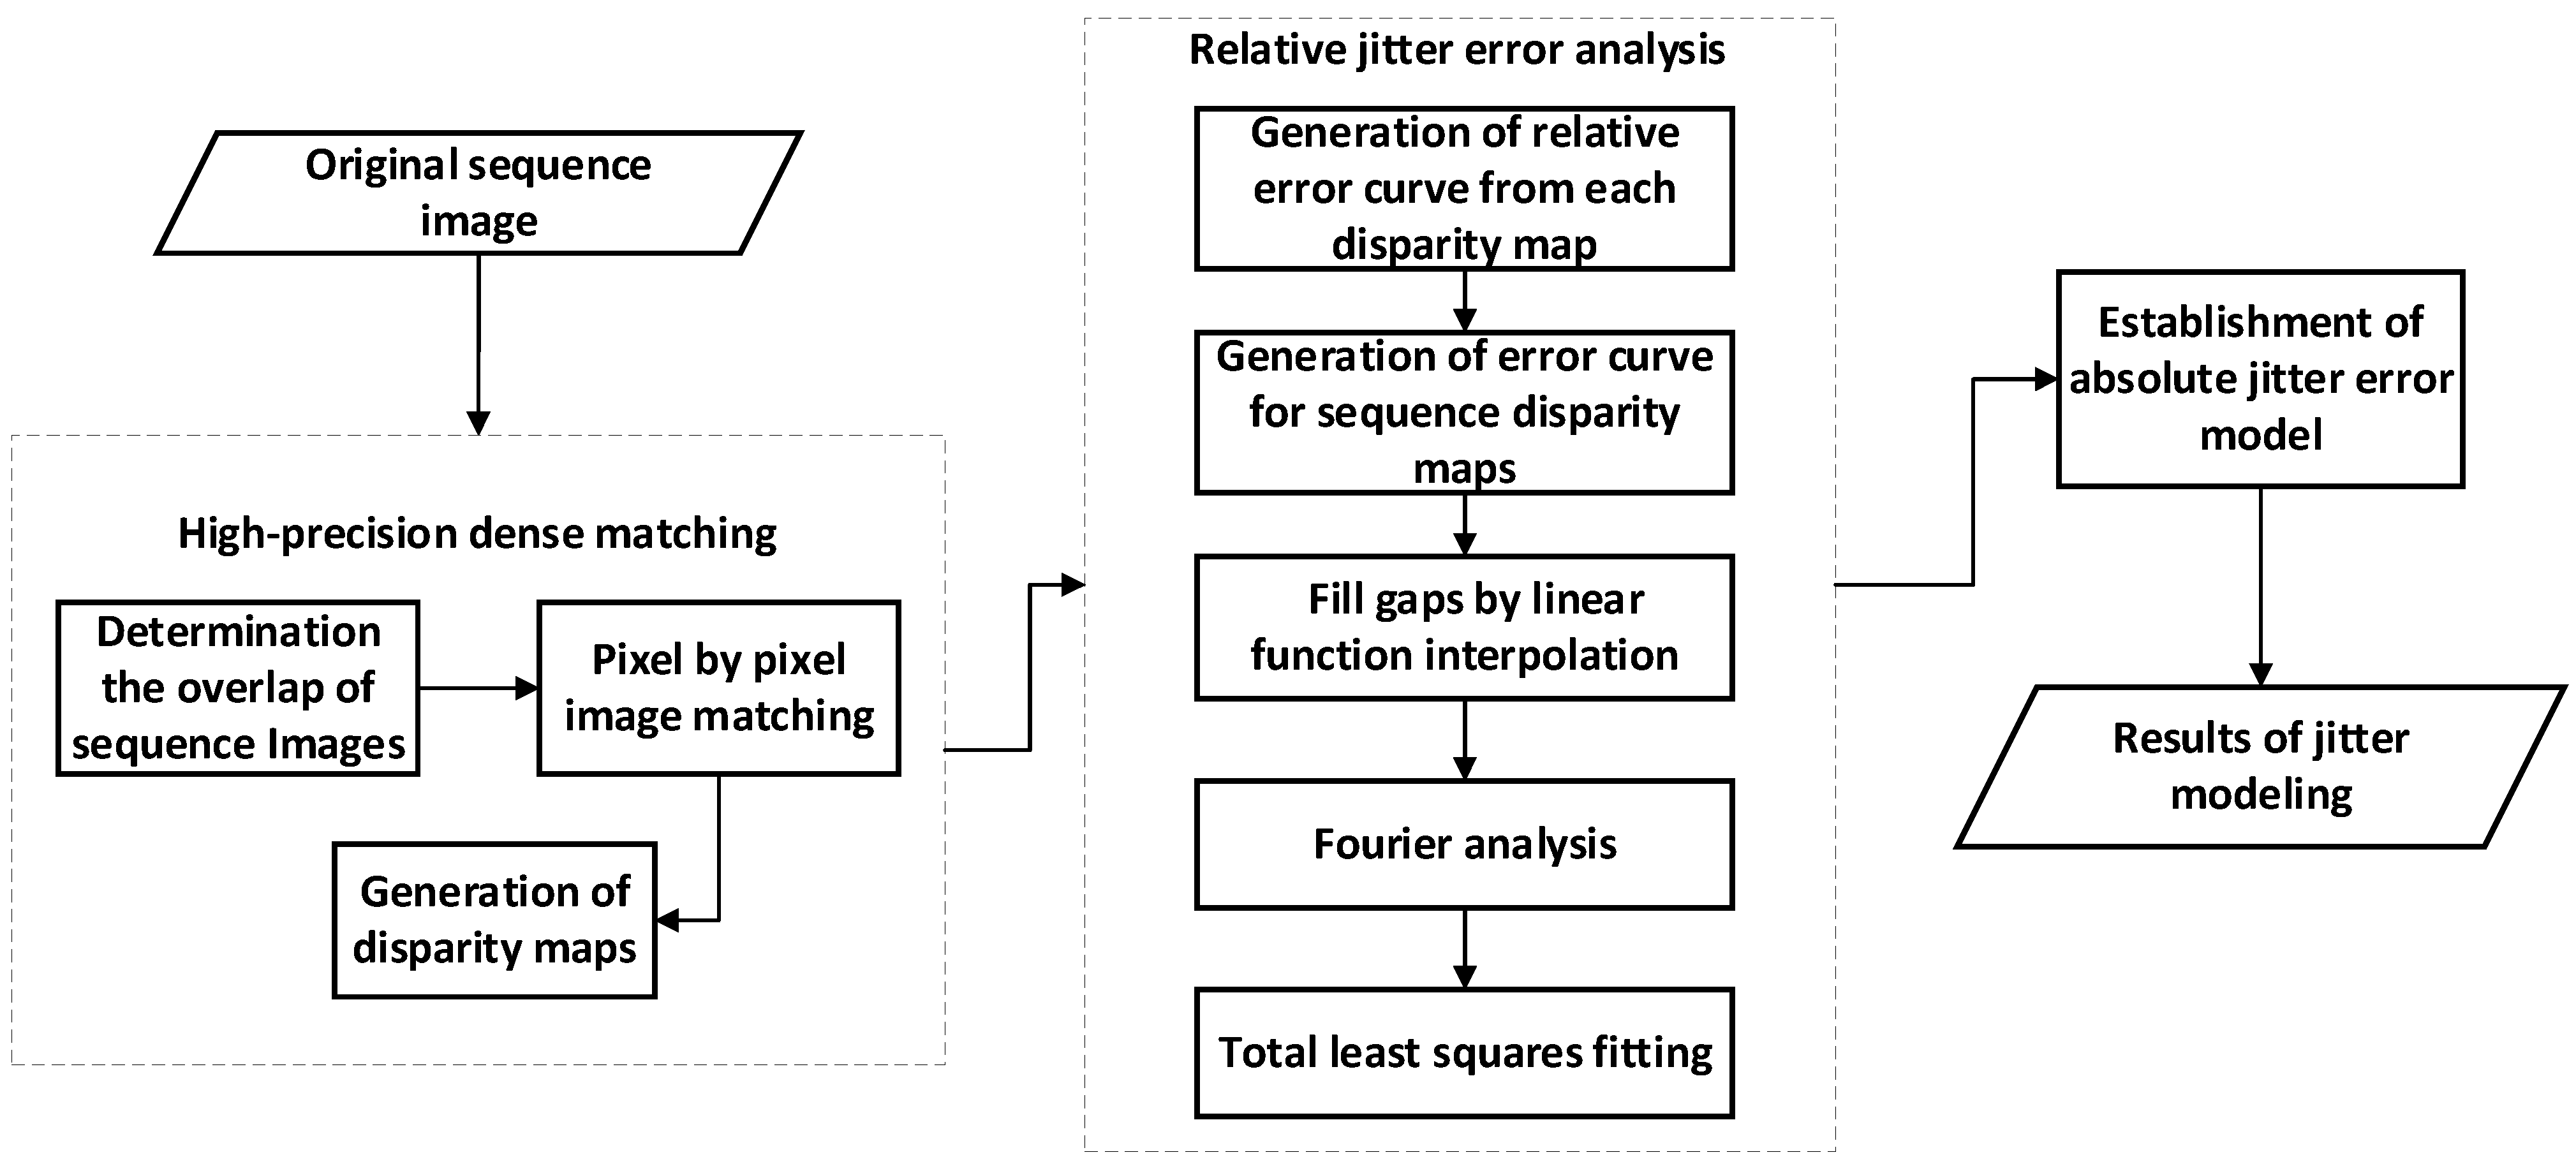
2.2. Detection of Jitter Based on CMOS Sequence Images by Rolling Shutter

Jitter detection that is based on sequence CMOS images by rolling shutter mainly includes three steps. Firstly, the overlapping range of the sequence images is determined, and the disparity map is generated by dense sub-pixel matching in the overlapping area. Then, the consecutive relative error curve of the jitter based on sequence disparity maps is obtained via a time series analysis and linear function interpolation, and the relative error curve is then fitted using the sinusoidal function model taking the frequency and amplitude by Fourier analysis as initial value. Finally, based on the fitting results, the absolute jitter error model can be established using the principle of motion synthesis, and the frequency, amplitude, and initial phase information of the absolute error on the camera focal plane that are caused by satellite jitter are obtained. The flowchart is shown in Figure 3.

2.2.1. Dense Matching of Sequence CMOS Images

Apart from the above, the overlapping area is almost the same between images of multispectral bands, and the overlap of the adjacent frames in sequence CMOS images is related to the satellite angular velocity, which is not a fixed value. First, it is necessary to determine the overlapping relationship for each set of the sequence that is to be used for jitter detection. In this paper, the SIFT algorithm [38] was used to match some of the corresponding points between two frames, and a linear shift model was used to estimate the shift between two frames in both the sample and line directions by using the matching points. This was to determine whether the jitter detection area between two frames can be directly calculated using the shift parameters. In other words, the initial position of each pixel in the pre-sequence image on the post-sequence image can be calculated using the same shift parameters. If the image point is beyond the coordinate range of the post-sequence image, then it means that the point is not in the overlapping area.
Furthermore, correlation coefficient template matching and the least-square matching algorithm were used to match each image pixel by pixel, allowing the corresponding points in the overlapping area to be obtained. The coordinate difference between the rows and columns of the corresponding points was calculated. Taking the coordinate difference as the DN value, the coordinate difference maps of the two directions were obtained, namely, a disparity map. As such, there were N-1 group disparity maps for CMOS image sequences, with total number of N.

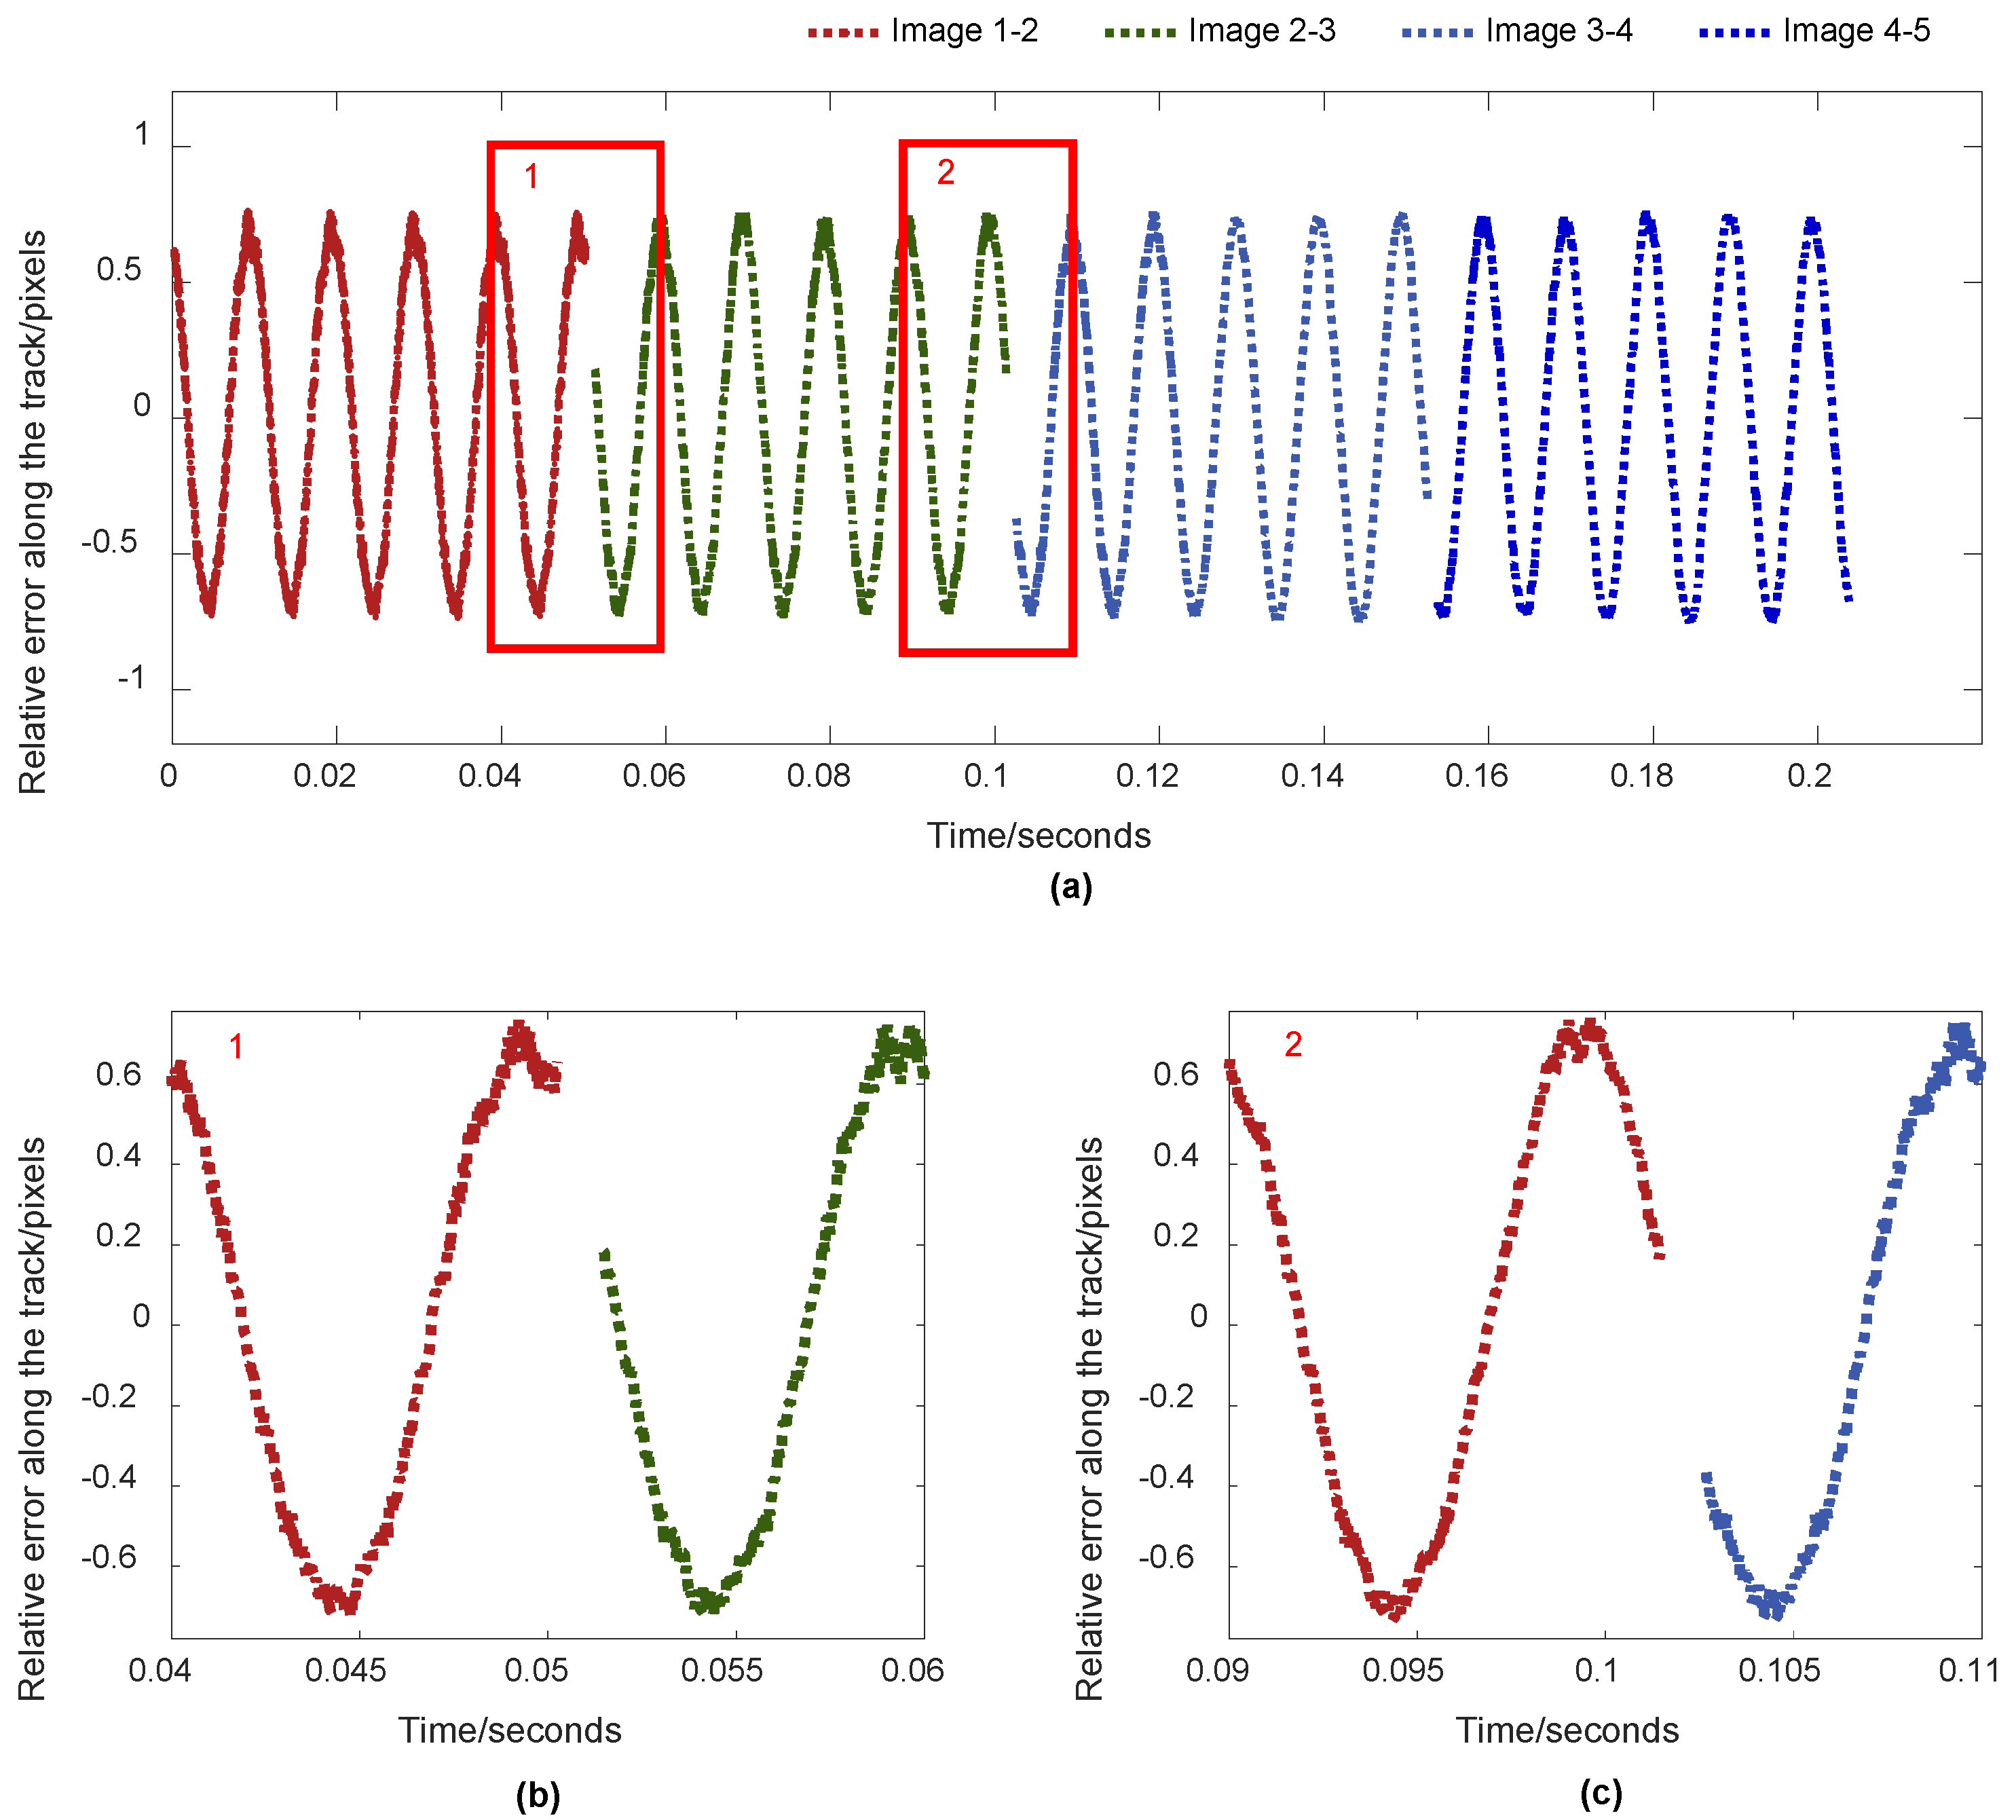
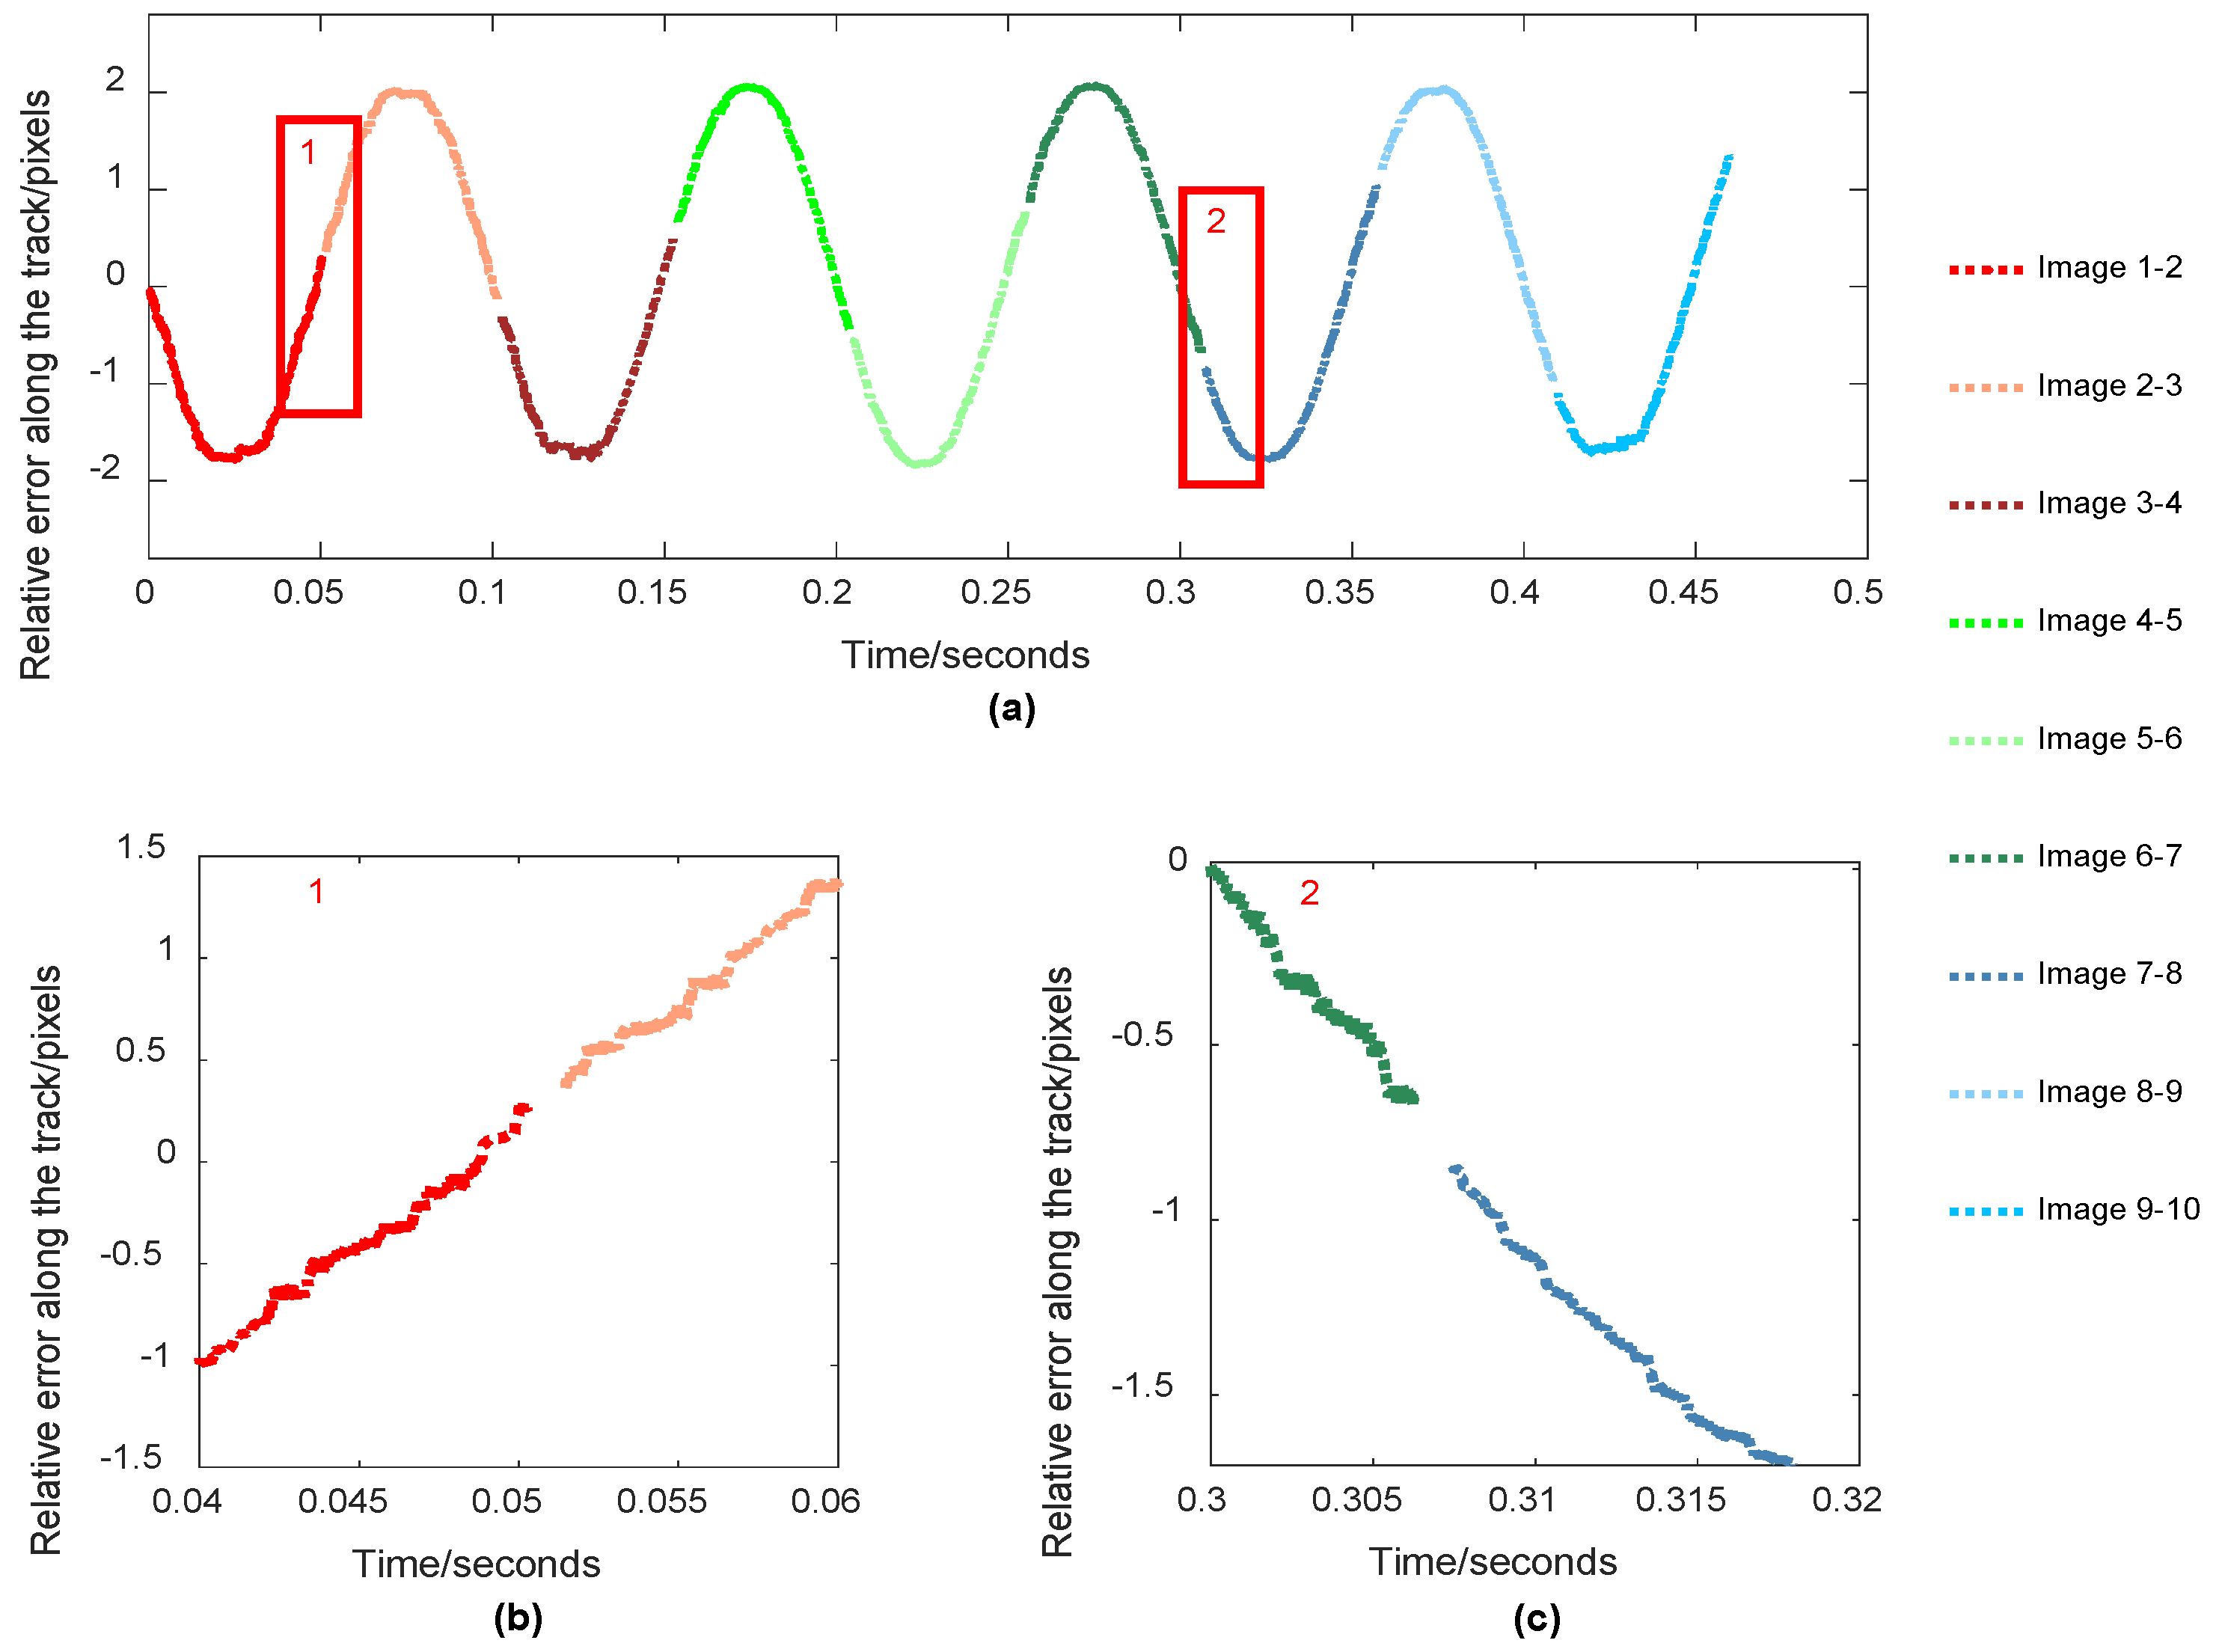
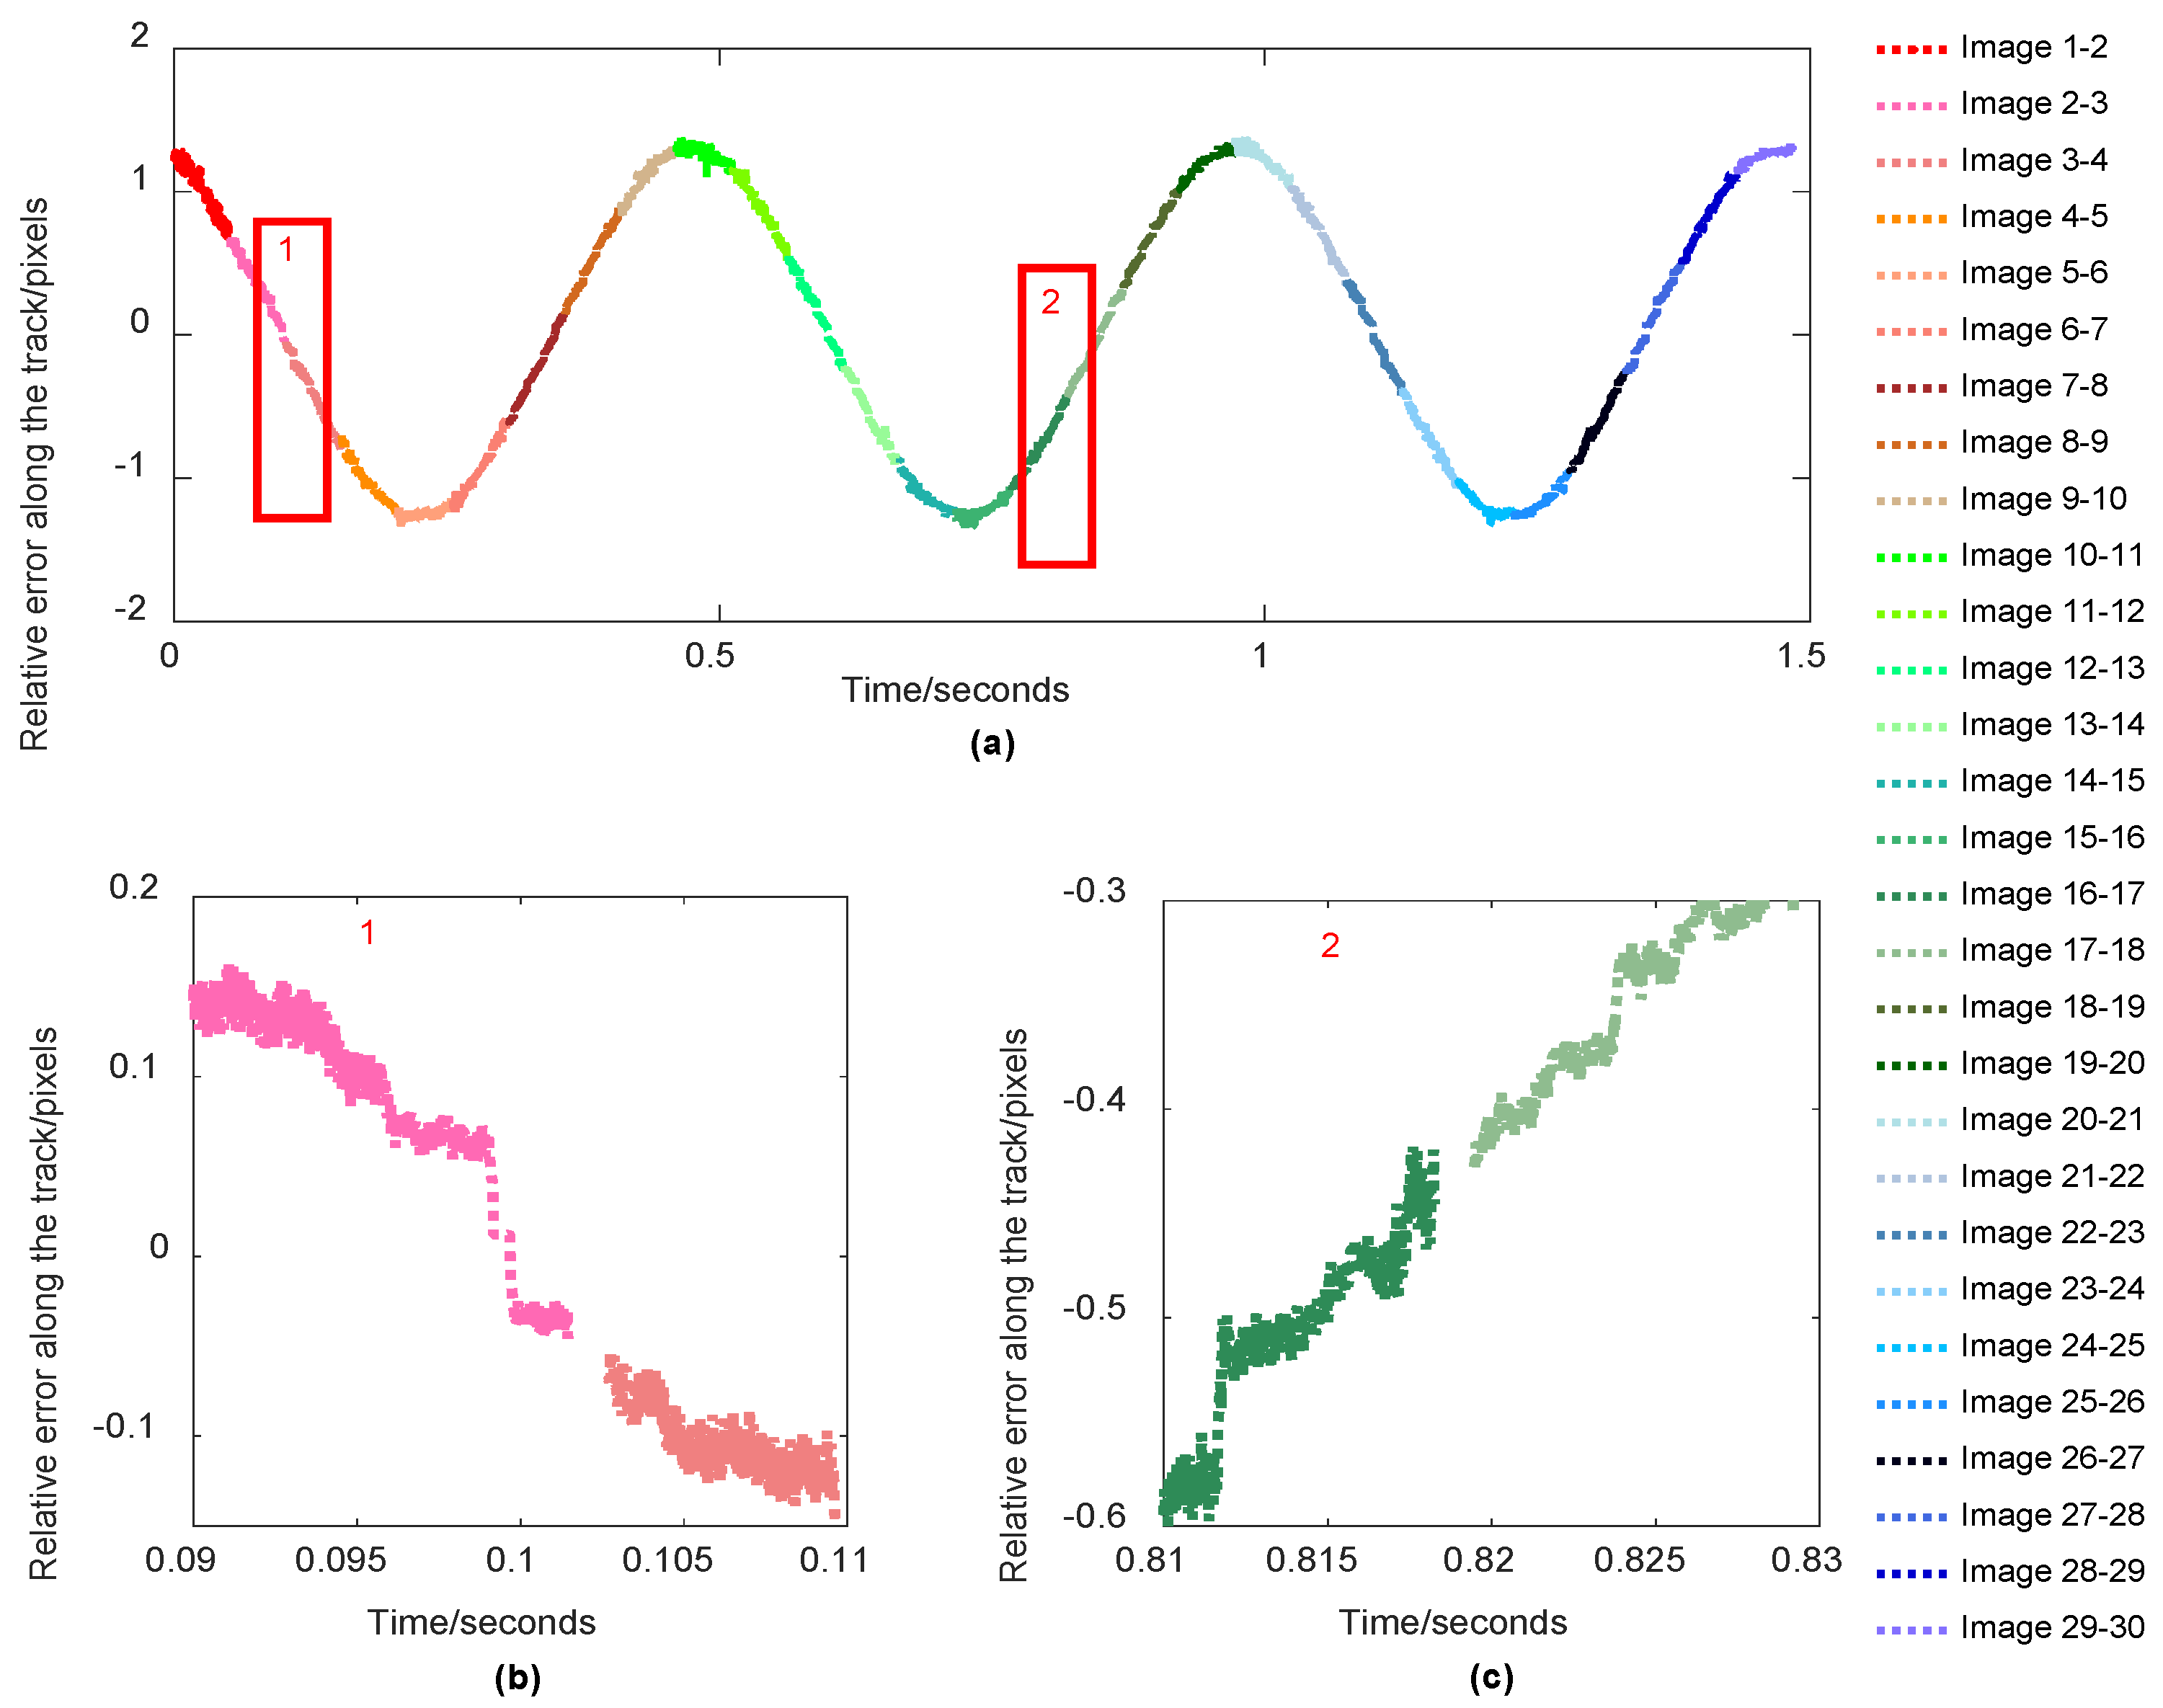
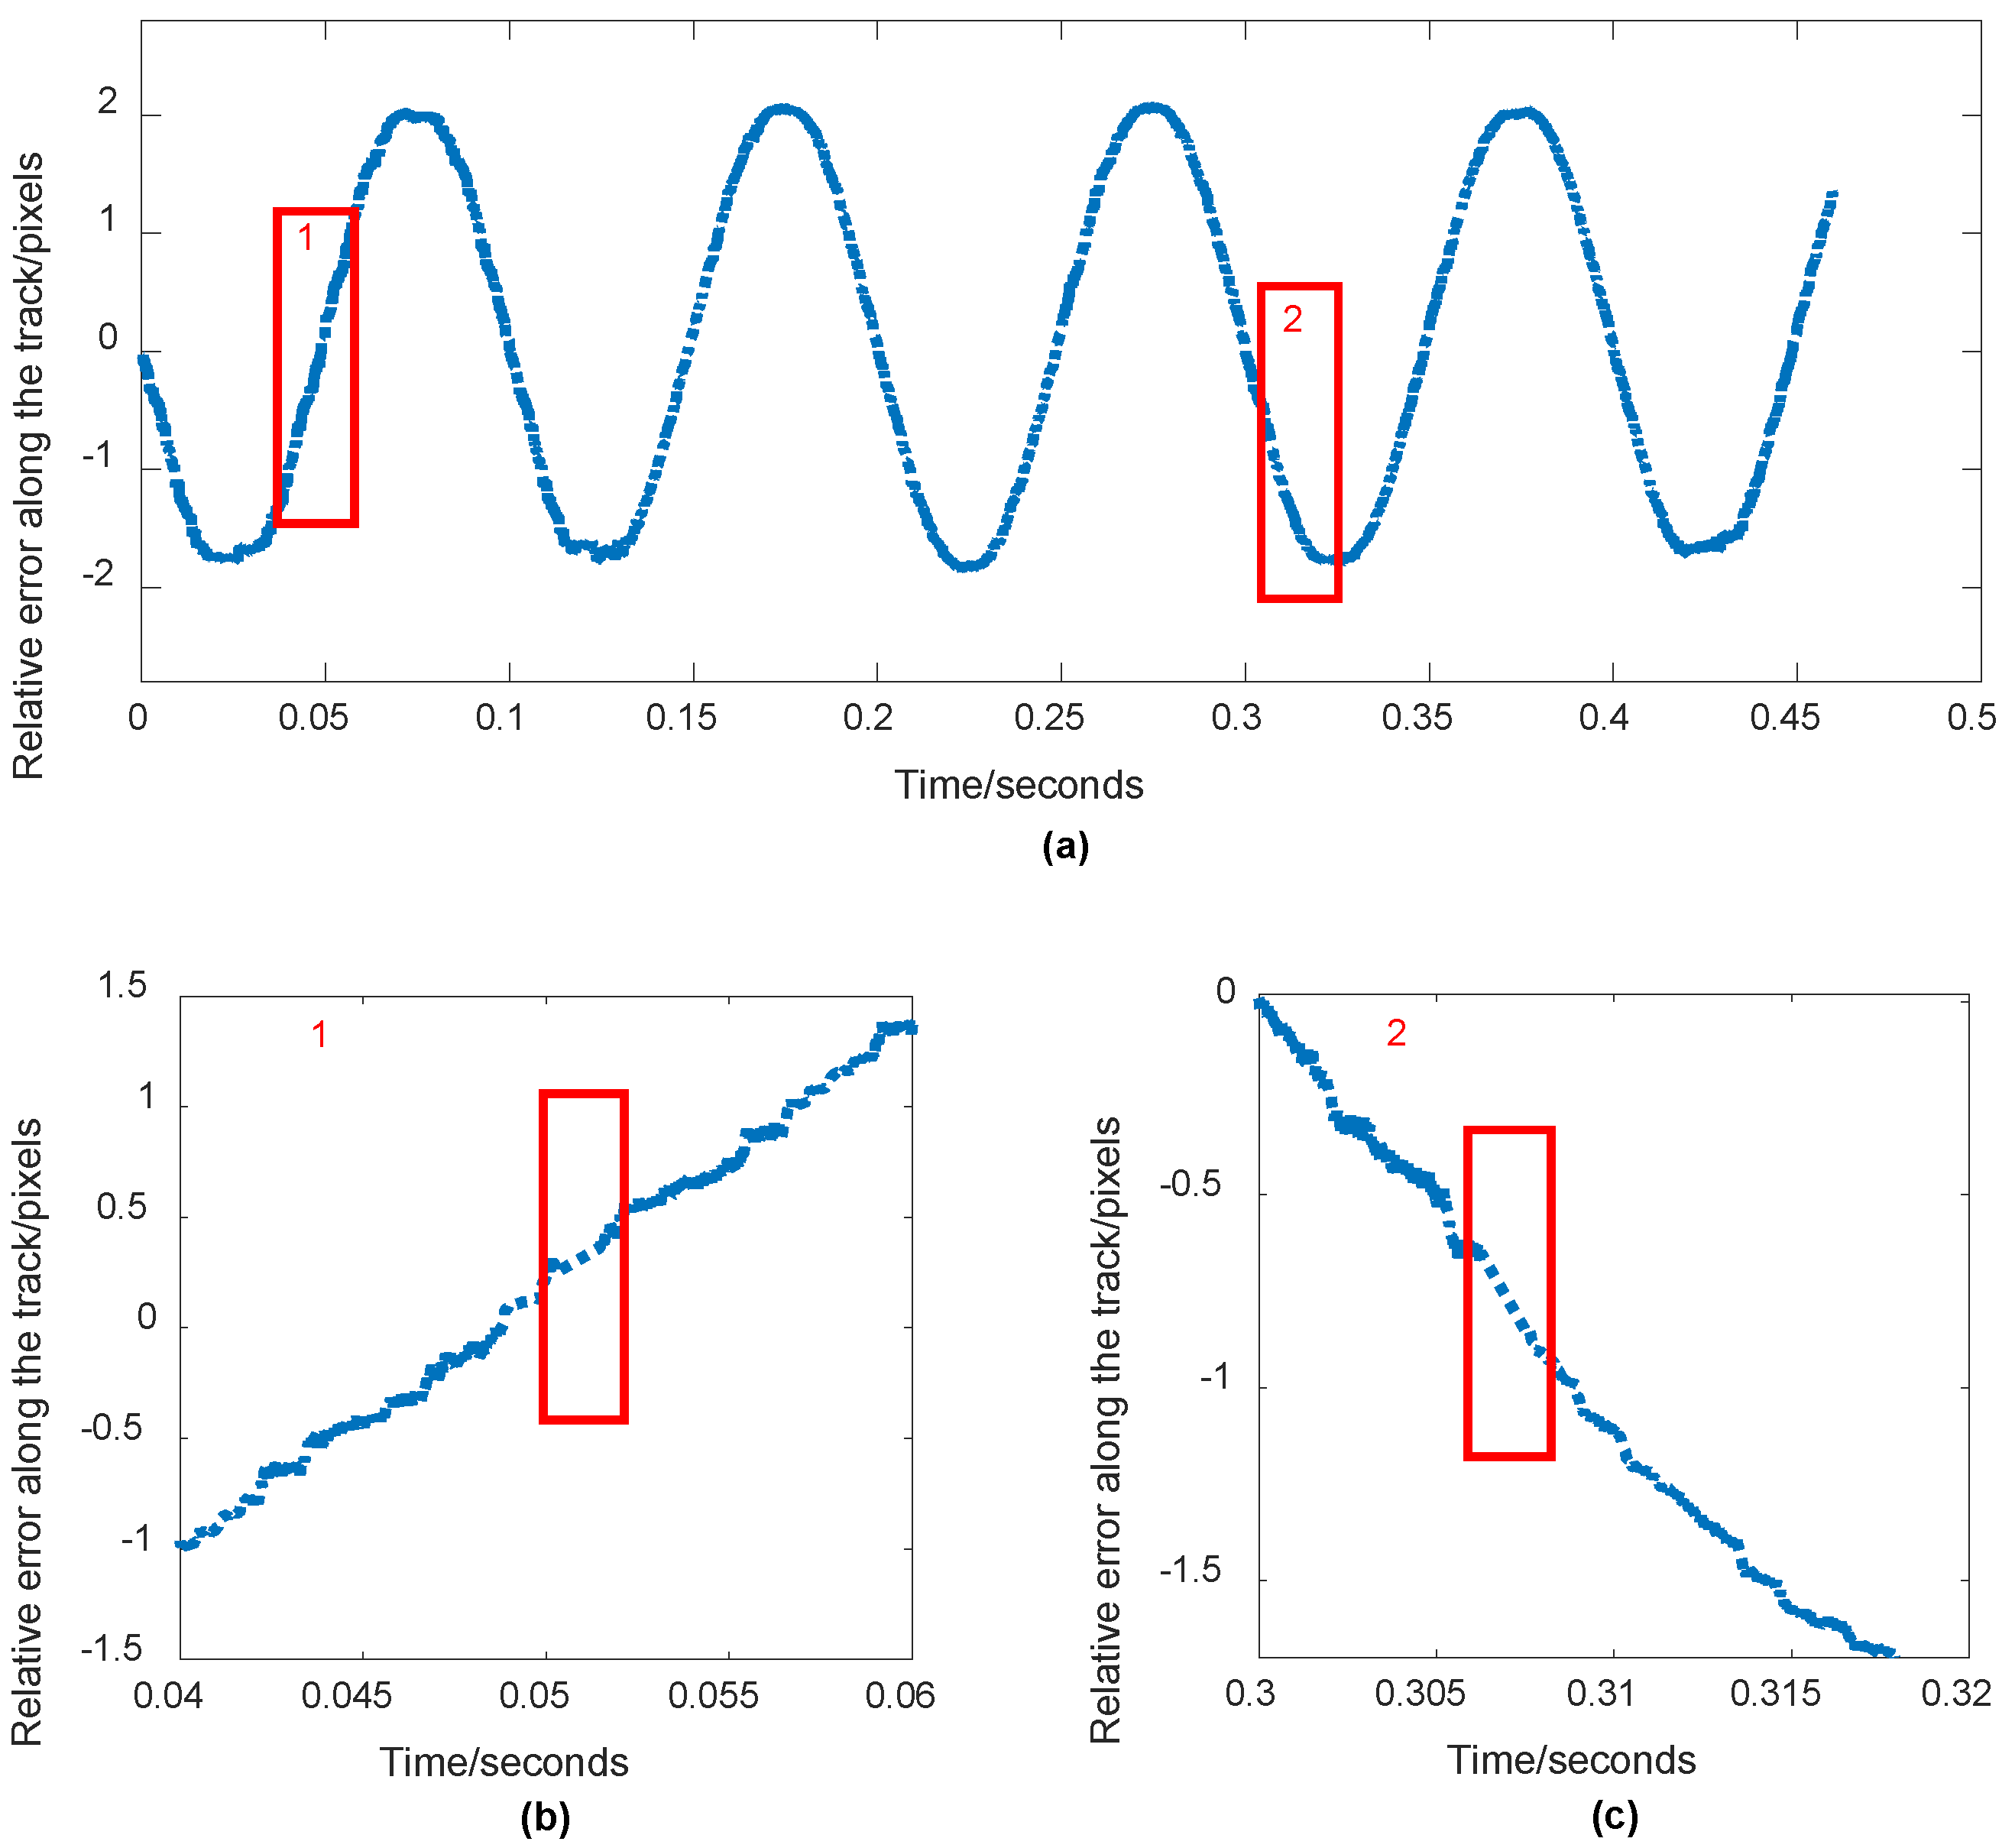
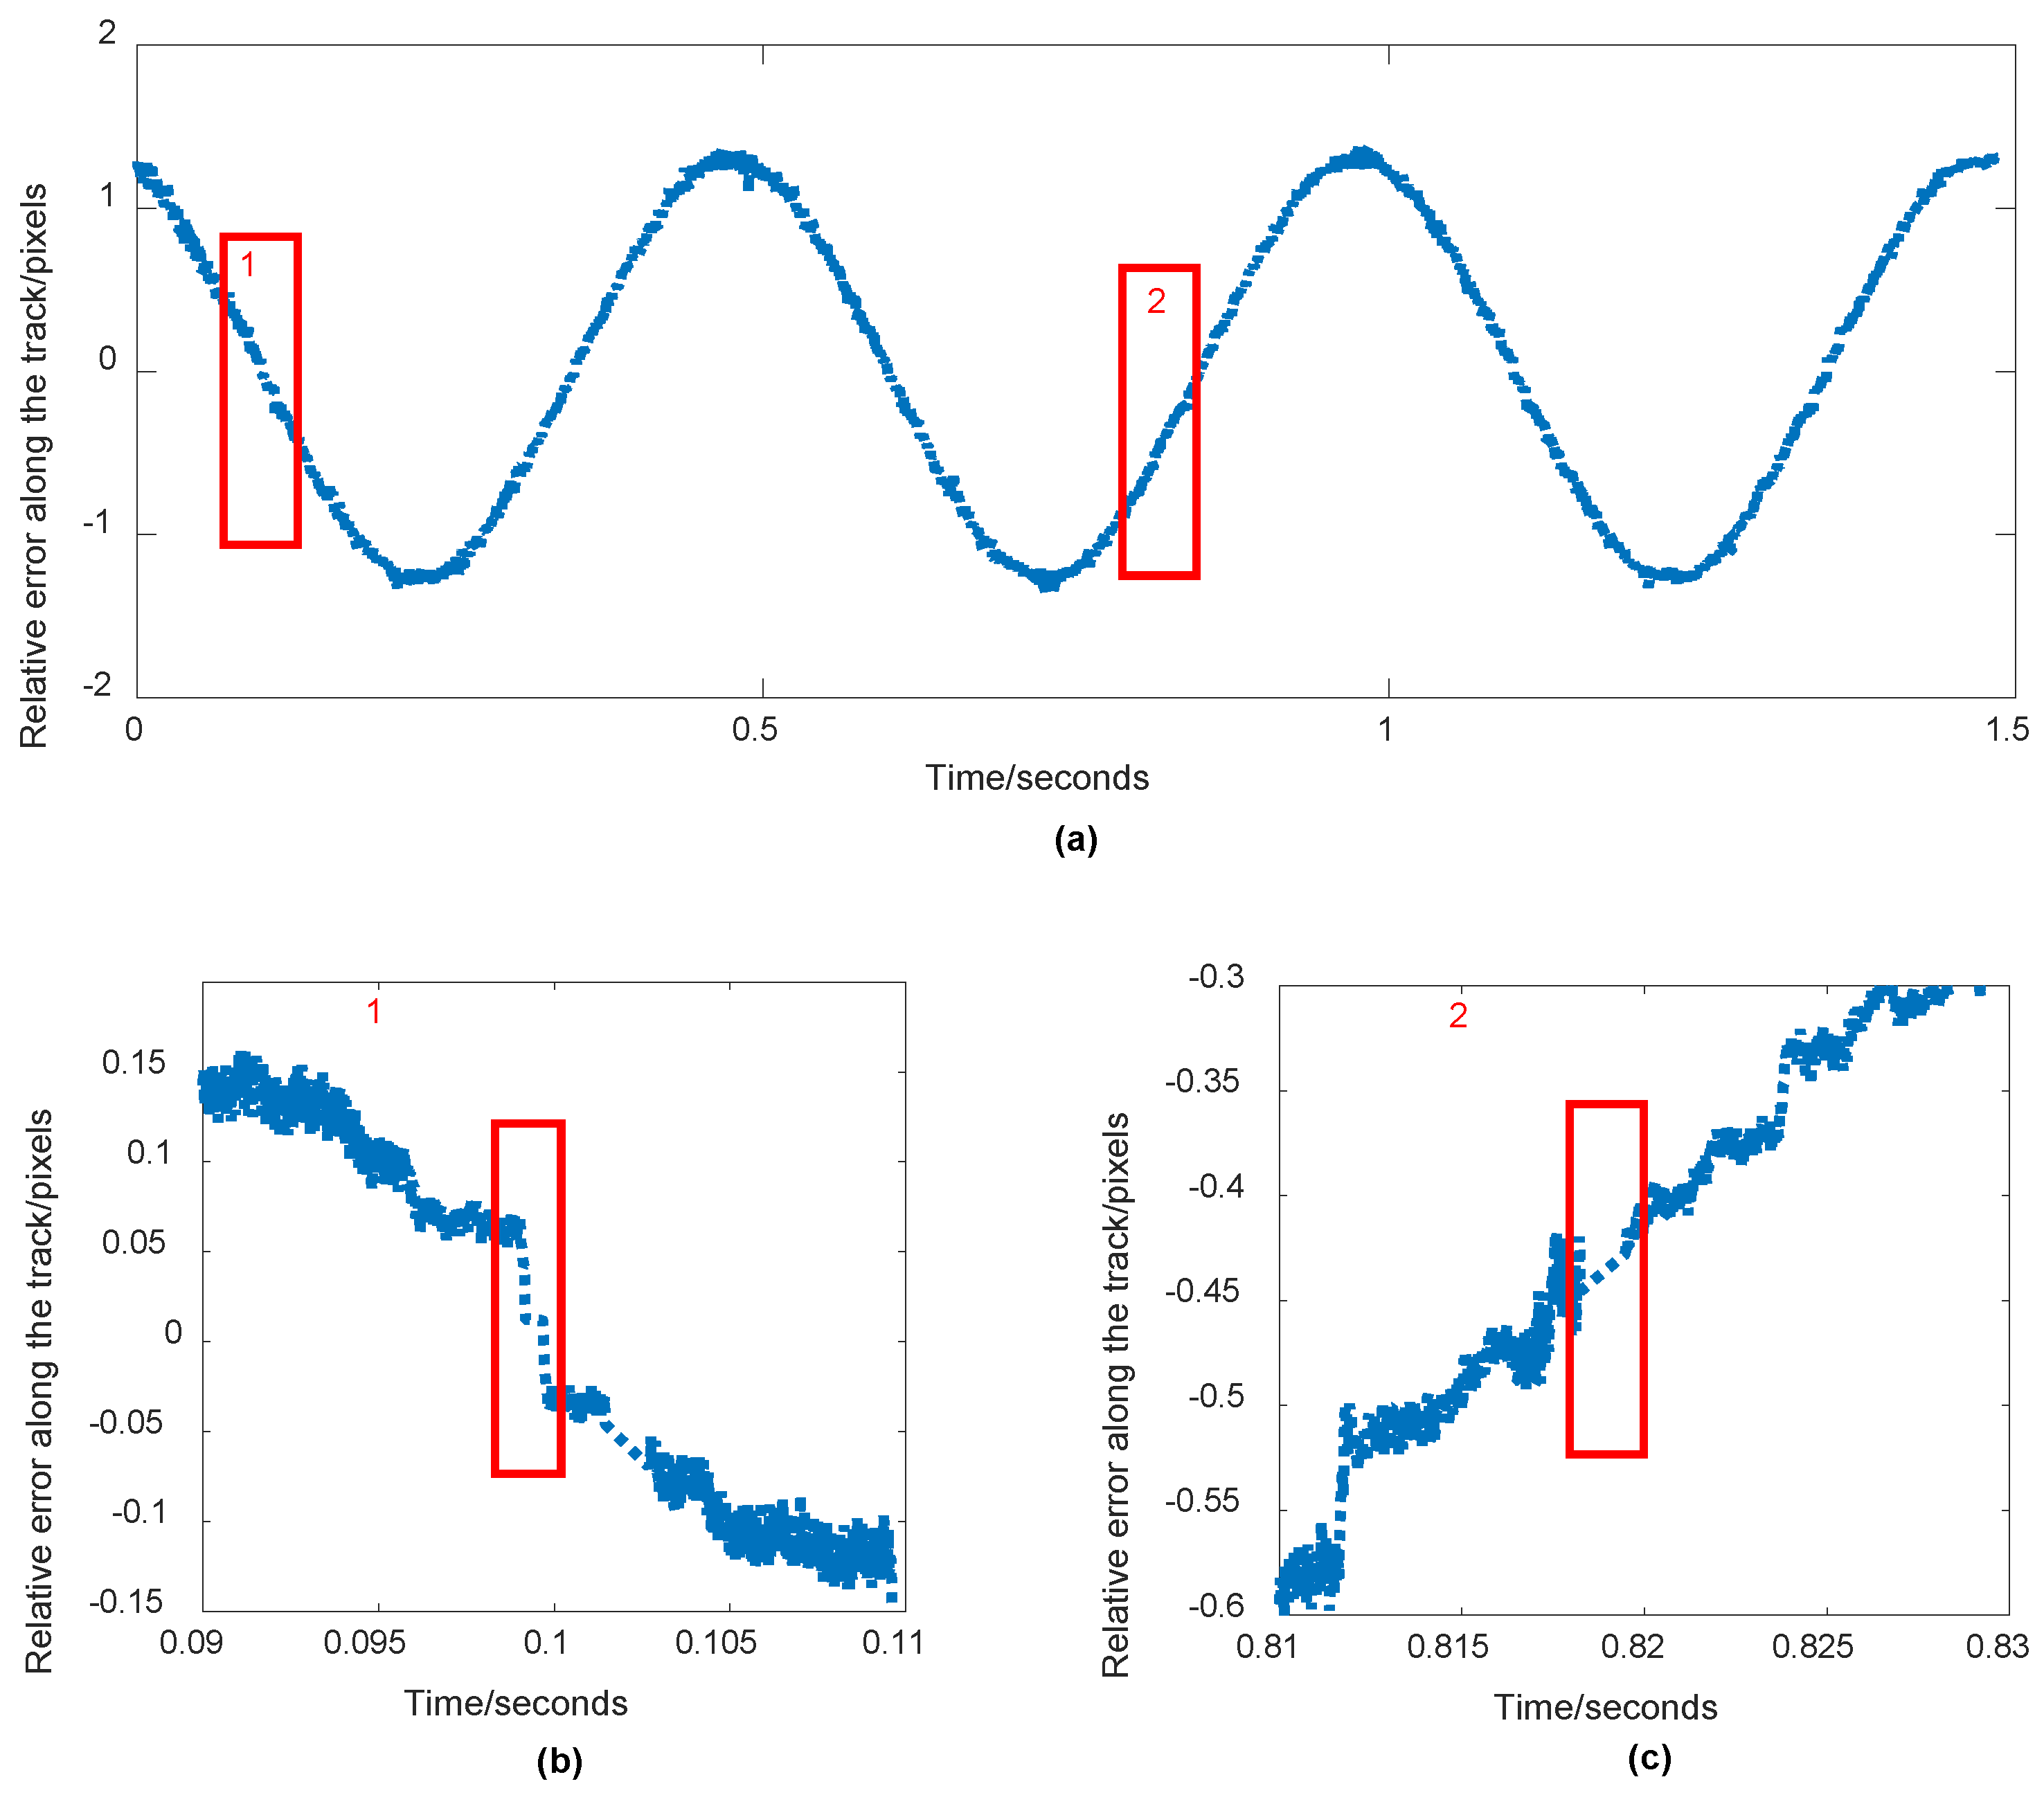
2.2.2. Relative Jitter Error Analysis of Sequence CMOS Images

In order to analyze the time-varying characteristics of the relative error, the average value of each line in the disparity map was calculated as the relative error of the line. As such, the relative error curves of the jitter along the scanning line or during the imaging time were obtained [36].
Considering that the CMOS sensor for jitter detection is generally small in size, with many sensors being 2048 × 2048, it is difficult to describe the variation trends that are seen in the jitter error when using a group disparity map if the jitter frequency is low. This is the reason for combining multiple sets of sequence images to analyze the detection results. Due to the size of the matching window, there is a “gap” between the two adjacent relative error curves, which will decrease the accuracy of following Fourier transform analysis. As such, the gap between the adjacent relative error curves should be filled accurately in order to ensure the sample distance of the relative error is even.
In this paper, the interpolation method is used to fill the “gap” among the detection results. A fitting function is generated by using the value of the known independent variable of the unknown function and its corresponding function value. Additionally, these points fill in the blank section.
Considering the fact that the gap between the adjacent curves from the parallax images is as short as the matching windows, the gap generally is usually not bigger than 15 pixels. As such, a simple local linear function fitting interpolation method was adopted in this paper. The data for the two points at the beginning and at the end of the “gap” were known. Through the values of the two points, the local linear function between the two points was obtained, and the “gap” was completely filled by this function. Therefore, it was necessary to calculate the function value according to the known value of the independent value and to insert these points into the gap. The linear interpolation function is shown in Equation (2):
y = a x + b
The slope a = ( v x ( k ) v x ( k 1 ) ) / ( t ( k ) t ( k 1 ) ) and the cutoff b = v x ( k ) a t ( k ) can be calculated directly, where v x ( k ) , v x ( k 1 ) , t ( k ) , t ( k 1 ) is the known function value and independent variable, and k is the sequence number of sample points.
At a specific time, the platform jitter can be considered to be harmonic motion combined with one or more sinusoidal function. In order to accurately model the jitter relative error curve of the platform, the frequency and amplitude that are obtained by the Fourier transform analysis can be used as the initial values. The sinusoidal function model is used to fit the error curve by least squares fitting, and the frequency, amplitude, and initial phase of the jitter relative error are accurately estimated, as shown in Equation (3):
g ( t ) = k = 1 N A r k sin ( 2 π f k t + φ k )
where f k , A r k , and φ k are the frequency, amplitude, and initial phase of the kth sinusoidal component of the relative error of vibration, respectively.
Usually, the satellite only has a single main platform jitter frequency that only lasts for a short period of time; so, in this article, we only discuss the case of k = 1.

2.2.3. Absolute Jitter Error Modeling

According to the principle of motion synthesis, the frequency of the absolute jitter error should be consistent with the frequency of the relative jitter error. Combining Equations (1) and (4), when there is only one jitter frequency, the absolute jitter amplitude can be calculated according to the following Equation (4) [9]:
A d = A r / ( 2 sin ( π   f Δ t ) )
where A d is the absolute jitter amplitude error, A r is the relative jitter error frequency, f is the jitter frequency, and Δ t is the homologous point imaging time interval of two adjacent frames of images.
The initial phase calculation expression for the absolute jitter error is further obtained, as shown in Equation (5) [9]:
φ = { φ π / 2 π f Δ t 0 < mod ( f Δ t / 2 , 2 ) < 1 φ + π / 2 π f Δ t 1 < mod ( f Δ t / 2 , 2 ) < 2
where mod ( f Δ t / 2 , 2 ) represents the remainder of f Δ t / 2 divided by 2.
Therefore, the absolute jitter error can be expressed as follows:
D ( t ) = { A r 2 sin ( π f Δ t ) sin ( 2 π f t + φ π / 2 π f Δ t ) 0 < mod ( f Δ t / 2 , 2 ) < 1 A r 2 sin ( π f Δ t ) sin ( 2 π f t + φ + π / 2 π f Δ t ) 1 < mod ( f Δ t / 2 , 2 ) < 2

3. Results

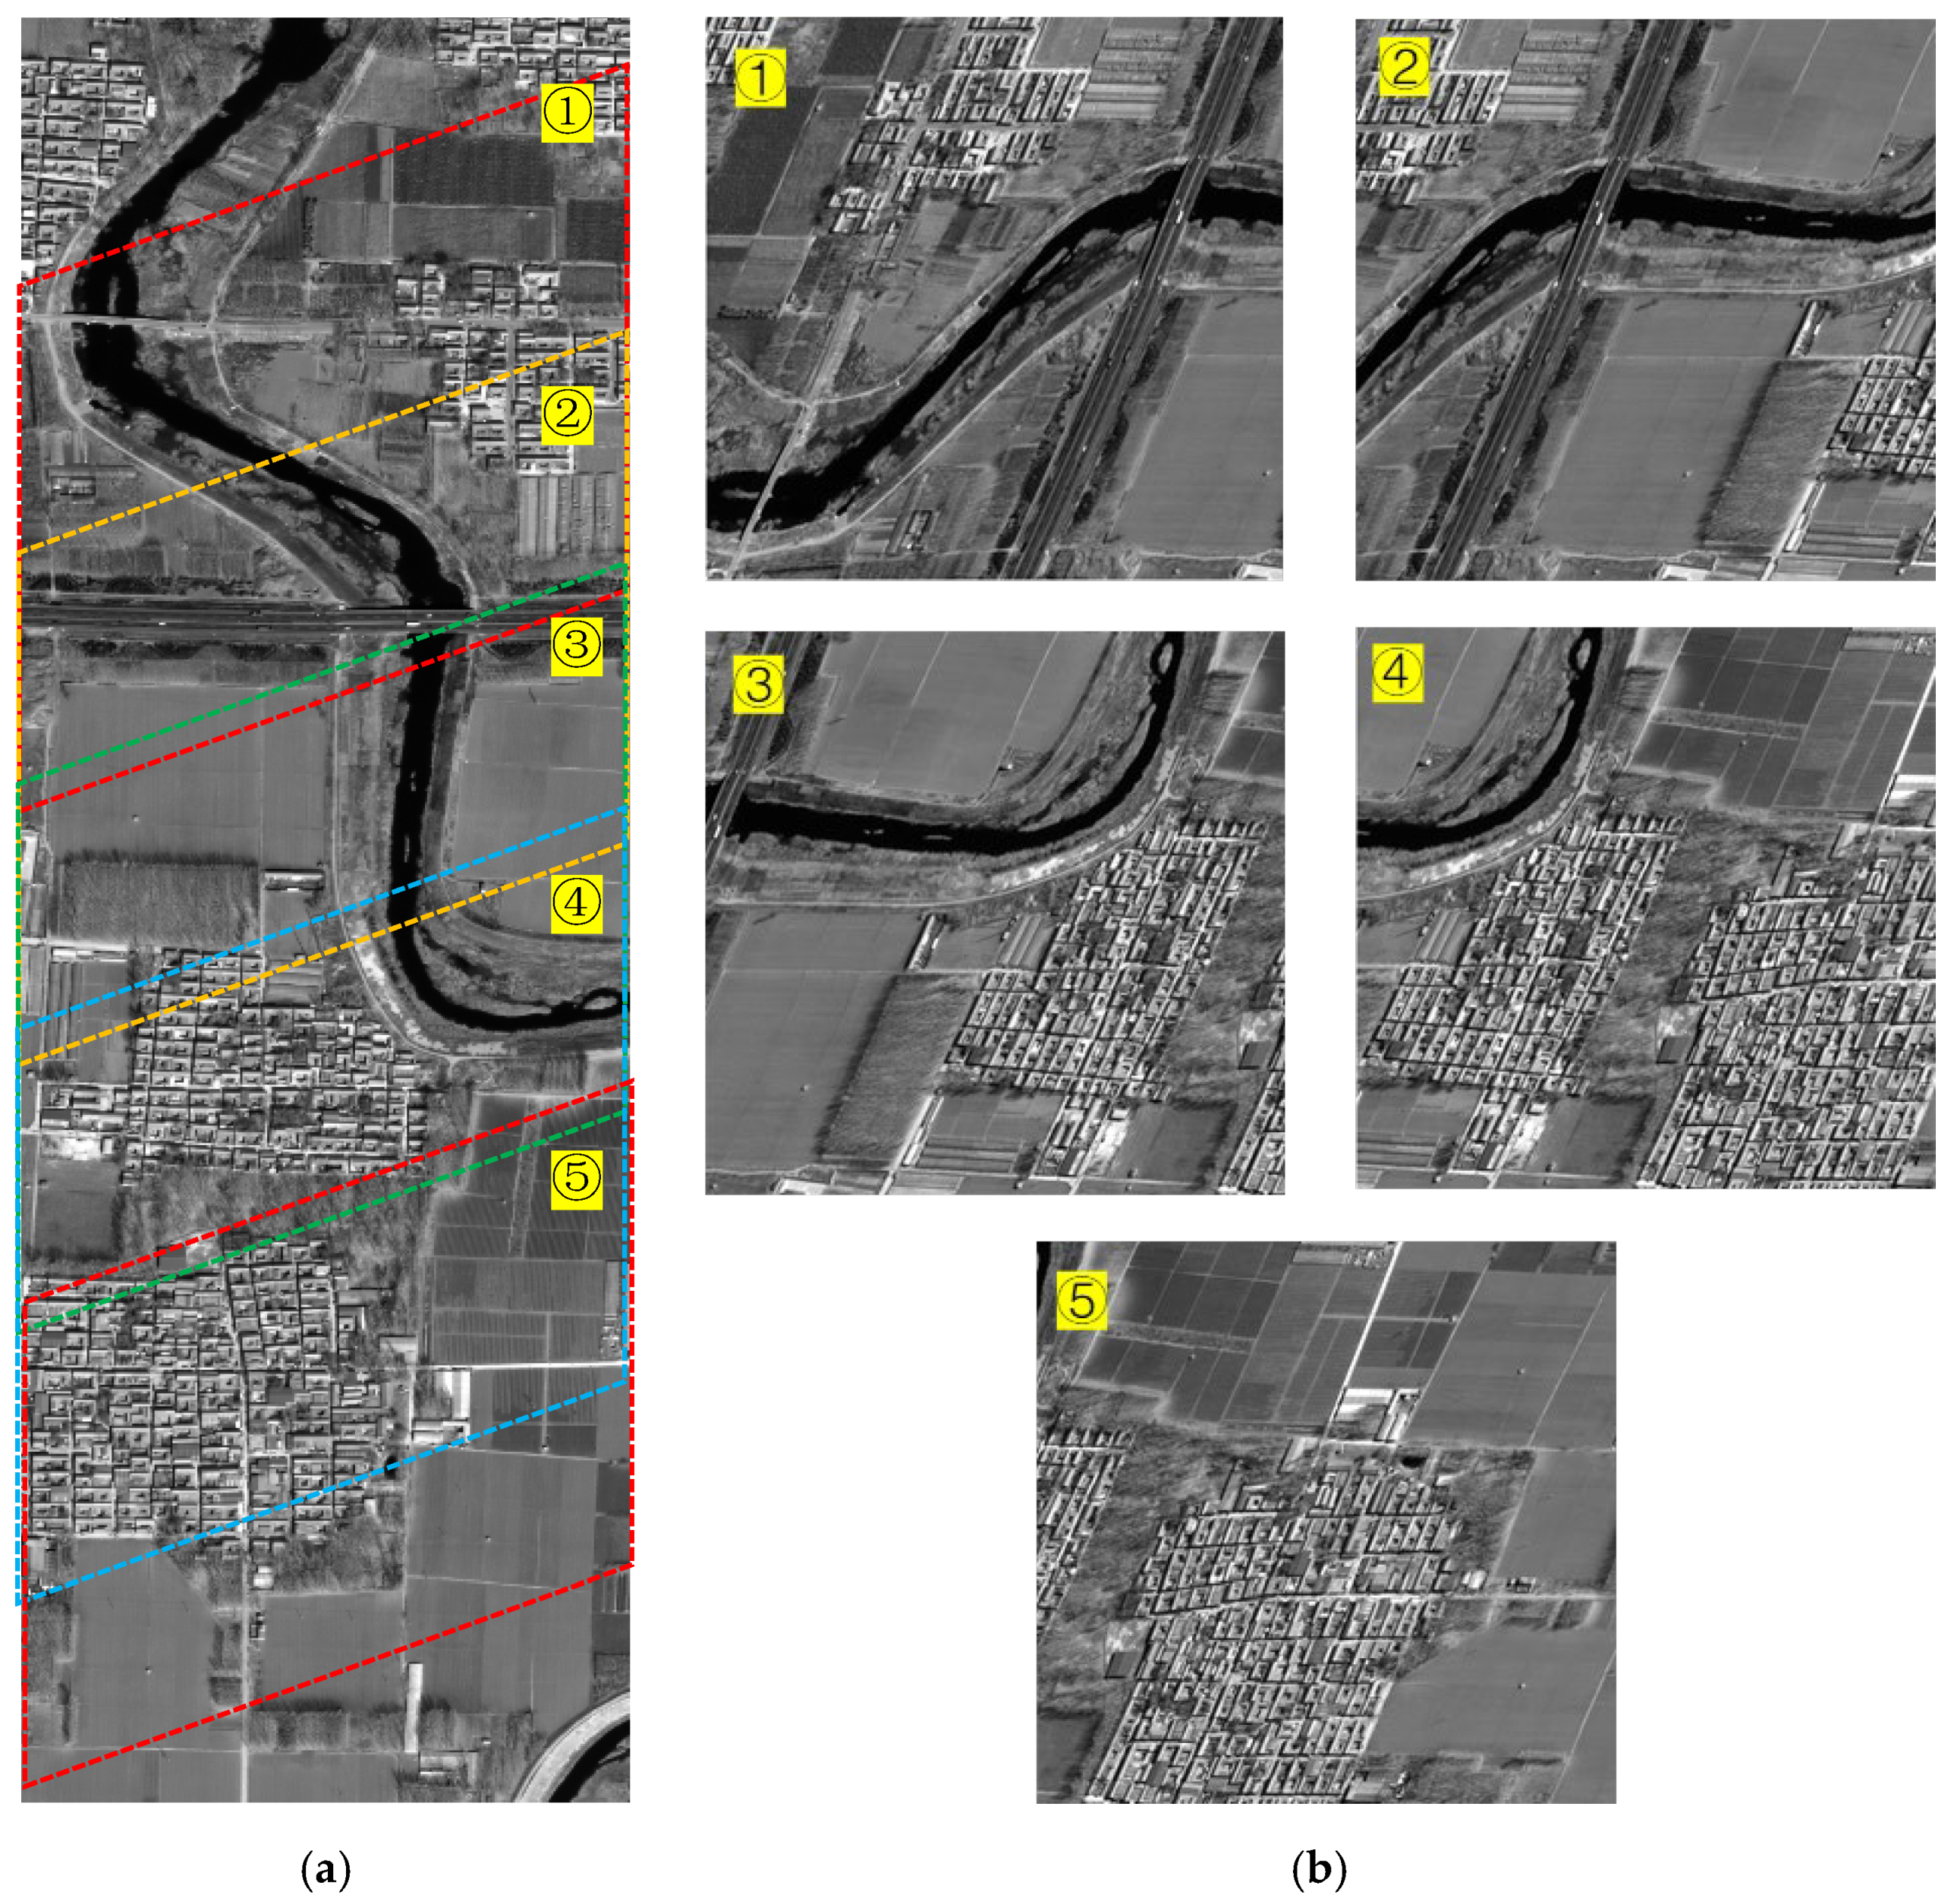
3.1. Data Description

To verify the accuracy and reliability of the proposed method, three kinds of jitter with different frequencies and amplitudes were simulated using real optical remote sensing imagery with a ground sample distance of 0.3 m. The basic information of the simulated datasets is shown in Table 1. The simulation source image and the simulated image with 100-Hz jitter are presented in Figure 4. Since the rolling shutter direction was perpendicular to the flight direction of the satellite, the image coverages corresponding to the ground were parallelograms and the adjacent two images had a certain overlap, as shown in Figure 4a. Five simulated sequence CMOS images by rolling shutter with 100-Hz jitter, named dataset 1, had obvious parallelogram-shaped deformation but slight distortion caused by satellite jitter since the amplitude of simulated jitter at 100 Hz was only 1 pixel, as shown in Figure 4b. As datasets 2 and 3 had the similar characters as dataset 1, the simulated images are not shown in the figure.

3.2. Experimental Result

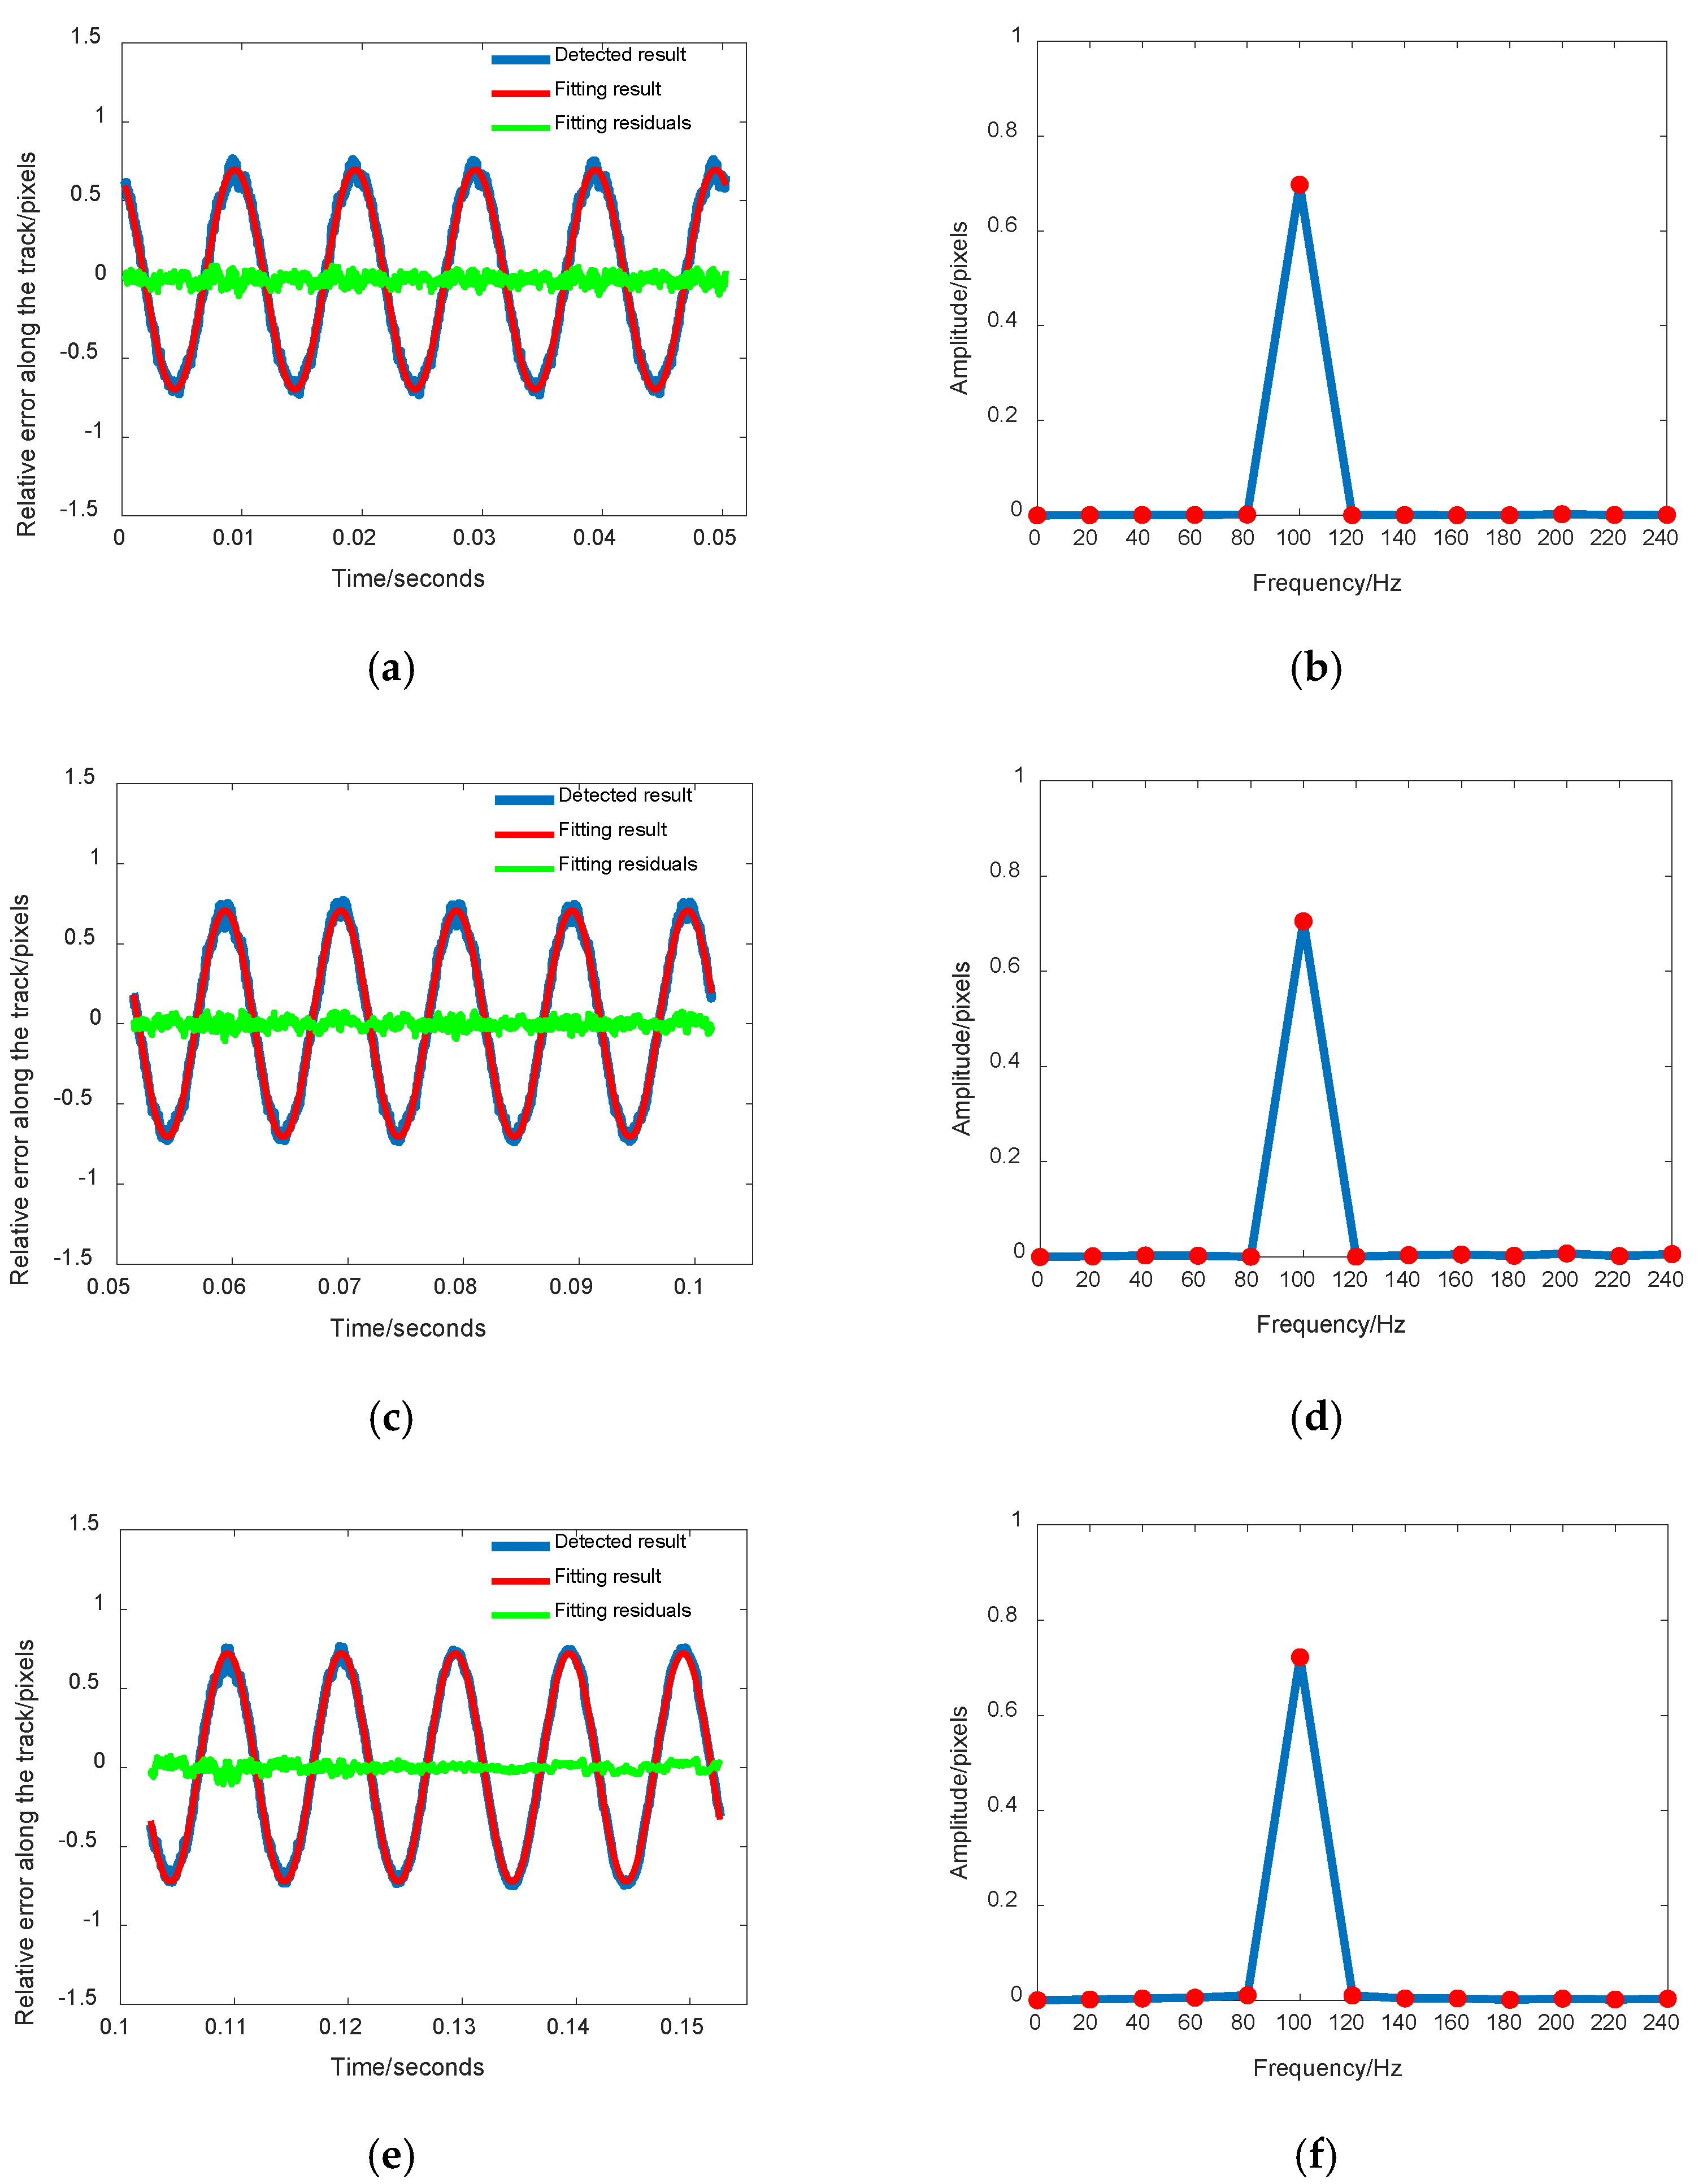
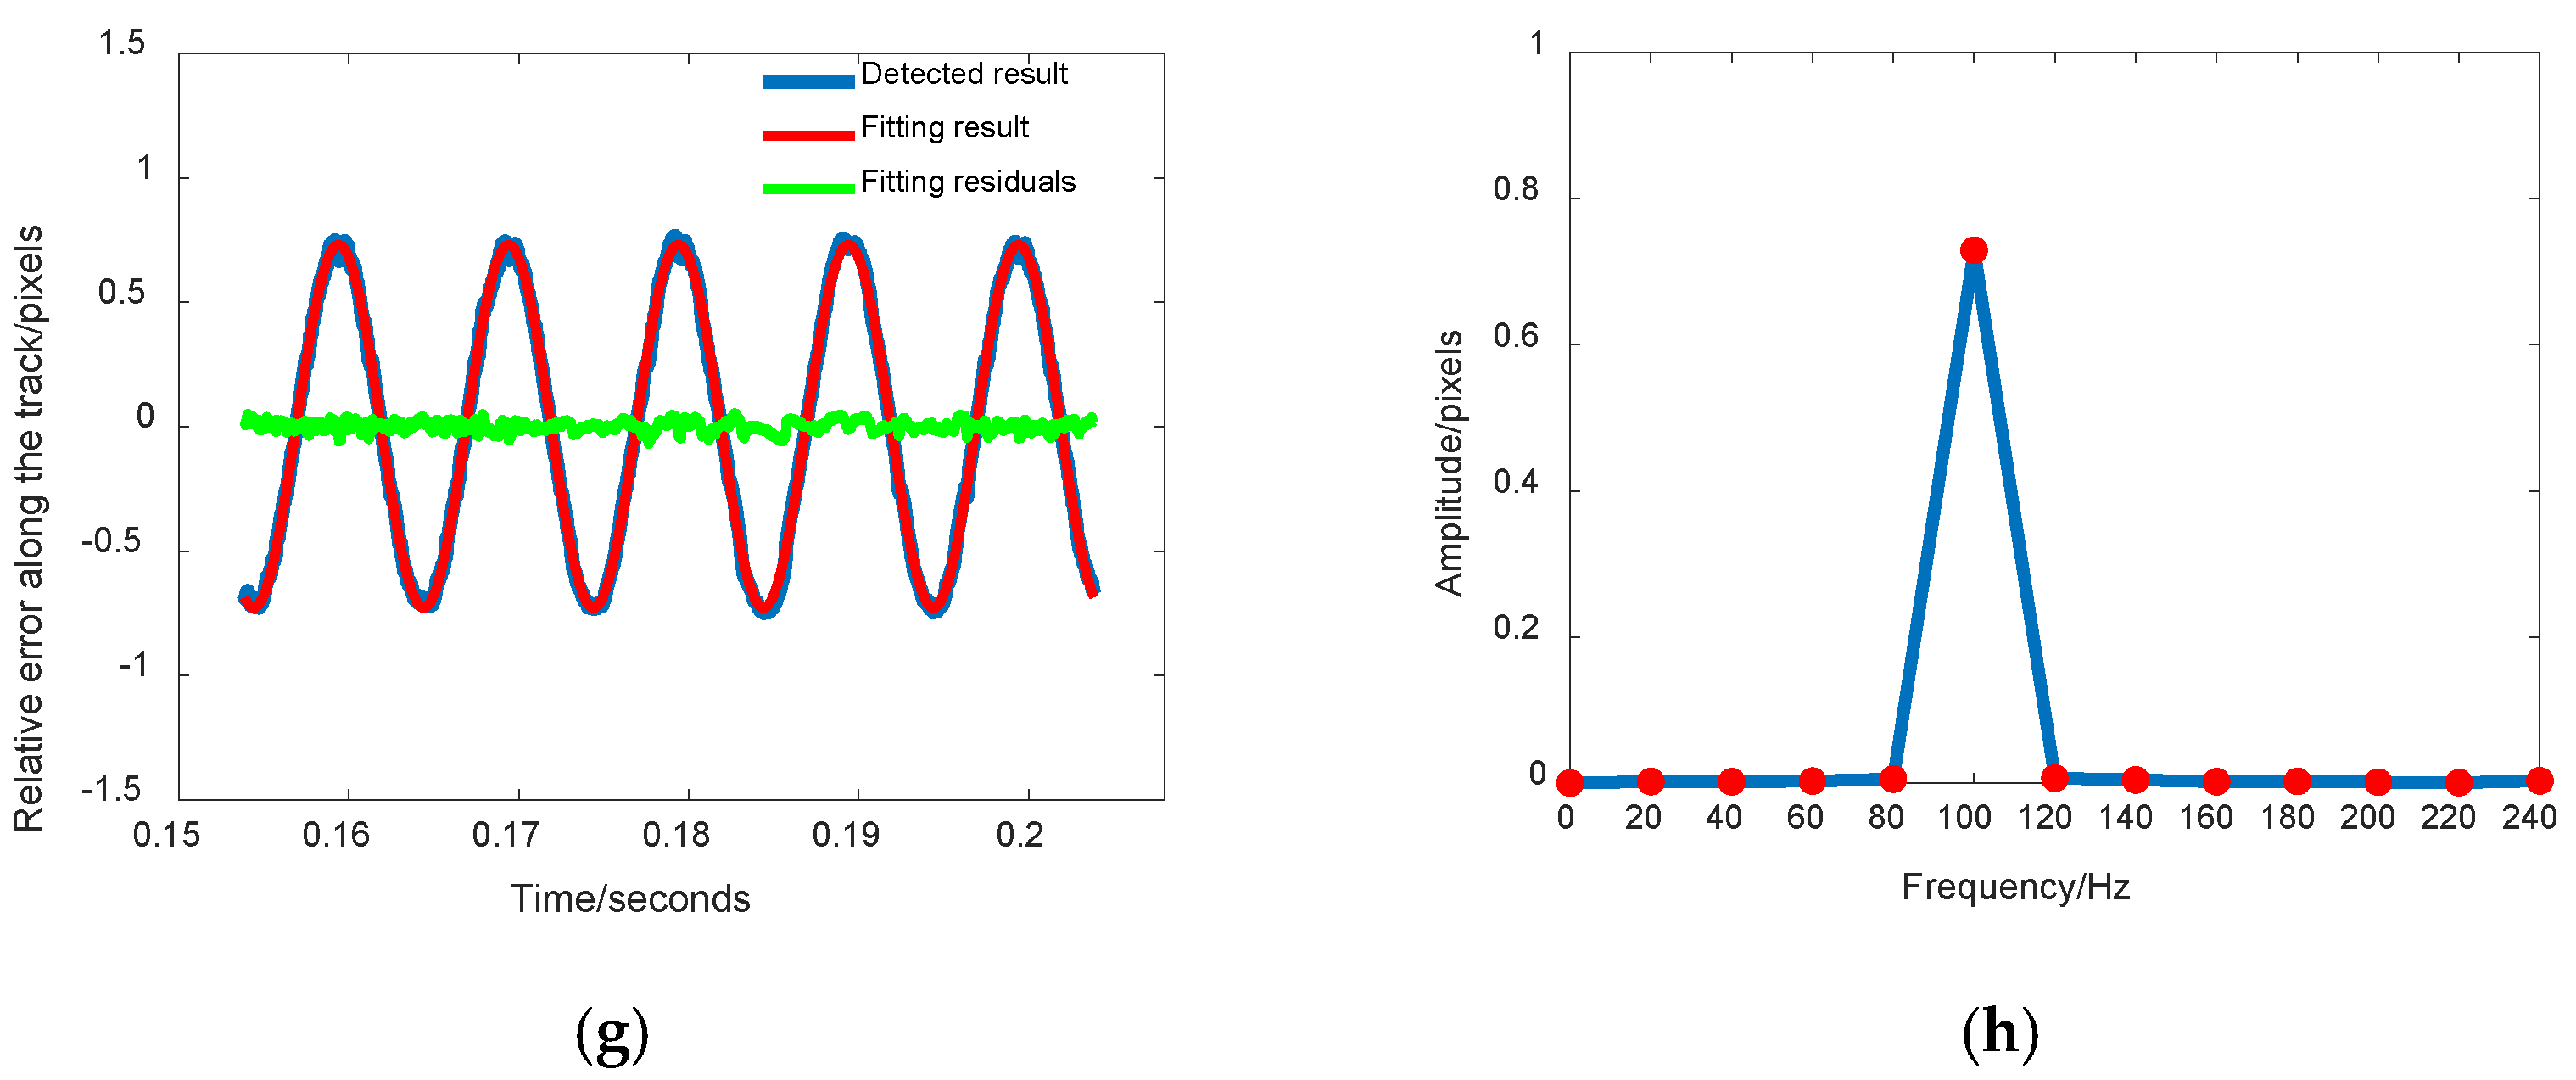
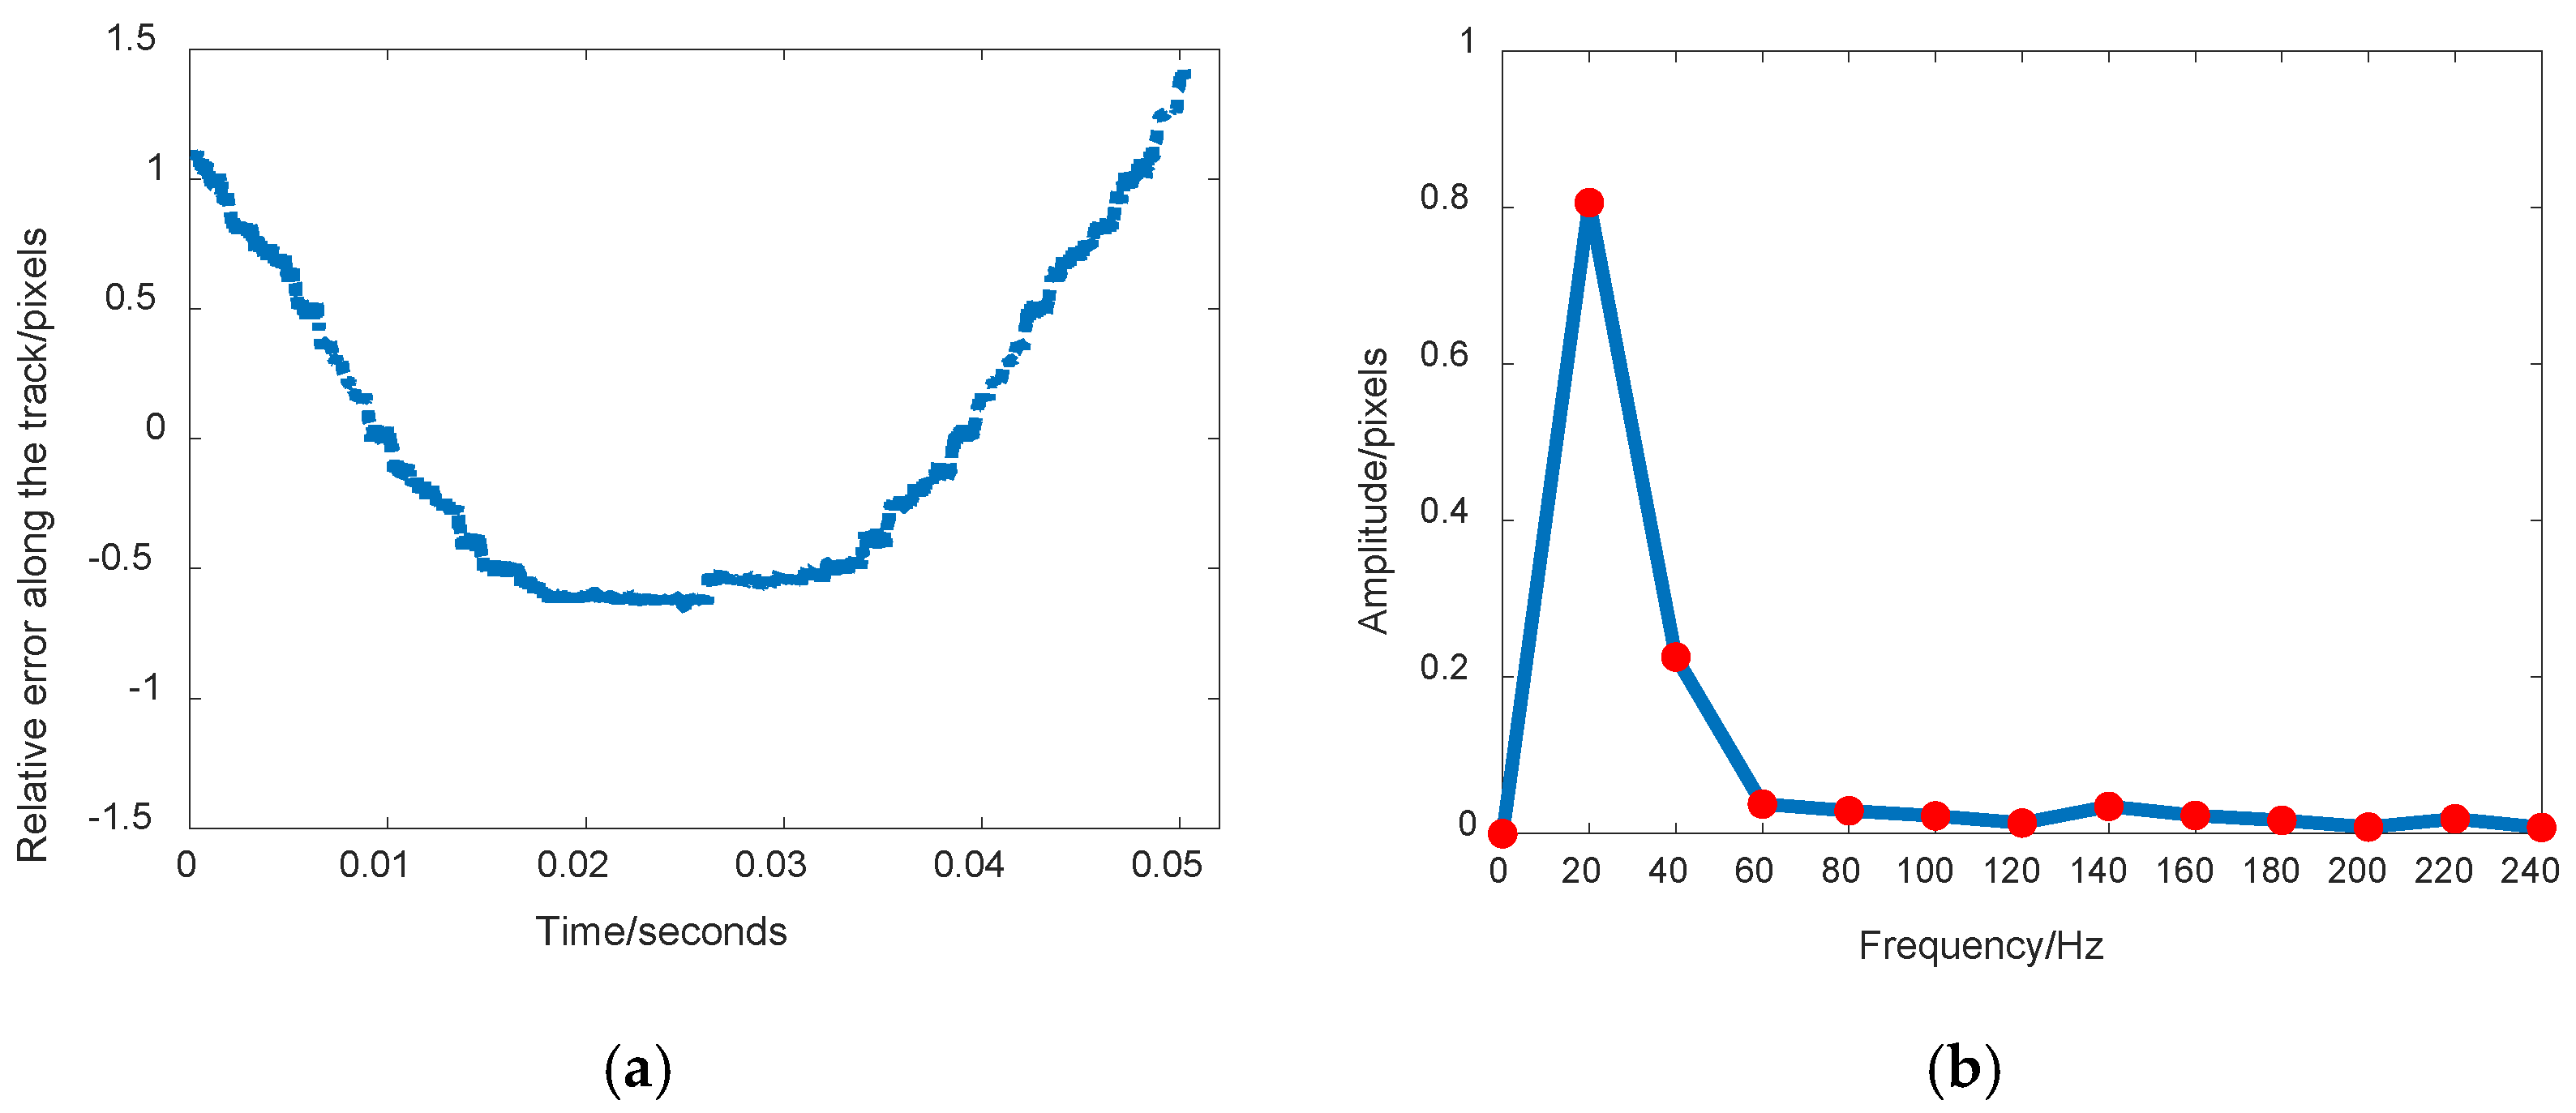
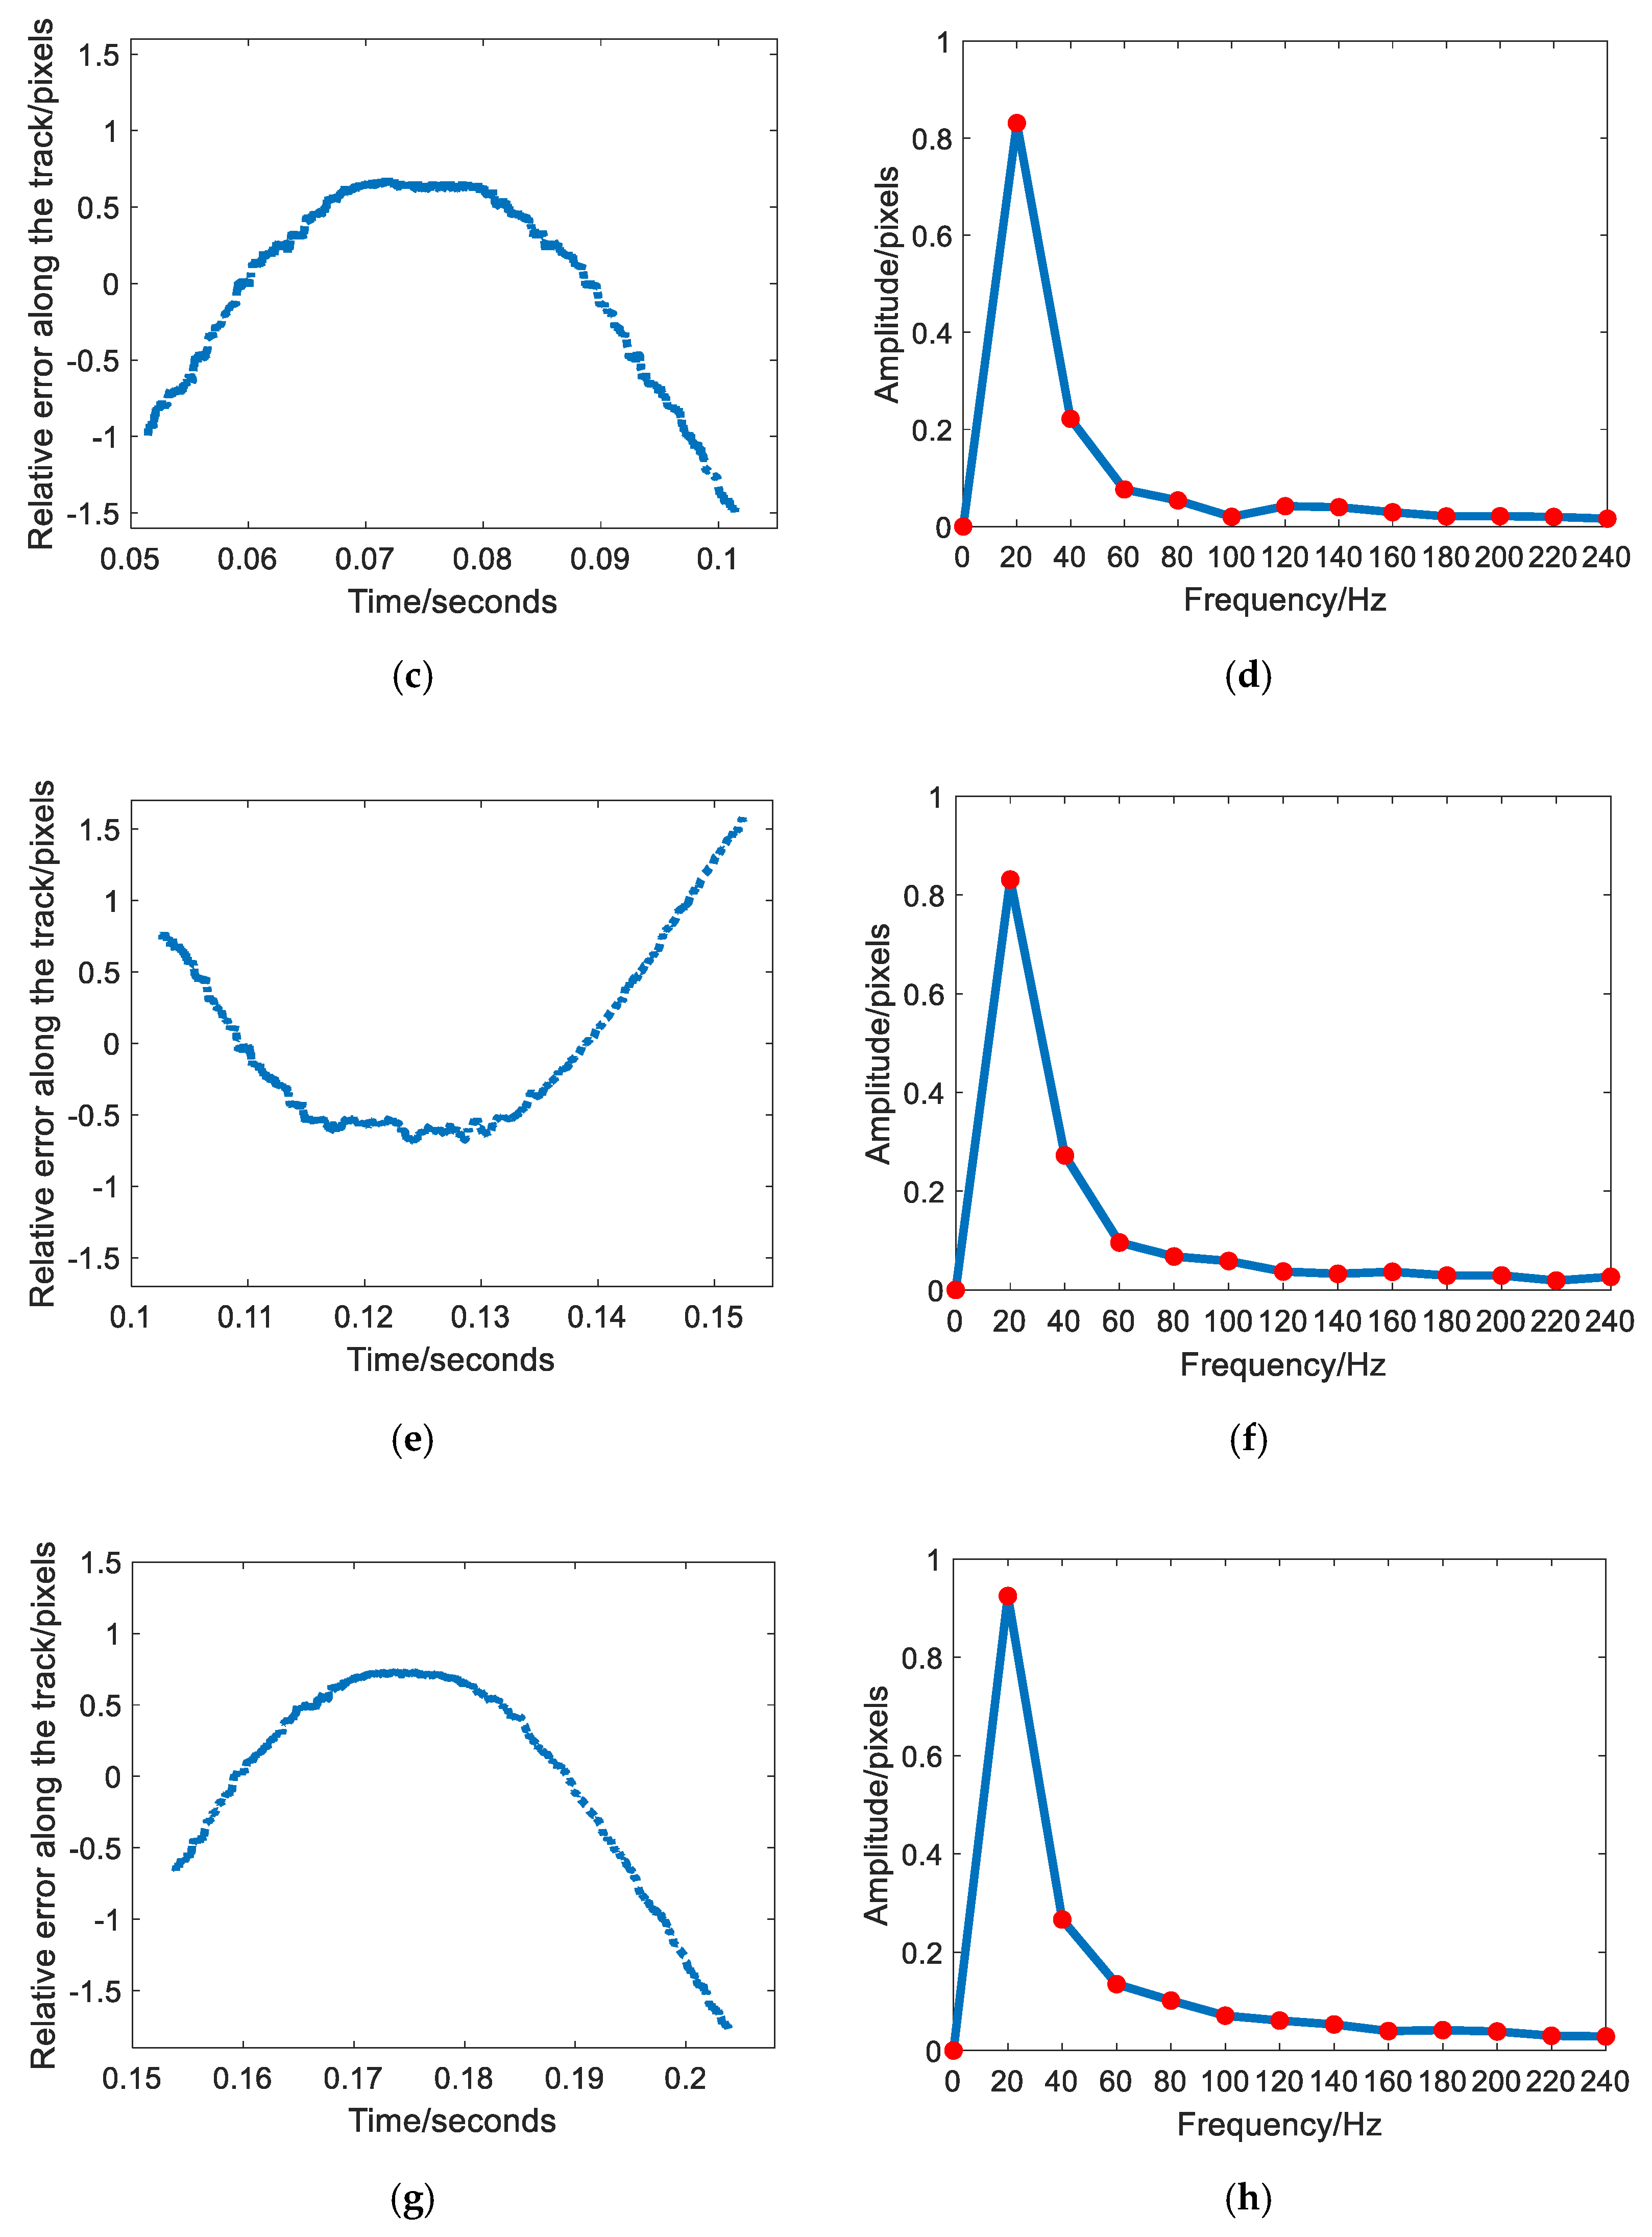
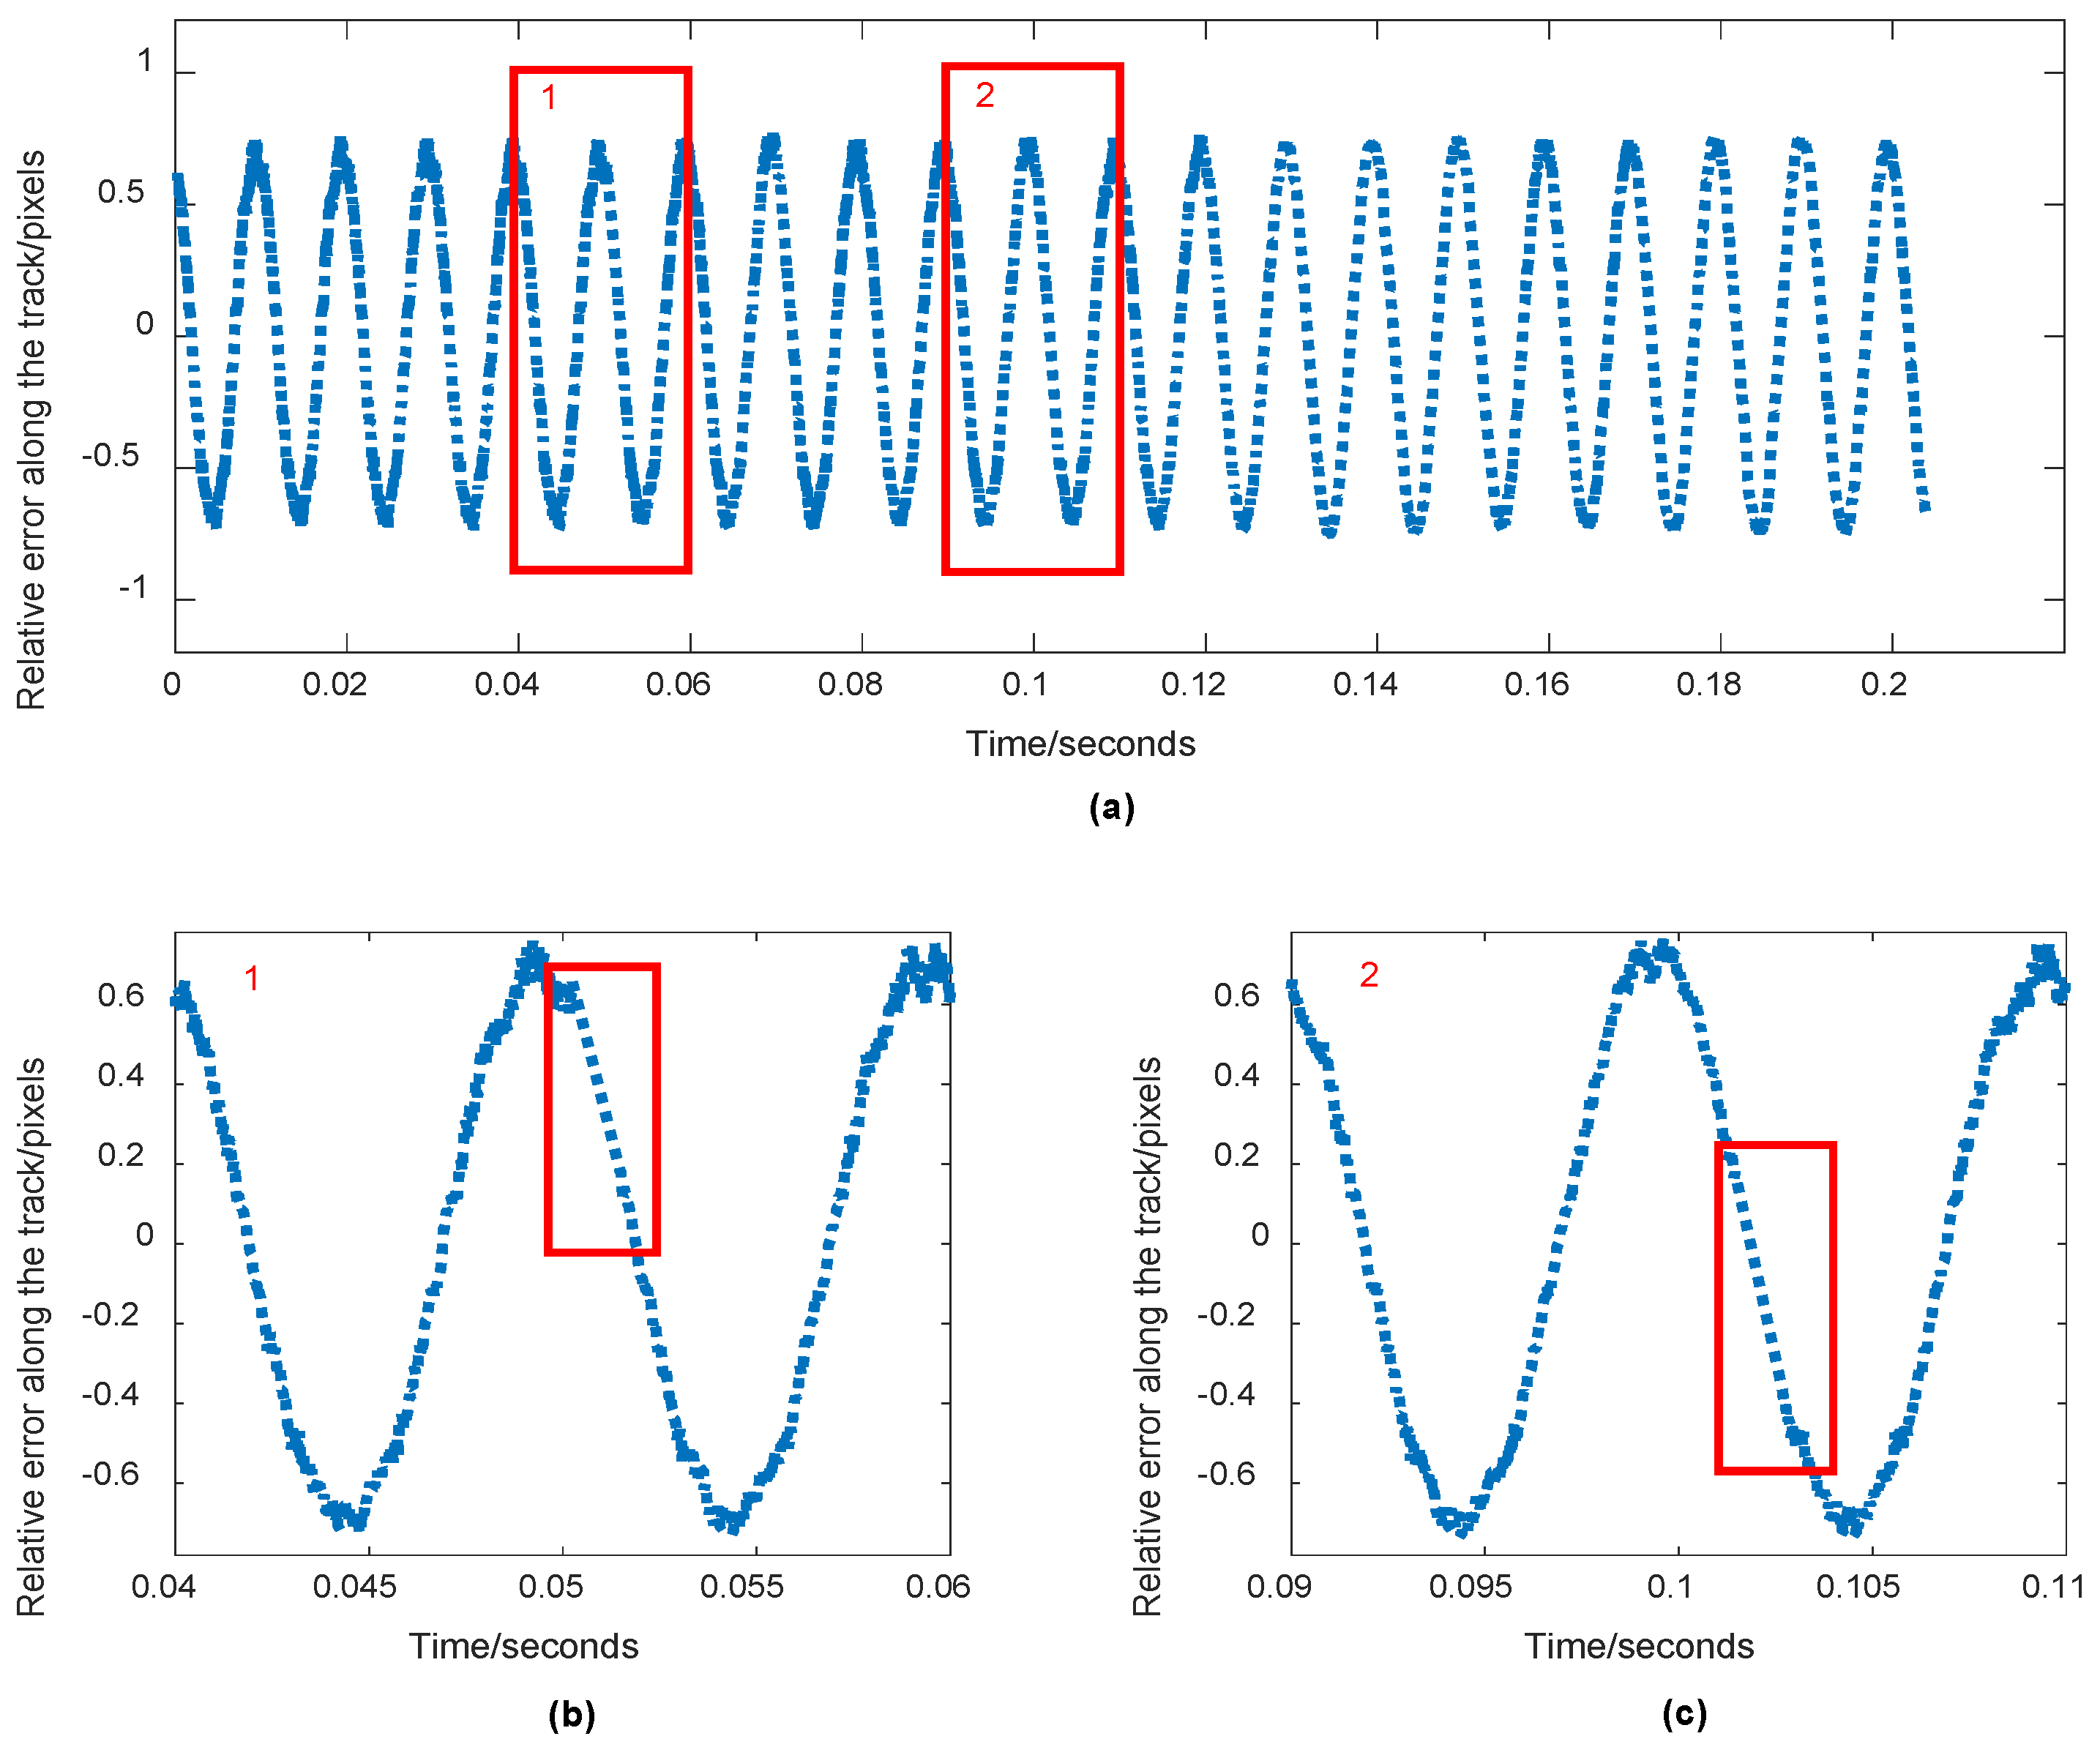
3.2.1. Jitter Detection Results by Single Disparity Map

In the experiment, the five simulated rolling shutter CMOS images with 100-Hz jitter were divided into four groups: image 1–2, image 2–3, image 3–4, and image 4–5. For each group, the disparity map was generated first, and the line-by-line analysis of the disparity map for jitter detection was conducted to obtain the relative error curve for the jitter. Fourier analysis and sinusoidal curve fitting were performed on the jitter curve. The jitter detection curves by image 1–2, image 2–3, image 3–4, and image 4–5 are shown in Figure 5a,c,e,g, respectively. The Fourier analysis results of jitter detection curves by image 1–2, image 2–3, image 3–4, and image 4–5 are shown in Figure 5b,d,f,h, respectively, in which the red dots represent the corresponding relationship between frequency and amplitude. In Figure 5b,d,f,h, the peak amplitudes of Fourier analysis all appear at about 100 Hz, which is very similar to the simulated frequency. It is noted that the frequency resolution of Fourier analysis was not satisfactory because the maximum duration time of the jitter detection curve by one disparity map only had 0.0512 s according to the image size and integration time of each line. The frequency resolution of Fourier analysis was about 20 Hz by calculating the reciprocal of the duration time 0.0512 s, which means the maximum frequency error through Fourier analysis reached 20 Hz.
Based on the Fourier analysis, the fitting results including frequency, amplitude, and phase of the detected jitter curves from four groups are listed in Table 2. In Table 2, the detected frequencies by these four groups of images are 100.005825 Hz, 99.992349 Hz, 99.998652 Hz, and 100.001128 Hz, respectively, which are all approximately 100 Hz. At this time, the detected results are the relative error between the adjacent images caused by satellite jitter. The amplitudes of four groups had strong consistency. However, the phases were different from each other.
The same processing method that was applied for dataset 1 was applied to dataset 2 and dataset 3. The jitter detection curve for each group was obtained by analyzing the corresponding disparity map and Fourier analysis was performed on the jitter curve. Considering the limited space, Figure 6 and Figure 7 only show jitter detection results by single disparity map generated from two adjacent sequence images including image 1–2, image 2–3, image 3–4, and image 4–5 for datasets 2 and 3, respectively. The jitter detection curves of dataset 2 by image 1–2, image 2–3, image 3–4, and image 4–5 are shown in Figure 6a,c,e,g, respectively. The corresponding Fourier analysis results of jitter detection curves are shown in Figure 6b,d,f,h, respectively. The jitter detection curves of dataset 3 by image 1–2, image 2–3, image 3–4, and image 4–5 are shown in Figure 7a,c,e,g, respectively. The corresponding Fourier analysis results of jitter detection curves are shown in Figure 7b,d,f,h, respectively. It is obvious to see that both of the jitter detection curves for datasets 2 and 3 were too short to extract the periodic characteristics when only single disparity map was used. According to the sampling theorem, the duration of jitter detection curve by a single disparity map was too short to extract a lower frequency at 10 Hz and 2 Hz. Unfortunately, the accurate jitter frequencies of datasets 2 and 3 could not be obtained when Fourier analysis was conducted and the following analysis could not be continued.

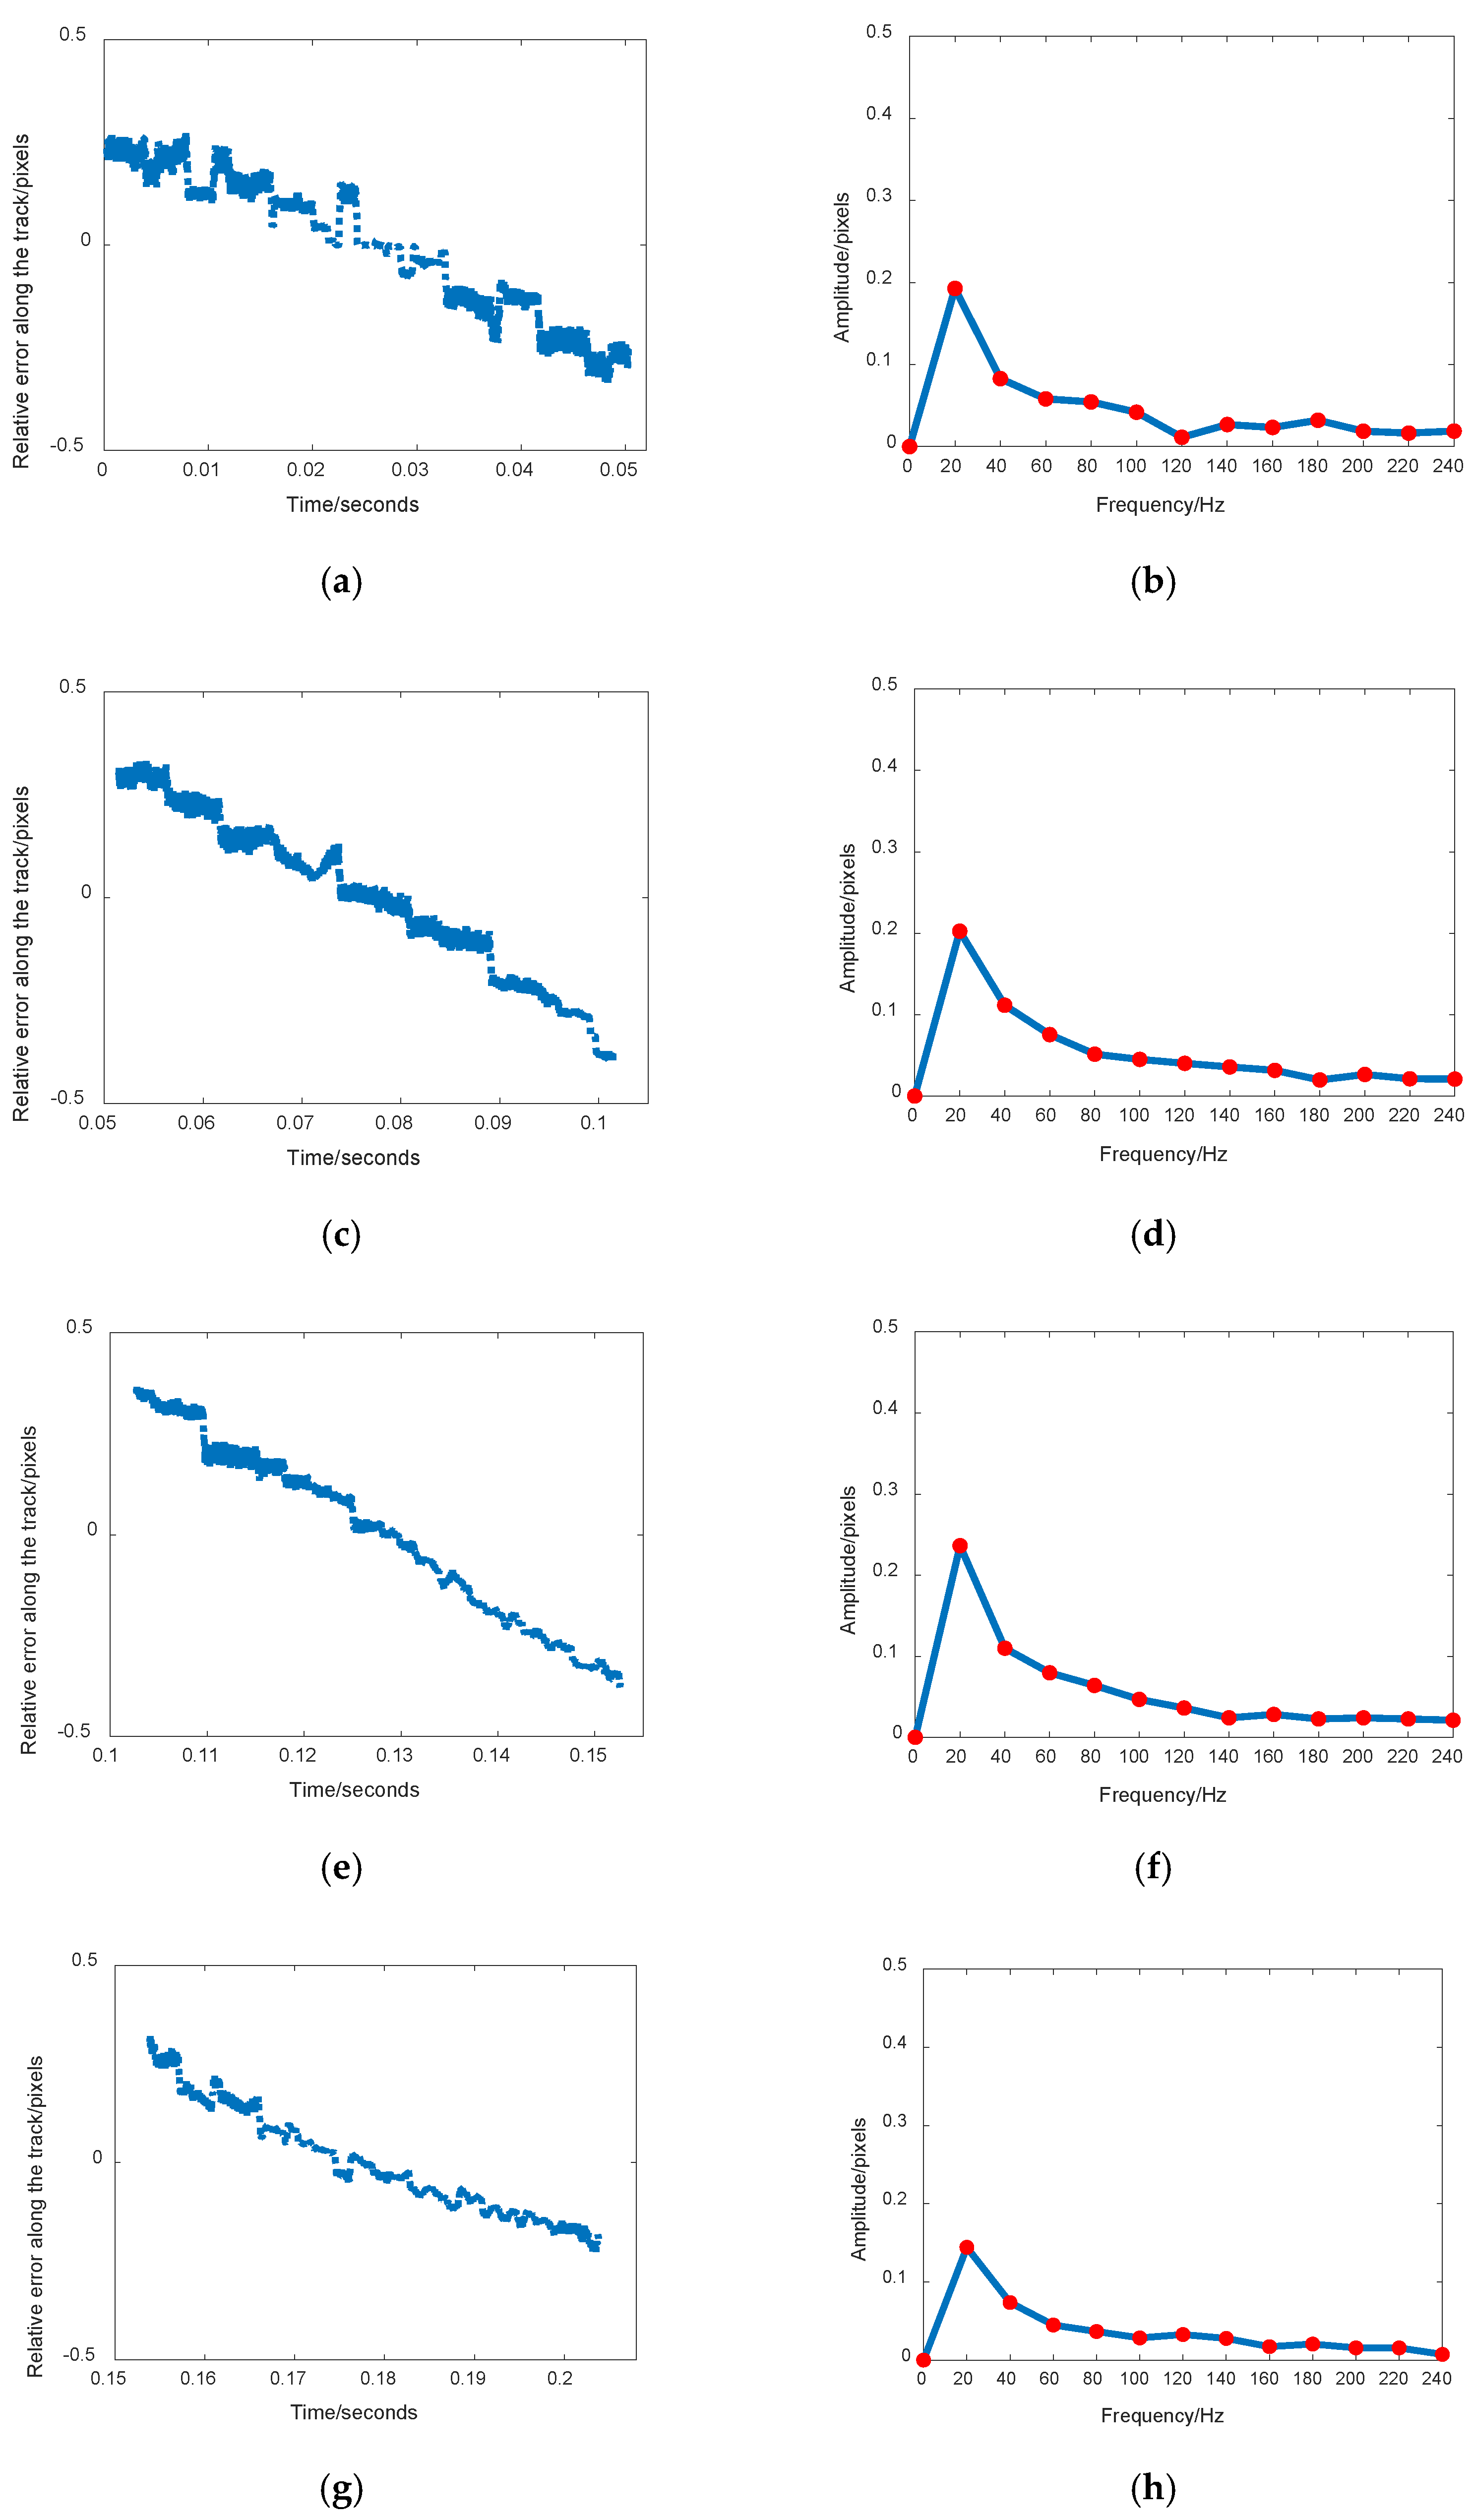
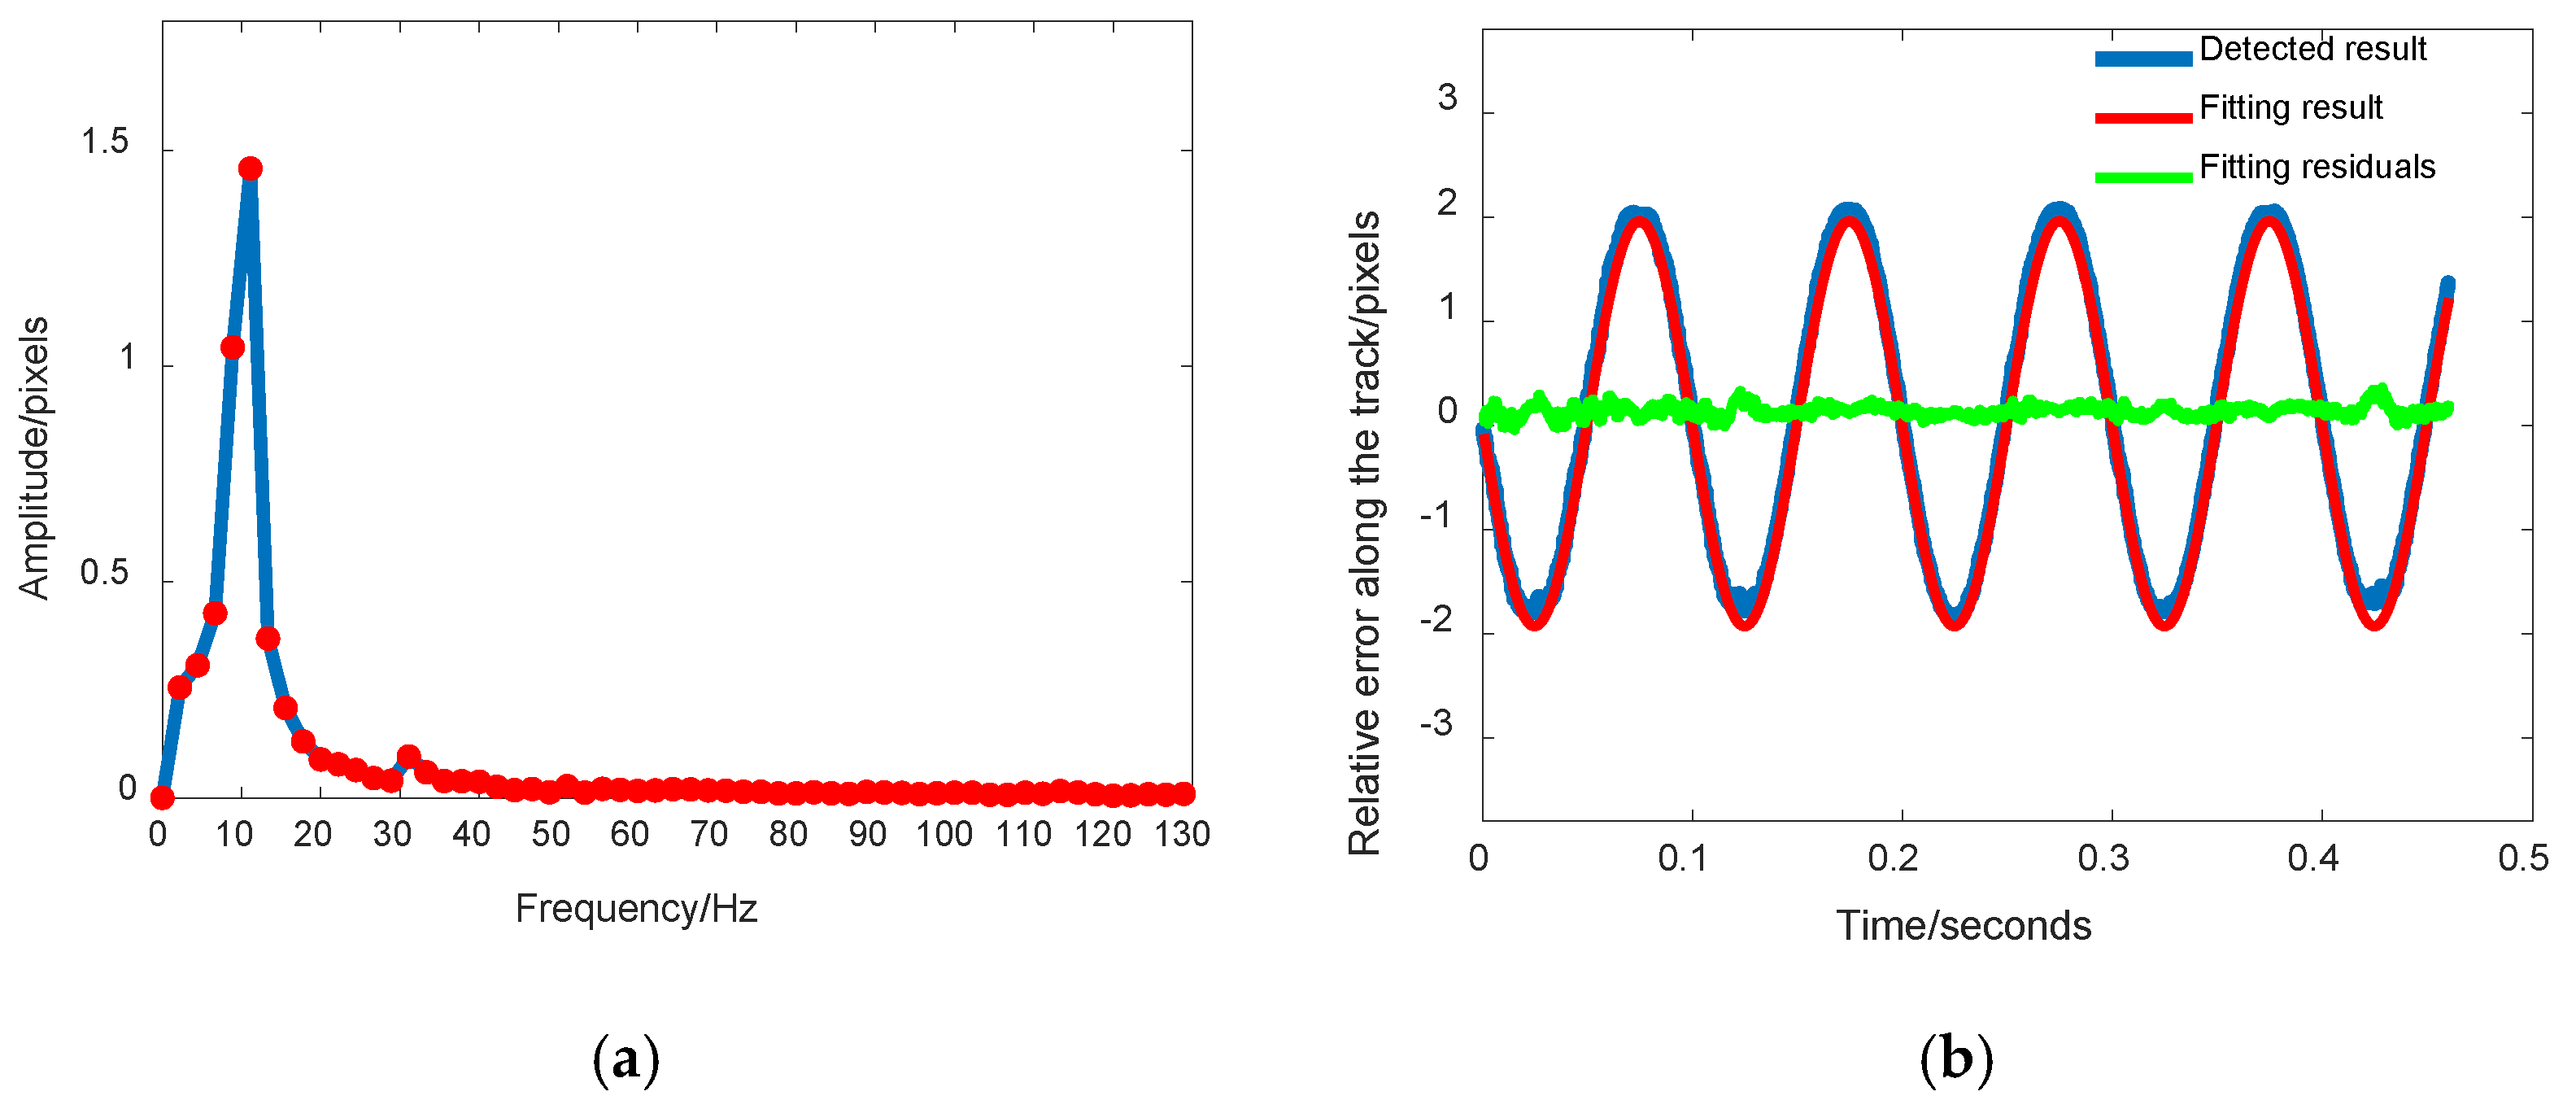
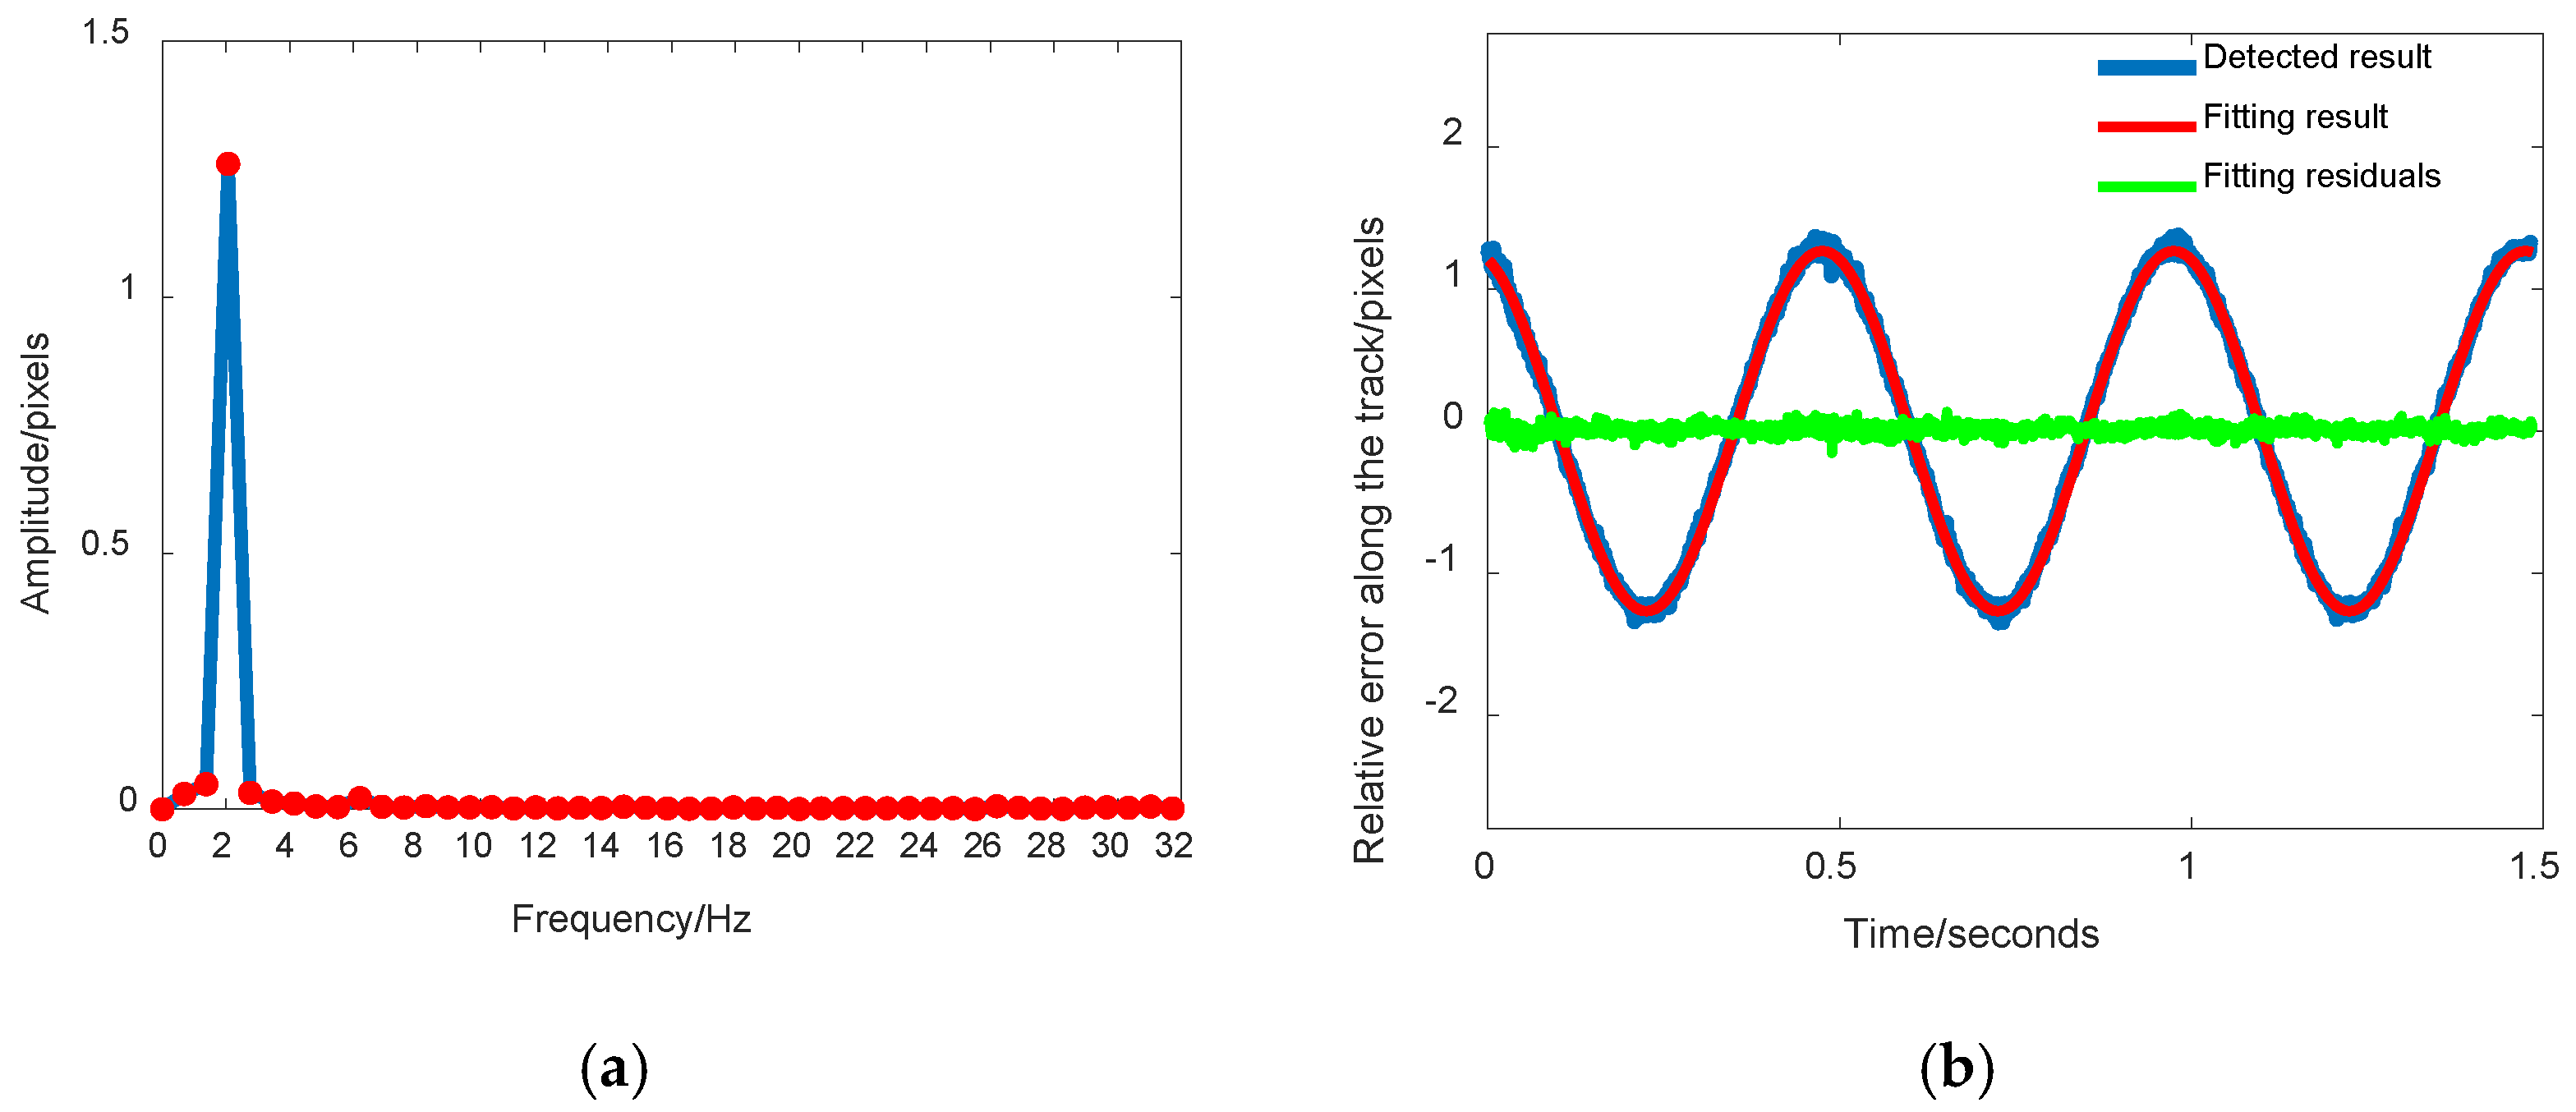
3.2.2. Jitter Detection Results by Sequential Disparity Maps

Considering that the duration of a single disparity map was insufficient and that the use of a single disparity map would lead to failure to complete the low-frequency platform jitter analysis, the observation time must be extended by combining the sequence disparity maps in order to meet the requirements for low- and medium-frequency platform jitter detection. Therefore, this work analyzed the jitter curve of the sequence disparity map using the time correlation. However, due to the specific size of the matching window between the different images and the change of the overlapping degree of adjacent images, it was not possible to perform full-coverage dense mapping for the whole image. Hence, the relative error curves that were analyzed from a different group of disparity maps were not continuous in the time series. As shown in Figure 8, Figure 9 and Figure 10, the jitter detection curves of the original sequence disparity maps at 100 Hz, 10 Hz, and 2 Hz are displayed, respectively. It should be noted that there were gaps between the adjacent curves.
A simple linear function can be used to fill in the gap between the adjacent curves from the disparity map. The local fitting results of the sequence images representing jitter of three different frequencies are shown in Figure 11, Figure 12 and Figure 13. As only a small number of data were missing, the interpolation results that were generated by the linear function were able to meet the continuity requirements for the detecting curves.
Due to the experiment that was conducted in Section 3.2.1, it was difficult to detect the platform jitter error in the whole frequency band using the single disparity map, meaning that the multiple sequence disparity map that is able to extend the observation time should be used to analyze the jitter error. After filling the gap of the relative jitter error curves, the jitter curves for the three datasets were determined using Fourier analysis and sinusoidal curve fitting. The results of three datasets are shown in Figure 14, Figure 15 and Figure 16, respectively. The frequency, amplitude, and phase information that were obtained from the sinusoidal curve fitting for the relative errors are shown in Table 3.
It is noted that the frequency resolution of Fourier analysis became higher with the increasing of the observation time. In these experiments, the time durations were 0.256 s, 0.512 s, and 1.536 s for jitter detection at 100 Hz, 10 Hz, and 2 Hz, respectively. Therefore, the corresponding frequency resolution of Fourier analysis was about 4 Hz, 2 Hz, and 0.6 Hz, respectively. The frequency resolution of Fourier analysis can be further improved through extending the observation time. In this paper, the Fourier analysis result was used as an initial value and the accurate frequency and amplitude results were obtained by sinusoidal curve fitting.

4. Discussion

4.1. Jitter Detection Accuracy by Single Disparity Map

According to Table 2, the frequency and amplitude of the four imagery combinations were mostly consistent. Based on the jitter modeling Equation, the absolute jitter value can be calculated for the relative jitter error, and the parameters are shown in Table 4. The parameters in the four groups of results were also mostly consistent, and the average values for each parameter were calculated. The estimated average of the jitter frequency was 99.999 Hz, the amplitude was 0.969 pixels, and the average phase was 0.0049, which were very close to the simulation frequency of 100 Hz, the amplitude of 1 pixel, and the initial phase of 0.
At the same time, in order to quantitatively evaluate the accuracy of the jitter modeling, the error between the statistical jitter modeling results and the simulation jitter model were calculated. The average error, root mean square error (RMSE), maximum error, and minimum error are shown in Table 5. According to the statistical results, the average modeling error for the jitter was close to 0, the RMSE was 0.0219 pixels, the maximum was 0.031 pixels, and the minimum was −0.0034 pixels.

4.2. Jitter Detection Accuracy by Sequential Disparity Maps

According to the jitter modeling Equation, the absolute value was calculated for the relative error for the jitter, and the parameters of each dataset are shown in Table 6. The estimated jitter frequency for dataset 1 was 99.998 Hz, the amplitude was 0.970 pixels, and the phase value was 0.003287, which were very close to the simulated frequency of 100 Hz, the amplitude of 1 pixel, and the initial phase of 0 rad. Likewise, the estimated jitter frequency, the amplitude, and the phase value for dataset 2 were extremely close to the simulated frequency of 10 Hz, the amplitude of 1 pixel, and the initial phase of 0 rad. Additionally, the estimated jitter frequency, amplitude, and phase value for dataset 3 were also similar to the simulated frequency of 2 Hz, the amplitude of 2 pixel, and the initial phase of 0 rad.
At the same time, in order to quantitatively evaluate the accuracy of the jitter modeling, the error between the statistical jitter modeling results and the simulation jitter model were calculated. The average error, RMSE, maximum error, and minimum error are shown in Table 7. According to the statistical results, the average error for jitter modeling was close to 0, the RMSE was 0.0160 pixels, the maximum error was 0.0239 pixels, and the minimum error was −0.0154 pixels.
The relative error curves for jitter of the single disparity map and the sequence disparity map were analyzed through Fourier and overall fitting. The experimental results showed that the method proposed in this paper can accurately recover the parameters of the frequency, amplitude, and phase and can precisely model the jitter for each frequency band.

5. Conclusions

As it is difficult to accurately and comprehensively measure the jitter that occurs on the image focal plane of a high-resolution spaceborne camera by traditional methods, this paper proposed a jitter detection method based on sequence CMOS images captured by rolling shutter mode. The overlapping area of the sequence images was densely matched to generate sequence disparity maps that were able to obtain the characteristic parameters for the relative error. Through sinusoidal function modeling, parameters such as the frequency and amplitude of the jitter error on the camera focal plane were accurately estimated, providing reliable information to compensate the jitter error for high-resolution satellite imagery. In this paper, three sets of remote sensing data suffering from satellite jitter with different frequencies and amplitudes were used to conduct experiments. To validate the reliability and feasibility of the proposed method, jitter detection by single disparity map and by sequential disparity maps were both done. The results show that jitter detection by sequential disparity maps is more adaptive in jitter frequency detection, which can detect the jitter with a wider frequency band from low to high. Moreover, the amplitude and initial phase of the satellite jitter can also be estimated while the frequency is determined. The recovered jitter parameters including frequencies, amplitudes, and initial phases of three datasets have strong consistency compared with the ground truth. To quantitatively evaluate the accuracy of the jitter modeling, the error between the statistical jitter modeling results and the simulation jitter model are calculated. The RMSE of the jitter detection can reach 0.02 pixels, and the absolute value of the maximum and minimum error is not more than 0.03 pixels. The results show that the proposed method using sequence CMOS images by rolling shutter has obvious advantages in extensive applicability of jitter frequency detection and high accuracy of jitter parameter estimation on the imaging focal plane, which can provide an accurate data basis of the jitter error compensation for high-resolution remote sensing satellite imagery.

Author Contributions

Conceptualization, Y.Z. (Ying Zhu) and M.W.; methodology, Y.Z. (Ying Zhu); software, Y.Z. (Ying Zhu) and T.Y.; validation, Y.Z. (Ying Zhu); Visualization, T.Y.; investigation, Y.Z. (Ying Zhu) and Y.Z. (Yaozong Zhang); resources, Y.Z. (Ying Zhu) and Q.R.; data curation, Y.Z. (Ying Zhu) and L.W.; writing—original draft preparation, Y.Z. (Ying Zhu) and T.Y.; writing—review and editing, Y.Z. (Ying Zhu), T.Y., Y.Z. (Ying Zhu), and L.W.; supervision H.H.; project administration, H.H.; funding acquisition, Y.Z. (Ying Zhu) and M.W. All authors have read and agreed to the published version of the manuscript.

Funding

This work was supported in part by the National Natural Science Foundation of China under grants 41801382, 42090011 and 62171329, the Natural Science Foundation of Hubei Province under grant 2020CFA001, and the Research and Development Project of Hubei Province under grant 2020BIB006.

Institutional Review Board Statement

Not applicable.

Informed Consent Statement

Not applicable.

Data Availability Statement

No new data were created or analyzed in this study. Data sharing does not apply to this article.

Acknowledgments

We sincerely appreciate the editors and reviewers for their helpful comments and constructive suggestions.

Conflicts of Interest

The authors declare no conflict of interest.

References

  1. Iwasaki, A. Detection and Estimation Satellite Attitude Jitter Using Remote Sensing Imagery. In Advances in Spacecraft Technologies; InTech: Rijeka, Croatia, 2011; pp. 257–272. [Google Scholar]
  2. Tong, X.; Ye, Z.; Xu, Y.; Tang, X.; Liu, S.; Li, L.; Xie, H.; Wang, F.; Li, T.; Hong, Z. Framework of Jitter Detection and Compensation for High Resolution Satellites. Remote Sens. 2014, 6, 3944–3964. [Google Scholar] [CrossRef] [Green Version]
  3. Robertson, B.C. Rigorous geometric modeling and correction of QuickBird imagery. In Proceedings of the IEEE International Geoscience and Remote Sensing Symposium, Toulouse, France, 21–25 August 2003. [Google Scholar]
  4. Takaku, J.; Tadono, T. High Resolution DSM Generation from ALOS Prism-processing Status and Influence of Attitude Fluctuation. In In Proceedings of the 2010 IEEE International Geoscience and Remote Sensing Symposium, Honolulu, HI, USA, 25–30 July 2010. [Google Scholar]
  5. Amberg, V.; Dechoz, C.; Bernard, L.; Greslou, D.; De Lussy, F.; Lebegue, L. In-Flight Attitude Perturbances Estimation: Application to PLEIADES-HR Satellites. In In Proceedings of the SPIE Optical Engineering & Applications. International Society for Optics and Photonics, San Diego, CA, USA, 23 September 2013. [Google Scholar]
  6. Jiang, Y.; Zhang, G.; Tang, X.; Li, D.; Huang, W. Detection and Correction of Relative Attitude Errors for ZY1-02C. IEEE Trans. Geosci. Remote Sens. 2014, 52, 7674–7683. [Google Scholar] [CrossRef]
  7. Tong, X.; Xu, Y.; Ye, Z.; Liu, S.; Tang, X.; Li, L.; Xie, H.; Xie, J. Attitude Oscillation Detection of the ZY-3 Satellite by Using Multispectral Parallax Images. IEEE Trans. Geosci. Remote Sens. 2015, 53, 3522–3534. [Google Scholar] [CrossRef]
  8. Wang, M.; Zhu, Y.; Jin, S.; Pan, J.; Zhu, Q. Correction of ZY-3 Image Distortion Caused by Satellite Jitter Via Virtual Steady Reimaging Using Attitude Data. ISPRS J. Photogramm. Remote Sens. 2016, 119, 108–123. [Google Scholar] [CrossRef]
  9. Zhu, Y.; Wang, M.; Cheng, Y.; He, L.; Xue, L. An Improved Jitter Detection Method Based on Parallax Observation of Multispectral Sensors for Gaofen-1 02/03/04 Satellites. Remote Sens. 2019, 11, 16. [Google Scholar] [CrossRef] [Green Version]
  10. Wang, M.; Zhu, Y.; Fan, C.C. Research Status and Prospect of Platform Jitter Geometric Accuracy Impact Analysis and Processing for High Resolution Optical Satellite Image. Geomat. Inf. Sci. Wuhan Univ. 2018, 43, 1899–1908. [Google Scholar]
  11. Ozesmi, S.L.; Bauer, M.E. Satellite remote sensing of wetlands. Wetl. Ecol. Manag. 2002, 10, 381–402. [Google Scholar] [CrossRef]
  12. Tong, X.H.; Ye, Z.; Liu, S.J. Key Techniques and Applications of High-Resolution Satellite Jitter Detection Compensation. Acta Geod. Cartogr. Sin. 2017, 46, 1500–1508. [Google Scholar]
  13. Huo, H.Q.; Ma, M.J.; Li, Y.P.; Qiu, J.W. High Precision Measurement Technology of Satellite Micro-Angle Flutter. Transducer Microsyst. Technol. 2011, 30, 4–6+9. [Google Scholar]
  14. Tang, X.; Xie, J.; Wang, X.; Jiang, W. High-Precision Attitude Post-Processing and Initial Verification for the ZY-3 Satellite. Remote Sens. 2015, 7, 111–134. [Google Scholar] [CrossRef]
  15. Wang, M.; Fan, C.; Pan, J.; Jin, S.; Chang, X. Image jitter detection and compensation using a high-frequency angular displacement method for Yaogan-26 remote sensing satellite. ISPRS J. Photogramm. Remote Sens. 2017, 130, 32–43. [Google Scholar] [CrossRef]
  16. Grodecki, J.; Dial, G. IKONOS geometric accuracy validation. Int. Arch. Photogramm. Remote Sens. Spat. Inf. Sci. 2002, 34, 50–55. [Google Scholar]
  17. Dial, G.; Bowen, H.; Gerlach, F.; Grodecki, J.; Oleszczuk, R. IKONOS satellite, imagery, and products. Remote Sens. Environ. 2003, 88, 23–36. [Google Scholar] [CrossRef]
  18. Aguilar, M.A.; del Mar Saldana, M.; Aguilar, F.J. Assessing geometric accuracy of the orthorectification process from GeoEye-1 and WorldView-2 panchromatic images. Int. J. Appl. Earth Obs. Geoinf. 2013, 21, 427–435. [Google Scholar] [CrossRef]
  19. Iwata, T. Precision attitude and position determination for the Advanced Land Observing Satellite (ALOS). In Proceedings of the Fourth International Asia-Pacific Environmental Remote Sensing Symposium 2004: Remote Sensing of the Atmosphere, Ocean, Environment, and Space, Honolulu, HI, USA, 8–12 November 2004; International Society for Optics and Photonics: Bellingham, WA, USA, 2005; pp. 34–50. [Google Scholar]
  20. Blarre, L.; Ouaknine, J.; Oddos-Marcel, L.; Martinez, P.E. High accuracy Sodern star trackers: Recent improvements proposed on SED36 and HYDRA star tracker. In Proceedings of the AIAA Guidance, Navigation, and Control Conference and Exhibit, Keystone, CO, USA, 21–24 August 2006; p. 6046. [Google Scholar]
  21. Teshima, Y.; Iwasaki, A. Correction of Attitude Fluctuation of Terra Spacecraft Using ASTER/SWIR Imagery with Parallax Observation. IEEE Trans. Geosci. Remote Sens. 2008, 46, 222–227. [Google Scholar] [CrossRef]
  22. Mattson, S.; Boyd, A.; Kirk, R.; Cook, D.A. HiJACK: Correcting spacecraft jitter in HiRISE images of Mars. In Proceedings of the European Planetary Science Congress, Potsdam, Germany, 14–18 September 2009. [Google Scholar]
  23. Delvit, J.M.; Greslou, D.; Amberg, V.; Dechoz, C.; de Lussy, F.; Lebegue, L.; Latry, C.; Artigues, S.; Bernard, L. Attitude assessment using Pleiades-HR capabilities. In Proceedings of the International Archives of the Photogrammetry, Remote Sensing and Spatial Information Sciences, Melbourne, VIC, Australia, 25 August 2012. [Google Scholar]
  24. Ayoub, F.; Leprince, S.; Binet, R.; Lewis, K.W.; Aharonson, O.; Avouac, J.P. Influence of Camera Distortions on Satellite Image Registration and Change Detection Applications. In Proceedings of the 2008 IEEE International Geoscience and Remote Sensing Symposium, Boston, MA, USA, 6–11 July 2008. [Google Scholar]
  25. Liu, S.; Tong, X.; Wang, F.; Sun, W.; Guo, C.; Ye, Z.; Jin, Y.; Xie, H.; Chen, P. Attitude Jitter Detection Based on Remotely Sensed Images and Dense Ground Controls: A Case Study for Chinese ZY-3 Satellite. IEEE J.-STARS 2016, 9, 7. [Google Scholar] [CrossRef]
  26. Wang, P.; An, W.; Deng, X.; Yang, J.; Sheng, W. A jitter compensation method for spaceborne line-array imagery using compressive sampling. Remote Sens. Lett. 2015, 6, 558–567. [Google Scholar] [CrossRef]
  27. Ran, Q.; Chi, Y.; Wang, Z. Property and removal of jitter in Beijing-1 small satellite panchromatic images. In Proceedings of the International Archives of the Photogrammetry, Remote Sensing and Spatial Information Sciences, Beijing, China, 3–11 July 2008. [Google Scholar]
  28. Wang, Z.; Zhang, Z.; Dong, L.; Xu, G. Jitter Detection and Image Restoration Based on Generative Adversarial Networks in Satellite Images. Sensors 2021, 21, 4693. [Google Scholar] [CrossRef] [PubMed]
  29. Tong, X.; Li, L.; Liu, S.; Xu, Y.; Ye, Z.; Jin, Y.; Wang, F.; Xie, H. Detection and estimation of ZY-3 three-line array image distortions caused by attitude oscillation. ISPRS J. Photogramm. Remote Sens. 2015, 101, 291–309. [Google Scholar] [CrossRef]
  30. Wang, M.; Zhu, Y.; Pan, J.; Yang, B.; Zhu, Q. Satellite jitter detection and compensation using multispectral imagery. Remote Sens. Lett. 2016, 7, 513–522. [Google Scholar] [CrossRef]
  31. Pan, J.; Che, C.; Zhu, Y.; Wang, M. Satellite jitter estimation and validation using parallax images. Sensors 2017, 17, 83. [Google Scholar] [CrossRef] [Green Version]
  32. Tong, X.; Ye, Z.; Li, L.; Liu, S.; Jin, Y.; Chen, P.; Xie, H.; Zhang, S. Detection and Estimation of along-Track Attitude Jitter from Ziyuan-3 Three-Line-Array Images Based on Back-Projection Residuals. IEEE Trans. Geosci. Remote Sens. 2017, 55, 4272–4284. [Google Scholar] [CrossRef]
  33. Sun, T.; Long, H.; Liu, B.; Li, Y. Application of attitude jitter detection based on short-time asynchronous images and compensation methods for Chinese mapping satellite-1. Opt. Express 2015, 23, 1395–1410. [Google Scholar] [CrossRef]
  34. Luo, B.; Yang, F.; Yan, L. Key technologies and research development of CMOS image sensors. In Proceedings of the 2010 Second IITA International Conference on Geoscience and Remote Sensing (IITA-GRS 2010), Qingdao, China, 28–31 August 2010; Volume 1. [Google Scholar]
  35. Sunny, A.I.; Zhang, J.; Tian, G.Y.; Tang, C.; Rafique, W.; Zhao, A.; Fan, M. Temperature independent defect monitoring using passive wireless RFID sensing system. IEEE Sens. J. 2018, 19, 1525–1532. [Google Scholar] [CrossRef] [Green Version]
  36. Liu, H.; Li, X.; Xue, X.; Han, C.; Hu, C.; Sun, X. Vibration parameter detection of space camera by taking advantage of COMS self-correlation Imaging of plane array of roller shutter. Opt. Precis. Eng. 2016, 24, 1474–1481. [Google Scholar]
  37. Zhao, W.; Fan, C.; Wang, Y.; Shang, D.H.; Zhang, Y.H.; Yin, Z.H. A Jitter Detection Method for Space Camera Based on Rolling Shutter CMOS Imaging. Acta Opt. Sin. 2021, 1, 13. [Google Scholar]
  38. Low, D.G. Distinctive Image Features from Scale-Invariant Keypoints. Int. J. Comput. Vis. 2004, 60, 91–110. [Google Scholar] [CrossRef]
Figure 1. The schematic diagram of CMOS sensor imaging with rolling shutter perpendicular to the motion direction. (a) Imaging design of CMOS sensor with rolling shutter; (b) ground coverage corresponding to a frame of CMOS image by rolling shutter; (c) The output CMOS image by rolling shutter.
Remotesensing 14 00342 g001
Figure 2. The schematic diagram of the jitter detection principle using CMOS images by rolling shutter. (a) Imaging coverage of CMOS sensor with rolling shutter under jitter condition; (b) Overlapping area of two adjacent CMOS images by rolling shutter.
Remotesensing 14 00342 g002
Figure 3. Flowchart of jitter detection using sequence CMOS images by rolling shutter.
Remotesensing 14 00342 g003
Figure 4. The simulated sequence CMOS images. (a) Simulation image source (the colored parallelograms with dotted line are the imaging coverages of the CMOS with rolling shutter); (b) Five simulated sequence CMOS images by rolling shutter with 100−Hz jitter numbered 1–5.
Remotesensing 14 00342 g004
Figure 5. The 100−Hz Jitter detection curves and Fourier analysis results by single disparity map generated from two adjacent sequence images. (a) Jitter detection curve by image 1–2; (b) Fourier analysis results of jitter detection curve by image 1–2; (c) Jitter detection curve by image 2–3; (d) Fourier analysis results of jitter detection curve by image 2–3; (e) Jitter detection curve by image 3–4; (f) Fourier analysis results of jitter detection curve by image 3–4; (g) Jitter detection curve by image 4–5; (h) Fourier analysis results of jitter detection curve by image 4–5.
Remotesensing 14 00342 g005aRemotesensing 14 00342 g005b
Figure 6. The 10-Hz Jitter detection curves and Fourier analysis results by single disparity map generated from two adjacent sequence images. (a): Jitter detection curve by image 1–2; (b) Fourier analysis results of jitter detection curve by image 1–2; (c) Jitter detection curve by image 2–3; (d) Fourier analysis results of jitter detection curve by image 2–3; (e) Jitter detection curve by image 3–4; (f) Fourier analysis results of jitter detection curve by image 3–4; (g) Jitter detection curve by image 4–5; (h) Fourier analysis results of jitter detection curve by image 4–5.
Remotesensing 14 00342 g006aRemotesensing 14 00342 g006b
Figure 7. The 2-Hz Jitter detection curves and Fourier analysis results by single disparity map generated from two adjacent sequence images. (a): Jitter detection curve by image 1–2; (b): Fourier analysis results of jitter detection curve by image 1–2; (c): Jitter detection curve by image 2–3; (d): Fourier analysis results of jitter detection curve by image 2–3; (e): Jitter detection curve by image 3–4; (f): Fourier analysis results of jitter detection curve by image 3–4; (g): Jitter detection curve by image 4–5; (h): Fourier analysis results of jitter detection curve by image 4–5.
Remotesensing 14 00342 g007
Figure 8. The 100-Hz jitter detection curves by sequential disparity maps. (a): The whole detected results; (b): The local amplification of rectangular area 1 in (a); (c): The local amplification of rectangular area 2 in (a).
Remotesensing 14 00342 g008
Figure 9. The 10-Hz jitter detection curves by sequential disparity maps. (a): The whole detected results; (b): The local amplification of rectangular area 1 in (a); (c): The local amplification of rectangular area 2 in (a).
Remotesensing 14 00342 g009
Figure 10. The 2-Hz jitter detection curves by sequential disparity maps. (a): The whole detected results; (b): The local amplification of rectangular area 1 in (a); (c): The local amplification of rectangular area 2 in (a).
Remotesensing 14 00342 g010
Figure 11. The 100-Hz jitter detection curves by sequential disparity maps after interpolation. (a): The whole detected results after interpolation; (b): the local amplification of rectangular area 1 in (a); (c): the local amplification of rectangular area 2 in (a).
Remotesensing 14 00342 g011
Figure 12. The 10-Hz jitter detection curves by sequential disparity maps after interpolation. (a): The whole detected results after interpolation; (b): the local amplification of rectangular area 1 in (a); (c): the local amplification of rectangular area 2 in (a).
Remotesensing 14 00342 g012
Figure 13. The 2-Hz jitter detection curves by sequential disparity maps after interpolation. (a): The whole detected results after interpolation; (b): the local amplification of rectangular area 1 in (a); (c): the local amplification of rectangular area 2 in (a).
Remotesensing 14 00342 g013
Figure 14. Analysis results of 100-Hz jitter detection curve after interpolation by sequential disparity maps. (a) Fourier analysis results; (b) Fitting results.
Remotesensing 14 00342 g014
Figure 15. Analysis results of 10-Hz jitter detection curve after interpolation by sequential disparity maps. (a) Fourier analysis results; (b) Fitting results.
Remotesensing 14 00342 g015
Figure 16. Analysis results of 2-Hz jitter detection curve after interpolation by sequential disparity maps. (a) Fourier analysis results; (b) Fitting results.
Remotesensing 14 00342 g016
Table 1. Basic information of the simulated datasets.
Dataset
ID
FrequencyAmplitudeIntegration
Time
Imaging
Duration
Image SizeNumber of Images
1100.01.00.0000250.256 s2048 × 20485
210.01.00.0000250.512 s2048 × 204810
32.02.00.0000251.536 s2048 × 204830
Table 2. Statistical results of relative jitter error curve fitting by single disparity map generated from two adjacent sequence images.
Image
Combination
Frequency/HzAmplitude/PixelPhase/Rad
1–2100.0058250.6973091.945412
2–399.9923490.7052601.958776
3–499.9986520.7225301.949275
4–5100.0011280.7292111.945773
Table 3. Fitting results of relative jitter error curves of three different frequencies by sequential disparity maps.
DataFrequency/HzAmplitude/PixelPhase/Rad
199.9977110.7133951.940706
210.0037741.9429743.177410
32.0005331.2680481.891298
Table 4. The 100-Hz jitter modeling results by single disparity map.
Image
Combination
Frequency/HzAmplitude/PixelPhase/Rad
1–2100.0058250.9448750.003312
2–399.9923490.9608970.001704
3–499.9986520.9819040.002196
4–5100.0011280.9694150.004857
Average value99.9994880.9694150.004857
Table 5. Accuracy evaluation results of jitter modeling at 100 Hz by single disparity map.
Image
Combination
Average
Error/Pixel
RMSE/PixelMaximum
Error/Pixel
Minimum
Error/Pixel
1–20.0000090.0391180.055342−0.055328
2–3−0.0000590.0282900.040181−0.040237
3–4−0.0000130.0128120.018113−0.018111
4–50.0000070.0074890.010634−0.010646
Average value−0.0000140.0219270.031067−0.003417
Table 6. Jitter modeling results of three different frequencies by sequential disparity maps.
DataFrequency/HzAmplitude/PixelPhase/Rad
199.9977110.9698110.003287
210.0037740.9721870.002489
32.0005332.0047540.001283
Table 7. Accuracy evaluation results of jitter modeling of three different frequencies by sequential disparity maps.
DataAverage
Error/Pixel
RMSE/PixelMaximum
Error/Pixel
Minimum
Error/Pixel
1−0.0004130.0214360.030350−0.00357
2−0.0020360.0203520.030045−0.030512
3−0.0001290.0064870.011325−0.012143
Average value−8.56E−40.0160910.023907−0.015408
Publisher’s Note: MDPI stays neutral with regard to jurisdictional claims in published maps and institutional affiliations.

