1. Introduction
The paradigm shift from bringing the data to the user to bringing the user to the data has paved the way to cloud computing, where resources can be shared and scaled depending on the user’s needs. Computing intensive tasks can be sped up by assigning more computing resources. This is important for workflows that need to be processed in near real-time or when dealing with large-scale processing. For instance, remote sensing applications deal with images that are being processed at continental or global scales at an ever increased spatial resolution. An overview of cloud platforms for big Earth Observation data management is provided in [
1]. Adding more resources increases the cost, and the available computing resources should be used in an optimal way. However, this is not a trivial task and depends on the application at hand.
Previous work focused on the optimal task allocation when processing a high volume of geospatial data [
2]. The objective of this work was to test different strategies for parallel processing of geospatial images to optimize computing resources in a cloud computing environment with respect to speedup. A very effective way to speedup the processing workflow is to tile an image and process the image tiles in parallel. The MapReduce model applied in the Google Earth Engine cloud computing platform [
3] is based on image tiling. Specific for disaster monitoring, the potential of MapReduce in a cloud computing environment was studied in [
4]. The authors assessed the increase in speedup by adding more processing resources to the cloud computing environment. In another study [
5], vegetation dryness was monitored with remote sensing in a multi-grid architecture. The authors subdivided raster images into several independent blocks, which were then distributed in different data nodes. By further tiling the image blocks, the blocks could then be processed in parallel.
As an alternative to image tiling, the speedup of workflows can also be achieved by processing different iterative parts of a program in parallel. Parallelism can occur between nodes or within a (multi-core) node, also referred to as multi-threading. Between node parallelism is typically implemented with the Message Passing Interface (MPI) standard and is used in High-Performance (HPC) computing. An overview of HPC for remote sensing is provided in [
6]. In this study, multi-threading was used and has been implemented with the openMP [
7] application programming interface (API). In particular, the multi-threading was assessed in combination with different image tiling strategies.
As a workflow, the spatial aggregation of a temporal profile of remotely sensed images was selected. This is a common processing task for many remote sensing applications. More specifically, the temporal profile of the normalized difference vegetation index (NDVI) was spatially aggregated over polygons representing parcels. The resulting temporal profile can be used to characterize crop phenology at the parcel level.
The real (actual elapsed) processing time of a workflow depends on many factors, which makes a comparison of results challenging. The first issue is the hardware on which the workflow is executed. A processing cluster often consists of a variety of processing nodes with different specifications. To compare results, subsequent runs must be executed on similar hardware. Extra care should also be taken in a multi-user environment, where computing resources are shared. Another hardware component that impacts real processing time is data access. This is much faster for a local solid-state drive (SSD) than via a distributed file system with hard disk drives that are accessed through a network. The level of parallelization was therefore estimated by performing the experiments on a dedicated virtual machine with 40 cores (single user). The experiments were then repeated in a real cluster environment to check the consistency of the results. Rather than focusing on the absolute values for the real processing time, the strategies for parallel processing were assessed with respect to the speedup. Speedup is a relative measure, defined as the ratio of the real processing time for the sequential program to the real processing time for the program running in parallel.
Aside from the optimal combination of parallel processing strategies, the deployment of any workflow on a given platform might require adaptation of the code and, therefore, limit portability from one platform to another. This can be addressed by making sure that the implementation relies on an application programming interface (API) abstracting any platform-specific details, such as those related to data access.
Another issue is linked to the implementation details of the workflow. Results highly depend on the specific software and libraries used. In this study, the open-source Python library pyjeo [
8,
9] was used. A Dockerfile is also available to enable the software to be deployed and run in a variety of virtual environments [
9].
This paper is organized as follows. In
Section 2, the different strategies for parallel processing are presented. The workflow on which the current study is based is introduced in
Section 3. In
Section 4, we show that the openEO API [
10] can be used to effectively abstract any platform dependency. We also describe the platform on which openEO was deployed for conducting the experiments. Results are presented in
Section 5, and conclusions are drawn in
Section 6.
2. Parallel Strategies and Optimization
Different strategies for parallel processing were applied. The first strategy was to spatially divide the region of interest into smaller tiles. Tiling is a typical example of an embarrassingly parallel problem with a high level of parallelization. The level of parallelization (P) is defined as the part of a program that can be run in parallel as a percentage of the total. In a problem with no serial part (), each tile would be processed as many times faster as the number of tiles (N). The speedup would thus be equal to N. In practice, the level of parallelization is limited by, e.g., the overhead involved with reading part of the image (e.g., opening and closing the file).
According to Amdahl’s law [
11], the theoretical speedup by tiling using
N tiles can be calculated as:
Although Amdahl’s law has been under debate [
12], it is still commonly used to estimate the level of parallelization of implementation and as a theoretical measure to which experimental results can be compared [
13].
Tiling the image has the additional benefit of reducing the memory footprint. Some image processing libraries, such as XArray [
14], combined with Dask [
15], which implement lazy data loading, are based on the same principle. These libraries load data into memory only when actually needed for a computation. For the selected workflow of this study, tiles for which no parcels are found are skipped in the process. However, reducing the memory footprint lowers the required resources. In the case of a cluster environment, this provides a competitive advantage when multiple jobs compete for the same resources. The job manager typically starts serving those jobs for which fewer resources are needed in order to avoid idle processing units that have insufficient resources for other jobs. Likewise, in the case of a virtual server in the cloud, processing can be performed on a virtual machine with fewer memory resources. This reduces the cost because cloud service providers typically ask a higher price for virtual machines with more memory requirements. Nevertheless, if all tiles are processed in parallel, the total memory footprint accumulated over all cores is not reduced and must still be available.
Even though tiling is an excellent approach for parallel processing, it cannot be applied to all workflows. Image segmentation is one example. Moreover, in the workflow selected for this study, spatial tiling has some limitations. The aggregated values for polygons that have been cut in the tiling process do not represent the entire parcel. This issue can be avoided by introducing an overlap between the tiles. The overlap must correspond to the maximum parcel size (in x and y). Depending on the overlap introduced, the actual speedup will, therefore, be lower in practice. In addition, the memory footprint increases with the degree of overlap.
A different approach to parallel processing is multi-threading. Many numerical and image processing libraries support multi-threading [
8,
16]. The library used for this study (pyjeo) supports multi-threading based on the OpenMP [
7] application programming interface (API). To assess parallel processing by multi-threading, the workflow was run by varying the number of cores, where the number of threads is set with the environment variable
OMP_NUM_THREADS. The number of threads was set to the number of physical cores. Setting the CPU affinity allowed the execution of the process on the designated cores only. Running all threads on different physical cores results in true simultaneous execution and improves parallelism.
Replacing the number of tiles (
N) with the number of threads (
T) in Equation (
1), the theoretical speedup
using
T threads is obtained as follows:
If tiling and multi-threading are combined, the effect between both must first be assessed before multiplying the respective speedup values. Indeed, the speedup with multi-threading is expected to reduce when tile size decreases. This is due to a relative increase of the processing time for tasks that can only be run in serial (e.g., to open and close a file, reading metadata). The level of parallelization
P in Equation (
2) must, therefore, be calculated for the respective tiling scheme applied.
By estimating the theoretical speedup, different cloud computing environments with a variety of computing resources can be simulated. This was performed for two typical cloud computing environments. The first environment studied was a high throughput computing cluster. The task of the job scheduler is to create a batch of jobs for the selected tiling scheme. Each job represents a single tile on one of the available working nodes. Depending on the available resources in the cluster, a certain amount of jobs can be run in parallel, single, or multi-threaded. Medium to large-sized clusters consist of hundreds to thousands of cores. However, not all cores will be available for a single user in practice. The simulations were performed for a cluster with 512 cores available. Although this number is rather arbitrary, more general conclusions can be drawn from the simulations performed. Another limitation in a cluster environment in practice is the number of available cores for a single working node. A computing cluster typically consists of working nodes with a certain number of physical cores. Multi-threading should be restricted to the number of physical cores in the respective working nodes. Threads competing for the same processing resources will negatively impact the speedup. Two types of working nodes in the cluster were considered here: a high-performance working node of 30 cores and a working node with only 8 cores.
When processing tiles in the cloud on a single virtual machine, the situation is different than when processing in a cluster. The cost of a virtual machine in the cloud increases rapidly with the amount of (virtual) cores and memory. The speedup by tiling assumes that all tiles of the selected tiling scheme are processed in parallel. However, if, due to a lack of cores or memory resources, only a subset n of the total number of tiles N can be processed in parallel, the remaining tiles will have to be queued for subsequent processing. This results in extra latency that was accounted for in the optimization of the speedup. A second experiment was conducted, where the number of cores was reduced from 512 to 32 (high-end virtual machine) and 8 (lower-end virtual machine).
With the total number of cores available in the virtual machine (
C) fixed, the number of threads
T available to process each tile can then be calculated as a floor division between
C and
n:
The speedup
S to be optimized can then be expressed as:
The speedup values for tiling and threading must be based on the corresponding conditions (number of tiles and threads) to take into account the effect of tiling on multi-threading as discussed above. The factor corrects for the latency that is introduced by the fraction of tiles that can be processed in parallel. The expression still holds for a computing cluster environment with sufficient cores and memory available ().
3. Workflow: Spatial Aggregation
With the new Common Agriculture Policy (CAP) implementation for 2023–2027 [
17], there is an important shift from a controlling approach based on sampling to monitoring each agricultural parcel. Satellite images from the Copernicus program are available with a spatial resolution of up to 10 m (Sentinel-2), which allows the extraction of sufficiently detailed information at the average parcel level. Meanwhile, with the two-satellite constellations (A and B), revisit times of 2–3 days can be obtained thanks to large overlaps between the swaths originating from adjacent orbits of the satellites. Even for the cloudy conditions in most parts of central and western Europe, this allows time series to be obtained to characterize the phenology of different crop types along the agronomic year for each agricultural parcel.
An index that is often used for vegetation applications is the normalized difference vegetation index (NDVI). It expresses the greenness of vegetation and is based on the reflectance values in the red and near-infrared (NIR) parts of the electromagnetic spectrum. The surface reflectance can be derived from the Sentinel-2 satellite acquisitions and are available for download as level 2A products (bottom of atmosphere surface reflectance) [
18]. The Sentinel-2 surface reflectance value for a pixel at position
, acquisition time
t, and for the spectral band
b can be represented as a data cube in four dimensions:
The NDVI for a pixel at position
and at acquisition time
t can then be calculated as a function from of the data cube as follows:
The time series of NDVI derived from Sentinel-2 can be used for phenology retrieval [
19], crop monitoring, crop identification, and investigating crop rotations or other agricultural practices [
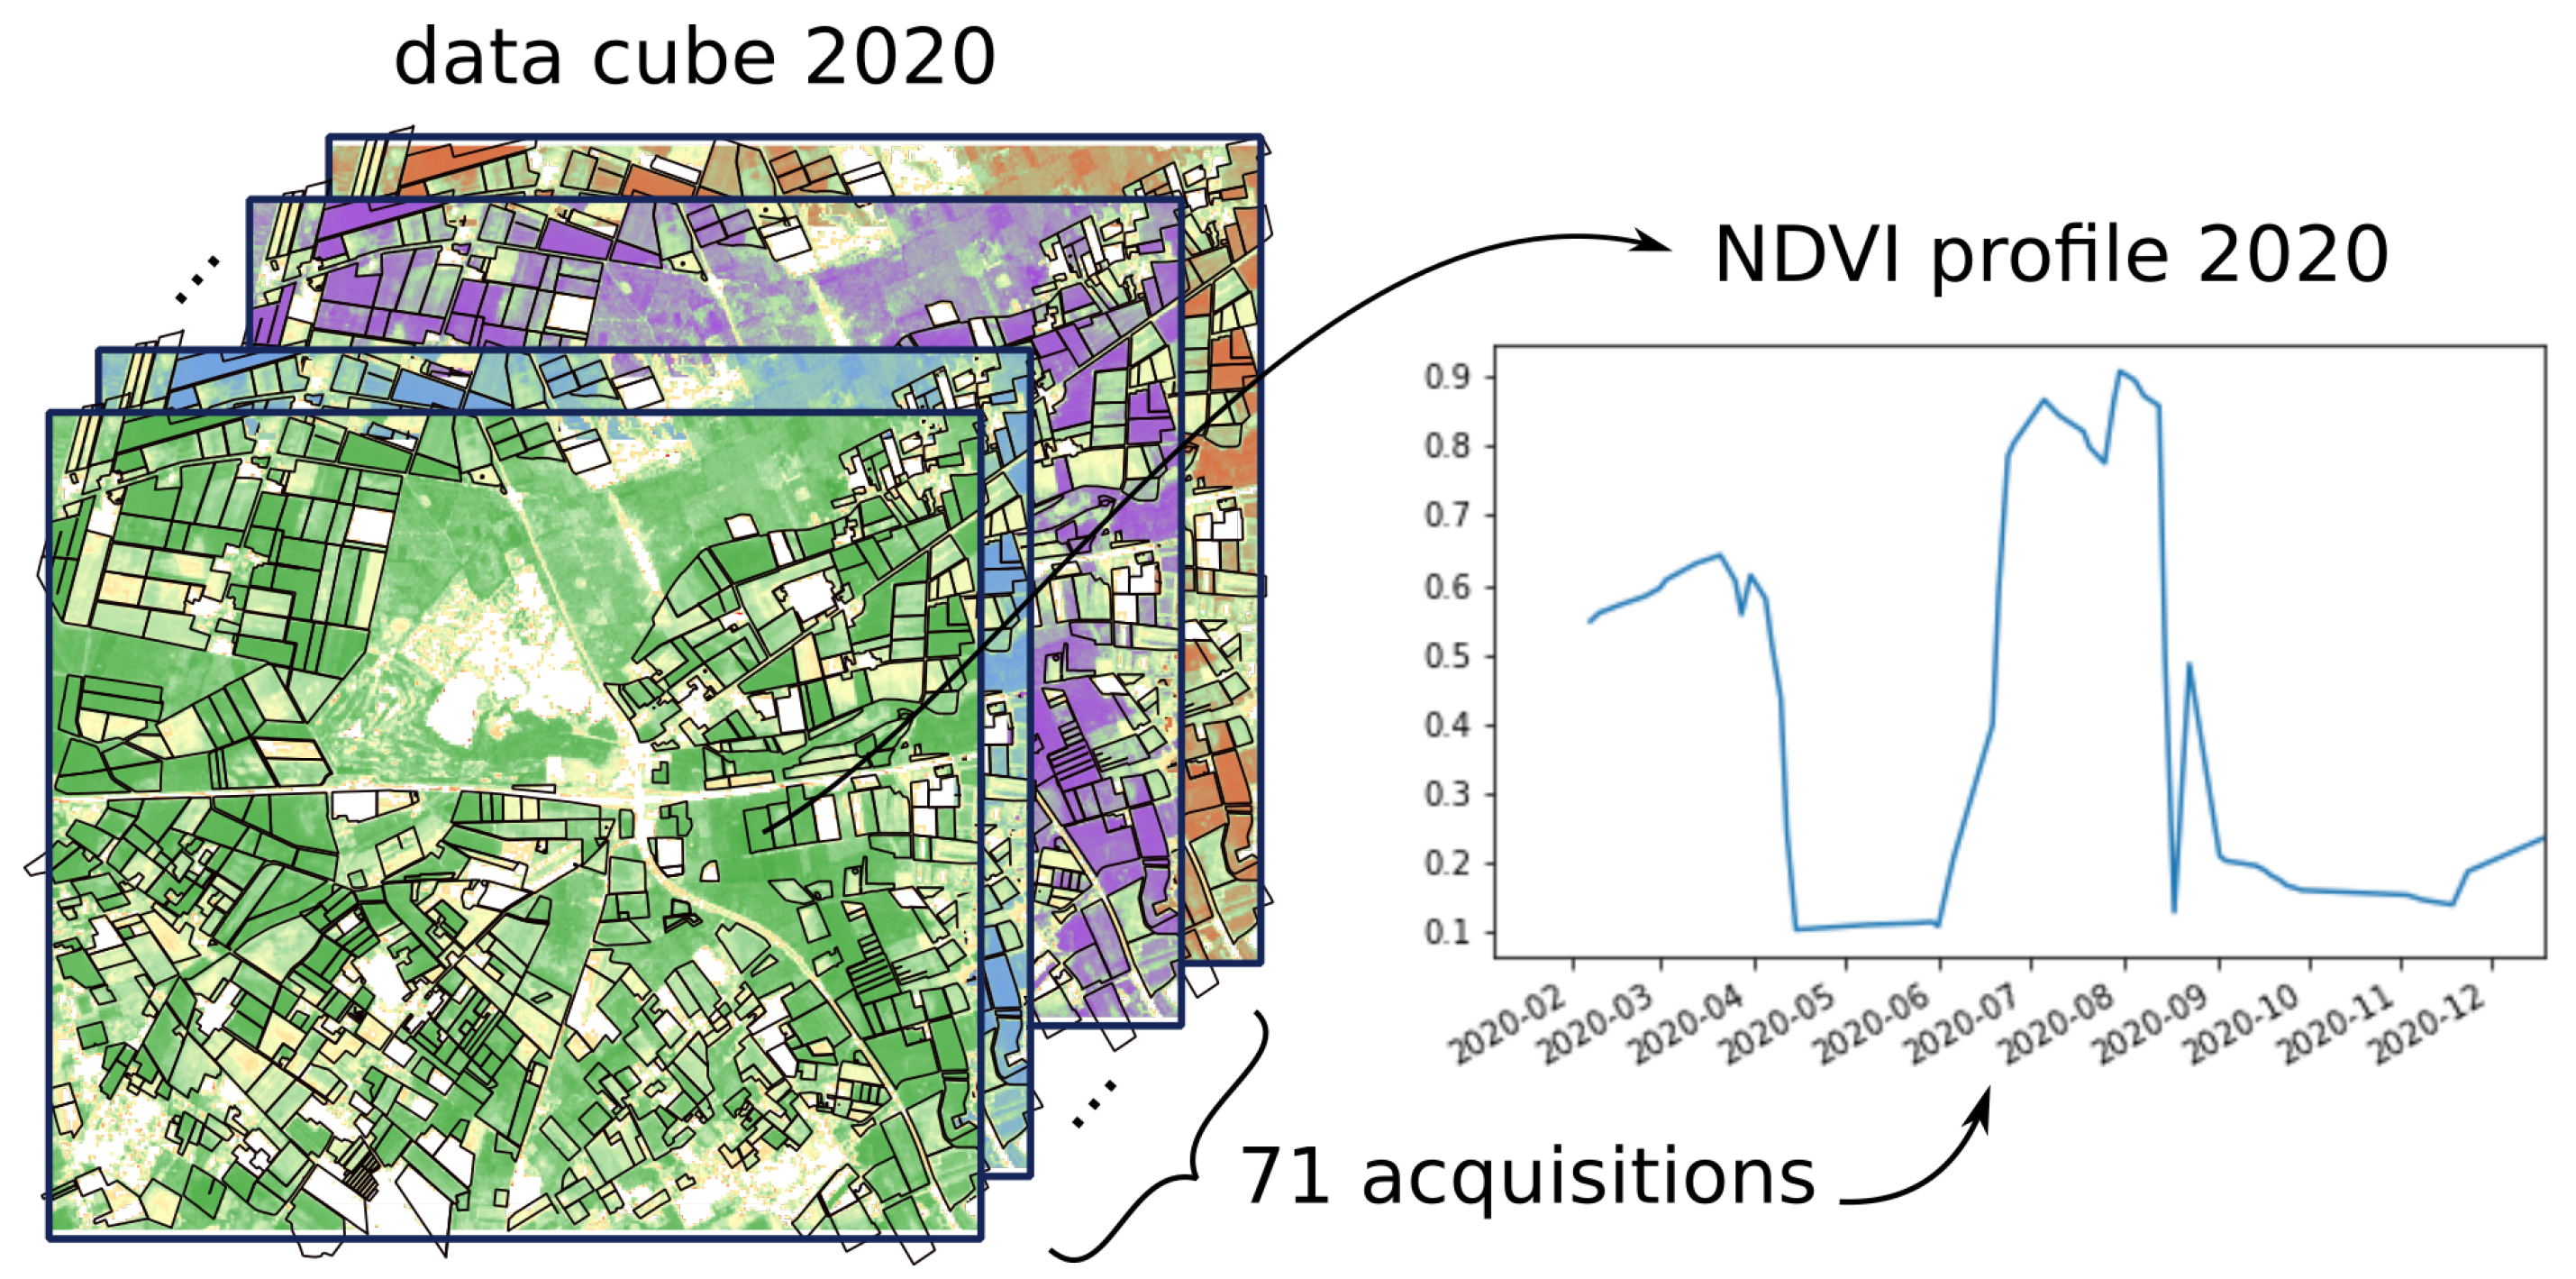
20]. However, the amount of data to be processed can be an obstacle for European Union (EU) member states that will implement the new CAP monitoring system. With an efficient extraction tool that aggregates the pixel information at the parcel level as a cloud service, this task can be greatly simplified. Instead of dealing with massive amounts of pixel data of varying quality (e.g., due to cloud cover), member states obtain spatially aggregated and filtered time series
at the parcel level (
p) that can be analyzed locally. When the pixel values within the parcels are spatially aggregated by calculating the mean of the NDVI values for each of the 71 images for all the Sentinel-2 acquisitions in 2020, a time series NDVI at the parcel level
p is obtained, as shown in
Figure 1.
An implementation of the spatial aggregation is presented in pseudocode in Algorithm 1. The algorithm starts by initializing a data cube from a Sentinel-2 collection, processed to level 2A. The collection is filtered to the spatial region of interest and acquisitions within 2020 (71 acquisitions). The nested “for” loops corresponding to the iteration over parcels, acquisition times, and pixels within the parcels indicate the computation-intensive character of the algorithm but also the potential for parallelization.
| Algorithm 1 Pseudocode to obtain spatially aggregated normalized difference vegetation index (NDVI) time series at the parcel level. |
| Input: Sentinel-2 Level 2A collection, parcels (as polygon features) |
| Output: NDVI (time series at parcel level) |
| cube ← Sentinel-2 Level 2A collection |
| for each parcels do |
| for each acquisition times of 2020 do |
| |
| |
| for each pixel do |
| if is not masked then |
| |
| |
| end if |
| end for |
| if npixels then |
| |
| else |
| invalid |
| end if |
| end for |
| end for |
Optimizing the presented workflow for speedup is most relevant when a large amount of reference data needs to be extracted, for instance, to produce crop type maps at the continental scale ([
21]), and in particular when dealing with deep learning techniques [
22]. In this study, parcel information was obtained from publicly available data for the Netherlands (Basisregistratie Percelen van de Rijksdienst voor Ondernemend Nederland) and were downloaded [
23]. The NDVI values were calculated and spatially aggregated for 36,644 parcels in total (
Figure 2). For each parcel, a time series of 71 acquisitions was obtained that covered the year 2020. At a spatial resolution of
, the spatial dimension of the data cube was 4133 rows by 3619 columns. In addition to the red and near-infrared (NIR) spectral bands, the data cube was composed of a third band corresponding to the scene classification (SCL). This band was needed to mask pixels that were either cloudy or not vegetated.
4. Abstracting Platform-Specific Dependencies with openEO
With the free, full, and open data policy of the Copernicus program and parcel data that are publicly available, the experiments in this study can be performed on a variety of cloud platforms with access to Sentinel-2 data. Nevertheless, reproducing the results with an exact copy of the code remains difficult. Each provider has its own application programming interface (API) to access the data on its platform. For instance, some store EO data as regular files in their original format as received from the satellite data provider, while others pre-process them to be stored in an array database [
24]. In an attempt to standardize access to Earth Observation (EO) data and processing capabilities across a variety of cloud service providers that have distinct architectures, the openEO [
10] project was created. The openEO project has defined an open-source API through which users can address any openEO compatible backend to deploy their EO data analysis workflows without knowing the infrastructure details of the backend. In this work, the workflow was implemented on the Big Data Analytics Platform (BDAP), following the specification of openEO. The BDAP, formerly known as the JRC Earth Observation Data Processing Platform (JEODPP) [
25], is primarily developed for internal use within the European Commission (EC) and can be accessed as a cloud service over the internet. However, the exact workflow presented here can be run on any openEO compliant backends. Although not the objective of this study, the performance of the respective implementations could, therefore, be compared.
The first component of openEO, the client API, makes abstraction of the data representation at the backend providers by presenting the user a virtual data cube as a multiband (e.g., spectral or polarization) and multidimensional array in the space (
x and
y) and time domain. It is up to the openEO compliant backend how this data cube is implemented. Backends with a file-based data storage typically produce such a data cube on the fly at the requested spatial resolution and in a user-defined spatial reference system. The job of the client API is to translate the EO data analysis workflow from the programming language of the client to a process graph, which is written in JavaScript Object Notation (JSON) format. The specifications for the process graph are defined by the second component of openEO, the core API [
26]. The double-layered API allows the client API, which is exposed to the user, to be written in a different language than the backend that executes the process graph. Currently, the openAPI client is available for three programming languages: R, JavaScript, and Python. The openEO core API has identified a total of 120 pre-defined processes that users can combine to describe their workflows. In addition, new functions can be added as user-defined functions (UDF). They offer more flexibility to the user, with the restriction that the code and the libraries used must be supported by the backend infrastructure.
A typical image processing workflow in batch mode is handled in nine steps via a representational state transfer (REST) web service (
Figure 3). The web service runs on NGINX and has been implemented with the FastAPI web framework. In the first step, a user posts a job to the BDAP backend. The job is described as a process graph in JSON format, following the openEO core API specifications [
26]. The process graph is then put in a PostgreSQL database (step 2). Only when the user requests to start the job, the job execution process will initiate (step 3). The subsequent steps 4–9 are then executed without further user interaction. The user can request to stop or delete a job and query its status (queued, running, error, finished). The job is put in a queue to be run as a containerized application that is orchestrated by Kubernetes (step 4). At this point, the job status in the database is set to queued (step 5). Once processing resources are available in the Kubernetes cluster, the job is started (step 6), and its status is set in the database accordingly (step 7). The workflow can be balanced through a tiling mechanism, where parts of the image (tiles) are distributed to different pods (single instances of a running process in the Kubernetes cluster). When all pods have ended their tasks (step 8), the job status in the database is marked as finished. Results are stored and can be downloaded or visualized (e.g., via a web mapping service) by the user.
The workflow in Listing 1, written in Python, follows the specifications of the openEO Python client API [
27]. After importing the openEO module (
import openeo), a connection is set up to the BDAP backend. A data cube is then loaded (
load_collection) by specifying the Sentinel-2 collection at level 2A (bottom of atmosphere reflectance) as an argument. Before a data cube is actually created and loaded into the memory, it is first filtered spatially to select the region of interest. It is then filtered temporally (
filter_temporal: all acquisitions of the year 2020). Finally, the spectral bands are filtered (
filter_bands with B4: red band, B8: near-infrared band, and SCL: scene classification). The NDVI is calculated as the normalized difference between the red and near-infrared bands (
ndvi). Vegetated pixels are coded with a value of 4 in the SCL band. All pixels with a different code are masked (
mask). The remaining pixels are then spatially aggregated by calculating the mean NDVI value at the parcel level (
polygonal_mean_timeseries). The parcels are represented by the polygons in a vector file in GeoJSON format. The aggregated NDVI values are then saved to a vector file (
save_result). The client API converts this Python code to a process graph JSON according to the openEO core API. The process graph is sent to the backend (
send_job), where the job is executed in batch mode (
start_job).
| Listing 1. Spatial aggregation workflow compliant with openEO API.
|
- 1
import openeo - 2
openeoURL=“http://openeo-dev.cidsn.jrc.it:46204” - 3
connection = openeo.connect(openeoURL) - 4
datacube = connection.load_collection(“EO.Copernicus.S2.L2A”) - 5
datacube = datacube.filter_bbox(west = 5.5, south = 51.34, east = 6.0, north = 51.7) - 6
datacube = datacube.filter_temporal(start_date=“2020-01-01”, end_date=“2021-01-01”) - 7
datacube = datacube.filter_bands([“B4”, “B8”, “SCL”]) - 8
ndvi = datacube.ndvi(nir = ‘B8’, red = ‘B4’) - 9
classification = datacube.band(“SCL”) - 10
vegetation_mask = (classification !=4) - 11
ndvi = ndvi.mask(vegetation_mask) - 12
ndvi = ndvi.polygonal_mean_timeseries(‘parcels.json’) - 13
ndvi = ndvi.save_result() - 14
job = ndvi.send_job() - 15
job.start_job()
|
5. Results
Experiments were conducted first for tiling and multi-threading individually. Single-threaded processing without tiling was used as a reference (
) to calculate the speedup. The processing time was
, though times will vary depending on the specifications of the virtual machine and the disk access time to read the imagery from the file system. In this study, the processing time was achieved on a server Intel(R) Xeon(R) CPU E7-8870 v4. Data were accessed from EOS [
28], an open-source distributed file system developed at the European Organization for Nuclear Research (CERN). It runs on commodity hardware, and it is mainly focused on low latency, high availability, ease of operation, and low total cost of ownership [
28,
29]. The Sentinel-2 image data are stored as regular files in JPEG 2000, a discrete wavelet transform-based compression standard. The cluster can directly access the data storage on the EOS distributed file system via a
network. Uncompressing the image data and reading them into memory was performed with the Geospatial Data Abstraction Library (GDAL [
30]). The respective processing times for multi-threaded and tiled processing can be obtained by dividing this time with the respective speedup values reported.
The two most time-consuming processes of the workflow were: creating the data cube and spatially aggregating the pixels within the polygons. They accounted for of the total elapsed processing time. Other processes included: querying the Sentinel-2 data catalog, masking cloudy pixels, reading the parcel data, calculating the NDVI, and writing the results. To create the data cube, all 71 images that cover the region of interest had to be read from the disk. For a single-core and no tiling applied, the processing time to create the data cube was ( of the total time). The time for the spatial aggregation was ().
Speedup by tiling was assessed first (see
Figure 4). Comparing the experimental speedup with the theoretical speedup using Amdahl’s law, the parallelization was estimated as
(dashed curve in
Figure 4).
The speedup by multi-threading was then measured by comparing the actual elapsed processing time as a function of the number of cores. Speedup values were calculated for the two most time-consuming processes individually and for the overall process. As shown in
Figure 5, the speedup obtained via multi-threading varied with the tiling scheme. Whereas more and smaller tiles provide better parallelization through tiling, multi-threading performs better for fewer and larger tiles. This can be explained by the relative increase in the processing time of the serial tasks when dealing with smaller tiles. The effect is much more pronounced for the process to create the data cube (
Figure 5a) due to the relative importance of the overhead involved with reading only small parts of the image, such as: opening and closing a file, extracting the compressed image in JP2 format, and reading the metadata. The process to create the data cube has a relatively low level of parallelization. Similar to the spatial tiling, the parallelization level was estimated by comparing the experimental speedup obtained with multi-threading with the theoretical speedup based on Amdahl’s law [
11].
In the case of creating the data cube, the level of parallelization was estimated between
(no tiling) and
(81 tiles). The process involved with spatial aggregation achieved the highest level (
Figure 5b): between
(no tiling) and
(81 tiles). For all processes in the workflow using multi-threading,
P ranged from
(no tiling) to
(81 tiles).
Tiling and multi-threading were then combined. The objective here was to select the tiling scheme and number of threads that optimized the total speedup in a typical cloud processing environment. The number of processing cores and the amount of memory available to a specific user and workflow must hereby be taken into account. In practice, this depends on the number of cores available per working node, the applied policy with respect to concurrent users and workflows, and the costs involved with cloud services.
Speedup was first tested by processing multiple tiles single-threaded in parallel. With a tiling scheme of 81 tiles, a speedup of
was obtained (lower curve in gray in
Figure 6). Speedup was further increased by combining tiling with multi-threading. The results are shown in
Figure 6 in blue (4 threads) and red (30 threads).
The maximum speedup was reached for 36 tiles. This corresponded to tile sizes of
pixels. Further tiling and adding more threads did not improve speedup. This can be explained by the following effects. As shown in
Figure 5, the speedup with multi-threading is reduced when the tile size decreases. In addition, the gain in speedup obtained with additional tiling becomes marginal for 36 tiles and above. Hence, the gain in speedup by additional tiling is canceled by the loss in speedup with multi-threading that is related to smaller tiles.
The results for the speedup obtained for a single virtual machine, the second processing environment under study, are shown in
Figure 7. It is illustrated that speedup is drastically reduced when compared to a cluster environment (see
Figure 6). With a virtual machine configured with 32 virtual cores, the maximum speedup was obtained for a tiling scheme of 25 tiles (
). In a cluster environment with 512 cores, the speedup was
. As a reference, the speedup for single-threaded processing on a virtual machine with 32 cores is also shown (in gray). With only 8 virtual cores available, speedup was reduced to
.
6. Conclusions
Different strategies to process a typical Earth Observation data analysis workflow in parallel have been presented. This work fits in the development of a cloud computing infrastructure (backend), following the specifications of the openEO API for abstracting platform-specific dependencies. As a case study, spatial aggregation of raster data in the context of monitoring agricultural crops over time was selected.
Both spatial tiling and multi-threading were assessed for parallel processing. The time to process the region of interest single-threaded was used as a reference. Speedup was calculated as the relative gain in performance when (1) individual tiles of the region were processed in parallel, and (2) multi-threading was applied. Both techniques were shown to be successful and can be combined. The level of parallelization was estimated by comparing the experimental speedup with Amdahl’s law. Spatial tiling resulted in a high level of parallelization. However, not all workflows can be processed with a tiled approach (e.g., segmentation). Speedup by tiling is also decreased when tiles need to overlap to avoid potential edge effects. On the other hand, the success of multi-threading depends much on the algorithm applied in the workflow and is implementation-specific. Parallelization by multi-threading ranged from (spatial aggregation) to (creating the data cube) but decreased with finer grid tiling schemes. For instance, for the entire workflow it was estimated as if no tiling was applied and decreased to for a tiling scheme of 81 tiles.
Maximum speedup was obtained by combining tiling and multi-threading. However, it remains difficult to predict how the available number of cores should be used. Ideally, the levels of parallelization should be estimated as was done in this study. In general, a high level of parallelization can be expected from spatial tiling. When processing on a single virtual machine with a low number of cores and a reduced amount of memory, parallel processing via tiling is preferred. The number of tiles should hereby not exceed the number of cores to avoid extra latency of tiles that need to be queued. If, instead, many cores are available as in a processing cluster environment, multi-threading can be combined with tiling to introduce extra speedup. In this study, the best results were obtained with a tile size of pixels. If more cores than the number of tiles with a given tiling scheme are available, multi-threading can reduce processing time. In this study, multi-threading improved performance by with respect to parallelization merely by tiling.
With all data used being publicly available, results obtained in this work should be able to be reproduced in other openEO-compliant backends using the same code for the client API. However, different levels of parallelization by multi-threading can be expected for the respective implementations. Comparing different backend implementations is an interesting study for future work. The automatic allocation of the optimal memory and computing resources for the specific workflow at hand and adding stress tests with many users competing for the same computing resources are other potential directions for further research.


