PolSAR Models with Multimodal Intensities
Abstract
:1. Introduction
2. PolSAR Models and Some of Their Properties
2.1. Literature Models and Physical Insight of Our Proposal
- (i)
- the random number of scatters N in each elementary cell follows a Poisson distribution;
- (ii)
- its expected value is itself a random variable with density ; and
- (iii)
- the density of the intensity I is , then, adapting the original result from single-look to the L-look case;
- (iv)
- for large enough, the conditional model follows a Gamma distribution with shape L and scale such that is the common variance of the amplitude of the individual scatters; and, therefore,
- (v)
- the density of the unconditional intensity I iswhich is a model for each element in the main diagonal of SCM distributions.
2.2. New Models
2.3. Mathematical Properties
3. Maximum Likelihood and Mellin-Based Inference Procedures
3.1. Maximum Likelihood Estimation via EM
- Step E: Derivewhere is the expected value with respect to wih pmf .
- Step M: In the th iteration, find that maximizes ,
3.2. Mellin Diagram
4. Results and Discussion
4.1. Analysis of Simulated Data
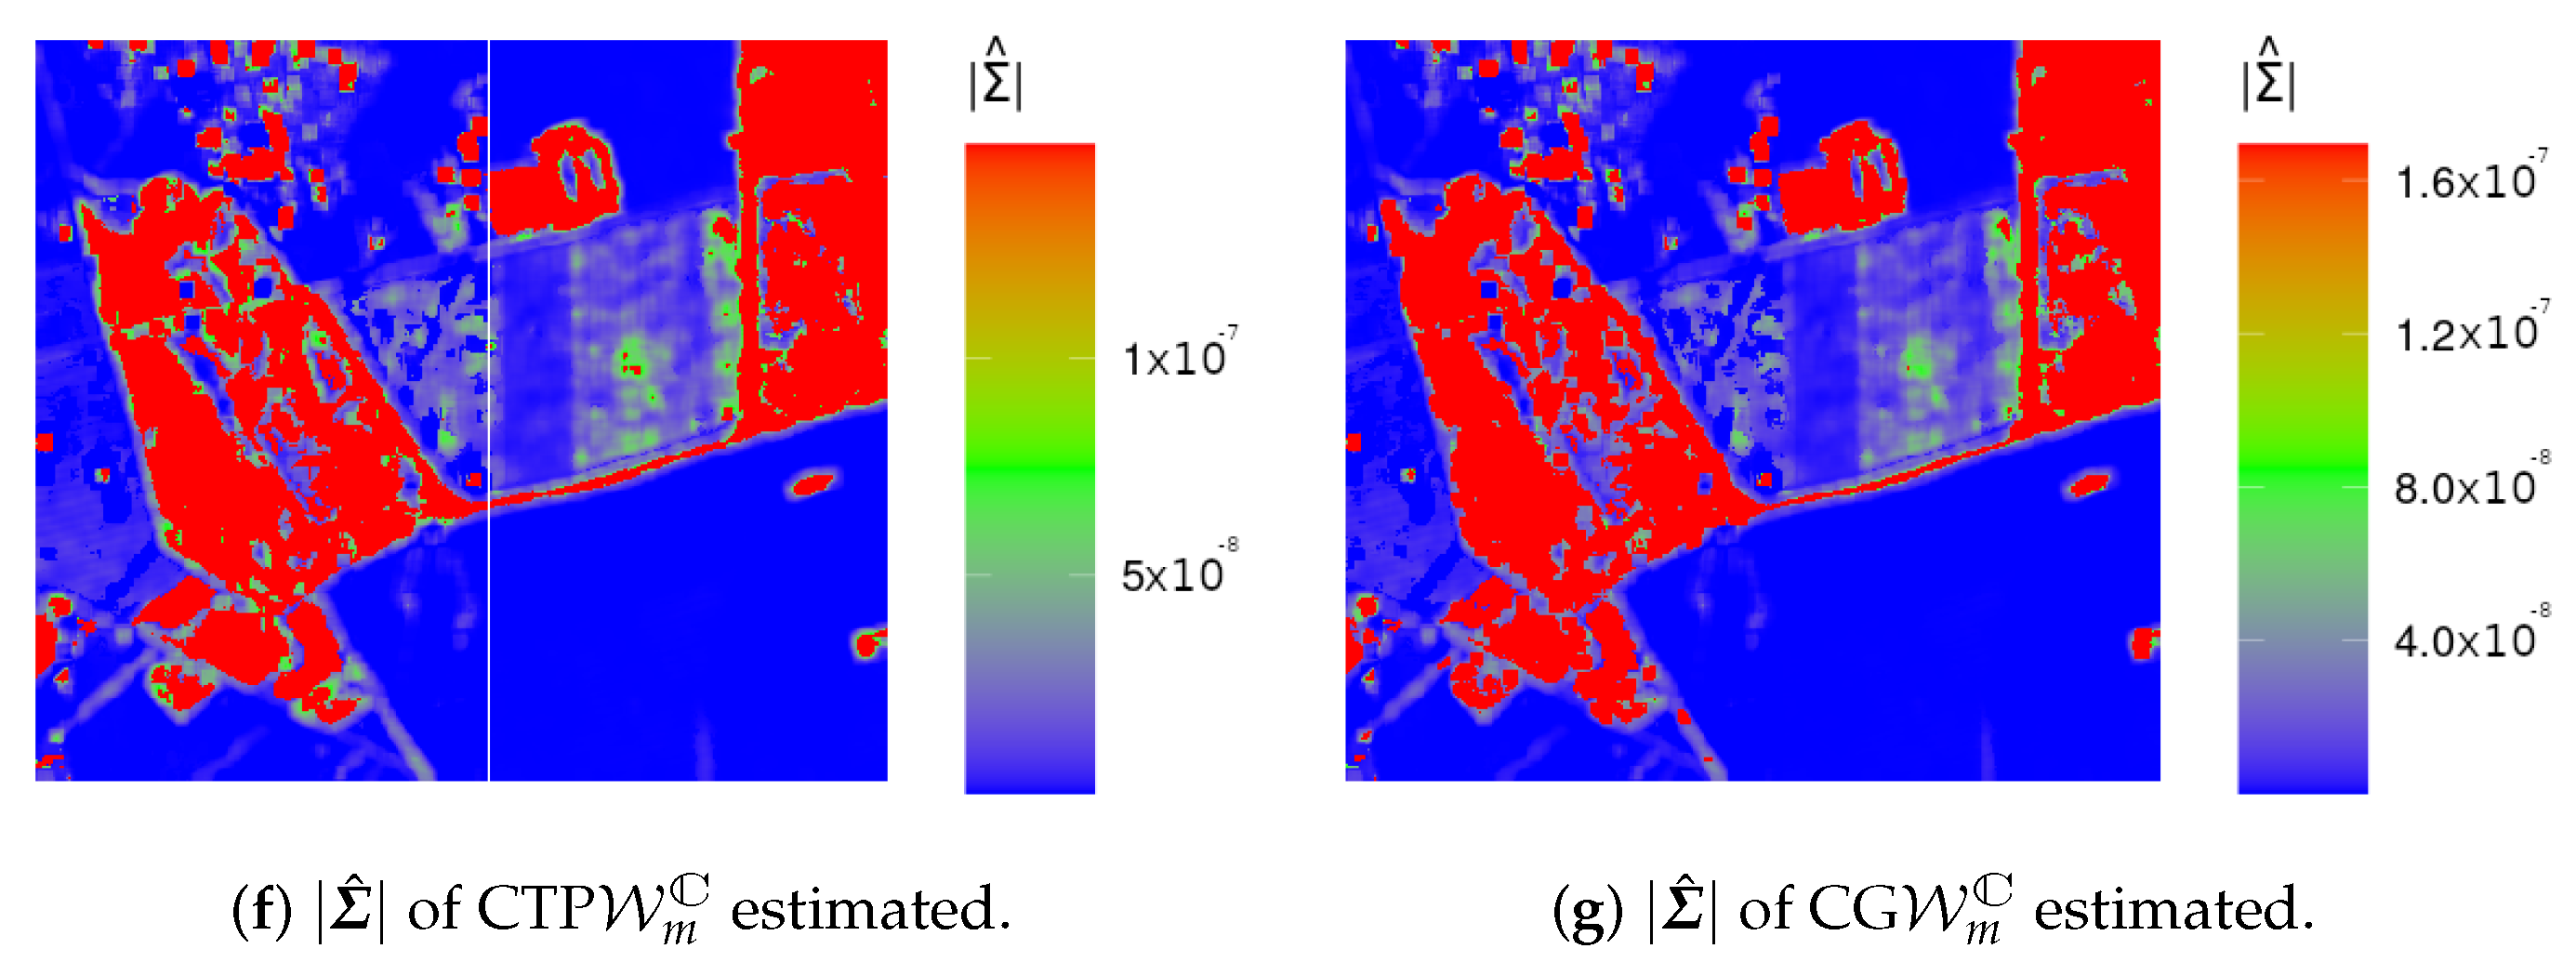
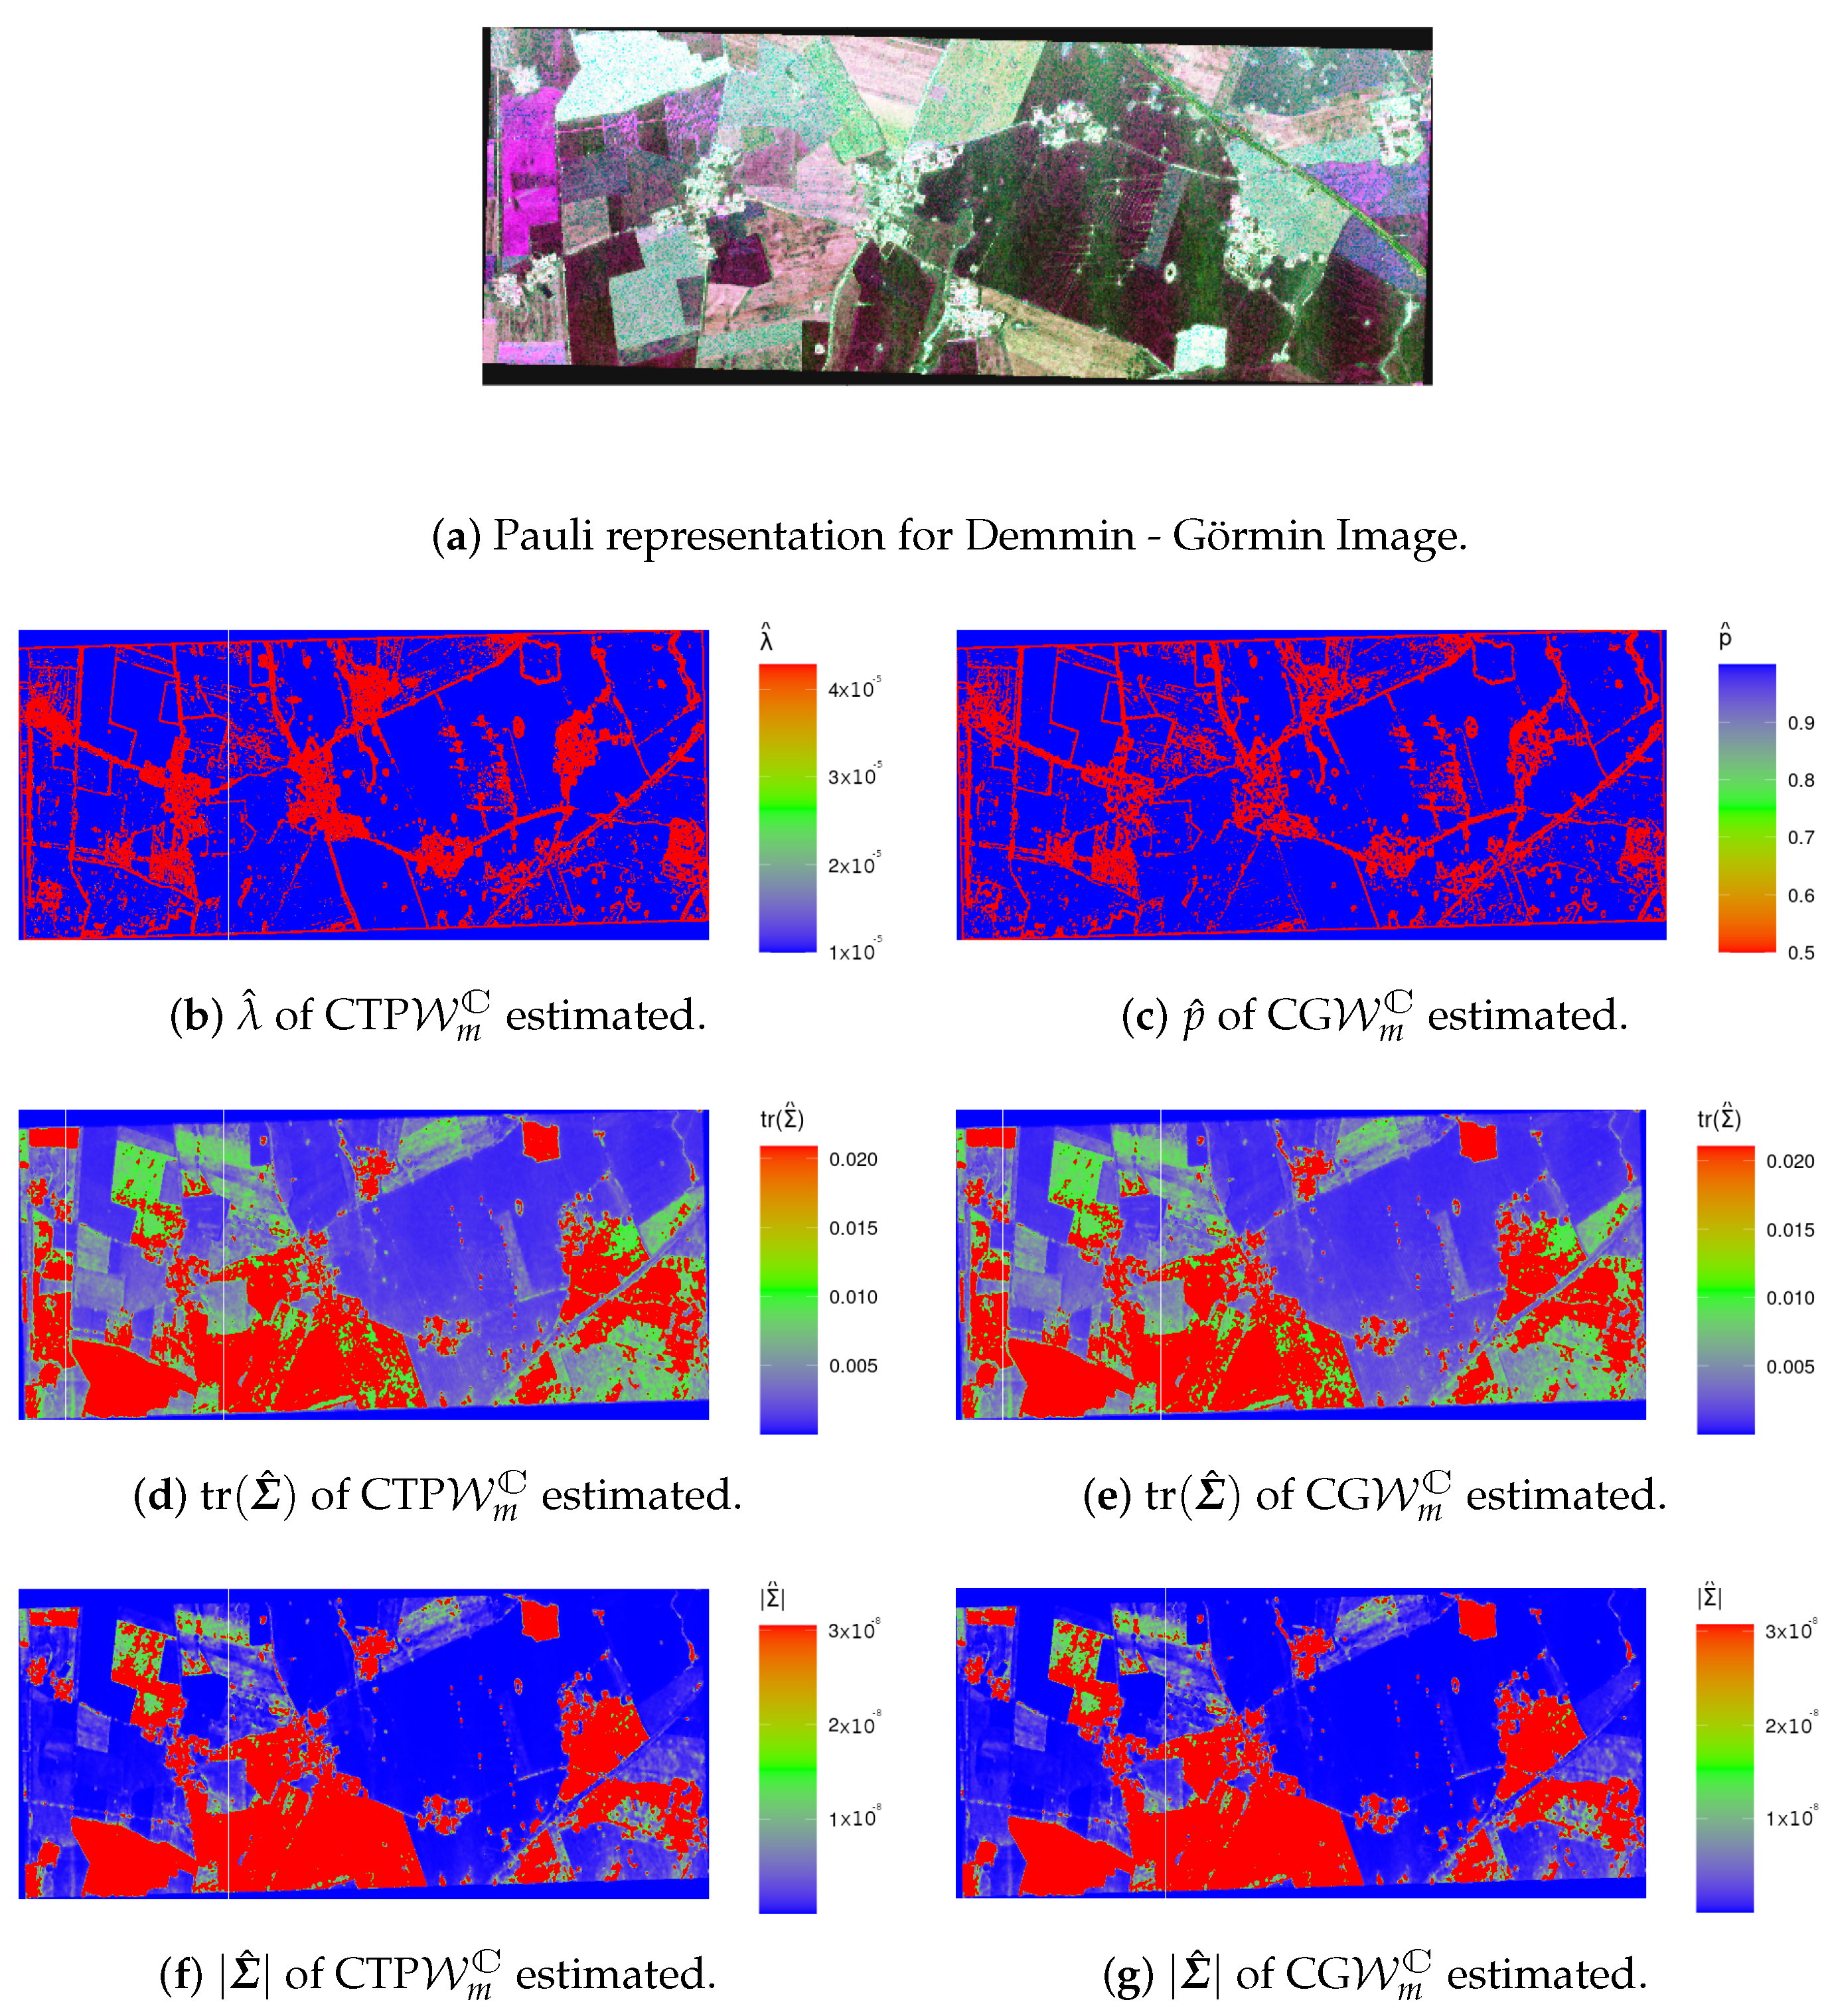
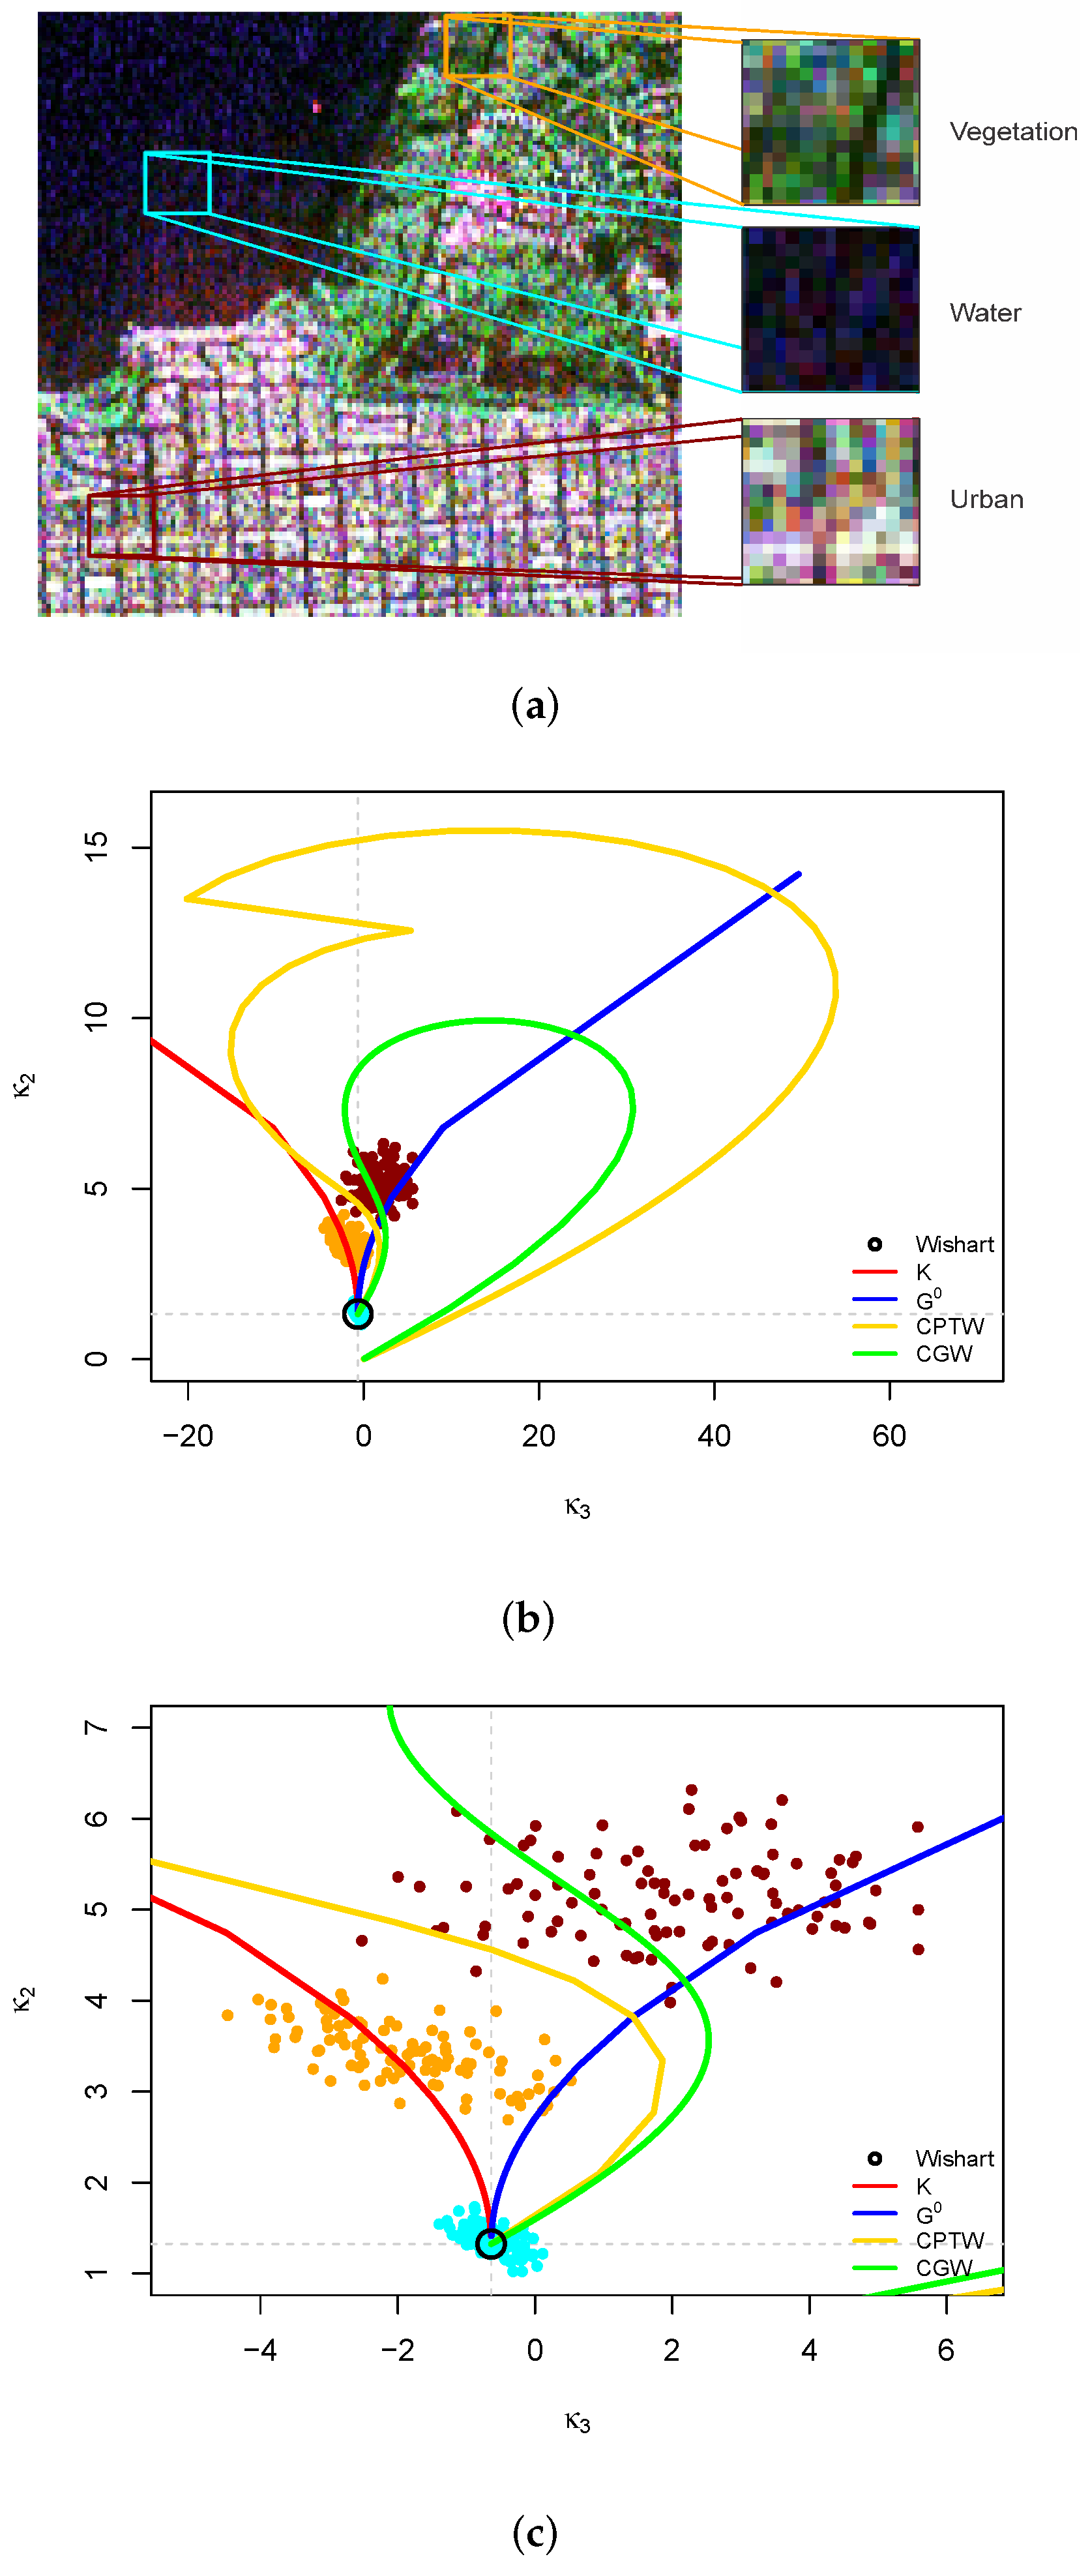
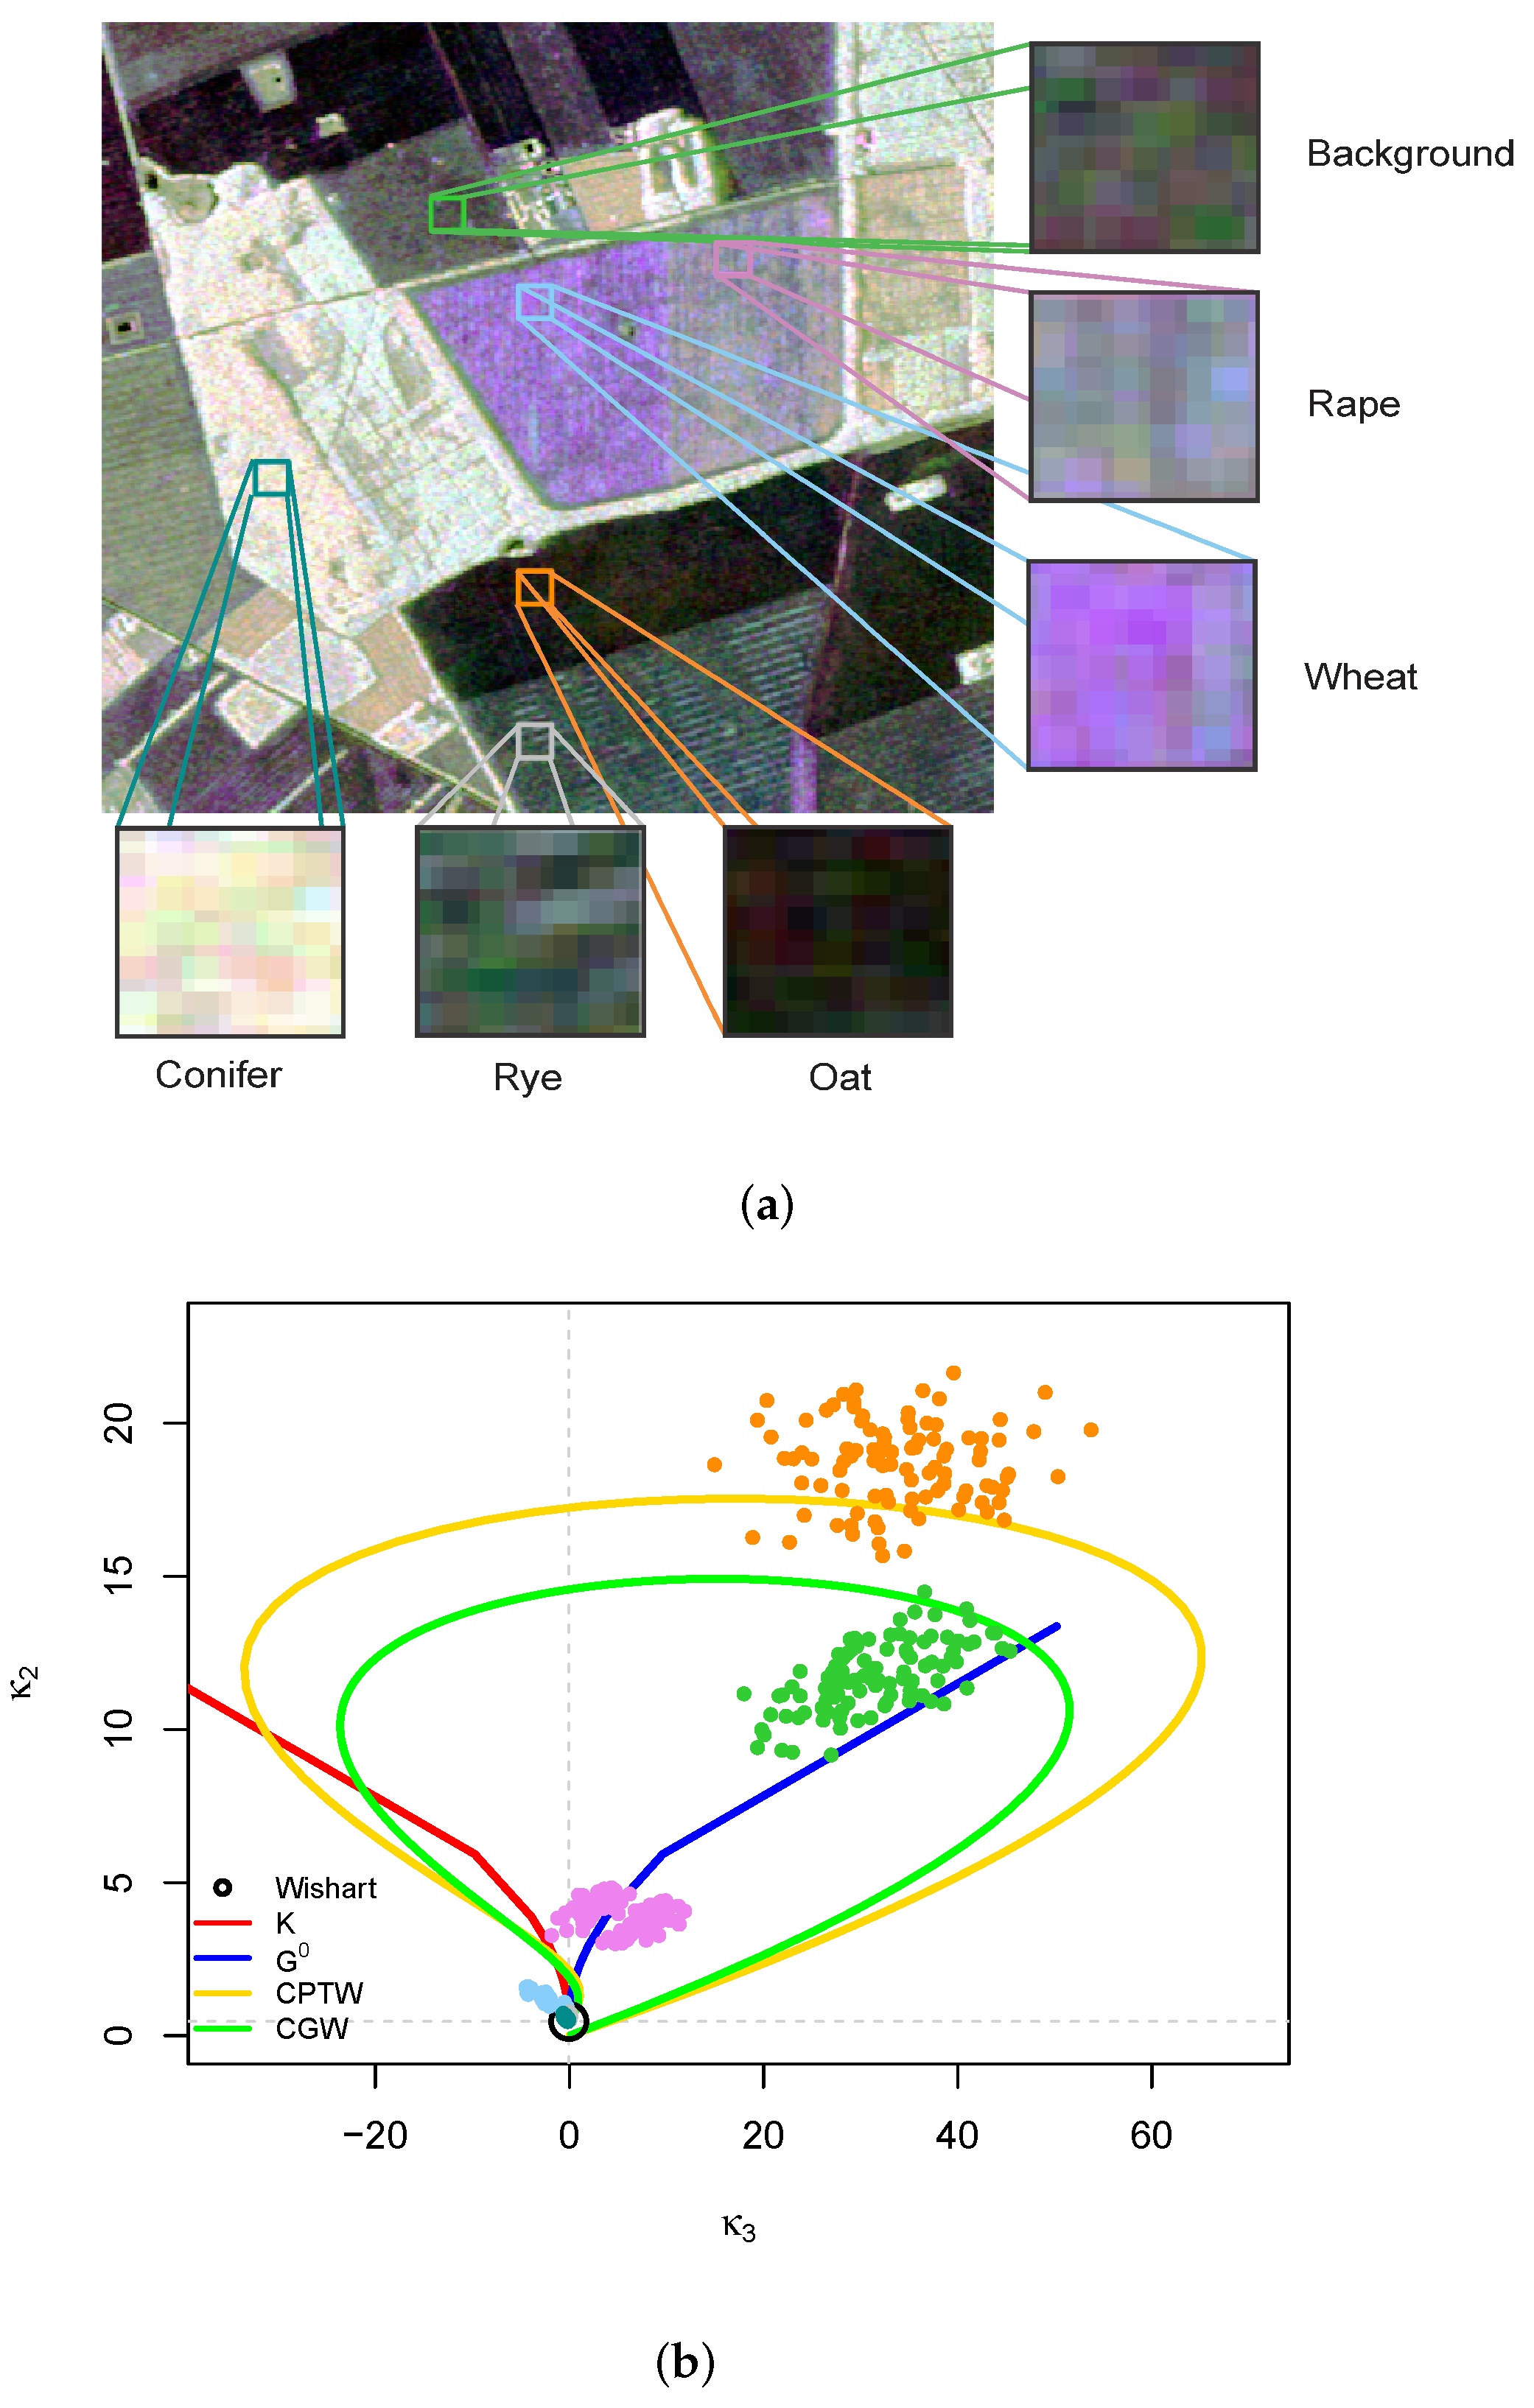
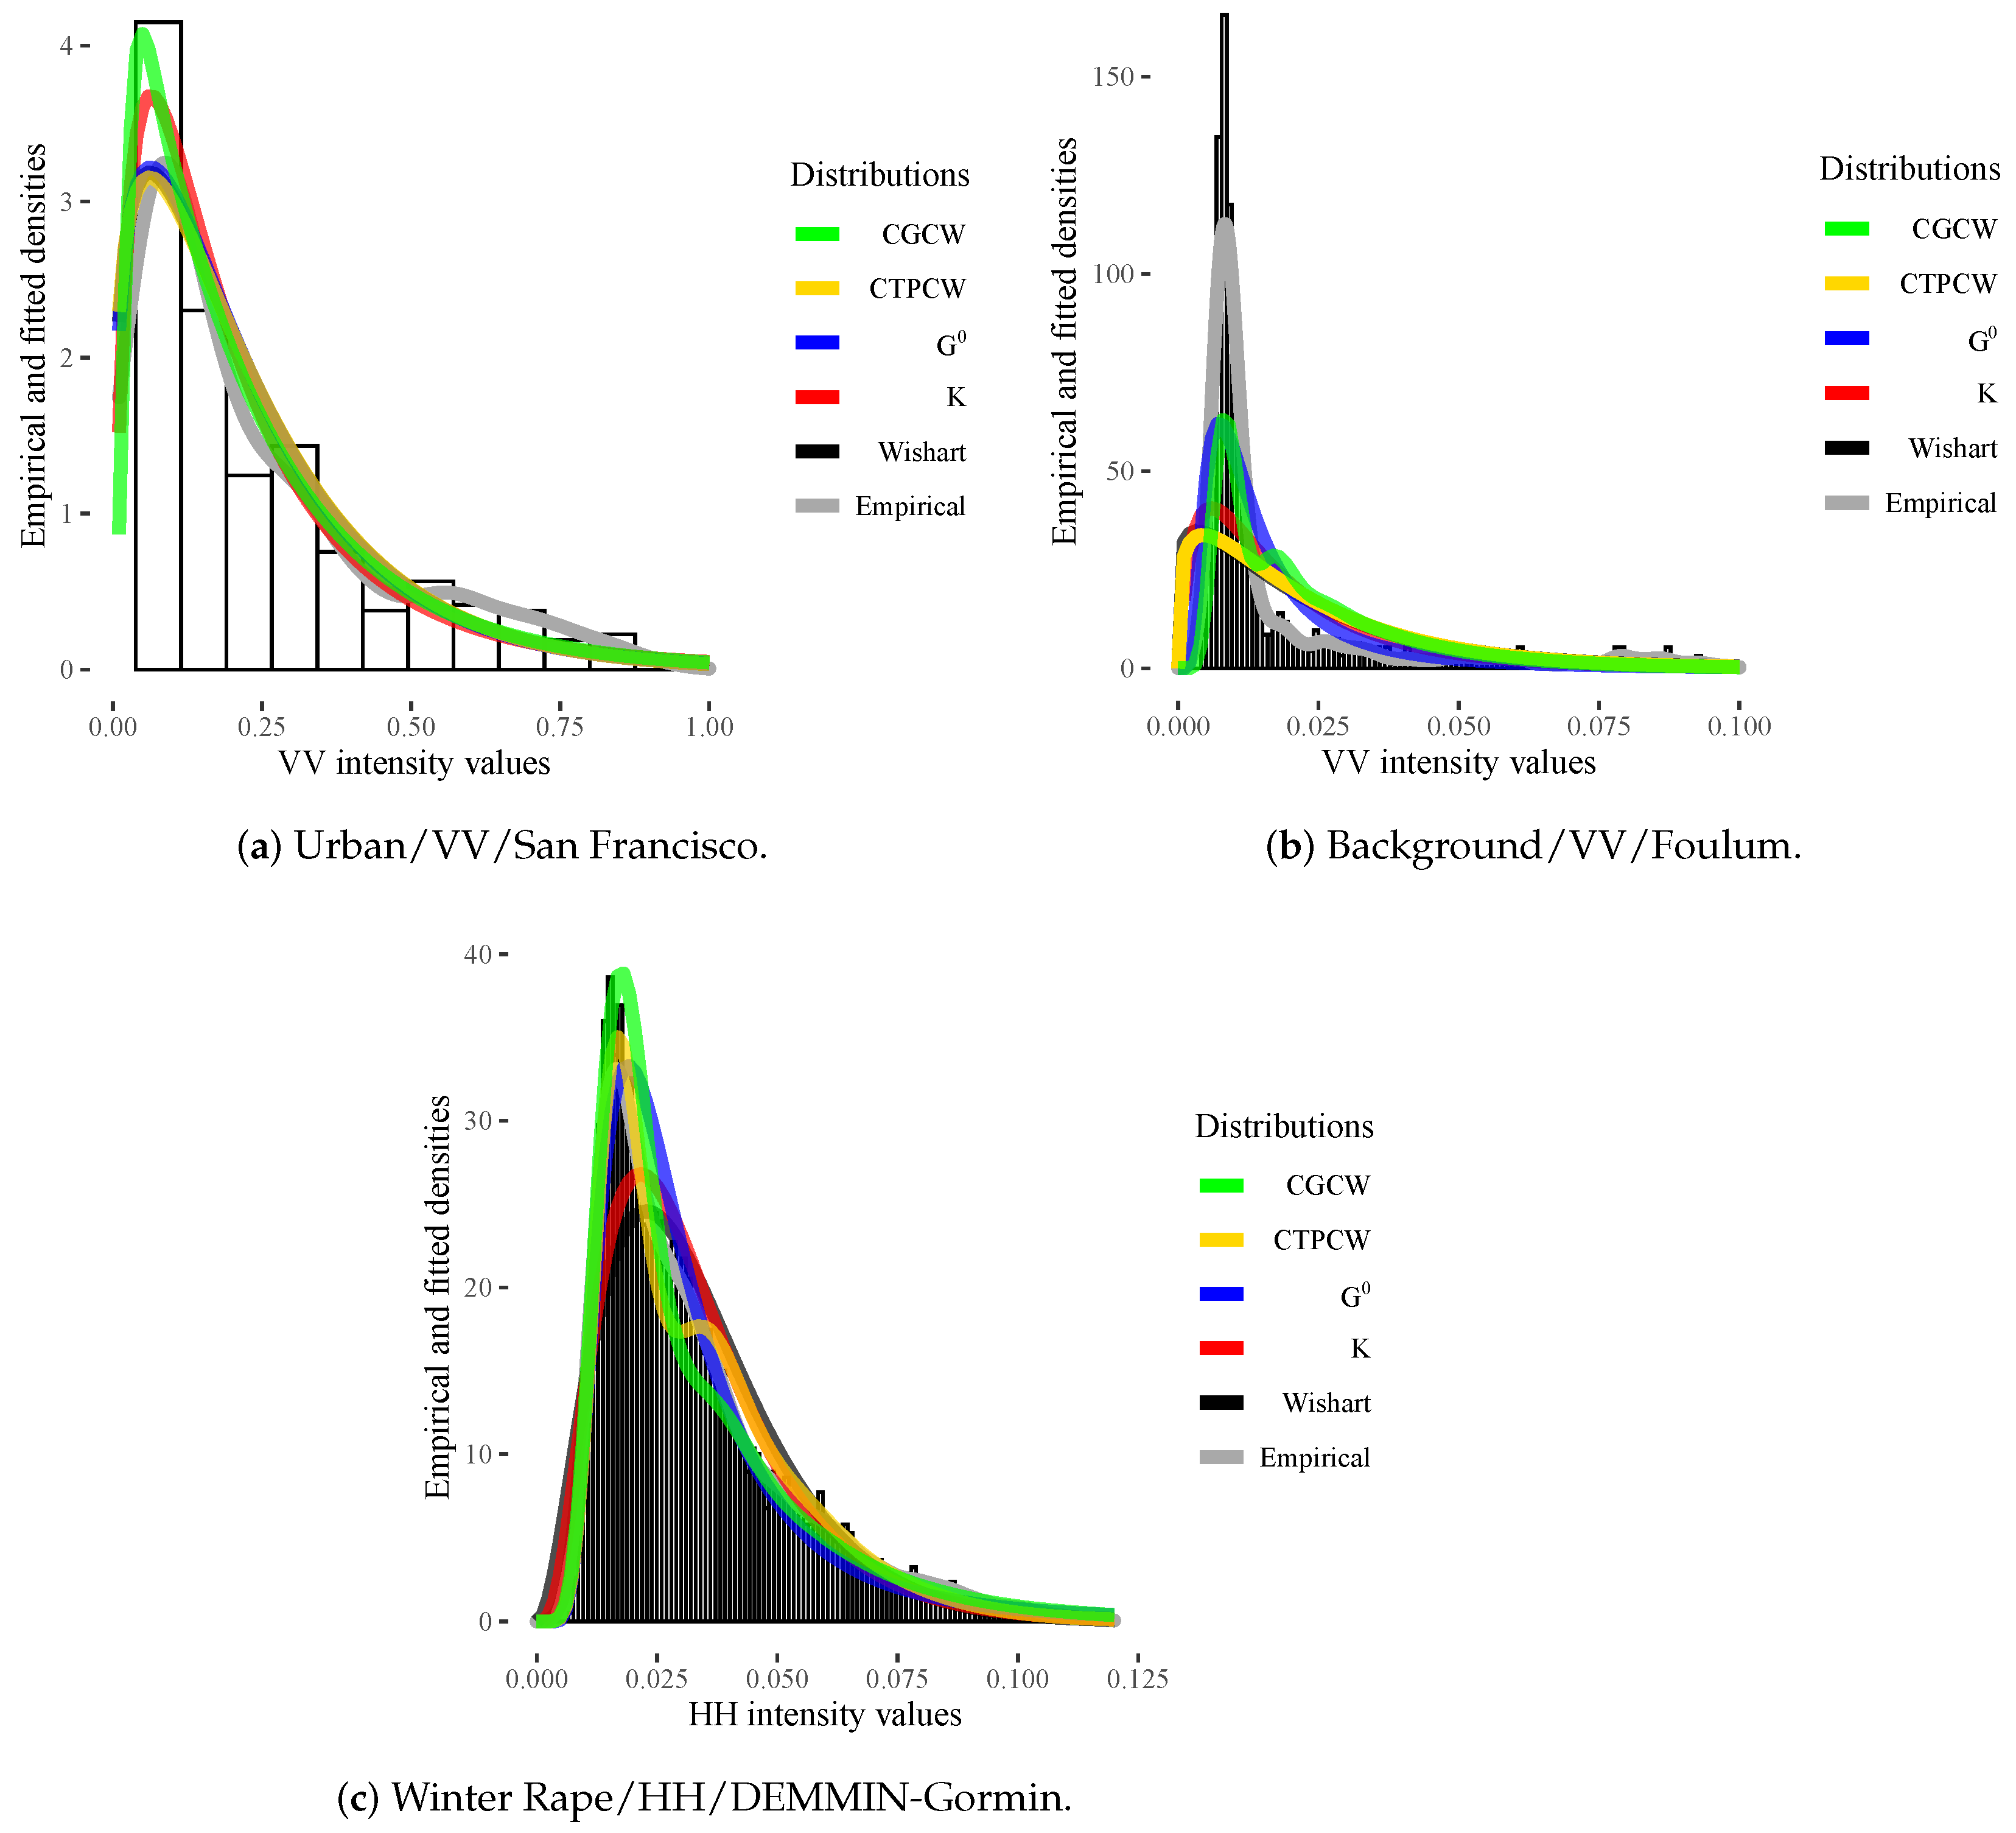
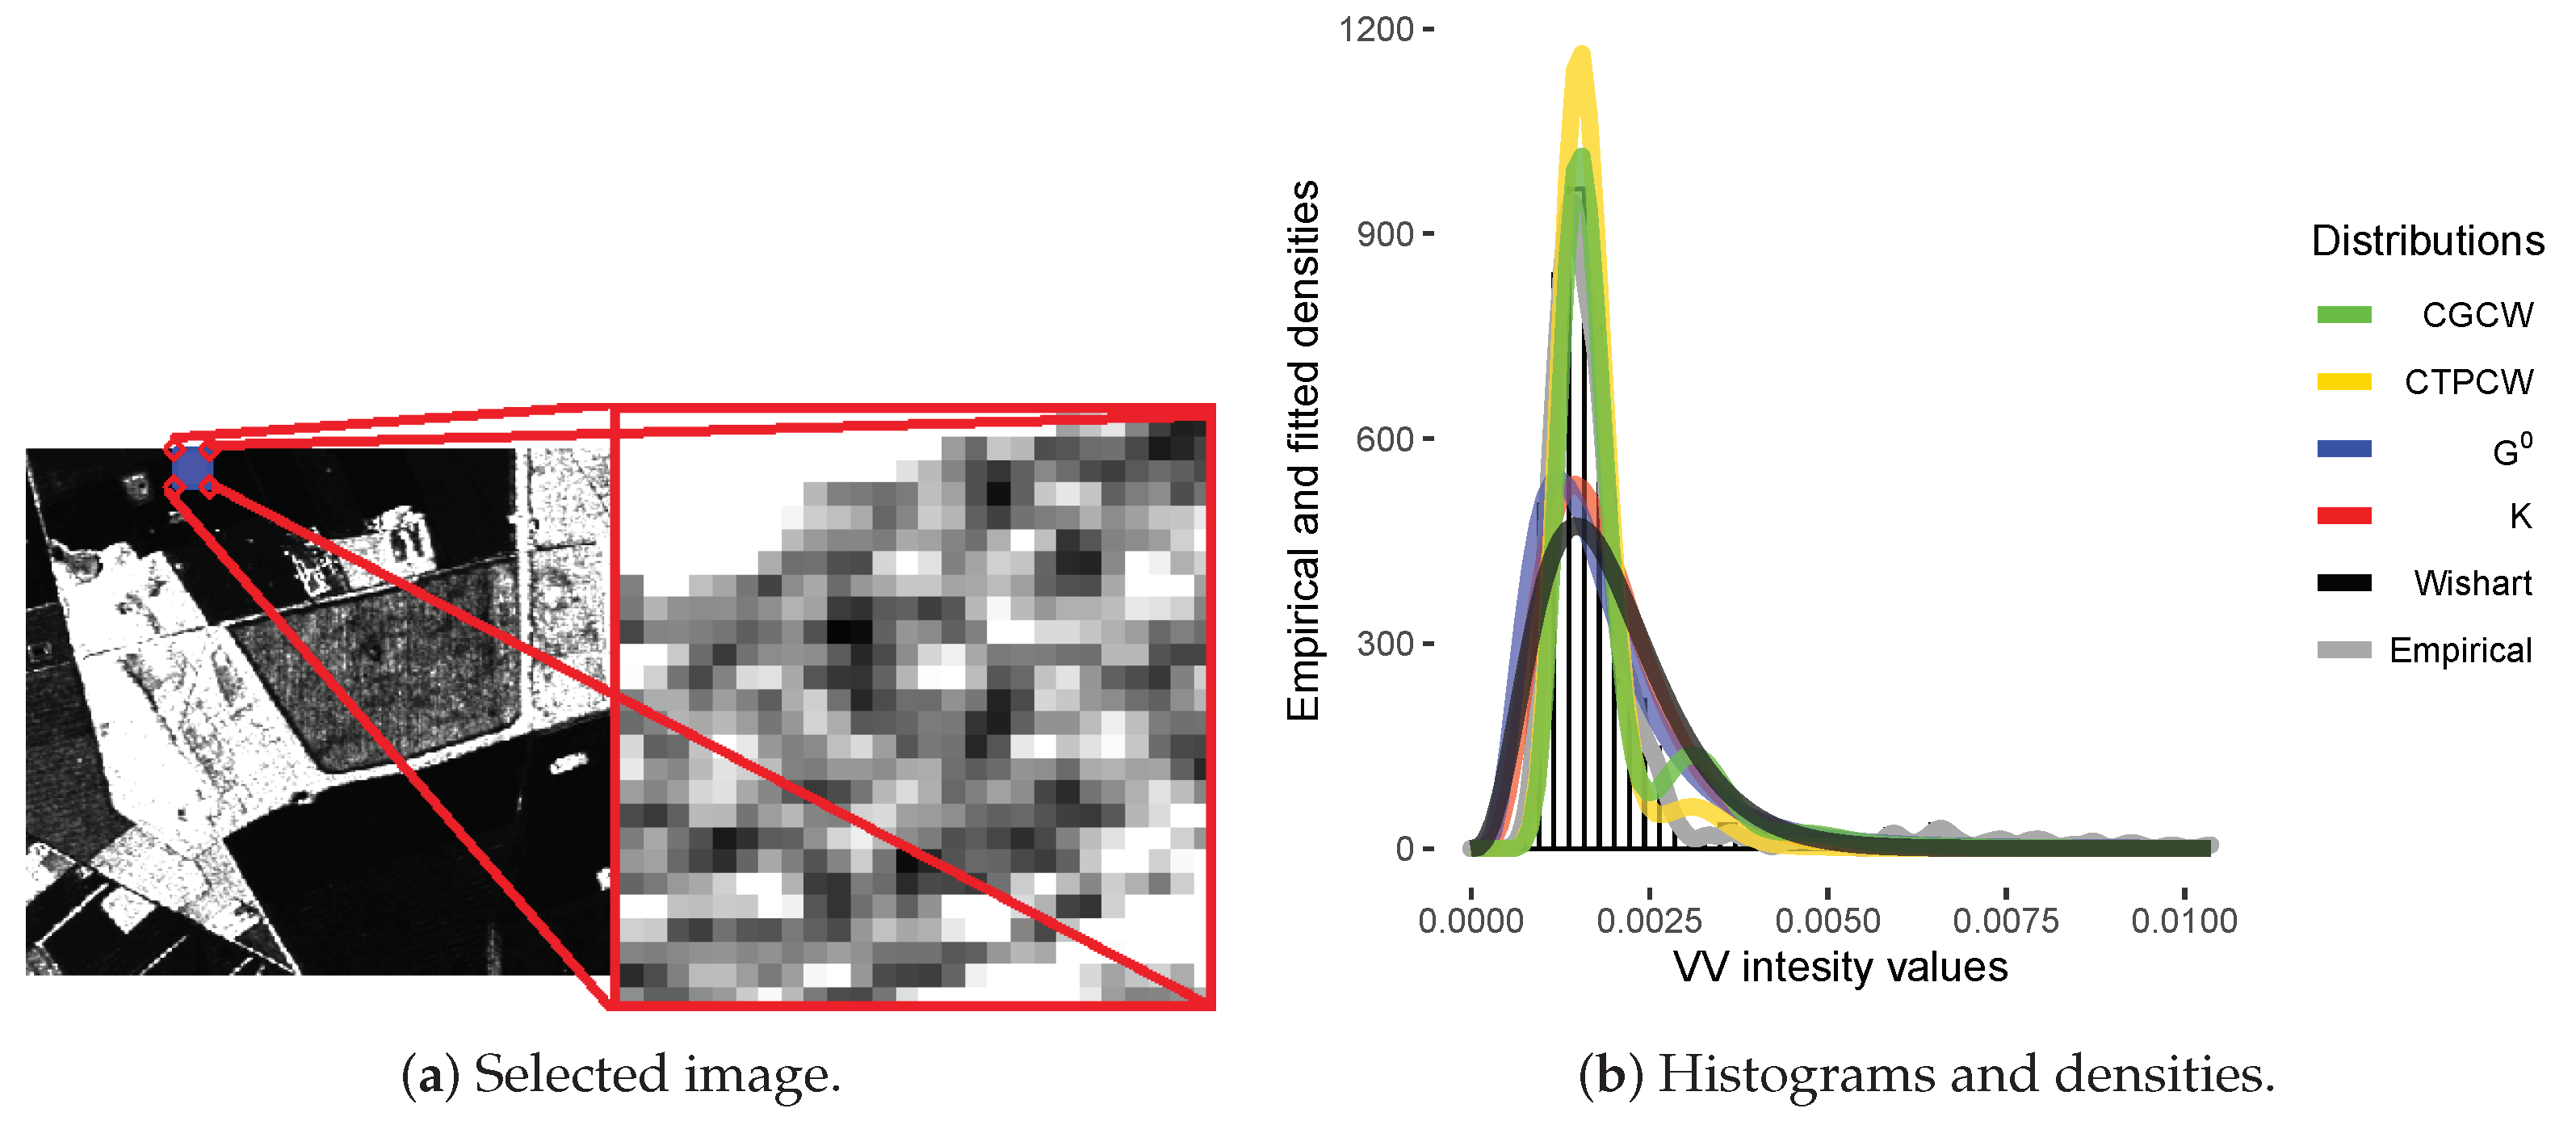
4.2. Analysis of Data from Actual Sensors
- The MoM estimates for in (3), , are given by:subjected to the constraint (condition that was verified for all used data).
5. Conclusions
Supplementary Materials
Author Contributions
Funding
Institutional Review Board Statement
Informed Consent Statement
Data Availability Statement
Acknowledgments
Conflicts of Interest
Abbreviations
| PolSAR | Polarimetric synthetic aperture radar |
| CTPCW | compound truncated Poisson complex Wishart |
| CGCW | d compound geometric complex Wishart |
| MLCs | Mellin-kind log-cumulants |
| SCM | sample covariance matrices |
| MM | multiplicative modeling |
| cf | characteristic function |
| MLEs | maximum likelihood estimators |
| EM | Expectation Maximisation |
| MoM | Moment Method |
| pmf | probability mass function |
| probability density function | |
| MKS | Mellin-kind statistic |
| MCGF | Mellin-kind cumulant-generating |
| AIRSAR | Airborne Synthetic Aperture Radar |
| EMISAR | SAR image system of the Electromagnetics Institute |
References
- Lee, J.S.; Grunes, M.R.; Kwok, R. Classification of Multi-Look Polarimetric SAR Imagery Based on Complex Wishart Distribution. Int. J. Remote Sens. 1994, 15, 2299–2311. [Google Scholar] [CrossRef]
- Liu, C.; Liao, W.; Li, H.; Fu, K.; Philips, W. Unsupervised Classification of Multilook Polarimetric SAR Data Using Spatially Variant Wishart Mixture Model with Double Constraints. IEEE Trans. Geosci. Remote Sens. 2018, 56, 5600–5613. [Google Scholar] [CrossRef]
- Bouhlel, N.; Méric, S. Unsupervised Segmentation of Multilook Polarimetric Synthetic Aperture Radar Images. IEEE Trans. Geosci. Remote Sens. 2019, 57, 6104–6118. [Google Scholar] [CrossRef]
- Torres, L.; Sant’Anna, S.J.S.; Freitas, C.C.; Frery, A.C. Speckle Reduction in Polarimetric SAR Imagery with Stochastic Distances and Nonlocal Means. Pattern Recognit. 2014, 47, 141–157. [Google Scholar] [CrossRef] [Green Version]
- Wang, Y.; Ainsworth, T.L.; Lee, J. Application of Mixture Regression for Improved Polarimetric SAR Speckle Filtering. IEEE Trans. Geosci. Remote Sens. 2017, 55, 453–467. [Google Scholar] [CrossRef]
- Nascimento, A.D.C.; Horta, M.M.; Frery, A.C.; Cintra, R.J. Comparing Edge Detection Methods based on Stochastic Entropies and Distances for PolSAR Imagery. IEEE J. Sel. Top. Appl. Earth Obs. Remote Sens. 2014, 7, 648–663. [Google Scholar] [CrossRef] [Green Version]
- Nascimento, A.D.C.; Frery, A.C.; Cintra, R.J. Detecting Changes in Fully Polarimetric SAR Imagery With Statistical Information Theory. IEEE Trans. Geosci. Remote Sens. 2019, 57, 1380–1392. [Google Scholar] [CrossRef] [Green Version]
- Bian, Y.; Mercer, B. Multilook polarimetric SAR data probability density function estimation using a generalized form of multivariate K-distribution. Remote Sens. Lett. 2014, 5, 682–691. [Google Scholar] [CrossRef]
- Nascimento, A.D.C.; Frery, A.C.; Cintra, R.J. Bias Correction and Modified Profile Likelihood Under the Wishart Complex Distribution. IEEE Trans. Geosci. Remote Sens. 2014, 52, 4932–4941. [Google Scholar] [CrossRef] [Green Version]
- Anfinsen, S.N.; Eltoft, T. Application of the Matrix-Variate Mellin Transform to Analysis of Polarimetric Radar Images. IEEE Trans. Geosci. Remote Sens. 2011, 49, 2281–2295. [Google Scholar] [CrossRef]
- Deng, X.; López-Martínez, C.; Chen, J.; Han, P. Statistical Modeling of Polarimetric SAR Data: A Survey and Challenges. Remote Sens. 2017, 9, 348. [Google Scholar] [CrossRef] [Green Version]
- Yue, D.X.; Xu, F.; Frery, A.C.; Jin, Y.Q. A Generalized Gaussian Coherent Scatterer Model for Correlated SAR Texture. IEEE Trans. Geosci. Remote Sens. 2020, 58, 2947–2964. [Google Scholar] [CrossRef]
- Nicolas, J.; Tupin, F. Gamma mixture modeled with “second kind statistics”: Application to SAR image processing. In Proceedings of the IEEE International Geoscience and Remote Sensing Symposium, Toronto, ON, Canada, 24–28 June 2002; Volume 4, pp. 2489–2491. [Google Scholar]
- Krylov, V.A.; Moser, G.; Serpico, S.B.; Zerubia, J. Supervised High-Resolution Dual-Polarization SAR Image Classification by Finite Mixtures and Copulas. IEEE J. Sel. Top. Signal Process. 2011, 5, 554–566. [Google Scholar] [CrossRef] [Green Version]
- Solarna, D.; Moser, G.; Serpico, S.B. A Markovian Approach to Unsupervised Change Detection with Multiresolution and Multimodality SAR Data. Remote Sens. 2018, 10, 1671. [Google Scholar] [CrossRef] [Green Version]
- Bombrun, L.; Beaulieu, J.M. Fisher Distribution for Texture Modeling of Polarimetric SAR Data. IEEE Geosci. Remote Sens. Lett. 2008, 5, 512–516. [Google Scholar] [CrossRef] [Green Version]
- Freitas, C.C.; Frery, A.C.; Correia, A.H. The Polarimetric G Distribution for SAR Data Analysis. Environmetrics 2005, 16, 13–31. [Google Scholar] [CrossRef]
- Lee, J.S.; Schuler, D.L.; Lang, R.H.; Ranson, K.J. K-distribution for multi-look processed polarimetric SAR imagery. In Proceedings of the International Geoscience and Remote Sensing Symposium (IGARSS’1994), Pasadena, CA, USA, 8–12 August 1994; Volume 4, pp. 2179–2181. [Google Scholar]
- Anfinsen, S.N.; Doulgeris, A.P.; Eltoft, T. Estimation of the Equivalent Number of Looks in Polarimetric Synthetic Aperture Radar Imagery. IEEE Trans. Geosci. Remote Sens. 2009, 47, 3795–3809. [Google Scholar] [CrossRef]
- Delignon, Y.; Pieczynski, W. Modeling Non-Rayleigh Speckle Distribution in SAR Images. IEEE Trans. Geosci. Remote Sens. 2002, 40, 1430–1435. [Google Scholar] [CrossRef] [Green Version]
- Yue, D.X.; Xu, F.; Frery, A.C.; Jin, Y.Q. SAR Image Statistical Modeling Part II: Spatial Correlation Models and Simulation. IEEE Geosci. Remote Sens. Mag. 2021, 9, 115–138. [Google Scholar] [CrossRef]
- Ulaby, F.T.; Elachi, C. Radar Polarimetriy for Geoscience Applications; Artech House: Norwood, MA, USA, 1990. [Google Scholar]
- Goodman, N.R. Statistical Analysis Based on a Certain Complex Gaussian Distribution (an Introduction). Ann. Math. Stat. 1963, 34, 152–177. [Google Scholar] [CrossRef]
- Hagedorn, M.; Smith, P.J.; Bones, P.J.; Millane, R.P.; Pairman, D. A Trivariate Chi-Squared Distribution Derived from the Complex Wishart Distribution. J. Multivar. Anal. 2006, 97, 655–674. [Google Scholar] [CrossRef] [Green Version]
- Moore, P. The estimation of the Poisson parameter from a truncated distribution. Biometrika 1952, 39, 247–251. [Google Scholar] [CrossRef]
- Plackett, R. The truncated Poisson distribution. Biometrics 1953, 9, 485–488. [Google Scholar] [CrossRef]
- Best, D.; Rayner, J. Tests of fit for the geometric distribution. Commun. Stat.-Simul. Comput. 2003, 32, 1065–1078. [Google Scholar] [CrossRef]
- Dallas, A. A characterization of the geometric distribution. J. Appl. Probab. 1974, 11, 609–611. [Google Scholar] [CrossRef]
- Yueh, S.H.; Kong, J.A.; Jao, J.K.; Shin, R.T.; Novak, L.M. K-Distribution and Polarimetric Terrain Radar Clutter. J. Electromagn. Waves Appl. 1989, 3, 747–768. [Google Scholar] [CrossRef]
- Maiwald, D.; Kraus, D. Calculation of Moments of Complex Wishart and Complex Inverse Wishart Distributed Matrices. IEE Proc.-Radar, Sonar Navig. 2000, 147, 162–168. [Google Scholar] [CrossRef]
- Fine, T.L. Probability and Probabilistic Reasoning for Electrical Engineering; Prentice Hall: Dallas, TX, USA, 2006. [Google Scholar]
- Nascimento, A.D.; Rêgo, L.C.; Nascimento, R.L. Compound truncated Poisson normal distribution: Mathematical properties and Moment estimation. Inverse Probl. Imaging 2019, 13, 787–803. [Google Scholar] [CrossRef] [Green Version]
- Dempster, A.P.; Laird, N.M.; Rubin, D.B. Maximum likelihood from incomplete data via the EM algorithm. J. R. Stat. Soc. Ser. B (Methodol.) 1977, 39, 1–22. [Google Scholar]
- Anfinsen, S.N.; Doulgeris, A.P.; Eltoft, T. Goodness-of-Fit Tests for Multilook Polarimetric Radar Data Based on the Mellin Transform. IEEE Trans. Geosci. Remote Sens. 2011, 49, 2764–2781. [Google Scholar] [CrossRef]
- Whelen, T.; Siqueira, P. Time series analysis of L-Band SAR for agricultural landcover classification. In Proceedings of the 2017 IEEE International Geoscience and Remote Sensing Symposium (IGARSS), Fort Worth, TX, USA, 23–28 July 2017; pp. 5342–5345. [Google Scholar]
- Gao, W.; Yang, J.; Ma, W. Land Cover Classification for Polarimetric SAR Images Based on Mixture Models. Remote Sens. 2014, 6, 3770–3790. [Google Scholar] [CrossRef]
- Abraham, D.A.; Lyons, A.P. Reliable Methods for Estimating the K-Distribution Shape Parameter. IEEE J. Ocean. Eng. 2010, 35, 288–302. [Google Scholar] [CrossRef]
- Frery, A.C.; Muller, H.J.; Yanasse, C.C.F.; Sant’Anna, S.J.S. A Model for Extremely Heterogeneous Clutter. IEEE Trans. Geosci. Remote Sens. 1997, 35, 648–659. [Google Scholar] [CrossRef]
- Freedman, D.; Diaconis, P. On the histogram as a density estimator: L2 theory. Z. Für Wahrscheinlichkeitstheorie Und Verwandte Geb. 1981, 57, 453–476. [Google Scholar] [CrossRef]
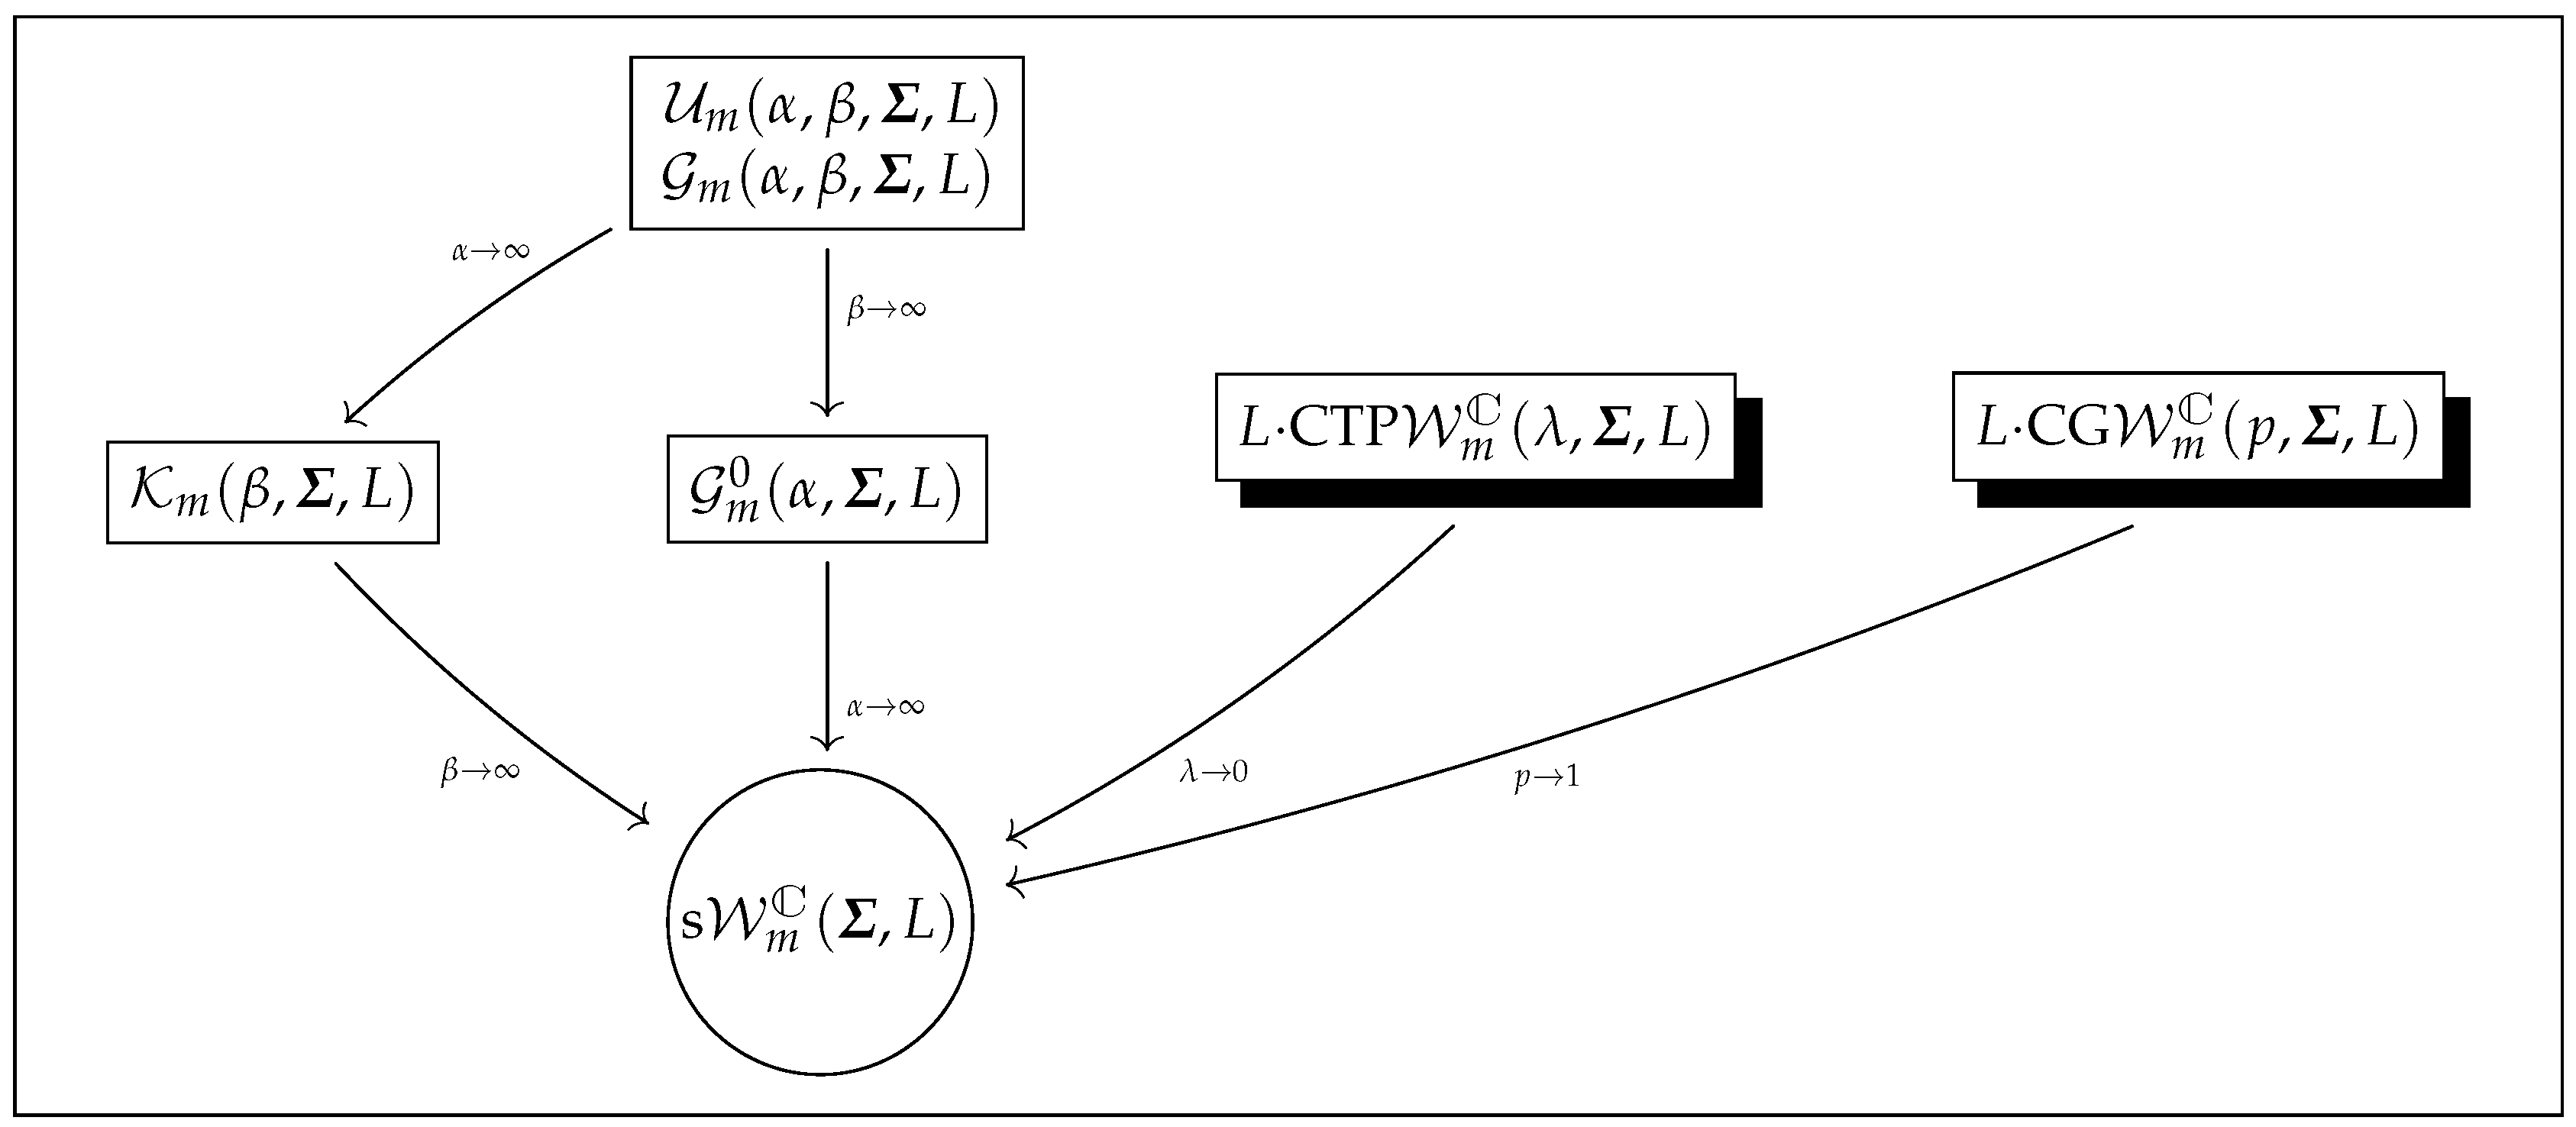



| SCM (Z) | Terrain (X) × Speckle (Y) | Reference |
|---|---|---|
| Four-parameter models | ||
| × | Bombrun and Beaulieu [16] | |
| × | Freitas et al. [17] | |
| Three-parameter models | ||
| × | Freitas et al. [17] | |
| × | Lee et al. [18] | |
| beta× | Deng et al. [11] | |
| × | Deng et al. [11] | |
| Two-parameter (baseline) models | ||
| × | Anfinsen et al. [19] | |
| n | tr() | ||
|---|---|---|---|
| 10 | |||
| () | () | () | |
| 30 | |||
| () | () | () | |
| 100 | |||
| () | () | () | |
| 1000 | |||
| () | () | () | |
| 10 | |||
| () | () | () | |
| 30 | |||
| () | () | () | |
| 100 | |||
| () | () | () | |
| 1000 | |||
| () | () | () | |
| 10 | |||
| () | () | () | |
| 30 | |||
| () | () | () | |
| 100 | |||
| () | () | () | |
| 1000 | |||
| () | () | () | |
| Model | k | ||||
|---|---|---|---|---|---|
| 2.39 | • | • | • | ||
| A1 | CTP | 2.39 | 1.00 | • | 4 |
| CG | 1.94 | • | 0.93 | 4 | |
| 5.38 | • | • | • | ||
| A2 | CTP | 5.38 | 9.73 | • | 6 |
| CG | 3.81 | • | 0.89 | 9 | |
| 1.90 | • | • | • | ||
| A3 | CTP | 1.37 | 0.22 | • | 5 |
| CG | 1.19 | • | 0.86 | 5 | |
| 1.18 | • | • | • | ||
| full image | CTP | 8.00 | 0.26 | • | 6 |
| CG | 7.29 | • | 0.85 | 6 |
| Region | Values | KS Statistics (p-Value) | ||||||||
|---|---|---|---|---|---|---|---|---|---|---|
| CTPCW | CGCW | CTPCW | CGCW | |||||||
| Ocean HH | −3336.182 | −3353.678 | −3350.913 | −3349.626 | −3349.205 | 0.0463 (0.3352) | 0.0436 (0.4064) | 0.0339 (0.7228) | 0.0354 (0.6736) | 0.0339 (0.7257) |
| Ocean HV | −5370.004 | −5367.173 | −5370.251 | −5371.358 | −5371.422 | 0.0341 (0.7195) | 0.0361 (0.6481) | 0.0233 (0.9774) | 0.0213 (0.9914) | 0.0211 (0.9924) |
| Ocean VV | −2449.256 | −2460.579 | −2459.775 | −2457.083 | −2456.303 | 0.0623 (0.0788) | 0.0447 (0.3767) | 0.0468 (0.3201) | 0.0499 (0.2506) | 0.0505 (0.2385) |
| Forest HH | −778.383 | −1678.613 | −1756.631 | −1123.571 | −1644.802 | 0.2953 (0.0000) | 0.0842 (0.0004) | 0.02656 (0.7909) | 0.0924 (0.0000) | 0.0791 (0.0011) |
| Forest HV | −1920.739 | −2657.491 | −2704.299 | −1987.513 | −2616.529 | 0.2420 (0.0000) | 0.0424 (0.2303) | 0.0318 (0.5763) | 0.0769 (0.0016) | 0.0221 (0.9319) |
| Forest VV | −780.561 | −1702.588 | −1757.682 | −1135.981 | −1674.072 | 0.2862 (0.0000) | 0.0717 (0.0041) | 0.0241 (0.8753) | 0.0878 (0.0002) | 0.0644 (0.0137) |
| Urban HH | 1109.161 | −61.096 | −150.191 | −613.3867 | −604.9043 | 0.4206 (0.0000) | 0.0996 (0.0013) | 0.0294 (0.9063) | 0.0622 (0.2362) | 0.0702 (0.1313) |
| Urban HV | −396.151 | −1215.056 | −1257.915 | −1371.682 | −1369.557 | 0.3222 (0.0000) | 0.0728 (0.0405) | 0.0371 (0.6894) | 0.0898 (0.0232) | 0.0918 (0.0189) |
| Urban VV | 549.423 | −178.221 | −191.749 | −587.054 | −563.3056 | 0.3283 (0.000) | 0.0641 (0.0976) | 0.0555 (0.2057) | 0.0572 (0.3256) | 0.0767 (0.0775) |
| Region | Values | KS Statistics (p-Value) | ||||||||
|---|---|---|---|---|---|---|---|---|---|---|
| CPTCW | CGCW | CTPCW | CGCW | |||||||
| Back. HH | 13,644.297 | −5662.811 | −6727.839 | 37,551.191 | 31,703.135 | 0.7328 (0.0000) | 0.3375 (0.0000) | 0.2438 (0.0000) | 0.2567 (0.0000) | 0.2536 (0.0000) |
| Back. HV | 15,795.002 | −8111.433 | −9317.474 | 31,848.566 | 19,651.018 | 0.7509 (0.0000) | 0.3682 (0.0000) | 0.2684 (0.0000) | 0.2541 (0.0000) | 0.2701 (0.0000) |
| Back. VV | −1086.881 | −6128.267 | −6639.634 | −3668.218 | −6014.533 | 0.5713 (0) | 0.2425 (0.0000) | 0.1813 (0.0000) | 0.1758 (0.0000) | 0.1557 (0.0000) |
| Rape HH | −15,538.403 | −16,372.233 | −16,398.015 | −16,324.445 | −16,311.755 | 0.1189 (0.0000) | 0.0178 (0.2733) | 0.0134 (0.6230) | 0.0362 (0.0005) | 0.0391 (0.0001) |
| Rape HV | −28,160.355 | −28,834.923 | −28,383.304 | −28,872.724 | −28,849.118 | 0.1202 (0.0000) | 0.0403 (0.0000) | 0.1311 (0.0000) | 0.0326 (0.0026) | 0.0365 (0.0000) |
| Rape VV | −15,421.004 | −15,404.677 | −15,462.128 | −15,490.977 | −15,493.038 | 0.0369 (0.0004) | 0.0409 (0.0000) | 0.0292 (0.0099) | 0.0217 (0.1052) | 0.0210 (0.1276) |
| Wheat HH | −13,267.144 | −13,224.354 | −13,226.610 | −13,323.948 | −13,324.126 | 0.0299 (0.0222) | 0.0390 (0.0007) | 0.0475 (0.0000) | 0.0152 (0.6067) | 0.0153 (0.5949) |
| Wheat HV | −24,981.209 | −26,733.414 | −27,045.345 | −26,693.55 | −26,979.18 | 0.1790 (0.0000) | 0.1032 (0.0000) | 0.1254 (0.0000) | 0.0272 (0.0480) | 0.0291 (0.0279) |
| Wheat VV | −9490.612 | −9360.921 | −9420.177 | −9383.994 | −9490.997 | 0.0165 (0.4944) | 0.0577 (0.0000) | 0.0481 (0.0000) | 0.0358 (0.0031) | 0.0151 (0.6164) |
| Oat HH | −35,266.728 | −34,939.282 | −35,116.783 | −35,324.396 | −35,154.303 | 0.1344 (0.0000) | 0.1584 (0.0000) | 0.1441 (0.0000) | 0.1201 (0.0000) | 0.1621 (0.0000) |
| Oat HV | −43,082.474 | −42,739.723 | −42,570.853 | −42,910.284 | −43,067.083 | 0.1138 (0.0000) | 0.1493 (0.0000) | 0.1873 (0.0000) | 0.1048 (0.0000) | 0.1209 (0.0000) |
| Oat VV | −32,614.112 | −32,726.2166 | −32,807.781 | −33,303.94 | −33,335.41 | 0.1097 (0.0000) | 0.1089 (0.0000) | 0.0944 (0.0000) | 0.0599 (0.0000) | 0.0593 (0.0000) |
| Rye HH | −28,348.174 | −28,174.571 | −27,917.223 | −28,602.34 | −28,604.95 | 0.0871 (0) | 0.1158 (0) | 0.1631 (0) | 0.0647 (0.0000) | 0.0648 (0.0000) |
| Rye HV | −32,959.766 | −32,823.334 | −32,481.953 | −33,148.64 | −33,149.46 | 0.0717 (0.0000) | 0.0961 (0.0000) | 0.1505 (0.0000) | 0.0469 (0.0000) | 0.0468 (0.0000) |
| Rye VV | −21,953.243 | −21,918.265 | −21,726.364 | −22,325.60 | −22,339.67 | 0.0946 (0.0000) | 0.0988 (0.0000) | 0.1544 (0.0000) | 0.0622 (0.0000) | 0.0597 (0.0000) |
| Conifer HH | −3104.633 | −2979.998 | −2998.099 | −3075.352 | −3143.367 | 0.0435 (0.0049) | 0.0805 (0.0000) | 0.0801 (0.0000) | 0.0338 (0.0535) | 0.0158 (0.8235) |
| Conifer HV | −6112.789 | −5910.137 | −5966.941 | −6121.835 | −6206.274 | 0.0731 (0.0000) | 0.1054 (0.0000) | 0.1080 (0.0000) | 0.0586 (0.0000) | 0.0585 (0.0000) |
| Conifer VV | −6290.114 | −6074.269 | −5997.672 | −6302.553 | −6394.536 | 0.0809 (0.0000) | 0.1133 (0.0000) | 0.1411 (0.0000) | 0.0692 (0.0000) | 0.0654 (0.0000) |
| Region | Values | KS Statistics (p-Value) | ||||||||
|---|---|---|---|---|---|---|---|---|---|---|
| CTPCW | CGCW | CTPCW | CGCW | |||||||
| Maize HH | −78,397.154 | −76,497.874 | −76,358.346 | −77,111.508 | −78,295.695 | 0.0878 (0.0000) | 0.1223 (0.0000) | 0.1431 (0.0000) | 0.1002 (0.0000) | 0.1032 (0.0000) |
| Maize HV | −94,634.188 | −93,234.909 | −93,275.192 | −95,332.257 | −95,387.211 | 0.0891 (0.0000) | 0.1264 (0.0000) | 0.1459 (0.0000) | 0.0972 (0.0000) | 0.0972 (0.0000) |
| Maize VV | −85,862.424 | −85,117.185 | −84,061.901 | −86,853.034 | −86,969.596 | 0.0688 (0.0000) | 0.1083 (0.0000) | 0.1523 (0.0000) | 0.0871 (0.0000) | 0.0865 (0.0000) |
| Rape HH | −47,307.555 | −60,318.864 | −60,769.119 | −61,066.01 | −60,758.62 | 0.2434 (0.0000) | 0.0579 (0.0000) | 0.0414 (0.0000) | 0.0170 (0.0029) | 0.0601 (0.0000) |
| Rape HV | −79,878.920 | −99,756.999 | −100,348.078 | −99,320.55 | −100,274 | 0.2661 (0.0000) | 0.0471 (0.0000) | 0.0216 (0.0000) | 0.0338 (0.0000) | 0.0256 (0.0000) |
| Rape VV | −79,273.791 | −82,175.302 | −81,683.624 | −82,827.037 | −82,867.0421 | 0.1199 (0.0000) | 0.0449 (0.0000) | 0.0884 (0.0000) | 0.0171 (0.0027) | 0.0222 (0.0000) |
| Wheat HH | −97,953.769 | −102,484.074 | −104,142.925 | −101,075.289 | −101,922.446 | 0.1055 (0.0000) | 0.0981 (0.0000) | 0.0763 (0.0000) | 0.0142 (0.0358) | 0.0142 (0.0359) |
| Wheat HV | −106,542.769 | −125,850.838 | −129,465.447 | −122,424.1 | −124,596.9 | 0.2177 (0.0000) | 0.1262 (0.0000) | 0.0938 (0.0000) | 0.0370 (0.000) | 0.0367 (0.0000) |
| Wheat VV | −100,755.443 | −101,241.792 | −100,901.263 | −97,871.733 | −101,055.643 | 0.0732 (0.0000) | 0.0954 (0.0000) | 0.1438 (0.0000) | 0.0794 (0.0000) | 0.0681 (0.0000) |
| Beet HH | −78,449.372 | −76,431.501 | −75,912.814 | −77,602.605 | −78,078.731 | 0.1107 (0.0000) | 0.1455 (0.0000) | 0.1651 (0.0000) | 0.1253 (0.0000) | 0.1294 (0.0000) |
| Beet HV | −98,717.807 | −97,296.974 | −96,563.392 | −97,709.887 | −98,179.681 | 0.1638 (0.0000) | 0.1806 (0.0000) | 0.2059 (0.0000) | 0.1784 (0.0000) | 0.1733 (0.0000) |
| Beet VV | −77,030.751 | −74,324.474 | −74,858.236 | −76,188.637 | −76,452.111 | 0.1601 (0.0000) | 0.1941 (0.0000) | 0.1901 (0.0000) | 0.1672 (0.0000) | 0.1821 (0.0000) |
| Barley HH | 78,156.057 | −40,689.082 | −44,221.803 | −1,270.399 | −33,982.76 | 0.5524 (0.0000) | 0.14509 (0.0000) | 0.0518 (0.0000) | 0.1587 (0.0000) | 0.0771 (0.0000) |
| Barley HV | 59,700.677 | −98,734.402 | −111,375.215 | 12,029.802 | −26,949.616 | 0.7236 (0.0000) | 0.2588 (0.0000) | 0.1231 (0.0000) | 0.1031 (0.0000) | 0.1043 (0.0000) |
| Barley VV | 86,618.097 | −37,226.084 | −42,060.558 | 2,1926.804 | −22,934.483 | 0.5717 (0.0000) | 0.1575 (0.0000) | 0.0521 (0.0000) | 0.1339 (0.0000) | 0.1078 (0.0000) |
Publisher’s Note: MDPI stays neutral with regard to jurisdictional claims in published maps and institutional affiliations. |
© 2022 by the authors. Licensee MDPI, Basel, Switzerland. This article is an open access article distributed under the terms and conditions of the Creative Commons Attribution (CC BY) license (https://creativecommons.org/licenses/by/4.0/).
Share and Cite
Ferreira, J.A.; Nascimento, A.D.C.; Frery, A.C. PolSAR Models with Multimodal Intensities. Remote Sens. 2022, 14, 5083. https://doi.org/10.3390/rs14205083
Ferreira JA, Nascimento ADC, Frery AC. PolSAR Models with Multimodal Intensities. Remote Sensing. 2022; 14(20):5083. https://doi.org/10.3390/rs14205083
Chicago/Turabian StyleFerreira, Jodavid A., Abraão D. C. Nascimento, and Alejandro C. Frery. 2022. "PolSAR Models with Multimodal Intensities" Remote Sensing 14, no. 20: 5083. https://doi.org/10.3390/rs14205083
APA StyleFerreira, J. A., Nascimento, A. D. C., & Frery, A. C. (2022). PolSAR Models with Multimodal Intensities. Remote Sensing, 14(20), 5083. https://doi.org/10.3390/rs14205083


