Article

Rice Crop Height Inversion from TanDEM-X PolInSAR Data Using the RVoG Model Combined with the Logistic Growth Equation

1
School of Geosciences and Info-Physics, Central South University, Changsha 410083, China
2
Institute for Computer Research (IUII), University of Alicante, E-03080 Alicante, Spain
3
School of Geography and Information Engineering, China University of Geosciences (Wuhan), Wuhan 430074, China
*
Author to whom correspondence should be addressed.
Remote Sens. 2022, 14(20), 5109; https://doi.org/10.3390/rs14205109
Submission received: 12 September 2022 / Revised: 6 October 2022 / Accepted: 10 October 2022 / Published: 13 October 2022

Abstract

:
The random volume over ground (RVoG) model has been widely used in the field of vegetation height retrieval based on polarimetric interferometric synthetic aperture radar (PolInSAR) data. However, to date, its application in a time-series framework has not been considered. In this study, the logistic growth equation was introduced into the PolInSAR method for the first time to assist in estimating crop height, and an improved inversion scheme for the corresponding RVoG model parameters combined with the logistic growth equation was proposed. This retrieval scheme was tested using a time series of single-pass HH-VV bistatic TanDEM-X data and reference data obtained over rice fields. The effectiveness of the time-series RVoG model based on the logistic growth equation and the convenience of using equation parameters to evaluate vegetation growth status were analyzed at three test plots. The results show that the improved method can effectively monitor the height variation of crops throughout the whole growth cycle and the rice height estimation achieved an accuracy better than when single dates were considered. This proved that the proposed method can reduce the dependence on interferometric sensitivity and can achieve the goal of monitoring the whole process of rice height evolution with only a few PolInSAR observations.

1. Introduction

Crops are important for the development of society and are closely related to the stability of human life. Crop height, as one of the vegetation biophysical parameters, is a critical indicator of growth, and is important for many applications, such as phenology tracking, crop health evaluation, and total yield prediction [1]. Remote sensing technology is able to monitor the land surface on a large scale and with a high spatial resolution and has been demonstrated to be a powerful tool to monitor crop growth. In particular, polarimetric interferometric synthetic aperture radar (PolInSAR) can penetrate into or through the crop layer and record the vertical structure of the crop, and thus has great potential for crop height monitoring [2,3,4].
To invert crop height from PolInSAR data, it is necessary to build the relationship between the crop height and the PolInSAR observations. The oriented volume over ground (OVoG) model, in which the attenuation of the microwave signal in the canopy changes with the wave polarization, considers the scattering process corresponding to crops with a preferred orientation. It has been proven that the assumption of the propagation of microwaves in the canopy is polarization-dependent in most practical crop scenarios [5,6,7,8,9] but the complexity of the solution process for the OVoG model increases the difficulty of its application [10]. The random volume over ground (RVoG) model, which has a simpler form, has been widely used to describe the scattering process of electromagnetic waves penetrating into vegetation media, which gives us the chance to invert vegetation height from complex interferometric coherence values [11].
However, due to the short height of crops (compared to forests), and the fact that the crops quickly evolve over time (showing clear changes in short periods of time), the PolInSAR data used to measure crop height require both a short temporal baseline and a long spatial baseline to provide sufficient sensitivity for crop height measurement. In the early tests of this technique, only laboratory data and airborne data could meet the above requirements, which are not conducive to complete a large-scale mapping of crop height, nor can they meet the long-term demand for accurate monitoring of crops [7,8,10]. It was not until the completion of the TanDEM-X Science Phase that a bistatic synthetic aperture radar (SAR) interferometer with an adjustable spatial baseline was introduced [12], allowing the inversion of crop height to be implemented using single-pass interferometric spaceborne data. During the Science Phase of the TanDEM-X mission, which spanned some months in 2015, the bistatic configuration with zero temporal baseline not only avoided the appearance of temporal decorrelation, but also employed spatial baselines of 2–3 km to provide the required sensitivity to measure height for short vegetation, especially for crops. Such spatial baselines produce heights of ambiguity of just a few meters; hence, they are adapted for short vegetation. By comparing the signal diversity of rice in the different polarization channels of X-band data, it has been found that the effect of a low vegetation canopy on wave attenuation in the vertical direction can be ignored to some extent [13], and the RVoG model can obtain a valid height estimation [14,15]. In view of the fact that the multiple scattering of crops cannot be ignored, it is necessary to derive polarization interferometric coherence formulas to distinguish monostatic and bistatic modes from a uniform volume ground model [16,17]. The complete RVoG expression, considering both surface scattering and dihedral scattering from the ground in the bistatic mode, has been applied to crop areas [18] and research on rice height retrieval has been carried out in Turkey, Spain, and other regions, providing a complete verification for the inversion of rice height from sowing to maturity using TanDEM-X science phase data [19]. Through the simulation of the system configurations and scene variables of crop and forest scenes, the estimation errors of the parameters have been analyzed and the applicable conditions for double-bounce scattering decorrelation have been further determined [20]. In order to improve the efficiency and the reliability of the results, multiple model fusion, trace coherence [21,22], and other methods have been proposed.
In all of the known PolInSAR inversion schemes, crop height is independently derived from single dates and the consideration of the correlation of crop growth variation in the temporal dimension is missing. In the RVoG model inversion with a single interferogram, the plant height is extracted by separating the topographic phase and the pure volume scattering phase. However, it is common to find limitations in the interferometric sensitivity for very short heights and it is difficult to distinguish the phase difference at the initial stage of rice growth [23]. As a result, in many cases, the results are not valid and the obtained heights are severely overestimated [19,22]. In this study, to solve for these deficiencies, we exploited the growth characteristics of the crop in the temporal domain, and we developed a time-series RVoG growth model based on multi-temporal data. This kind of time-series inversion method takes into account the correlation of SAR data in the temporal dimension in the process of crop height retrieval and corrects the problem of current PolInSAR-based methods, to a certain extent, through a theoretical growth equation. Here, we aimed to provide a new inversion framework that can be used to describe or even predict height changes for crop monitoring. HH-VV TanDEM-X dual-polarization data from Seville, Spain were used in this study, where the ground-truth data for the rice fields are adequate for use as a reference.
The rest of this article is organized as follows: Section 2 describes the test site and the available datasets. Section 3 describes the fundamentals of combining the RVoG model with the logistic growth equation. The proposed multi-temporal inversion scheme is introduced and the mathematical expression of the date selection index based on coherence is presented. In Section 4, the results are presented and analyzed using the ground-truth data. Finally, Section 5 explains the results and Section 6 concludes the article.

2. Materials

2.1. Test Site and Ground-Truth Data

The test site is close to the mouth of the Guadalquivir River and is located in Seville, the capital of Andalusia, Spain (see Figure 1). The rice fields cover an area of about 30 km × 30 km. In the monitored land parcels, a long-grain type of rice called Puntal is cultivated from May to October every year. Sowing is carried out by spreading seeds randomly by airplane. It is worth noting that local agricultural practices ensure that these areas are flooded during the whole growth cycle, and that the cultivation campaign lasts approximately 135–150 days.
Since 2009, the local association of rice farmers (Federacion de Arroceros de Sevilla) has collected detailed ground measurements from several plots every year, including rice height and phenological stage on a weekly basis, as well as total area (ha), sowing date, and harvest date [24]. All the measurements are provided at the parcel level, i.e., an average value of rice height represents the whole parcel. Crop height is taken as the distance from the water surface to the highest point of the plants. It is measured at four random locations within each field by using a measuring tape and the average value is recorded. From the four fields with ground measurements from 2015, we selected the three plots covered by all available SAR data. These three paddy fields are labelled as Minima, Calonge, and EIReboso (see Table 1). The specific locations are highlighted in Figure 1.

2.2. TanDEM-X Data and InSAR Processing

In this study, we used bistatic dual-polarization data obtained in 2015 during the Science Phase of the TanDEM-X mission [13]. They correspond to three time series acquired with different incidence angles. The details of the selected time series are summarized in Table 2. The observation interval covers most of the growth cycle of the monitored plots, from June to early September. Dual-polarization images with HH and VV channels are available in the standard co-registered single-look slant-range complex (CoSSC) product and, for each series, the acquisition interval is 11 days (except for some gaps in July for the data with a 30° incidence angle). The spatial resolution of these images is 6.6 m in azimuth and 1.17 m in slant range, whereas the pixel size is 2.18–2.45 m in azimuth and 0.91 m in slant range. Considering the correlation between the incidence angle and the height of ambiguity (HoA), due to the orbital configuration, each time series provides a different level of sensitivity to the vertical distribution of scatterers within the vegetation volume.
As the spatial baselines of the input data are large (i.e., 2–3 km), which leads to notable geometrical decorrelation derived from the changes in the wavenumber in the two images, range spectral filtering was applied to compensate for this decorrelation. The flat earth contribution was removed before forming the interferograms. Multi-looking was then performed using a 21 × 21 average filter when forming the PolInSAR covariance matrices.

3. Methodology

3.1. RVoG Model Combined with the Logistic Growth Equation

The core of the RVoG model combined with the logistic growth equation consists of describing the variation of rice height in the growth cycle by using a continuous function with a specific form, transforming the process of retrieving crop heights directly into a two-step procedure (by selecting all PolInSAR observations at different dates to fit growth parameters with RVoG), and then carrying out the estimation of rice height in any date.
In this section, the consistency between the characteristics of the logistic growth equation and the evolution process of rice plant height is described and the basic idea of bridging the growth equation and RVoG model is presented in the first part. In order to retrieve the rice height, a complete data processing and inversion strategy for modified RVoG is proposed. Figure 2 displays the implementation of height inversion, and Figure 3 shows the evolution of rice height and growth rate with time. The specific data processing is shown in Figure 4.

3.1.1. Logistic Growth Equation

The dynamic variation in crop plant height generally corresponds to an S-curve, i.e., the crop vegetation quickly grows in the vegetative phase and then the growth rate gradually declines. When the crop is mature, the vertical dimension of the plants tends to be static and the adult plant height fluctuates within a small range. A typical way to make a scientific and reasonable description of the vegetation growth trend in the temporal domain is to apply a theoretical growth equation [25]. As a model describing the variation of an organism or a population size with time, a theoretical growth equation can reflect the regularity of the growth [26], and is characterized by parameters with biological meaning that can theoretically predict the facts. Although several theoretical growth equations have been proposed and applied in phytology [27], the logistic growth equation was chosen in this study as a representative of the height time series for its universality and simple expression of the standard S-curve form. The vegetation growth law applies trend constraints to the rice growth, and the maximum height of the rice plants does not exceed H ¯ .
The theoretical growth equation for plant height considering actual conditions can be expressed as:
H ( t ) = H ¯ 1 + e - k 0 ( t - t 0 )
where H ¯ represents the maximum plant height that can be achieved by this kind of crop, k 0 represents the intrinsic growth rate, and t 0 indicates the time instant corresponding to the maximum growth rate. The growth rate v derived from the logistic equation is expressed as:
v = d H d t = k 0 H ( 1 H H ¯ )
The evolution of growth rate and height during the growth cycle are shown in Figure 3.

3.1.2. The Modified RVoG Model

As the most broadly applied model in the field of PolInSAR-based vegetation height inversion, the RVoG model considers a vegetated scene as composed of two layers. The lower part represents the ground surface that cannot be penetrated by microwaves, and the aboveground canopy is regarded as a volume composed of randomly oriented scattering particles. The electromagnetic waves interact with leaves when penetrating the canopy, which is dominated by volume scattering in this process. When the microwaves reach the ground, the signal responses are mainly composed of two contributions: direct scattering from the ground surface, and double-bounce scattering from the interactions between stalks and the ground. The effective scattering center depends on the ground-to-volume backscatter ratio and the attenuation effect of the canopy on the microwaves. On the basis of this model, the complete expression of the complex interferometric coherence for a PolInSAR bistatic system [16] is as follows:
γ ˜ ( κ Z , ω ) = e i ϕ 0 [ γ ˜ V + m D ( ω ) + γ ˜ D B m D B ( ω ) 1 + m D ( ω ) + m D B ( ω ) ]
where ϕ 0 is the topographic phase, γ ˜ V is the coherence from the volume contribution, γ ˜ D B is the coherence of double-bounce scattering, and m D ( ω ) and m D B ( ω ) are the ground-to-volume ratios corresponding to the direct and double-bounce scattering contributions, respectively. In (3), ω indicates a specific polarimetric channel.
According to [19], the monitored plots are flooded during the cultivation cycle. Consequently, the direct contributions that come from the ground surface are weak compared to the double-bounce contribution. The RVoG model is simplified as follows:
γ ˜ ( κ Z , ω ) = e i ϕ 0 [ γ ˜ V + γ ˜ D B m D B ( ω ) 1 + m D B ( ω ) ]
γ ˜ V = 0 h v e i κ z z e 2 σ z cos θ d z 0 h v e 2 σ z cos θ d z
γ ˜ D B = sin k z h v k z h v
κ z = 2 π B λ R sin θ
k z = κ z sin 2 θ
where h v is the height of the plants, σ is the extinction coefficient, θ is the incidence angle of the electromagnetic waves, λ is the wavelength of the radar waves, R is the range or distance, and B is the length of the perpendicular baseline. κ z is the vertical wavenumber, which represents the sensitivity factor for the height. It can be seen in Equations (4)–(8) that the model assumes that the double-bounce ground-to-volume ratio is polarization-dependent. In addition, the decorrelation term denoted by γ ˜ D B , which depends on the crop height, is caused by the different transmission and return paths to the antenna [23].
With dual-polarization TanDEM-X data, each observation provides 2 complex coherences, i.e., 4 real datapoints. The RVoG model defined in (4)–(8) comprises 5 parameters: topographic phase ϕ 0 , vegetation height h v , extinction σ , and 2 ground-to-volume ratios m D B ( ω ) (1 for each polarization). The retrieval of the model parameters from the data is usually based on two steps. First, a line is fitted to the coherence region on the complex plane, which provides the topographic phase ϕ 0 . Second, the four remaining parameters are estimated by a numerical minimization using the two complex coherences [19].
From the above RVoG model, among all of the scene parameters, plant height, as a feature directly related to time, is the best bridge to establish the relationship between the PolInSAR observations and the time variation characteristics. In this article, we assume that the evolution of rice plant height in each pixel follows a logistic growth equation in the temporal domain and, consequently, a set of PolInSAR observations (acquired at selected dates) are employed to fit the characteristic parameters of the logistic growth equation. The formulae of the volume scattering coherence and the total coherence, employed for inversion based on the time series, are derived by combining the theoretical equation of crop height growth with the RVoG model:
γ v ( t ) = 0 H ( t ) e i κ z z e 2 σ z cos θ d z 0 H ( t ) e 2 σ z cos θ d z = 2 σ ( e 2 σ H ( t ) cos θ + i κ z z 1 ) ( 2 σ + i κ z cos θ ) ( e 2 σ H ( t ) cos θ 1 )
γ ˜ ( ω , t ) = e i ϕ 0 [ γ v ( t ) + sin k z H ( t ) k z H ( t ) m D B ( ω ) 1 + m D B ( ω ) ]
in which hv has been substituted by H (t). If n represents the number of interferograms (dates) used for the model inversion based on the time series and we assume that the topographic phase is estimated by the line fit, there are 3 + 3n unknown parameters in Equations (9)–(10) to be solved: H ¯ , k , t 0 , σ n , m D B n ( ω max ) , and m D B n ( ω min ) . Consequently, using 4 real measurements (2 complex coherences) from each date, in order to balance the number of unknowns and measured data, at least 3 different dates are required to estimate the height of rice over the whole growth cycle.

3.2. Inversion Scheme for Crop Height from TanDEM-X PolInSAR Data

The proposed RVoG height inversion scheme with dual-polarization TanDEM-X data consists of four main steps, which are detailed in the following subsections. Due to the properties of HH and VV PolInSAR data, the covariance matrix formalism was used and the trace coherence was also employed to simplify the process of determining the extreme coherences as in [22].

3.2.1. Compensation of the SNR and BAQ Decorrelation of the Covariance Matrix

The first processing step consists of compensating for the signal-to-noise ratio (SNR) decorrelation, for which the annotated noise can be directly subtracted from the PolInSAR measurements. After the SNR correction, the BAQ decorrelation is compensated by multiplying by the theoretical term γ B AQ . In the scene dominated by crops, the value of γ B AQ is normally regarded as a constant, i.e., 0.965 [19,22,28].

3.2.2. Calculation of the TrCoh and Estimation of the Two Coherences with Maximum Phase Separation

The trace coherence (TrCoh, γ t r ) was first defined in [29] and was used for vegetation height retrieval in [22]:
γ t r = T r a c e ( [ Ω 12 n f ] ) T r a c e ( [ C 11 n f ] ) T r a c e ( [ C 22 n f ] )
where T r a c e ( · ) represents the sum of the diagonal elements of the matrix. The TrCoh provides an approximation to the center of mass of the coherence region (CoRe), which does not depend on a specific scattering mechanism and represents the overall contributions of all of the coherences [28].
In the dual-polarization case, the set of all possible interferometric coherences defines an ellipse in the complex plane. This enables an analytical solution to find the extreme coherences γ ( ω min ) , γ ( ω max ) that maximize the phase separation, as it is detailed in [22]. The intersection of the line defined by the extreme coherences and the circle with a radius γ D B , moving from γ ( ω min ) to γ ( ω max ) , provides the estimation of the topographic phase ϕ 0 .
The coherence loci of the RVoG model are considered to cross the TrCoh, which leads to more stable results. The extreme coherences are obtained by crossing the line redefined by the TrCoh γ t r and the topographic phase ϕ 0 with the ellipse [22],
γ ˜ max / min = e i ϕ 0 + F ( γ t r - e i ϕ 0 )

3.2.3. Determination of the Input Observations used for Inversion

According to the RVoG model combined with the logistic growth equation, the data of n ( n 3 ) different dates should be selected for enabling inversion. In the first instance, one may consider the option of inputting all of the available interferograms (dates) to retrieve the model parameters. However, this was not considered in this work for two reasons. As a highly nonlinear model with multiple solutions, too many optimization objectives make it difficult for any optimization algorithm to find a suitable solution. In this study, we used the NSGA-II intelligent algorithm, which is mainly applied to two- or three-objective optimization problems [30], so we only selected three dates (i.e., three pairs of extreme coherences) as the observation input. In addition, it was found through previous experimental exploration that the performance of the RVoG model inversion is dependent on the interferometric sensitivity and the coherence magnitude (i.e., phase quality) provided by the different interferograms [31,32,33]. The introduction of unsuitable measurements to invert the model parameters can reduce the reliability of the results. The inversion accuracy can also be affected by uncompensated nonvolumetric decorrelation contributions. Interferograms with a low observation quality could distort the logistic curve and reduce the successful implementation of the new model inversion. In conclusion, a choice criterion should be introduced for the case of more than three available interferograms during the period of the rice growth cycle.
As the TrCoh can be considered to be an overall indicator of the distribution of the coherence, and hence, measurement quality, γ t r is used to represent the interferometric height accuracy and H a c c u r a c y expresses the relationship of the interferometric phase to height variations [34].
H a c c u r a c y = ϕ t r κ z
The variance of the phase and height of each scene are defined as:
σ ϕ 2 = 1 | γ t r | 2 2 N L | γ t r | 2
σ H 2 = σ ϕ 2 κ z 2 = 1 | γ t r | 2 2 κ z 2 N L | γ t r | 2
where N L represents the number of looks and σ H 2 is the index used to characterize the quality of the input coherences at the pixel level. When the coherence amplitude increases, the variance decreases, and the height accuracy improves. Considering this, for each pixel, the three dates with the smallest variances of TrCoh are selected as the input data.

3.2.4. Numerical Estimation of the Unknown Parameters

The observations are 4 × n , i.e., there are n observation dates (expressed as days after sowing) and 2 × n measured complex coherences. The unknown parameters are the three growth parameters, the n extinction coefficients, and the 2 × n ground-to-volume ratios. The objective of multi-objective optimization is to minimize the sum of the distances between the extreme coherences and modeled coherences, i.e.,:
min H ¯ , k , t 0 , σ n , m D B n ( ω max ) , m D B n ( ω min ) γ max n γ ˜ n ( ω max , t ) + γ min n γ ˜ n ( ω min , t )
The procedure of rice crop height estimation based on the proposed time-series RVoG model with bistatic TanDEM-X dual-polarization data is shown in the flowchart in Figure 4.
Figure 4. Flowchart of the time-series RVoG model based on the logistic growth equation.
Remotesensing 14 05109 g004
In is important to note that the optimization results for the parameters in the logistic growth equation can be applied to the estimations of rice crop height at any time during the growth cycle, i.e., not only at the dates of the TanDEM-X acquisitions.

4. Results and Analysis

4.1. Feasibility Analysis of the Logistic Growth Equation

To illustrate the effectiveness of the logistic growth function at the three test plots, we used the reference data of the rice crop height collected by the ground measurements from 2016 to 2020 to carry out a logistic regression. According to Equation (1), the height is expressed as a function of time, for which an initial date is implicitly required. Considering that rice only lasts for 5 months from sowing to maturity and its maturity height is around 1 m (the magnitude is small compared to the general vegetation), the introduction of the sowing date when relevant data are available helps the fitting of the growing evolution of rice at a more accurate level. At the same time, we used the logistic growth equation to describe the evolution of rice height and considered the application of the growth parameters. The results obtained by taking days after sowing as the input values could be regarded as only related to the growth time but unnecessary for considering the effect of input leading or lagging time. Therefore, the cumulative days after the sowing date were taken as the input time magnitude in all of the processing described in this article. The results of the logistic regression to the ground-truth data are illustrated in Figure 5. Before discussing the results, it must be clarified that there are fluctuations in height along time, which are especially visible in the last phenological stages and for some fields. From the perspective of vegetation growth itself, the parameter of plant height continuously increases, especially during the vegetative phase, until it reaches a maximum height, which should be stable until harvest. However, due to the increase in the panicle weight and the impact of wind, the rice plants cannot always be completely upright in the field; hence, vegetation height can go up and down because plants may be more or less bent over time. In addition, it should be emphasized that the height considered in this work is measured as the distance from the water surface to the highest point of the plants; hence, the fluctuations in water level have an impact upon the measurements. Finally, all measurements were gathered manually with a measurement tape (see Section 2.1). Therefore, there is always some experimental error when taking the height measurements. Despite the commented fluctuations, which are inconsistent with the smooth curve, overall, it is possible to describe the time-varying characteristic with a single function. The coefficient of the determination of the fitting results is close to 1 and the root-mean-square error (RMSE) values are less than 0.01 m. The accuracy measures are listed in Table 3, which indicate that the logistic growth equation, defined with only three parameters, can describe the height variation of rice over the whole growth cycle.

4.2. Effectiveness of the Date Selection Strategy

This section shows a comparison of the accuracy of the height (estimated by arbitrarily choosing three interferograms as the inputs) and the results of the proposed date selection method. To further illustrate the necessity of this strategy, taking the EIReboso test plot as an example, four combinations from all of the interferograms applied in this work were manually chosen to invert under different incidence angle conditions. In Figure 6, the corresponding results are compared to the results of the proposed method.
According to the four combinations shown in C1–C4, the complex coherences in the EIReboso test plot for the selected InSAR images were used as the observation inputs to retrieve the model parameters and the rice crop heights derived from the growth parameters were compared to the inversion results obtained using the proposed date selection strategy. The quantitative comparison presented in Figure 7 and Figure 8 indicates that the inversion with the proposed date selection can adaptively select the inputs at pixel level and it achieves a relatively decent accuracy. As shown in the results, the input coherences selected by the index did not achieve the highest accuracy, which is related to the particularity of the PolInSAR data. When the influence of nonvolume decorrelation is significant, the standard deviation of the interferometric phase is large and the height inversion accuracy is reduced. For dual-polarization data, TrCoh was used to approximate the center of the whole CoRe and was further used as a quality index of height accuracy in this work. When this indicator is applied to the pixels with a large phase difference in different polarization channels, an inaccurate approximation may be derived. At the same time, when the complex coherences on the complex plane are dispersed, the dominant factor affecting the accuracy of data inversion is no longer the interferometric phase. As a result, it is necessary to comprehensively consider the geometric structure of the CoRe. In order to reflect the difference of the same block inversion, the date selection method is carried out at the pixel level and the difference between the two may also cause statistical deviation. However, the proposed accuracy index has strong universality, especially in the case of poor observation data quality. In this verification, the best accuracy appears in C3 with 22°, C2 with 30°, and C4 with 39°, which implies that it is difficult to judge which selection might lead to the best results. Since it is not a feasible approach to directly invert all possible combinations of the existing interferograms and compare their accuracy from the perspective of inversion efficiency, the proposed date selection strategy can ensure that we select more suitable inputs from the miscellaneous observations and obtain a relatively reliable result, which has overall stronger robustness and adaptability.

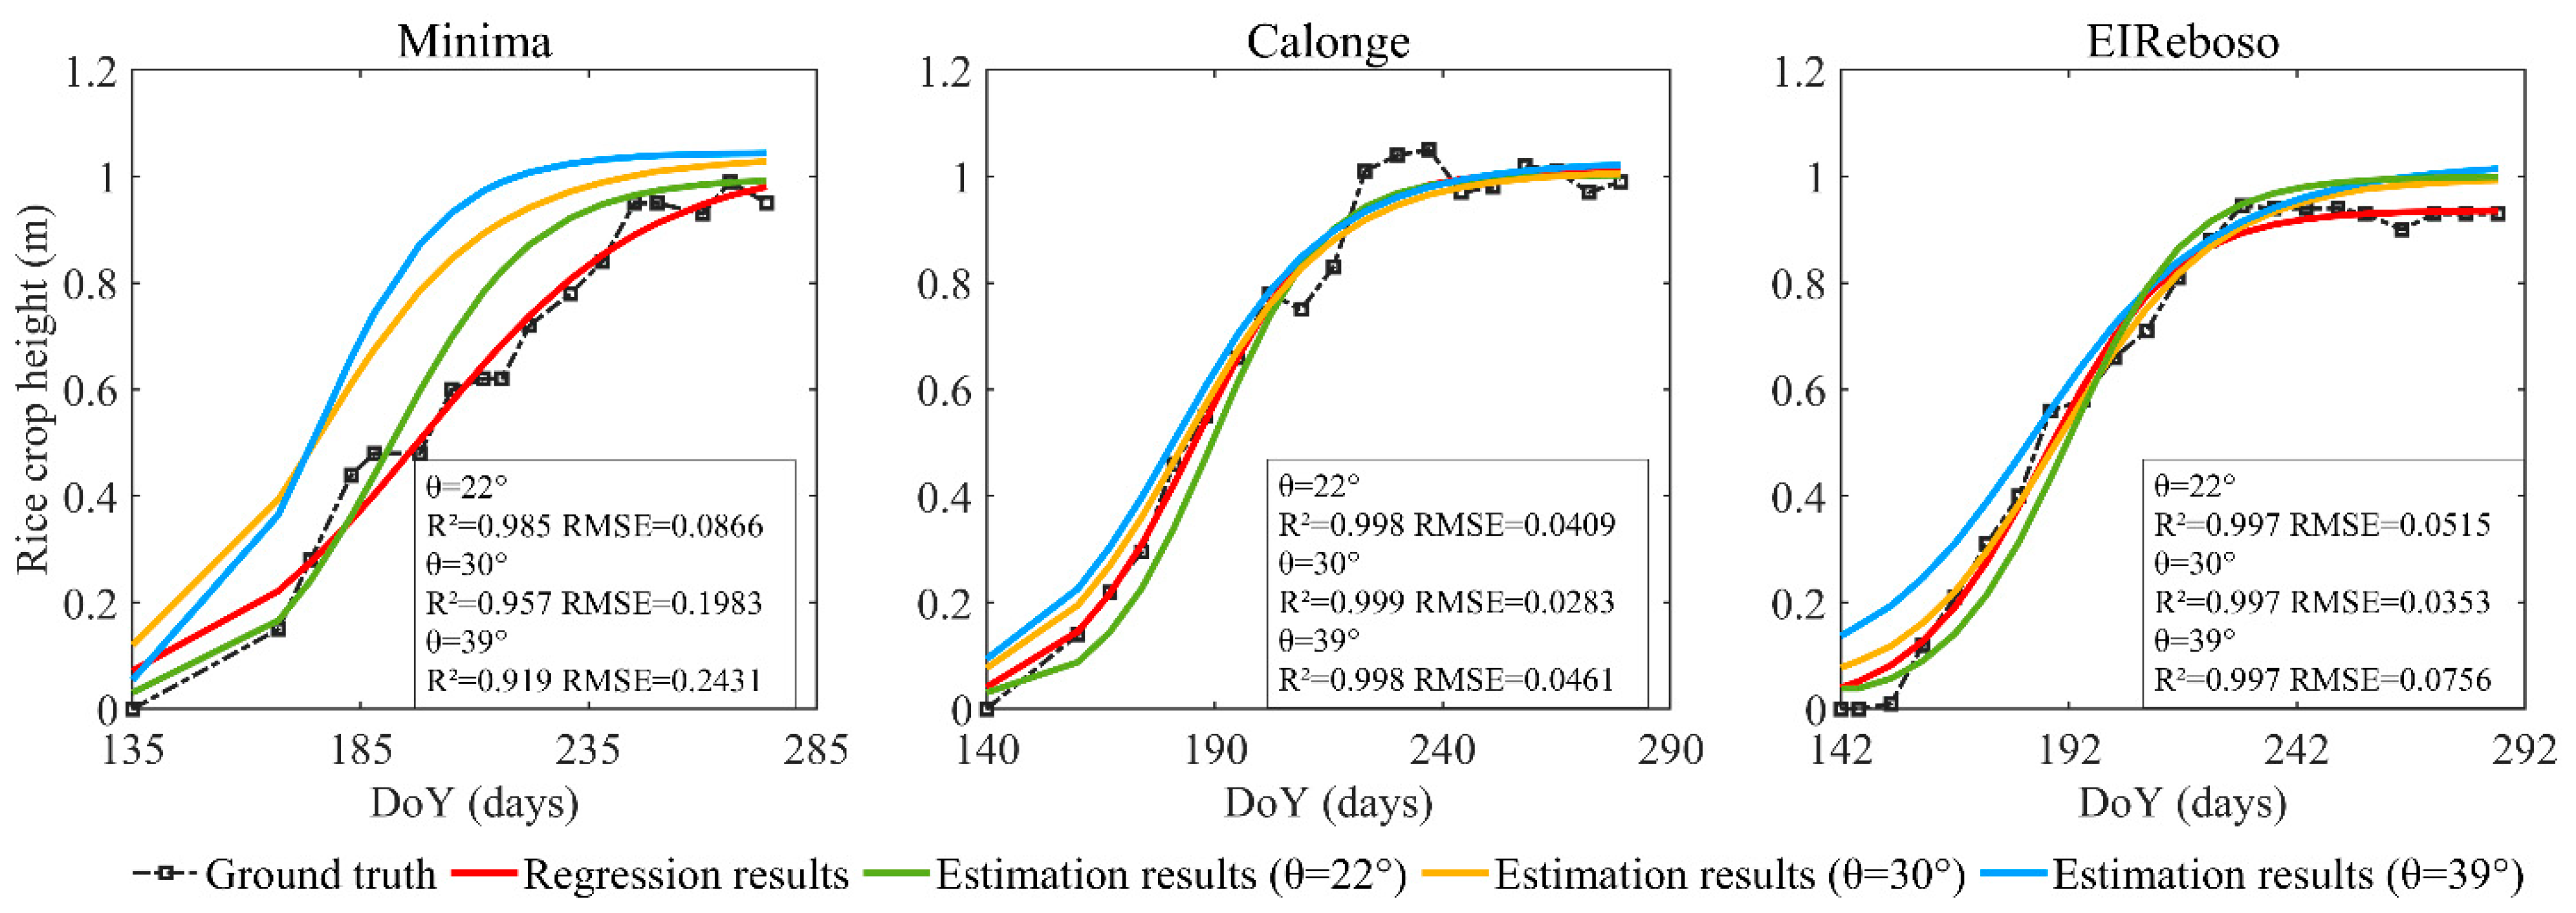
4.3. Inversion Results of Rice Crop Height

Figure 9 shows the evolution of the results of rice height estimation obtained with the date selection criterion introduced in Section 3. These results indicate the potential of the proposed model. The retrieved growth parameters are listed in Table 4. According to the growth parameters, it is possible to evaluate the growth status of the rice crop at any date. The retrieved height evolution at the Minima test plot is the most different from the reference data, which do not really follow a logistic evolution. It should be noted that the maximum growth height is not always equivalent to the mature height but it is a theoretical value that should be comprehensively analyzed. In the Minima case, the final height did not fluctuate much due to the ear weight at maturity, but the crop height continued to increase until the end of the growth cycle, reaching a height that was still lower than the theoretical maximum.
For a comparison of the height retrieval results of the proposed method under different incidence angle conditions, the correlation between the estimates and the ground measurements is shown in Figure 10 and Table 5. Except for the Minima test plot, the RMSE of the height estimations in the other test plots and for all cases is less than 0.1 m and the determination coefficient is higher than 0.95.
In the PolInSAR literature, especially in studies on vegetation height retrieval, it has been demonstrated that there is an optimum range of the product of vertical wavenumber and vegetation height, κ z · h v , to obtain accurate height estimates. For instance, this aspect is discussed in detail in [23] (Sections 8.2–8.3, Figure 8.28). If the product is too small, there is not enough separation of coherences and phases in PolInSAR data to provide an accurate height estimation and this is what was found in [19,22,35] with the same dataset at 30° and 39° for all crop heights, and also at 22° at the beginning of the growth cycle. The overestimation of crop height is noticeable for the datasets with associated large HoA and a reduced vertical wavenumber (see Table 2), which in this case makes the 39° incidence angle set the worst. In contrast, the vegetation height calculated based on the growth parameters is underestimated in the early stage under the case of a 22° incidence angle. At this point, it is worth recalling the strong overestimation found in [19,35] with the same dataset at 30° and 39° incidences for all dates, and at 22° in the initial dates. Using only the RVoG model, without the time coordinate assistance employed in the present work, the height results are extremely far from the actual values and the PolInSAR-based retrieval is unable to provide valid estimates. The use of the logistic equation constrains the overall evolution of rice height, producing results for which the maximum height reduces with the decrease in the incidence angle. A single case is apparent in the results for the Minima test plot. The time-series RVoG model is not able to capture the growth when the actual crop growth does not fully comply with the changes described in Figure 3, but the best results still come from the data with a 22° incidence angle. It is concluded that, even if the application of the logistic growth equation reduces the variability of the RVoG model and avoids the appearance of parameters that are inconsistent with the actual conditions, there will always be some decorrelation in the data that cannot be offset. Therefore, datasets with a smaller HoA should be given priority to provide more accurate estimations for short crops, such as rice.
To further analyze the method performance, the mean relative errors of the crop heights obtained from the different InSAR data at the three test plots were exhibited in Figure 11. The statistics were computed for the range of the errors below 100% because the part greater than 100% is considered invalid. Overall, the results derived from the 30° incidence angle produce the lowest estimation errors. However, the height estimation error obtained from the data of 22° and 39° has increased; the main reason might be that the variability of the height evolution trend is reduced when using the logistic growth equation. Since all changes were derived from three fitting growth parameters, when estimation errors appeared, the overall results may be overestimated or underestimated. The optimum accuracy, on the whole, occurs late in the cultivation cycle, when the growth rate is beginning to decline. The main reason for this is that the height measurement ability in this observation condition is suitable for the whole dataset and the effect of the short baseline is not as obvious as in the early stages (characterized by short crops). On the other hand, the relative errors of the three test plots were quite different. Taking Minima with obvious differences as an example, combined with Figure 9 and the ground measurement, it could be found that the rice grown in this area was slower and did not reach the mature height in later stages, which corresponds to a lower measured rice height. However, the proposed model still retrieves the unknown parameters by optimizing the observation coherences within three days and the accuracy of the inversion results is still subject to interferometric sensitivity.
In view of the characteristics of the logistic growth equation, the initial value of rice growth cannot start from 0, which obviously departs from the actual situation. When the growth trend of the estimated equation parameters is far from the actual value, the initial height deviation is more noticeable, which might be an inevitable limitation of the proposed model. Unfortunately, the InSAR observations are not suitable for parameter calculation in the initial growth stage due to the lack of enough sensitivity to the vertical coordinate.
Another limitation of the RVoG model combined with the logistic growth equation is that the inversion accuracy cannot exceed the fitting result. Even if the optimal estimation accuracy for the logistic growth equation can be achieved, it can still differ from the ground-truth value, so that the logistic curve cannot fully fit the change in rice height in the time series. For a more comprehensive analysis of this shortcoming, a comparison of the rice height estimations obtained from the proposed method and the nonlinear fitting results directly acquired by ground-truth data is shown in Figure 12. Considering the performance of the model, as the regression results represent the highest accuracy that can be achieved, it is clear that the inversion accuracy for the Calonge and EIReboso test plots is close to the best. To some extent, the poor height retrieval accuracy for the Minima test plot can be attributed to the divergence between the logistic growth equation and the growth trend in this area. In the majority of cases, rice growing conforms to the law of the logistic growth equation and using the time-series model to restrict the height variation is an effective approach. However, as previously mentioned, enough interferometric sensitivity is not available for extremely short crops, such as rice, which increases the difficulty of capturing the actual heights with the proposed algorithm.
Finally, in order to display the spatial distribution of the rice height over the entire test site, Figure 13 shows the maps of height estimated by the proposed method at different incidence angles. As mentioned in Section 4.1, the application of the external data of the sowing date can avoid some potential errors, but this information is not available in every field, so it is necessary to propose a method for large-scale rice monitoring. The TrCoh mentioned in Section 3.2.2 provides an approximation to the center of mass of the CoRe and represents the overall contributions of all of the coherences. It has been proven that the differential interferometric phase can be used to measure the evolution of rice height over time and κ z established a direct relationship between the phase of TrCoh and vegetation height [34]. For each time series, the differences between the heights extracted from the interferograms obtained from the current date and the previous date constituted the vegetation height variation features. Since the position of the phase center depends on the morphological characteristics of the canopy and its interaction with the radar signal, direct application of the phase center to retrieve crop height may not be accurate, as described above, but the phase change in the time domains is sufficient to distinguish the differences in rice growth between different pixels. The height changes extracted from the three test plots with a known sowing date, according to the InSAR phase-based methodology, were used as three training sets of different classifications and support vector machine (SVM) was used to train the classification model. The classification model is applied to predict the type of height changes in other fields, that is, three types of rice with the same growth characteristics as rice in the three test plots are obtained and the sowing dates were considered to be consistent with their corresponding plots. Thus, a rough image of estimated sowing dates can be obtained and the cumulative growth days calculated based on this image were used as the inputs of the proposed modified RVoG model. Finally, the rice height inversion of the whole test site was completed. The height maps were obtained at specific dates, which are annotated above the images. These maps illustrate the potential of this technique to provide high resolution crop height maps over the areas covered by the TanDEM-X images.

5. Discussion

The RVoG model had been widely used to retrieve vegetation height. However, its application in conjunction with the time domain information has not been attempted to date. In order to establish an effective inversion model for physical variables of crops, we assumed that the height evolution of rice conforms to the logistic growth equation in the whole growth cycle and the crop height estimates at any date were obtained through the three parameters of the equation. In contrast with a regression or fitting based on ground measurements, we used height as a bridge to apply the RVoG model to a time series of data. For this purpose, a date selection strategy was devised. The introduction of the theoretical growth equation essentially restricted the variability of the model, which implied that the plant height gradually increases and is irreversible.
There are some issues in predicting plant height with three growth parameters. The height evolution of the proposed model was determined by a single equation, which may lead to an overall deviation of height results in some dates when the parameter estimation error is large. This effect is inevitable in the proposed model. In future work, we could consider the application of the RVoG model combined with multiple logistic equations to adaptively obtain growth parameters closer to the real scene.
Another limitation of the theoretical growth equation in this paper comes from the dependence of the logistic growth equation on the sowing date. In order to directly use the growth parameters to characterize the growth of rice, the sowing date was directly used as the starting point for the cumulative dates, which avoided the emergence of many errors. However, for large-scale applications, it is indispensable to discuss how the sowing date can be estimated and what is the effect of sowing date estimation errors on the accuracy of crop height retrieval. Unfortunately, only a small amount of ground measurements was available in this study, so a quantitative analysis could not be conducted on other fields except the selected test plots.
This paper aimed to convey the idea of adding growth constraints to physical models, such as the RVoG. This strategy is effective for the inversion of vegetation height over time. The key is to choose suitable theoretical growth equations for different vegetation types in different applications, and hence modify the construction of the physical model for the corresponding vegetation scenes and monostatic or bistatic types of spaceborne data [20]. Moreover, in this work, the estimated growth parameters were not further studied. However, the results can quantitatively characterize the overall growth of vegetation, describe crop health based on parameters, and be used for pest monitoring and phenological tracking.
In order to select appropriate input data to fit the logistic equation, a date selection method was established. The strategy used the interferometric height accuracy of the current data as the evaluation index, which was a common idea in spatial multi-baseline selection [32]. We applied this selection method to the multi-date selection in the time domain. The height accuracy factor calculated from the TrCoh, as a representative of the phase center, was constructed for its generalized applicability. It provides a reference for measuring the accuracy of interferometry and only considers the applicability of input data from the perspective of interferometric quality. However, for pixels with a large difference in phase centers at different polarization channels, the TrCoh cannot fully reflect the data features. Consequently, the date selection strategy adopted in this study ensured relatively suitable inversion accuracy, but for an optimal selection strategy, more diversified factors need to be integrated to find the most suitable index. More research is needed on different indicators and their applicability analysis.

6. Conclusions

In this work, we propose a new methodology for crop height retrieval for a time series of PolInSAR data. It is based on combining the RVoG model with the logistic growth model. Using multi-temporal data, a monitoring method of PolInSAR-based rice height retrieval considering growth constraints is proposed here for the first time. The core ideas of this article are: (1) the integration of the mathematical model describing the growth law of natural features with the physical model (RVoG) characterizing the PolInSAR data and (2) the transformation of the isolated plant height obtained from the single-date PolInSAR data into the process of solving the growth parameters through the set of SAR observations and estimating the rice height corresponding to any date, even in the absence of SAR acquisitions. In this way, the complete evolution of rice plant height in the growth cycle can be inverted through only a small amount of observation data. This not only reduces the dependence on the observation time but also corrects the complex coherence applied to the RVoG model through the change trend of the growth equation in the temporal domain so that the crop height result estimations are based on a more stable and reliable model. In addition to estimating the crop height, the growth parameters can also provide basic data support for the subsequent monitoring of crop yield and refined phenology estimation results. Specific applications of the proposed method will be further studied in our future work.
Under the condition of limited data being available, we focused on the limitations of the RVoG model dominated by double-bounce scattering in rice fields and aimed to reduce the dependence of the model performance on interferometric sensitivity to height. The improved model with the date selection criterion was evaluated.
Firstly, for the case of choosing between multiple observations on different dates, by adding the observation quality index, three dates with coherences characterized by the smallest variance can be selected at the pixel level in the time-series data to complete the parameter calculation, and a better estimation result can be obtained. This scheme reduces the errors caused by poor observation quality, to a certain extent, and increases the inversion stability. Then, by using three sets of bistatic dual-polarization TanDEM-X data with different incidence angles, it was found that the overall RMSE is 0.16 m, and the overall determination coefficient is 0.94. Compared to the methods proposed in previous studies, this method can not only achieve a certain improvement in accuracy but can also be applied to estimate rice height in any instance by means of the logistic growth equation, which reduces the time requirements for SAR observations and increases the freedom of dynamic monitoring. At the same time, the three parameters of the growth equation have physical significance and can assist in analyzing the speed of rice growth and form the basis for further subsequent phenological estimations and health assessments.

Author Contributions

Conceptualization, N.L.; methodology, N.L.; software, N.L.; validation, N.L. and Q.X.; formal analysis, N.L., H.F. and J.M.L.-S.; investigation, N.L. and J.M.L.-S.; resources, J.M.L.-S.; data curation, N.L.; writing—original draft preparation, N.L.; writing—review and editing, H.F., W.H., J.M.L.-S. and J.Z.; visualization, N.L.; supervision, H.F.; project administration, H.F., J.Z. and J.M.L.-S.; funding acquisition, N.L., H.F., J.Z. and J.M.L.-S., J.H., Y.X. All authors have read and agreed to the published version of the manuscript.

Funding

This research was funded in part by the National Natural Science Foundation of China (grant nos. 41820104005, 42030112, 41904004) and in part by the and the Spanish Ministry of Science and Innovation (grant no. PID2020-117303GB-C22).

Data Availability Statement

No new data were created or analyzed in this study. Data sharing is not applicable to this article.

Acknowledgments

The authors would like to thank the German Aerospace Center (DLR) for providing the TanDEM-X data under project NTI-POLI6736 and the Federacion de Arroceros de Sevilla for providing the field data.

Conflicts of Interest

The authors declare no conflict of interest.

References

  1. Mulla, D.J. Twenty Five Years of Remote Sensing in Precision Agriculture: Key Advances and Remaining Knowledge Gaps. Biosyst. Eng. 2013, 114, 358–371. [Google Scholar] [CrossRef]
  2. Allies, A.; Roumiguie, A.; Dejoux, J.-F.; Fieuzal, R.; Jacquin, A.; Veloso, A.; Champolivier, L.; Baup, F. Evaluation of Multiorbital SAR and Multisensor Optical Data for Empirical Estimation of Rapeseed Biophysical Parameters. IEEE J. Sel. Top. Appl. Earth Obs. Remote Sens. 2021, 14, 7268–7283. [Google Scholar] [CrossRef]
  3. Garestier, F.; Dubois-Fernandez, P.; Dupuis, X.; Paillou, P.; Hajnsek, I. PolInSAR Analysis of X-Band Data over Vegetated and Urban Areas. IEEE Trans. Geosci. Remote Sens. 2006, 44, 356–364. [Google Scholar] [CrossRef]
  4. Ballester-Berman, J.D.; Lopez-Sanchez, J.M.; Fortuny-Guasch, J. Retrieval of Biophysical Parameters of Agricultural Crops Using Polarimetric SAR Interferometry. IEEE Trans. Geosci. Remote Sens. 2005, 43, 683–694. [Google Scholar] [CrossRef]
  5. Treuhaft, R.N.; Cloude, S.R. The Structure of Oriented Vegetation from Polarimetric Interferometry. IEEE Trans. Geosci. Remote Sens. 1999, 37, 2620–2624. [Google Scholar] [CrossRef]
  6. Lopez-Sanchez, J.M.; Ballester-Berman, J.D.; Marquez-Moreno, Y. Model Limitations and Parameter-Estimation Methods for Agricultural Applications of Polarimetric SAR Interferometry. IEEE Trans. Geosci. Remote Sens. 2007, 45, 3481–3493. [Google Scholar] [CrossRef] [Green Version]
  7. Ballester-Berman, J.D.; Lopez-Sanchez, J.-M.; Fortuny-Guasch, J. Retrieval of Height and Topography of Corn Fields by Polarimetric SAR Interferometry. In Proceedings of the IGARSS 2004. 2004 IEEE International Geoscience and Remote Sensing Symposium, Anchorage, AK, USA, 20–24 September 2004; IEEE: Piscataway NJ, USA, 2004; Volume 2, pp. 1228–1231. [Google Scholar]
  8. Hajnsek, I.; Cloude, S.R. Pol-InSAR for Agricultural Vegetation Parameter Estimation. In Proceedings of the IGARSS 2004. 2004 IEEE International Geoscience and Remote Sensing Symposium, Anchorage, AK, USA, 20–24 September 2004; IEEE: Piscataway NJ, USA, 2004; Volume 2, pp. 1224–1227. [Google Scholar]
  9. Pichierri, M.; Hajnsek, I. Comparing Performances of Crop Height Inversion Schemes From Multifrequency Pol-InSAR Data. IEEE J. Sel. Top. Appl. Earth Obs. Remote Sens. 2017, 10, 1727–1741. [Google Scholar] [CrossRef]
  10. Lopez-Sanchez, J.M.; Hajnsek, I.; Ballester-Berman, J.D. First Demonstration of Agriculture Height Retrieval with PolInSAR Airborne Data. IEEE Geosci. Remote Sens. Lett. 2012, 9, 242–246. [Google Scholar] [CrossRef]
  11. Treuhaft, R.N. Vegetation Characteristics and Underlying Topography from Interferometric Radar. Radio Sci. 1996, 31, 1449–1485. [Google Scholar] [CrossRef]
  12. Maurer, E.; Kahle, R.; Mrowka, F.; Morfill, G.; Zimmermann, S. Operational Aspects of the TanDEM-X Science Phase. In Proceedings of the 14th International Conference on Space Operations, Daejeon, Korea, 16–20 May 2016. [Google Scholar]
  13. Erten, E.; Rossi, C.; Yuzugullu, O. Polarization Impact in TanDEM-X Data Over Vertical-Oriented Vegetation: The Paddy-Rice Case Study. IEEE Geosci. Remote Sens. Lett. 2015, 12, 1501–1505. [Google Scholar] [CrossRef]
  14. Sun, Y.Y.; Lee, S.K.; Won, J.S. Rice Paddy Height Estimation from Single-Polarization TanDEM-X Science Phase Data. In Proceedings of the IGARSS 2017–2017 IEEE International Geoscience and Remote Sensing Symposium, Fort Worth, TX, USA, 23–28 July 2017; pp. 930–933. [Google Scholar]
  15. Lee, S.-K.; Yoon, S.Y.; Won, J.-S. Vegetation Height Estimate in Rice Fields Using Single Polarization TanDEM-X Science Phase Data. Remote Sens. Basel Switz. 2018, 10, 1702. [Google Scholar] [CrossRef] [Green Version]
  16. Ballester-Berman, J.D.; Lopez-Sanchez, J.M. Coherence Loci for a Homogeneous Volume Over a Double-Bounce Ground Return. IEEE Geosci. Remote Sens. Lett. 2007, 4, 317–321. [Google Scholar] [CrossRef]
  17. Ballester-Berman, J.D.; Lopez-Sanchez, J.M. Combination of Direct and Double-Bounce Ground Responses in the Homogeneous Oriented Volume Over Ground Model. IEEE Geosci. Remote Sens. Lett. 2011, 8, 54–58. [Google Scholar] [CrossRef]
  18. Erten, E.; Lopez-Sanchez, J.M.; Yuzugullu, O.; Hajnsek, I. Retrieval of Agricultural Crop Height from Space: A Comparison of SAR Techniques. Remote Sens. Environ. 2016, 187, 130–144. [Google Scholar] [CrossRef] [Green Version]
  19. Lopez-Sanchez, J.M.; Vicente-Guijalba, F.; Erten, E.; Campos-Taberner, M.; Garcia-Haro, F.J. Retrieval of Vegetation Height in Rice Fields Using Polarimetric SAR Interferometry with TanDEM-X Data. Remote Sens. Environ. 2017, 192, 30–44. [Google Scholar] [CrossRef] [Green Version]
  20. Romero-Puig, N.; Lopez-Sanchez, J.M.; Ballester-Berman, J.D. Estimation of RVoG Scene Parameters by Means of PolInSAR With TanDEM-X Data: Effect of the Double-Bounce Contribution. IEEE Trans. Geosci. Remote Sens. 2020, 58, 7283–7304. [Google Scholar] [CrossRef]
  21. Yuzugullu, O.; Erten, E.; Hajnsek, I. Assessment of Paddy Rice Height: Sequential Inversion of Coherent and Incoherent Models. IEEE J. Sel. Top. Appl. Earth Obs. Remote Sens. 2018, 11, 3001–3013. [Google Scholar] [CrossRef]
  22. Romero-Puig, N.; Marino, A.; Lopez-Sanchez, J.M. Application of the Trace Coherence to HH-VV PolInSAR TanDEM-X Data for Vegetation Height Estimation. IEEE Trans. Geosci. Remote Sens. 2022, 60, 1–10. [Google Scholar] [CrossRef]
  23. Cloude, S. Polarisation: Applications in Remote Sensing, 1st ed.; Oxford University Press: New York, NY, USA; New York, NY, USA, 2010; ISBN 978-0-19-956973-1. [Google Scholar]
  24. Mascolo, L.; Martinez-Marin, T.; Lopez-Sanchez, J.M. Optimal Grid-Based Filtering for Crop Phenology Estimation with Sentinel-1 SAR Data. Remote Sens. Basel Switz. 2021, 13, 4332. [Google Scholar] [CrossRef]
  25. Xu, S.; Peng, G.; Deng, W.; Li, Z.; University, N.F. Optimal Fitting Study on Applying Genetic Algorithm to Five Theoretical Growth Equations. For. Eng. 2013, 29, 36–39+65. [Google Scholar]
  26. Rohner, B.; Waldner, P.; Lischke, H.; Ferretti, M.; Thürig, E. Predicting Individual-Tree Growth of Central European Tree Species as a Function of Site, Stand, Management, Nutrient, and Climate Effects. Eur. J. For. Res. 2017, 137, 29–44. [Google Scholar] [CrossRef]
  27. Tjørve, E.; Tjørve, K.M.C. A Unified Approach to the Richards-Model Family for Use in Growth Analyses: Why We Need Only Two Model Forms. J. Theor. Biol. 2010, 267, 417–425. [Google Scholar] [CrossRef]
  28. Rizzoli, P.; Dell’Amore, L.; Bueso-Bello, J.-L.; Gollin, N.; Carcereri, D.; Martone, M. On the Derivation of Volume Decorrelation From TanDEM-X Bistatic Coherence. IEEE J. Sel. Top. Appl. Earth Obs. Remote Sens. 2022, 15, 3504–3518. [Google Scholar] [CrossRef]
  29. Marino, A. Trace Coherence: A New Operator for Polarimetric and Interferometric SAR Images. IEEE Trans. Geosci. Remote Sens. 2017, 55, 2326–2339. [Google Scholar] [CrossRef]
  30. Fu, Y.; Min, H.; Wang, H.; Jiang, G. An Improved NSGA-II to Solve Multi-Objective Optimization Problem. In Proceedings of the 26th Chinese Control and Decision Conference (2014 CCDC), Changsha, China, 31 May–2 June 2014; pp. 1037–1040. [Google Scholar]
  31. Valcarce-Diñeiro, R.; Lopez-Sanchez, J.M.; Sánchez, N.; Arias-Pérez, B.; Martínez-Fernández, J. Influence of Incidence Angle in the Correlation of C-Band Polarimetric Parameters with Biophysical Variables of Rain-Fed Crops. Can. J. Remote Sens. 2018, 44, 643–659. [Google Scholar] [CrossRef]
  32. Papathanassiou, K.P.; Cloude, S.R.; Reiber, A.; Boerner, W.M. Multi-Baseline Polarimetric SAR Interferometry for Vegetation Parameters Estimation. In Proceedings of the IEEE International Geoscience & Remote Sensing Symposium, Honolulu, HI, USA, 24–28 July 2000; Volume 6, pp. 2762–2764. [Google Scholar]
  33. Kugler, F.; Lee, S.-K.; Papathanassiou, K.P. Estimation of Forest Vertical Sructure Parameter by Means of Multi-Baseline Pol-InSAR. In Proceedings of the 2009 IEEE International Geoscience and Remote Sensing Symposium, Cape Town, South Africa, 12–17 July 2009; IEEE: New York, NY, USA; Volume 4, p. IV–721. [Google Scholar]
  34. Kugler, F.; Lee, S.-K.; Hajnsek, I.; Papathanassiou, K.P. Forest Height Estimation by Means of Pol-InSAR Data Inversion: The Role of the Vertical Wavenumber. IEEE Trans. Geosci. Remote Sens. 2015, 53, 5294–5311. [Google Scholar] [CrossRef]
  35. Romero-Puig, N. A Review of Crop Height Retrieval Using InSAR Strategies: Techniques and Challenges. IEEE J. Sel. Top. Appl. Earth Obs. Remote Sens. 2021, 14, 20. [Google Scholar] [CrossRef]
Figure 1. The location of the test site in Seville, Spain is on the left. The locations of the ground campaign plots are highlighted and magnified on the right.
Remotesensing 14 05109 g001
Figure 2. Flowchart of the height inversion implementation.
Remotesensing 14 05109 g002
Figure 3. Representation of the time-varying characteristics of the logistic growth equation. (a) Graph of the rice crop height over time. (b) The variation in growth rate over time.
Remotesensing 14 05109 g003
Figure 5. Regression results for the logistic growth equation with ground-truth data for the rice crop height collected from 2016 to 2020. The columns from left to right show the three monitored rice plots in Seville.
Remotesensing 14 05109 g005
Figure 6. Graphical representation of the different combinations of dates (black squares) chosen to compare to the proposed method with 22°, 30°, and 39° incidence angles. C1–C4 display the three interferograms selected as the input data. The proposed method (red) corresponds to the strategy of choosing inputs from all the observations available.
Remotesensing 14 05109 g006
Figure 7. Correlation plots of the rice height estimations with respect to the ground-truth data. C1–C4 correspond to the cases of the three manually selected interferograms that were used to estimate the rice height evolution, whereas the proposed method corresponds to the proposed model with the proposed date selection criterion.
Remotesensing 14 05109 g007
Figure 8. R2 (bars) and RMSE (squares) of the rice crop height estimated with different combinations of inputs.
Remotesensing 14 05109 g008
Figure 9. Variation in the crop height considering the proposed date selection. The dates with InSAR observations (red triangles) are introduced to calculate the parameters of the equations and the rice height estimations. The predictions obtained from the proposed approach (orange) are compared to the ground-truth data (black). The columns from left to right show the results for the three monitored rice plots in Seville for incidence angles of 22°, 30°, and 39°. The average results computed for all the pixels inside each plot on days with ground-truth data are presented. The error bars denote the standard deviation within each plot.
Remotesensing 14 05109 g009
Figure 10. Correlation plots of the rice height estimations with respect to the ground-truth data. The height evolutions for Minima (triangles), Calonge (diamonds), and EIReboso (squares) with 22° (green), 30° (blue), and 39° (orange) incidence angles are plotted.
Remotesensing 14 05109 g010
Figure 11. Relative errors of the vegetation height estimated with different incidence angles (22°, 30°, and 39°). Statistics are presented for the range of values in which the relative errors are less than 100%.
Remotesensing 14 05109 g011
Figure 12. Comparison of the model inversion performance and the ground-truth regression results. The rice height predictions obtained from the proposed approach with a 22° incidence angle (green), 30° incidence angle (yellow), and 39° incidence angle (blue) are compared with the line obtained by nonlinear fitting directly using the ground-truth values (orange). The statistics are listed in the lower right corner of each figure.
Remotesensing 14 05109 g012
Figure 13. Maps of rice height for four dates along the growth cycle obtained by the proposed method with 22°, 30°, and 39° incidence angles (displayed in order from top to bottom).
Remotesensing 14 05109 g013
Table 1. Description of three test plots.
Parcel NameSurface (ha)Sowing DateHarvest Date
Minima4.3215 May 20156 October 2015
Calonge12.9320 May 201516 October 2015
ElReboso17.2522 May 201524 October 2015
Table 2. TanDEM-X system parameters and acquisition dates for the datasets from Seville.
Incidence AngleHoA (m)Date RangeNumber of
Interferograms
22°2.5315 June 2015–31 August 20158
30°3.496 June 2015–2 September 20157
39°5.8110 June 2015–6 September 20159
Table 3. Regression results in the test sites with ground-truth data from 2016 to 2020.
TEST SITEYEARR2RMSE (M)
MINIMA20160.9845.52 × 10−3
20170.9733.63 × 10−3
20180.9692.21 × 10−3
20190.9903.79 × 10−3
20200.9465.36 × 10−3
CALONGE20160.9842.81 × 10−3
20170.9832.75 × 10−3
20180.9892.89 × 10−3
20190.9841.16 × 10−3
20200.9733.70 × 10−3
EIREBOSO20160.9752.23 × 10−3
20170.9065.85 × 10−3
20180.9766.40 × 10−3
Table 4. Average values of the estimated growth parameters corresponding to the different test plots.
Incidence AngleParameterTest Plot
MinimaCalongeEIReboso
θ = 22° H ¯ 0.9030.9380.915
k 0 0.06170.06940.0699
t 0 595761
θ = 30° H ¯ 1.0411.0140.999
k 0 0.05350.06380.0622
t 0 414347
θ = 39° H ¯ 1.0451.0291.027
k 0 0.07260.06020.0500
t 0 404142
Table 5. Statistics of the correlation between the field measurements and height estimates obtained with the time-series RVoG model based on the logistic growth equation.
Incidence Angle θPrecision IndexTest PlotTotal
MinimaCalongeEIReboso
22°RMSE (m)0.1010.0610.0640.075
R20.9700.9890.9900.980
30°RMSE (m)0.1970.0540.0530.114
R20.9590.9920.9920.960
39°RMSE (m)0.2440.0650.0890.145
R20.9260.9920.9940.949
Publisher’s Note: MDPI stays neutral with regard to jurisdictional claims in published maps and institutional affiliations.

