
Integrating Multi-Scale Remote-Sensing Data to Monitor Severe Forest Infestation in Response to Pine Wilt Disease

 , ,
, ,
Abstract
:
1. Introduction
2. Data
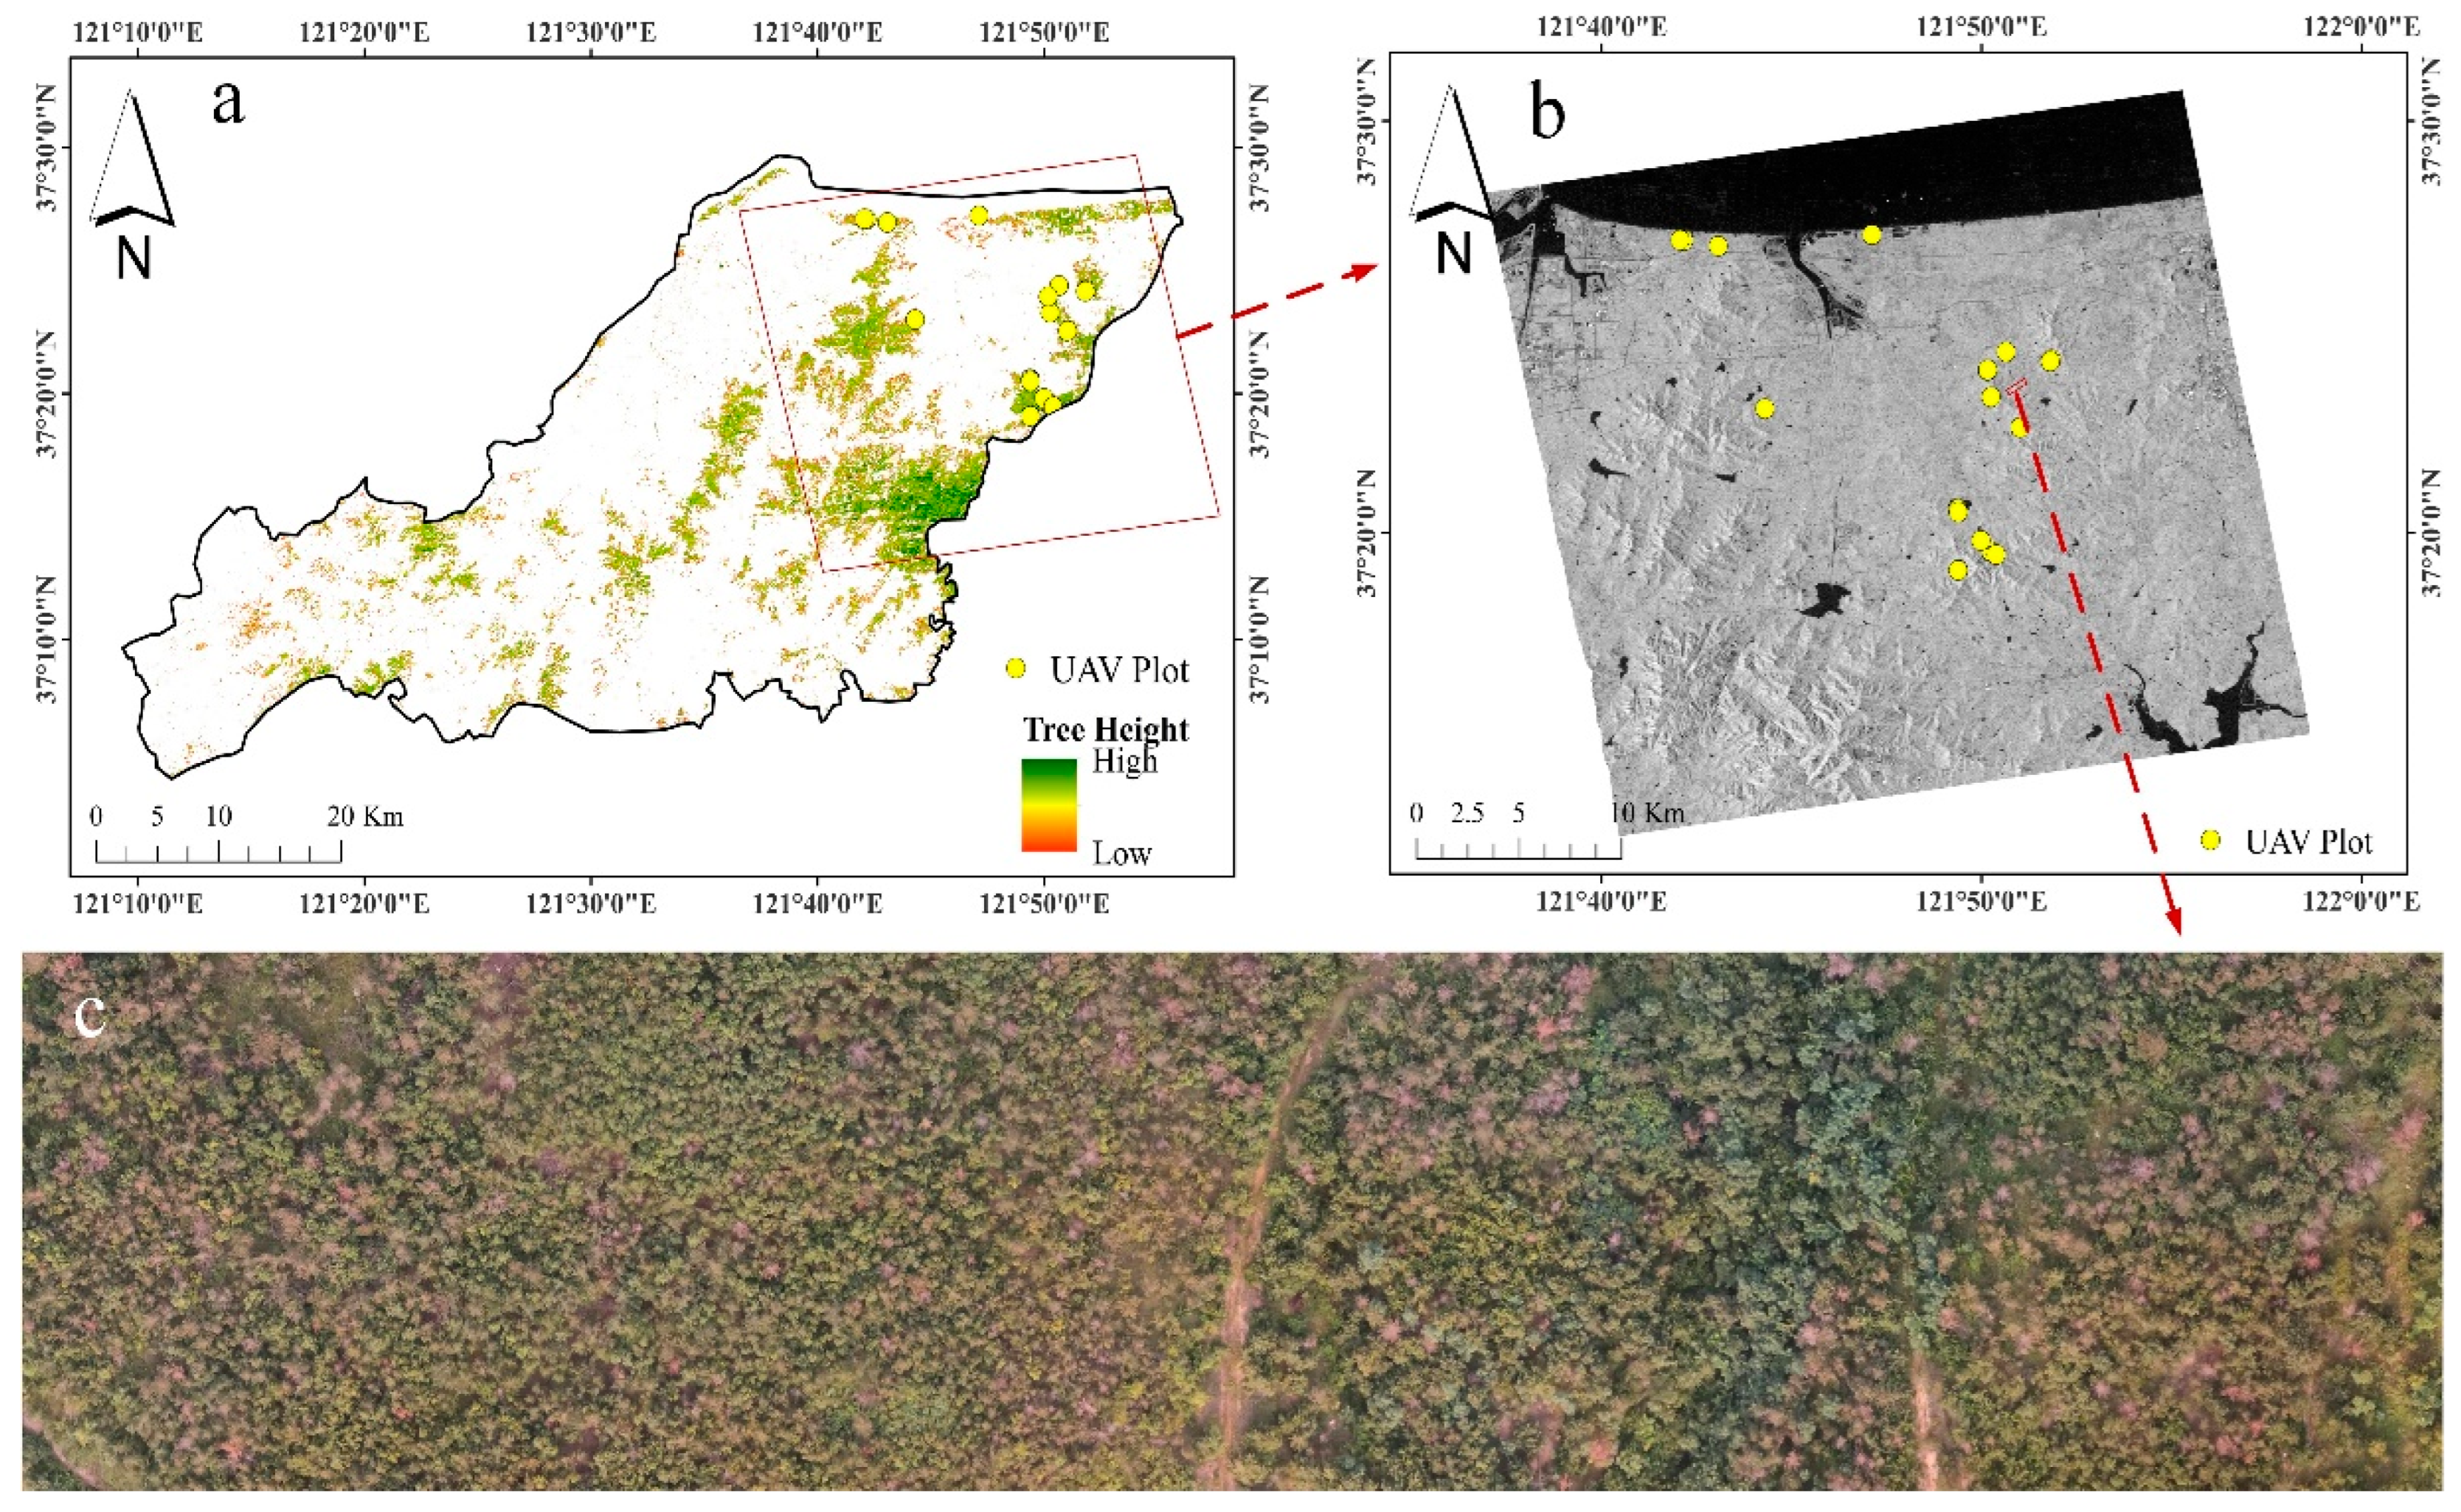
2.1. Study Area
2.2. UAV Field Campaign and Dataset
2.3. Radarsat-2 Imagery
2.4. Sentinel-1 Imagery
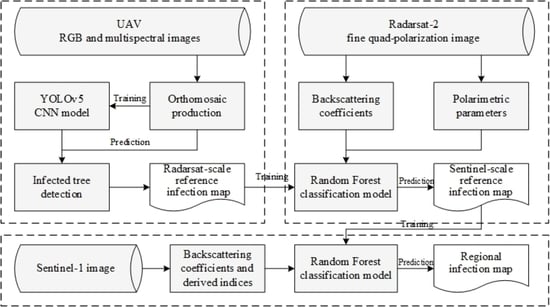
3. Methodology
3.1. UAV-Based PWN Infestation Modeling, Predicting, and Up-Sampling
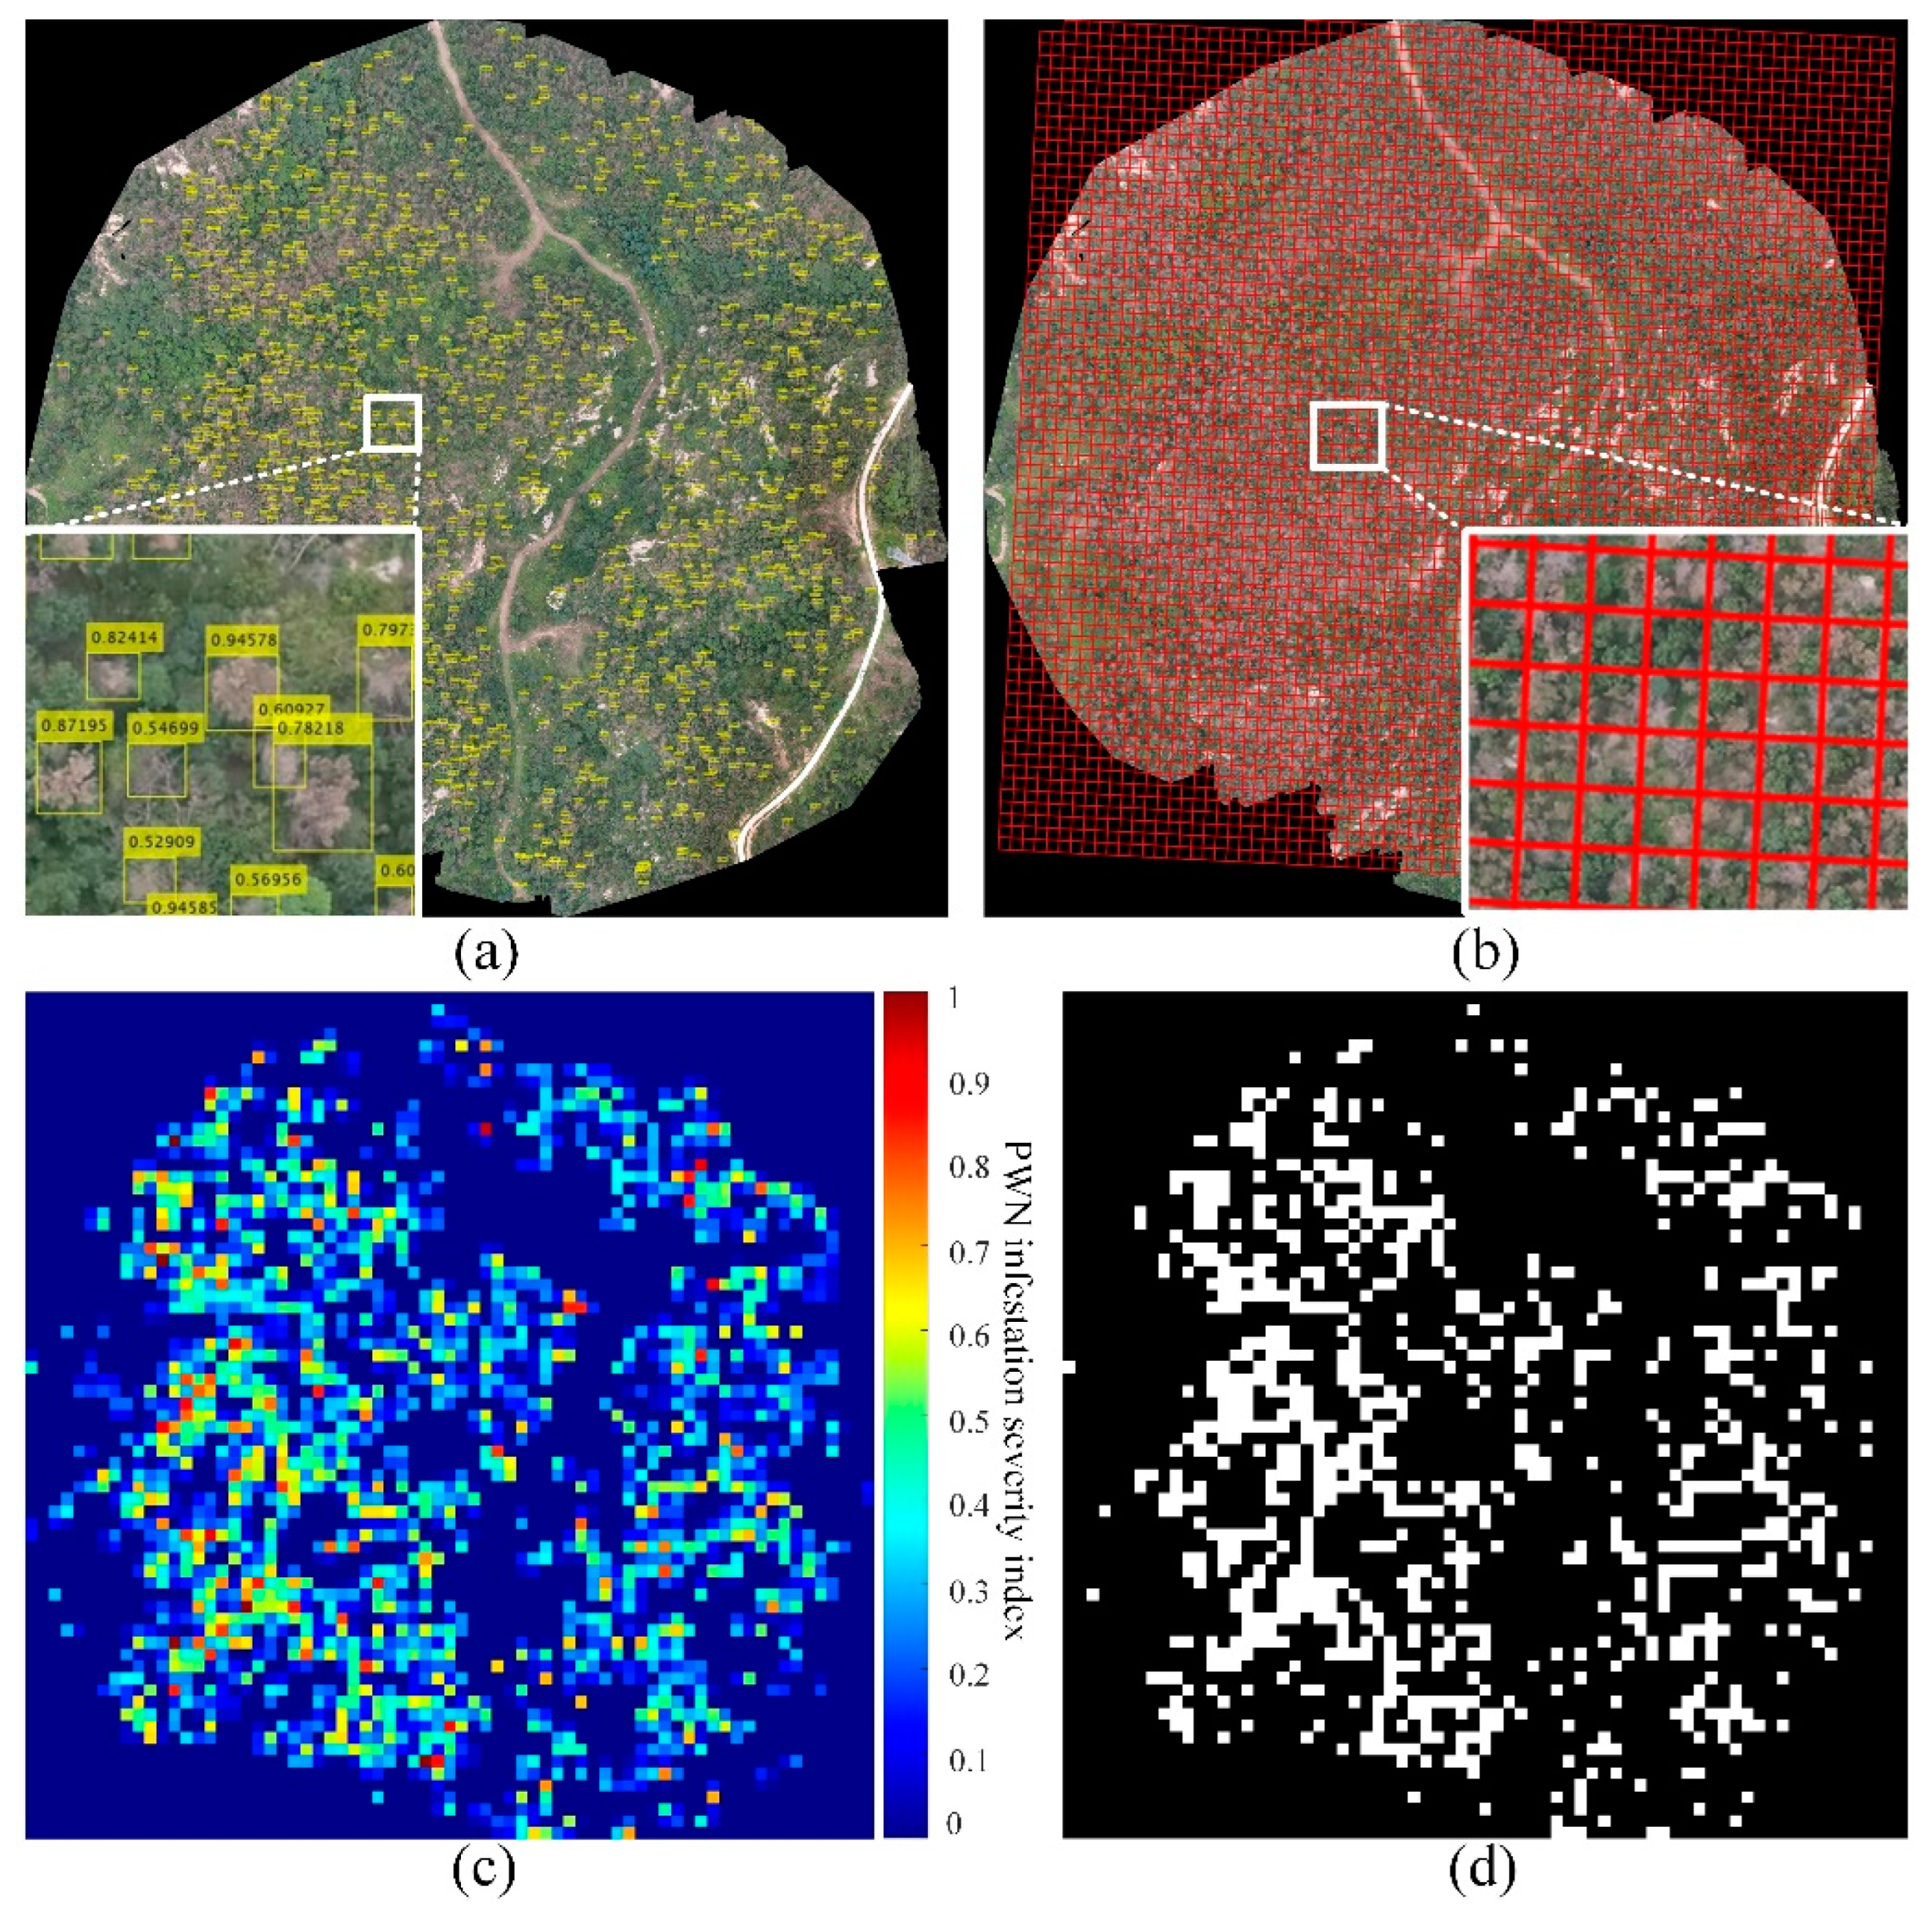
3.1.1. Labeling of Infested Trees on UAV Orthomosaic
3.1.2. Deep-Learning Modeling and Detection of Infested Trees
3.1.3. UAV-Based PWN Infestation Map and Up-Sampling
3.2. Radarsat-2-Based PWN Infestation Modeling, Prediction, and Up-Sampling
3.3. Sentinel-1-Based PWN Infestation Modeling and Predicting
4. Results
4.1. UAV-Level PWN Infestation Evaluation
4.2. Mapping PWN Infestation Map from Radarsat-2
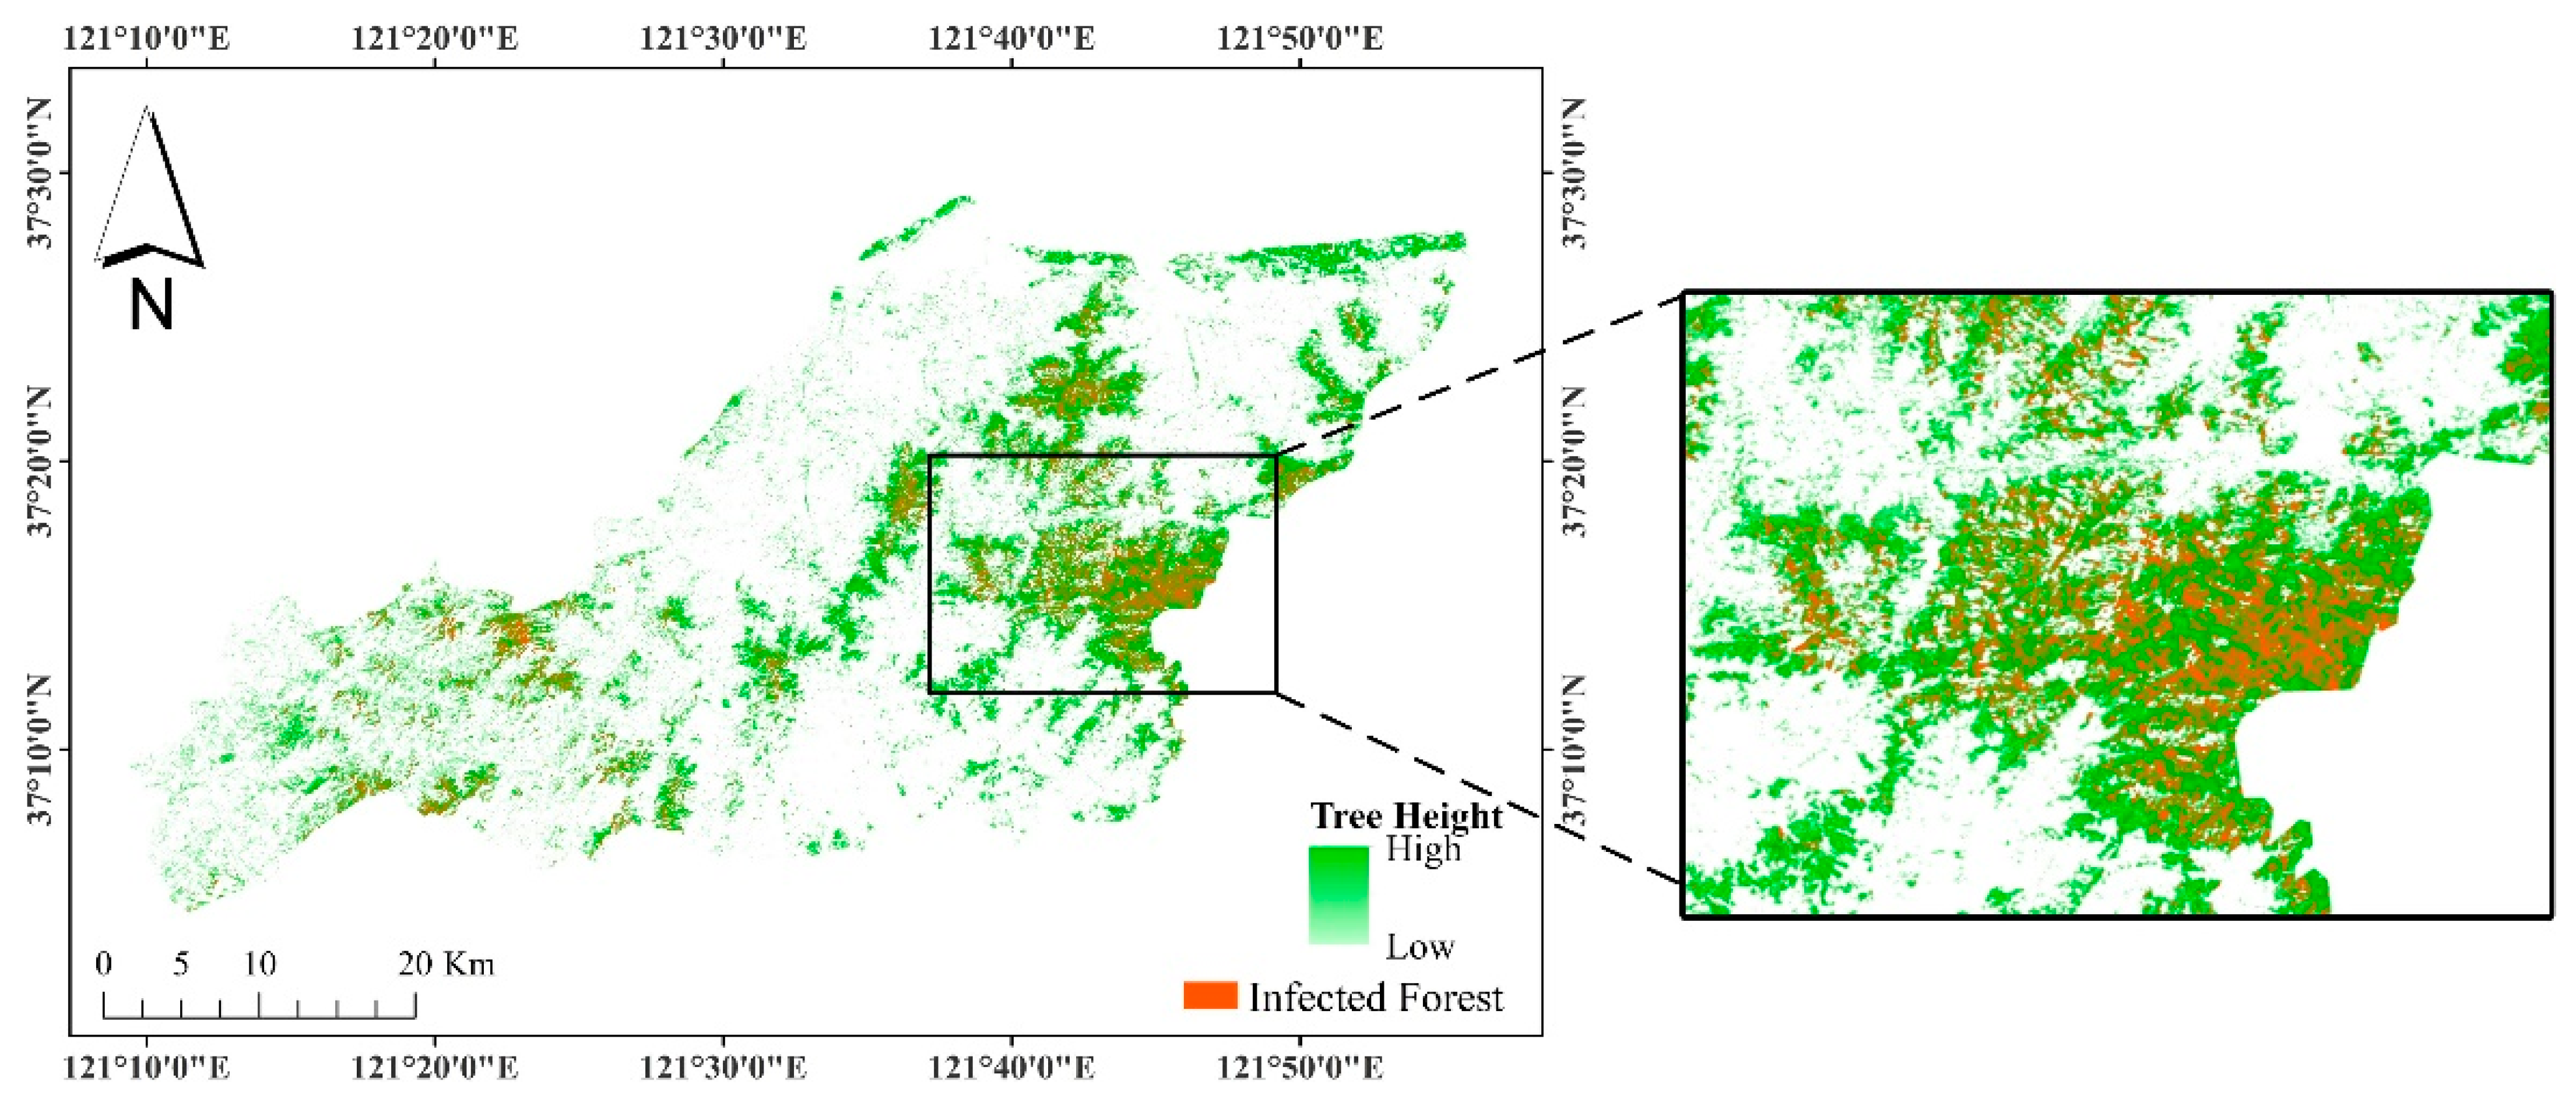
4.3. Sentinel-Level PWN Infestation Mapping
5. Discussion
6. Conclusions
Author Contributions
Funding
Data Availability Statement
Acknowledgments
Conflicts of Interest
References
- Hao, Z.; Huang, J.; Li, X.; Sun, H.; Fang, G. A multi-point aggregation trend of the outbreak of pine wilt disease in China over the past 20 years. For. Ecol. Manag. 2022, 505, 119890. [Google Scholar] [CrossRef]
- Yu, R.; Luo, Y.; Zhou, Q.; Zhang, X.; Wu, D.; Ren, L. A machine learning algorithm to detect pine wilt disease using UAV-based hyperspectral imagery and LiDAR data at the tree level. Int. J. Appl. Earth Obs. Geoinf. 2021, 101, 102363. [Google Scholar] [CrossRef]
- Meng, R.; Gao, R.; Zhao, F.; Huang, C.; Sun, R.; Lv, Z.; Huang, Z. Landsat-based monitoring of southern pine beetle infestation severity and severity change in a temperate mixed forest. Remote Sens. Environ. 2022, 269, 112847. [Google Scholar] [CrossRef]
- Dennison, P.E.; Brunelle, A.R.; Carter, V.A. Assessing canopy mortality during a mountain pine beetle outbreak using GeoEye-1 high spatial resolution satellite data. Remote Sens. Environ. 2010, 114, 2431–2435. [Google Scholar] [CrossRef]
- White, J.C.; Wulder, M.A.; Brooks, D.; Reich, R.; Wheate, R.D. Detection of red attack stage mountain pine beetle infestation with high spatial resolution satellite imagery. Remote Sens. Environ. 2005, 96, 340–351. [Google Scholar] [CrossRef]
- Coops, N.C.; Wulder, M.A.; White, J.C. Integrating remotely sensed and ancillary data sources to characterize a mountain pine beetle infestation. Remote Sens. Environ. 2006, 105, 83–97. [Google Scholar] [CrossRef]
- Li, L.; Mu, X.; Qi, J.; Pisek, J.; Roosjen, P.; Yan, G.; Huang, H.; Liu, S.; Baret, F. Characterizing reflectance anisotropy of background soil in open-canopy plantations using UAV-based multiangular images. ISPRS J. Photogramm. Remote Sens. 2021, 177, 263–278. [Google Scholar] [CrossRef]
- Berger, K.; Machwitz, M.; Kycko, M.; Kefauver, S.C.; Van Wittenberghe, S.; Gerhards, M.; Verrelst, J.; Atzberger, C.; van der Tol, C.; Damm, A.; et al. Multi-sensor spectral synergies for crop stress detection and monitoring in the optical domain: A review. Remote Sens. Environ. 2022, 280, 113198. [Google Scholar] [CrossRef] [PubMed]
- Lehmann, E.A.; Caccetta, P.; Lowell, K.; Mitchell, A.; Zhou, Z.S.; Held, A.; Milne, T.; Tapley, I. SAR and optical remote sensing: Assessment of complementarity and interoperability in the context of a large-scale operational forest monitoring system. Remote Sens. Environ. 2015, 156, 335–348. [Google Scholar] [CrossRef]
- Ballère, M.; Bouvet, A.; Mermoz, S.; Le Toan, T.; Koleck, T.; Bedeau, C.; André, M.; Forestier, E.; Frison, P.L.; Lardeux, C. SAR data for tropical forest disturbance alerts in French Guiana: Benefit over optical imagery. Remote Sens. Environ. 2021, 252, 112159. [Google Scholar] [CrossRef]
- Huo, L.; Persson, H.J.; Lindberg, E. Early detection of forest stress from European spruce bark beetle attack, and a new vegetation index: Normalized distance red & SWIR (NDRS). Remote Sens. Environ. 2021, 255, 112240. [Google Scholar] [CrossRef]
- Weiß, T.; Ramsauer, T.; Jagdhuber, T.; Löw, A.; Marzahn, P. Sentinel-1 Backscatter Analysis and Radiative Transfer Modeling of Dense Winter Wheat Time Series. Remote Sens. 2021, 13, 2320. [Google Scholar] [CrossRef]
- Ahmad, U.; Alvino, A.; Marino, S. A Review of Crop Water Stress Assessment Using Remote Sensing. Remote Sens. 2021, 13, 4155. [Google Scholar] [CrossRef]
- Tanase, M.A.; Kennedy, R.; Aponte, C. Radar Burn Ratio for fire severity estimation at canopy level: An example for temperate forests. Remote Sens. Environ. 2015, 170, 14–31. [Google Scholar] [CrossRef]
- Chen, Y.; Ma, L.; Yu, D.; Feng, K.; Wang, X.; Song, J. Improving Leaf Area Index Retrieval Using Multi-Sensor Images and Stacking Learning in Subtropical Forests of China. Remote Sens. 2021, 14, 148. [Google Scholar] [CrossRef]
- Melancon, A.M.; Molthan, A.L.; Griffin, R.E.; Mecikalski, J.R.; Schultz, L.A.; Bell, J.R. Random Forest Classification of Inundation Following Hurricane Florence (2018) via L-Band Synthetic Aperture Radar and Ancillary Datasets. Remote Sens. 2021, 13, 5098. [Google Scholar] [CrossRef]
- Fremout, T.; Cobián-De Vinatea, J.; Thomas, E.; Huaman-Zambrano, W.; Salazar-Villegas, M.; Limache-de la Fuente, D.; Bernardino, P.N.; Atkinson, R.; Csaplovics, E.; Muys, B. Site-specific scaling of remote sensing-based estimates of woody cover and aboveground biomass for mapping long-term tropical dry forest degradation status. Remote Sens. Environ. 2022, 276, 113040. [Google Scholar] [CrossRef]
- Huang, X.; Wang, J.; Shang, J.; Liao, C.; Liu, J. Application of polarization signature to land cover scattering mechanism analysis and classification using multi-temporal C-band polarimetric RADARSAT-2 imagery. Remote Sens. Environ. 2017, 193, 11–28. [Google Scholar] [CrossRef]
- Chauhan, S.; Darvishzadeh, R.; Boschetti, M.; Nelson, A. Discriminant analysis for lodging severity classification in wheat using RADARSAT-2 and Sentinel-1 data. ISPRS J. Photogramm. Remote Sens. 2020, 164, 138–151. [Google Scholar] [CrossRef]
- He, L.; Chen, W.; Leblanc, S.G.; Lovitt, J.; Arsenault, A.; Schmelzer, I.; Fraser, R.H.; Latifovic, R.; Sun, L.; Prévost, C.; et al. Integration of multi-scale remote sensing data for reindeer lichen fractional cover mapping in Eastern Canada. Remote Sens. Environ. 2021, 267, 112731. [Google Scholar] [CrossRef]
- Li, X.; Tong, T.; Luo, T.; Wang, J.; Rao, Y.; Li, L.; Jin, D.; Wu, D.; Huang, H. Retrieving the Infected Area of Pine Wilt Disease-Disturbed Pine Forests from Medium-Resolution Satellite Images Using the Stochastic Radiative Transfer Theory. Remote Sens. 2022, 14, 1526. [Google Scholar] [CrossRef]
- Li, L.; Chen, J.; Mu, X.; Li, W.; Yan, G.; Xie, D.; Zhang, W. Quantifying Understory and Overstory Vegetation Cover Using UAV-Based RGB Imagery in Forest Plantation. Remote Sens. 2020, 12, 298. [Google Scholar] [CrossRef] [Green Version]
- Li, L.; Mu, X.; Chianucci, F.; Qi, J.; Jiang, J.; Zhou, J.; Chen, L.; Huang, H.; Yan, G.; Liu, S. Ultrahigh-resolution boreal forest canopy mapping: Combining UAV imagery and photogrammetric point clouds in a deep-learning-based approach. Int. J. Appl. Earth Obs. Geoinf. 2022, 107, 102686. [Google Scholar] [CrossRef]
- Ferreira, M.P.; de Almeida, D.R.A.; de Almeida Papa, D.; Minervino, J.B.S.; Veras, H.F.P.; Formighieri, A.; Santos, C.A.N.; Ferreira, M.A.D.; Figueiredo, E.O.; Ferreira, E.J.L. Individual tree detection and species classification of Amazonian palms using UAV images and deep learning. For. Ecol. Manag. 2020, 475, 118397. [Google Scholar] [CrossRef]
- Schiefer, F.; Kattenborn, T.; Frick, A.; Frey, J.; Schall, P.; Koch, B.; Schmidtlein, S. Mapping forest tree species in high resolution UAV-based RGB-imagery by means of convolutional neural networks. ISPRS J. Photogramm. Remote Sens. 2020, 170, 205–215. [Google Scholar] [CrossRef]
- Osco, L.P.; Marcato Junior, J.; Marques Ramos, A.P.; de Castro Jorge, L.A.; Fatholahi, S.N.; de Andrade Silva, J.; Matsubara, E.T.; Pistori, H.; Gonçalves, W.N.; Li, J. A review on deep learning in UAV remote sensing. Int. J. Appl. Earth Obs. Geoinf. 2021, 102, 102456. [Google Scholar] [CrossRef]
- Nezami, S.; Khoramshahi, E.; Nevalainen, O.; Pölönen, I.; Honkavaara, E. Tree Species Classification of Drone Hyperspectral and RGB Imagery with Deep Learning Convolutional Neural Networks. Remote Sens. 2020, 12, 1070. [Google Scholar] [CrossRef] [Green Version]
- Hu, G.; Yin, C.; Wan, M.; Zhang, Y.; Fang, Y. Recognition of diseased Pinus trees in UAV images using deep learning and AdaBoost classifier. Biosyst. Eng. 2020, 194, 138–151. [Google Scholar] [CrossRef]
- Riihimäki, H.; Luoto, M.; Heiskanen, J. Estimating fractional cover of tundra vegetation at multiple scales using unmanned aerial systems and optical satellite data. Remote Sens. Environ. 2019, 224, 119–132. [Google Scholar] [CrossRef]
- Emilien, A.-V.; Thomas, C.; Thomas, H. UAV & satellite synergies for optical remote sensing applications: A literature review. Sci. Remote Sens. 2021, 3, 100019. [Google Scholar] [CrossRef]
- Mandal, D.; Kumar, V.; Ratha, D.; Lopez-Sanchez, J.M.; Bhattacharya, A.; McNairn, H.; Rao, Y.S.; Ramana, K.V. Assessment of rice growth conditions in a semi-arid region of India using the Generalized Radar Vegetation Index derived from RADARSAT-2 polarimetric SAR data. Remote Sens. Environ. 2020, 237, 111561. [Google Scholar] [CrossRef] [Green Version]
- Du, P.; Samat, A.; Waske, B.; Liu, S.; Li, Z. Random Forest and Rotation Forest for fully polarized SAR image classification using polarimetric and spatial features. ISPRS J. Photogramm. Remote Sens. 2015, 105, 38–53. [Google Scholar] [CrossRef]
- Redmon, J.; Farhadi, A. YOLO9000: Better, Faster, Stronger. In Proceedings of the IEEE Conference on Computer Vision and Pattern Recognition, Honolulu, HI, USA, 26 July 2017; pp. 6517–6525. [Google Scholar] [CrossRef]
- Zhu, X.; Lyu, S.; Wang, X.; Zhao, Q. TPH-YOLOv5: Improved YOLOv5 Based on Transformer Prediction Head for Object Detection on Drone-captured Scenarios. Proc. IEEE Int. Conf. Comput. Vis. 2021, 2021, 2778–2788. [Google Scholar] [CrossRef]
- Martinuzzi, S.; Vierling, L.A.; Gould, W.A.; Falkowski, M.J.; Evans, J.S.; Hudak, A.T.; Vierling, K.T. Mapping snags and understory shrubs for a LiDAR-based assessment of wildlife habitat suitability. Remote Sens. Environ. 2009, 113, 2533–2546. [Google Scholar] [CrossRef] [Green Version]
- Kattenborn, T.; Lopatin, J.; Förster, M.; Braun, A.C.; Fassnacht, F.E. UAV data as alternative to field sampling to map woody invasive species based on combined Sentinel-1 and Sentinel-2 data. Remote Sens. Environ. 2019, 227, 61–73. [Google Scholar] [CrossRef]
- Ho, T.K. The random subspace method for constructing decision forests. IEEE Trans. Pattern Anal. Mach. Intell. 1998, 20, 832–844. [Google Scholar] [CrossRef] [Green Version]
- Shafizadeh-Moghadam, H. Fully component selection: An efficient combination of feature selection and principal component analysis to increase model performance. Expert Syst. Appl. 2021, 186, 115678. [Google Scholar] [CrossRef]
- Freeman, A.; Durden, S.L. A three-component scattering model for polarimetric SAR data. IEEE Trans. Geosci. Remote Sens. 1998, 36, 963–973. [Google Scholar] [CrossRef] [Green Version]
- Yamaguchi, H.; Calado, R.T.; Ly, H.; Kajigaya, S.; Baerlocher, G.M.; Chanock, S.J.; Lansdorp, P.M.; Young, N.S. Mutations in TERT, the gene for telomerase reverse transcriptase, in aplastic anemia. N. Engl. J. Med. 2005, 352, 1413–1424. [Google Scholar] [CrossRef] [PubMed]
- Cloude, S.R.; Pettier, E. A review of target decomposition theorems in radar polarimetry. IEEE Trans. Geosci. Remote Sens. 1996, 34, 498–518. [Google Scholar] [CrossRef]
- Touzi, R. Target scattering decomposition in terms of roll-invariant target parameters. IEEE Trans. Geosci. Remote Sens. 2007, 45, 73–84. [Google Scholar] [CrossRef]
- Van Zyl, J.J.; Arii, M.; Kim, Y. Model-based decomposition of polarimetric SAR covariance matrices constrained for nonnegative eigenvalues. IEEE Trans. Geosci. Remote Sens. 2011, 49, 3452–3459. [Google Scholar] [CrossRef]
- Krogager, E.; Boerner, W.-M.; Madsen, S.N. Feature-motivated Sinclair matrix (sphere/diplane/helix) decomposition and its application to target sorting for land feature classification. In Wideband Interferometric Sensing and Imaging Polarimetry; SPIE: Washington, DC, USA, 1997; Volume 3120, pp. 144–154. [Google Scholar] [CrossRef]
- Puliti, S.; Astrup, R. Automatic detection of snow breakage at single tree level using YOLOv5 applied to UAV imagery. Int. J. Appl. Earth Obs. Geoinf. 2022, 112, 102946. [Google Scholar] [CrossRef]
- Stow, D.A.; Hope, A.; McGuire, D.; Verbyla, D.; Gamon, J.; Huemmrich, F.; Houston, S.; Racine, C.; Sturm, M.; Tape, K.; et al. Remote sensing of vegetation and land-cover change in Arctic Tundra Ecosystems. Remote Sens. Environ. 2004, 89, 281–308. [Google Scholar] [CrossRef] [Green Version]
- Ye, S.; Rogan, J.; Zhu, Z.; Hawbaker, T.J.; Hart, S.J.; Andrus, R.A.; Meddens, A.J.H.; Hicke, J.A.; Eastman, J.R.; Kulakowski, D. Detecting subtle change from dense Landsat time series: Case studies of mountain pine beetle and spruce beetle disturbance. Remote Sens. Environ. 2021, 263, 112560. [Google Scholar] [CrossRef]
- Olofsson, P.; Foody, G.M.; Herold, M.; Stehman, S.V.; Woodcock, C.E.; Wulder, M.A. Good practices for estimating area and assessing accuracy of land change. Remote Sens. Environ. 2014, 148, 42–57. [Google Scholar] [CrossRef]
- Pontius, R.G.; Millones, M. Death to Kappa: Birth of quantity disagreement and allocation disagreement for accuracy assessment. Int. J. Remote Sens. 2011, 32, 4407–4429. [Google Scholar] [CrossRef]
- Johnson, B.A. Scale Issues Related to the Accuracy Assessment of Land Use/Land Cover Maps Produced Using Multi-Resolution Data: Comments on “The Improvement of Land Cover Classification by Thermal Remote Sensing”. Remote Sens. 2015, 7, 13436–13439. [Google Scholar] [CrossRef]
- Guo, X.; Wang, M.; Jia, M.; Wang, W. Estimating mangrove leaf area index based on red-edge vegetation indices: A comparison among UAV, WorldView-2 and Sentinel-2 imagery. Int. J. Appl. Earth Obs. Geoinf. 2021, 103, 102493. [Google Scholar] [CrossRef]
- Millard, K.; Richardson, M. Quantifying the relative contributions of vegetation and soil moisture conditions to polarimetric C-Band SAR response in a temperate peatland. Remote Sens. Environ. 2018, 206, 123–138. [Google Scholar] [CrossRef]
- Zhao, D.; Arshad, M.; Wang, J.; Triantafilis, J. Soil exchangeable cations estimation using Vis-NIR spectroscopy in different depths: Effects of multiple calibration models and spiking. Comput. Electron. Agric. 2021, 182, 105990. [Google Scholar] [CrossRef]


| Data Source | Wave Length | Acquisition Time | Resolution | Data Coverage |
|---|---|---|---|---|
| UAV | RGB | 15–20 August 2021 | ~5 cm | 17 plots |
| Radarsat-2 | C-band | 5 September 2021 | ~8 m | Part of Muping district |
| Sentinel-1 | C-band | 15 September 2021 | 30 m (Resampled) | Entire Muping district |
| Methods | Input Variables | Reference |
|---|---|---|
| Backscattering-derived parameters | ||
| Indices | Span, PH, RVI, RFDI, CSI, VSI | [19] |
| Polarimetric decomposition parameters | ||
| Freeman–Durden | Freeman_dbl 1, Freeman_surf 2, Freeman_vol 3 | [39] |
| Yamaguchi | Yamaguchi_dbl, Yamaguchi_surf, Yamaguchi_vol, Yamaguchi_hlx | [40] |
| Cloude | Cloude_dbl, Cloude_surf, Cloude_vol | [41] |
| Touzi | Touzi_alpha, Touzi_phi, Touzi_psi, Touzi_tau | [42] |
| Van Zyl | VanZyl_dbl, VanZyl_surf, VanZyl_vol_g | [43] |
| H/α/A | alpha, anisotropy, entropy | [41] |
| Sinclair | Sinclair_1, Sinclair_2, Sinclair_3 | [44] |
| Pauli | Pauli_1, Pauli_2, Pauli_3 | [41] |
| Input Variables | Formula |
|---|---|
| Backscattering coefficient | , |
| Normalized difference polarimetric ratio (NDPR) | |
| Polarimetric Ratio (PR) | |
| Radar vegetation index (RVI) |
| Random Forest | Radarsat-2 | Sentinel-1 | ||
|---|---|---|---|---|
| Infested | Healthy | Infested | Healthy | |
| Infested | 80.67% | 37.50% | 83.07% | 12.37% |
| Healthy | 19.33% | 62.50% | 16.93% | 87.63% |
| Overall accuracy | 72.57% | 85.04% | ||
| Kappa coefficient | 0.44 | 0.70 | ||
Publisher’s Note: MDPI stays neutral with regard to jurisdictional claims in published maps and institutional affiliations. |
© 2022 by the authors. Licensee MDPI, Basel, Switzerland. This article is an open access article distributed under the terms and conditions of the Creative Commons Attribution (CC BY) license (https://creativecommons.org/licenses/by/4.0/).
Share and Cite
Li, X.; Liu, Y.; Huang, P.; Tong, T.; Li, L.; Chen, Y.; Hou, T.; Su, Y.; Lv, X.; Fu, W.; et al. Integrating Multi-Scale Remote-Sensing Data to Monitor Severe Forest Infestation in Response to Pine Wilt Disease. Remote Sens. 2022, 14, 5164. https://doi.org/10.3390/rs14205164
Li X, Liu Y, Huang P, Tong T, Li L, Chen Y, Hou T, Su Y, Lv X, Fu W, et al. Integrating Multi-Scale Remote-Sensing Data to Monitor Severe Forest Infestation in Response to Pine Wilt Disease. Remote Sensing. 2022; 14(20):5164. https://doi.org/10.3390/rs14205164
Chicago/Turabian StyleLi, Xiujuan, Yongxin Liu, Pingping Huang, Tong Tong, Linyuan Li, Yuejuan Chen, Ting Hou, Yun Su, Xiaoqi Lv, Wenxue Fu, and et al. 2022. "Integrating Multi-Scale Remote-Sensing Data to Monitor Severe Forest Infestation in Response to Pine Wilt Disease" Remote Sensing 14, no. 20: 5164. https://doi.org/10.3390/rs14205164