Article

A Calculation Model for Ground Surface Temperature in High-Altitude Regions of the Qinghai-Tibet Plateau, China

1
School of Civil Engineering and Hydraulic Engineering, Ningxia University, Yinchuan 750021, China
2
State Key Laboratory of Frozen Soil Engineering, Northwest Institute of Eco-Environment and Resources, Chinese Academy of Sciences, Lanzhou 730000, China
3
University of Chinese Academy of Sciences, Beijing 100049, China
*
Author to whom correspondence should be addressed.
Remote Sens. 2022, 14(20), 5219; https://doi.org/10.3390/rs14205219
Submission received: 23 August 2022 / Revised: 12 October 2022 / Accepted: 17 October 2022 / Published: 18 October 2022
(This article belongs to the Special Issue Remote Sensing and Land Surface Process Models for Permafrost Studies)

Abstract

:
As a major parameter in the energy balance of the ground surface, temperature represents the level of exchange of energy and moisture between the ground and air. The Qinghai-Tibet Plateau (QTP) has the permafrost region with the highest altitude and the largest area in low–middle latitude of the world. The variation in ground surface temperature has an impact on the existence and development of the permafrost. Therefore, the analysis of the ground surface temperature in the QTP is significant to reflect the energy exchange in permafrost regions. This paper collected solar radiation data and calculated the conversion coefficient from total solar radiation to long-wave radiation of the ground surface on different underlying surfaces. The ground surface temperature was inversely calculated and modified based on the reception of solar radiation on different underlying surfaces. A simplified calculation model of ground surface temperature was built to reflect the ground surface temperature on different underlying surfaces of the QTP. The calculation results were compared with MODIS and showed good fitness, providing a systematic and reliable method for calculating the ground surface temperature on the QTP. The above model plays a significant role in the estimation of soil moisture, ground surface energy and water balance.

1. Introduction

As a typical interior plateau in Asia, the Qinghai-Tibet Plateau (QTP) covers 2.5 million km2 and the average altitude is higher than 4000 m; it is the largest plateau in China and the highest plateau in the world. The solar radiation controls the balance of ground surface radiation, energy exchange and the climate system. The influence factors of total solar radiation include water vapor content, visibility, aerosol, cloud, precipitation, latitude and altitude. The QTP has the largest area of permafrost in low–middle latitude of the world, in which the variation in the permafrost will affect the formation, change and development of the climate in Eastern China and East Asia. As the key parameter of the energy balance in the ground surface, the ground surface temperature reflects the exchange of energy and moisture between the ground surface and air [1]. Under the scenario of climate warming, the mean ground surface temperature has increased by 0.85 °C, which affects the existence and development of permafrost [2]. The thawing of the permafrost will release the methane and CO2 stored in the permafrost, conversely facilitating the increase in climate warming [3,4,5]. Otherwise, the ground surface temperature is a key parameter of the ground heating field. The diurnal variation of the heating field in the QTP will cause the diurnal variation of the air flow field and affects the weather process in adjacent regions via the diurnal variation of local circulation in the QTP and surrounding regions [6].
The ground surface temperature was explored by several researchers, with promising achievements. The annual variation in ground surface temperature can be calculated by a theoretical model including solar radiation and the sun angle. Dumais et al. proposed a simplified model for calculating the road surface temperature. The model was inversely related to the surface temperature by inputting the data of road albedo, air temperature, wind speed and solar radiation [7]. Wang et al. analyzed the influence of solar radiation on the pavement type and underlying permafrost. The pavement surface temperature was inversely calculated by total radiation and atmospheric temperature, which provided a parameterized method for the calculation of the pavement surface temperature [8]. Hu et al. provided another parameterized method for the calculation of the surface temperature of an embankment and its slope in the Qinghai-Tibet Railway based on the absorbed solar radiation by the ground surface [9].
Moreover, the ground surface temperature can be inversely calculated by remote sensing technology. Weng et al. provided an integrated calculation method of ground surface temperature in permafrost regions of the QTP based on multi-source remote sensing [10]. Hu et al. built a down-scaling method to calculate the ground surface temperature based on the diurnal temperature cycle of the ground surface, which can obtain the ground surface temperature under the conditions of a sunny and cloudy sky [11]. Wu et al. proposed a model to calculate the glacier surface temperature combined with the Jiménez–Muoz (JM) model and Landsat 8 data [12]. Shen et al. explored the influence of temporal and spatial scale on the ground surface temperature (MODISLST) and air temperature, to seek an optimal temporal–spatial scale to improve the accuracy of calculation of the ground surface temperature using a MODIS dataset [13]. Zhou et al. proposed an improved temperature and emissivity separation (TES) algorithm, and the improved TES algorithm can be used to accurately derive LST&E from AHI data [14]. The existing temperature calculation model mainly focuses on the Qinghai-Tibet Engineering Corridor, which is based on monitoring data. The calculation results represent the given condition and not all the underlying surfaces.
As a key boundary condition for numerical simulation, the ground surface temperature can be fitted by field-measured data. The temperature variation can be precisely obtained by the above fitting method; however, the temperature distribution in the study region cannot be reflected. Hu et al. have fitted the regression equation of the temperature boundary based on measured temperature data along the Qinghai-Tibet Highway at the mileage of K2968 + 200 in the Qinghai-Tibet Plateau [15]. The temperature variation of the ground surface on both sides of an embankment was analyzed along the QTH and QTR. The correlation between the surface temperature of the embankment slope and the theoretical radiation value was revealed based on the field measurement results. Chou et al. built a regression equation to connect the ground temperature at 0.5 m depth and the radiation difference [16]. Huang et al. built a model to reflect the relationship between air temperature, wind speed, soil moisture and ground surface temperature. It is known from the above model that the ground surface temperature has an obvious response to air temperature throughout the whole year, has an obvious response to wind speed in winter and summer and has an obvious response to soil moisture in summer [17].
The incidence distribution of solar radiation is significant to the hydrology, ecology and carbon balance of a region. The atmospheric transmissivity has an influence on the energy budget on the ground surface by solar radiation incidence. The strong solar radiation on the Qinghai-Tibet Plateau, with high altitude, has a more obvious influence on the energy budget than in other regions. The present research on the inversion of the ground surface temperature mainly focuses on the Qinghai-Tibet Engineering Corridor, which can only reflect the specific engineering condition due to the lack of field-monitored data within a large range [18]. The boundary layer theory can calculate the underlying surface temperature based on air temperature. However, the temperature increase value cannot systematically represent the condition of each underlying surface due to the complexity of the field and radiation differences on the embankment slope surface [19]. This paper extracted the ground surface temperature from MODIS data on the different underlying surfaces of the Qinghai-Tibet Plateau (QTP) and analyzed the temperature characteristics on six types of underlying surface. The coefficient of conversion rate and correction was obtained in the above underlying surface, which provides a reliable calculation method for the temperature inversion in different underlying surfaces on the QTP.

2. Materials and Methods

2.1. Study Region and Data
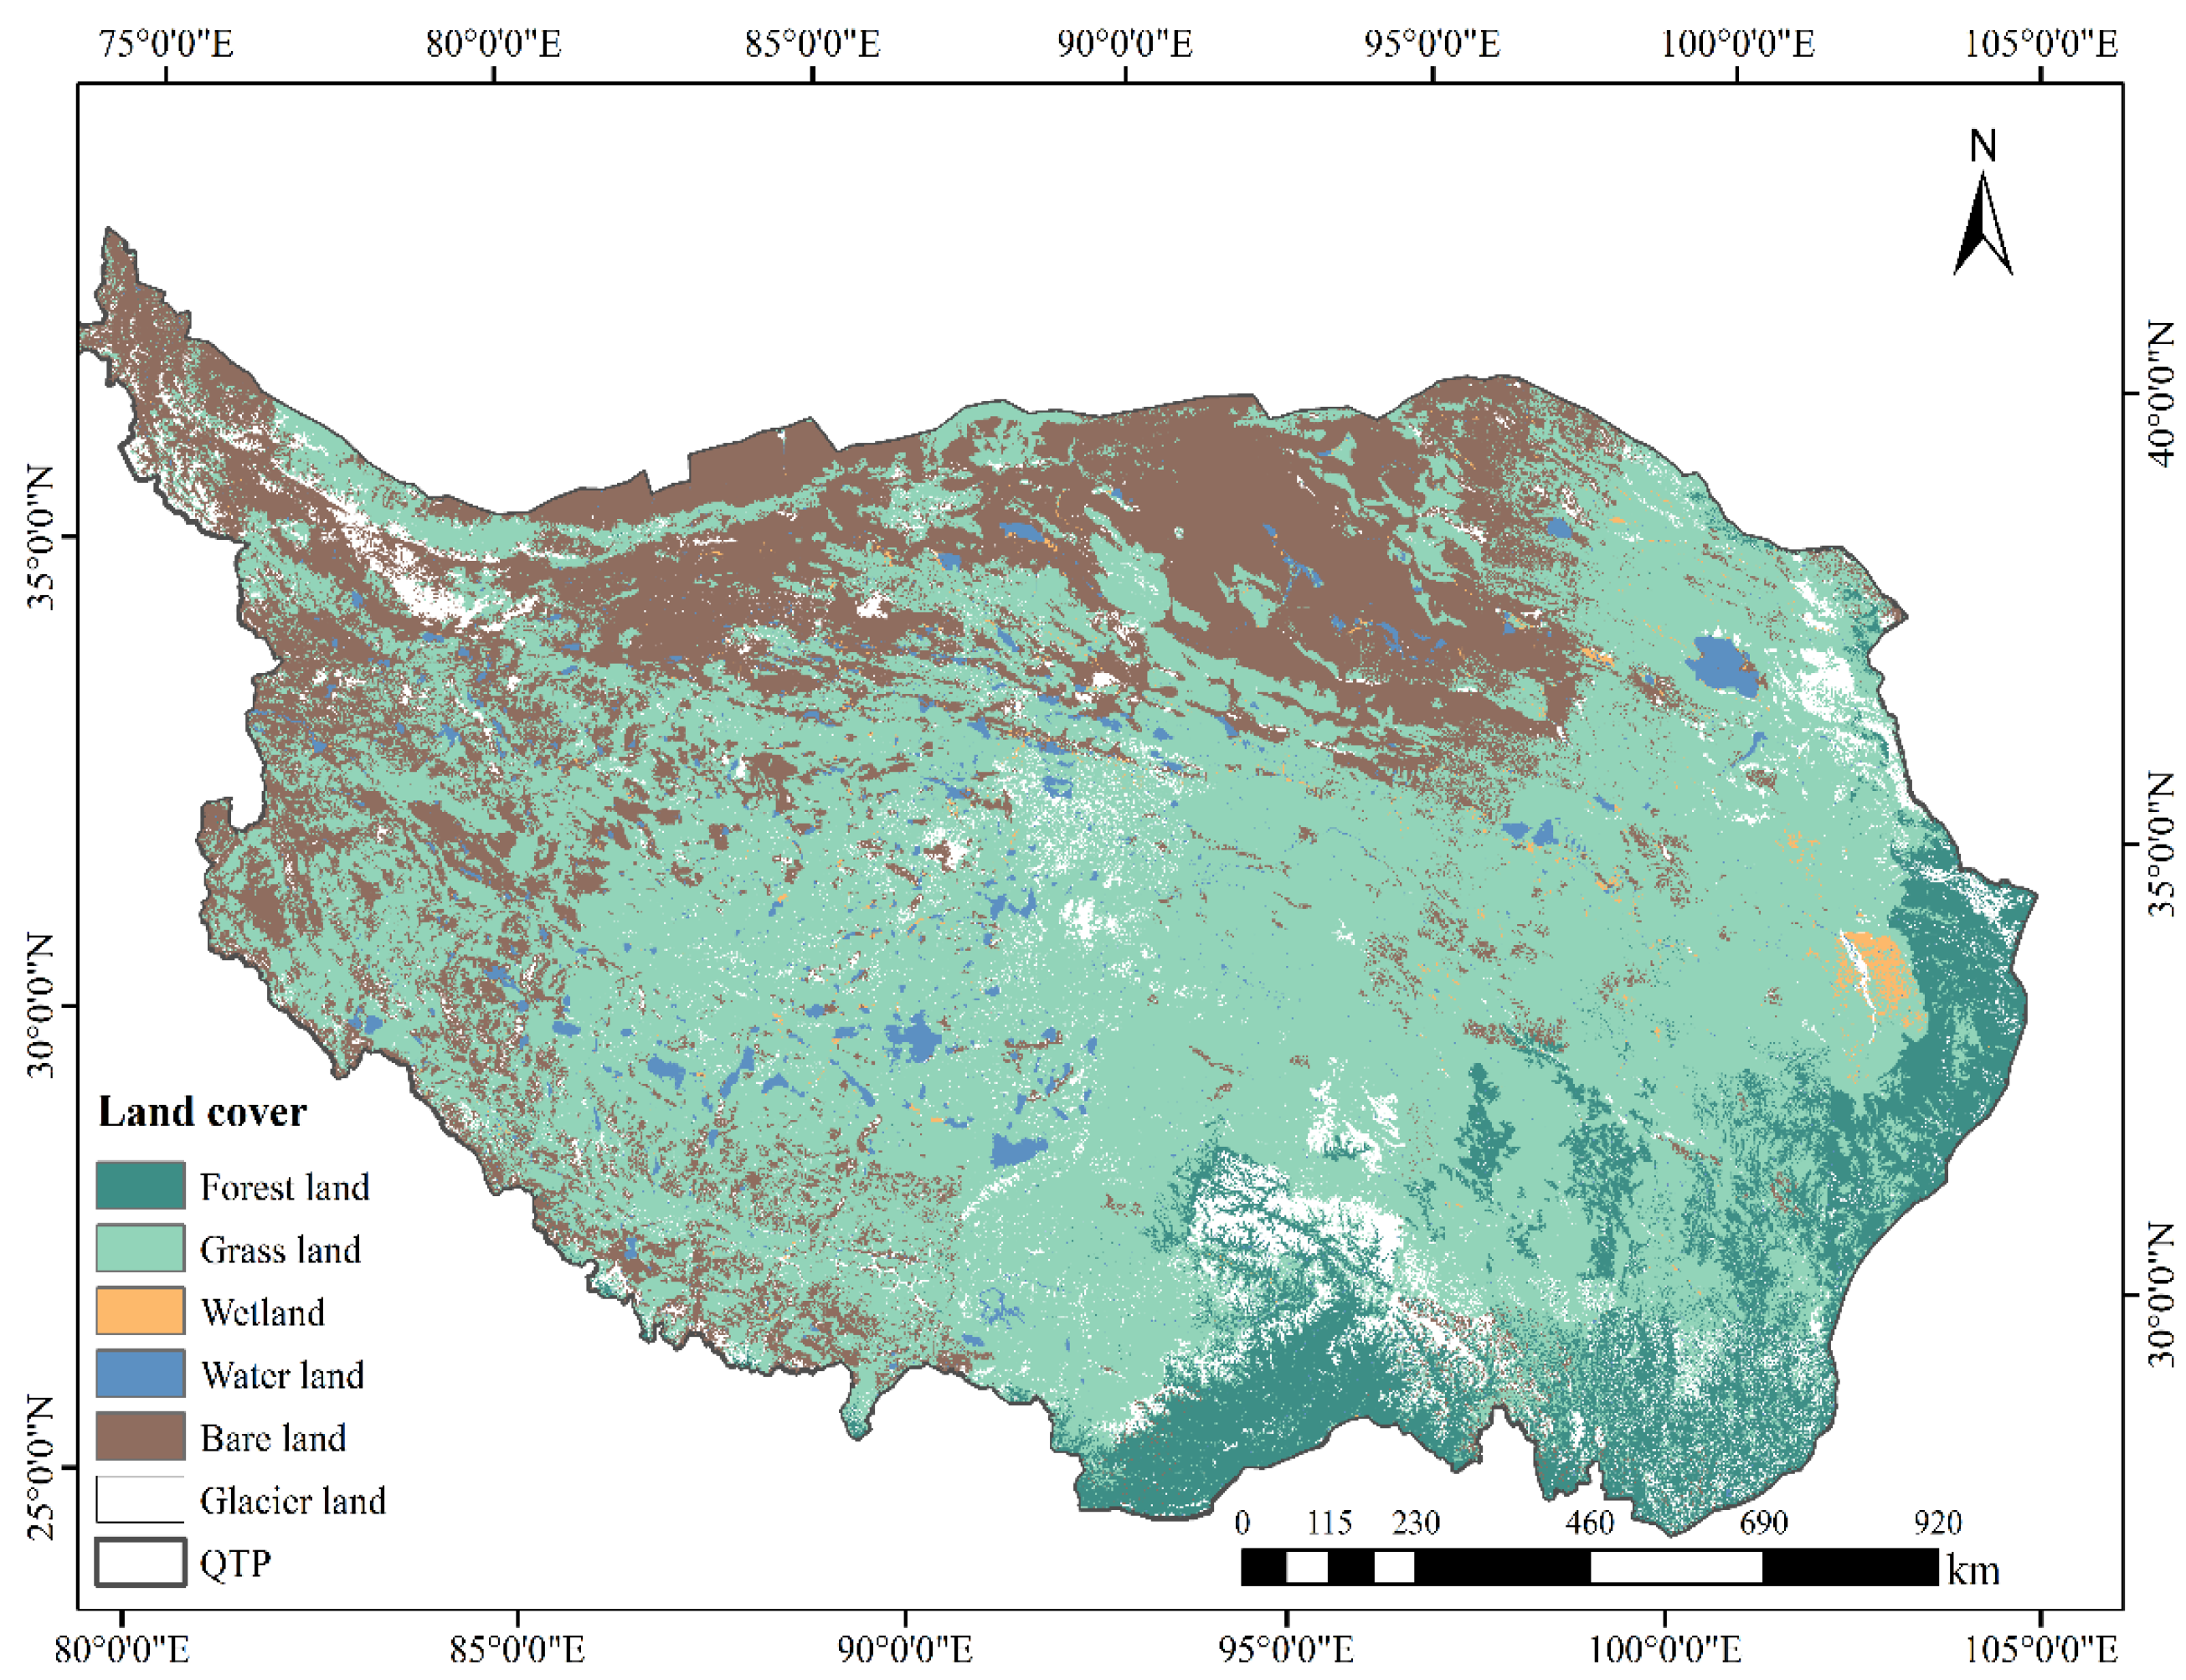
2.1.1. Study Region

The study region in this paper is the QTP (26°00′12″N~39°46′50″N, 73°18′52″E~104°46′59″E), which is located in the south-west of China. The altitude of the QTP is above 4000 m, and it is referred to as “the roof of the world”. The unique local environment has created different underlying surfaces, including bare land, wetland, grassland, forests, shrub land, water bodies, building land and glaciers (Figure 1).

2.1.2. Data

The digital elevation model (DEM) was provided by the Geospatial Data Cloud site, Computer Network Information Center, Chinese Academy of Sciences (http://www.gscloud.cn (accessed on 1 December 2021)). The land cover dataset was from the GlobeLand30 (http://www.globallandcover.com (accessed on 1 December 2021)), which comprises datasets collected at 30-m resolution, more than ten times that of previous datasets. The above datasets are valuable for monitoring environmental changes and for resource management at global, regional and local scales. The overall accuracy of the GlobeLand30 V2020 and the Kappa coefficient are 85.72% and 0.82, respectively. The land cover dataset is shown in Table 1.
The MODIS MOD11A2 dataset of ground surface temperature was provided by the Geospatial Data Cloud site, Computer Network Information Center, Chinese Academy of Sciences (http://www.gscloud.cn (accessed on 1 December 2021)). The dataset was merged, projected, clipped and converted to obtain the ground surface temperature in the QTP with a 1 km resolution.

2.2. Ground Surface Temperature Calculation Model

Based on the Stefan–Boltzmann Law, the radiant temperature on different underlying surfaces was calculated by the long-wave radiation of the ground surface. The conversion scale from the total solar radiation to long-wave radiation of the ground surface is different on different underlying surfaces, among which the heat exchange is different and is represented as the value of ground surface temperature.

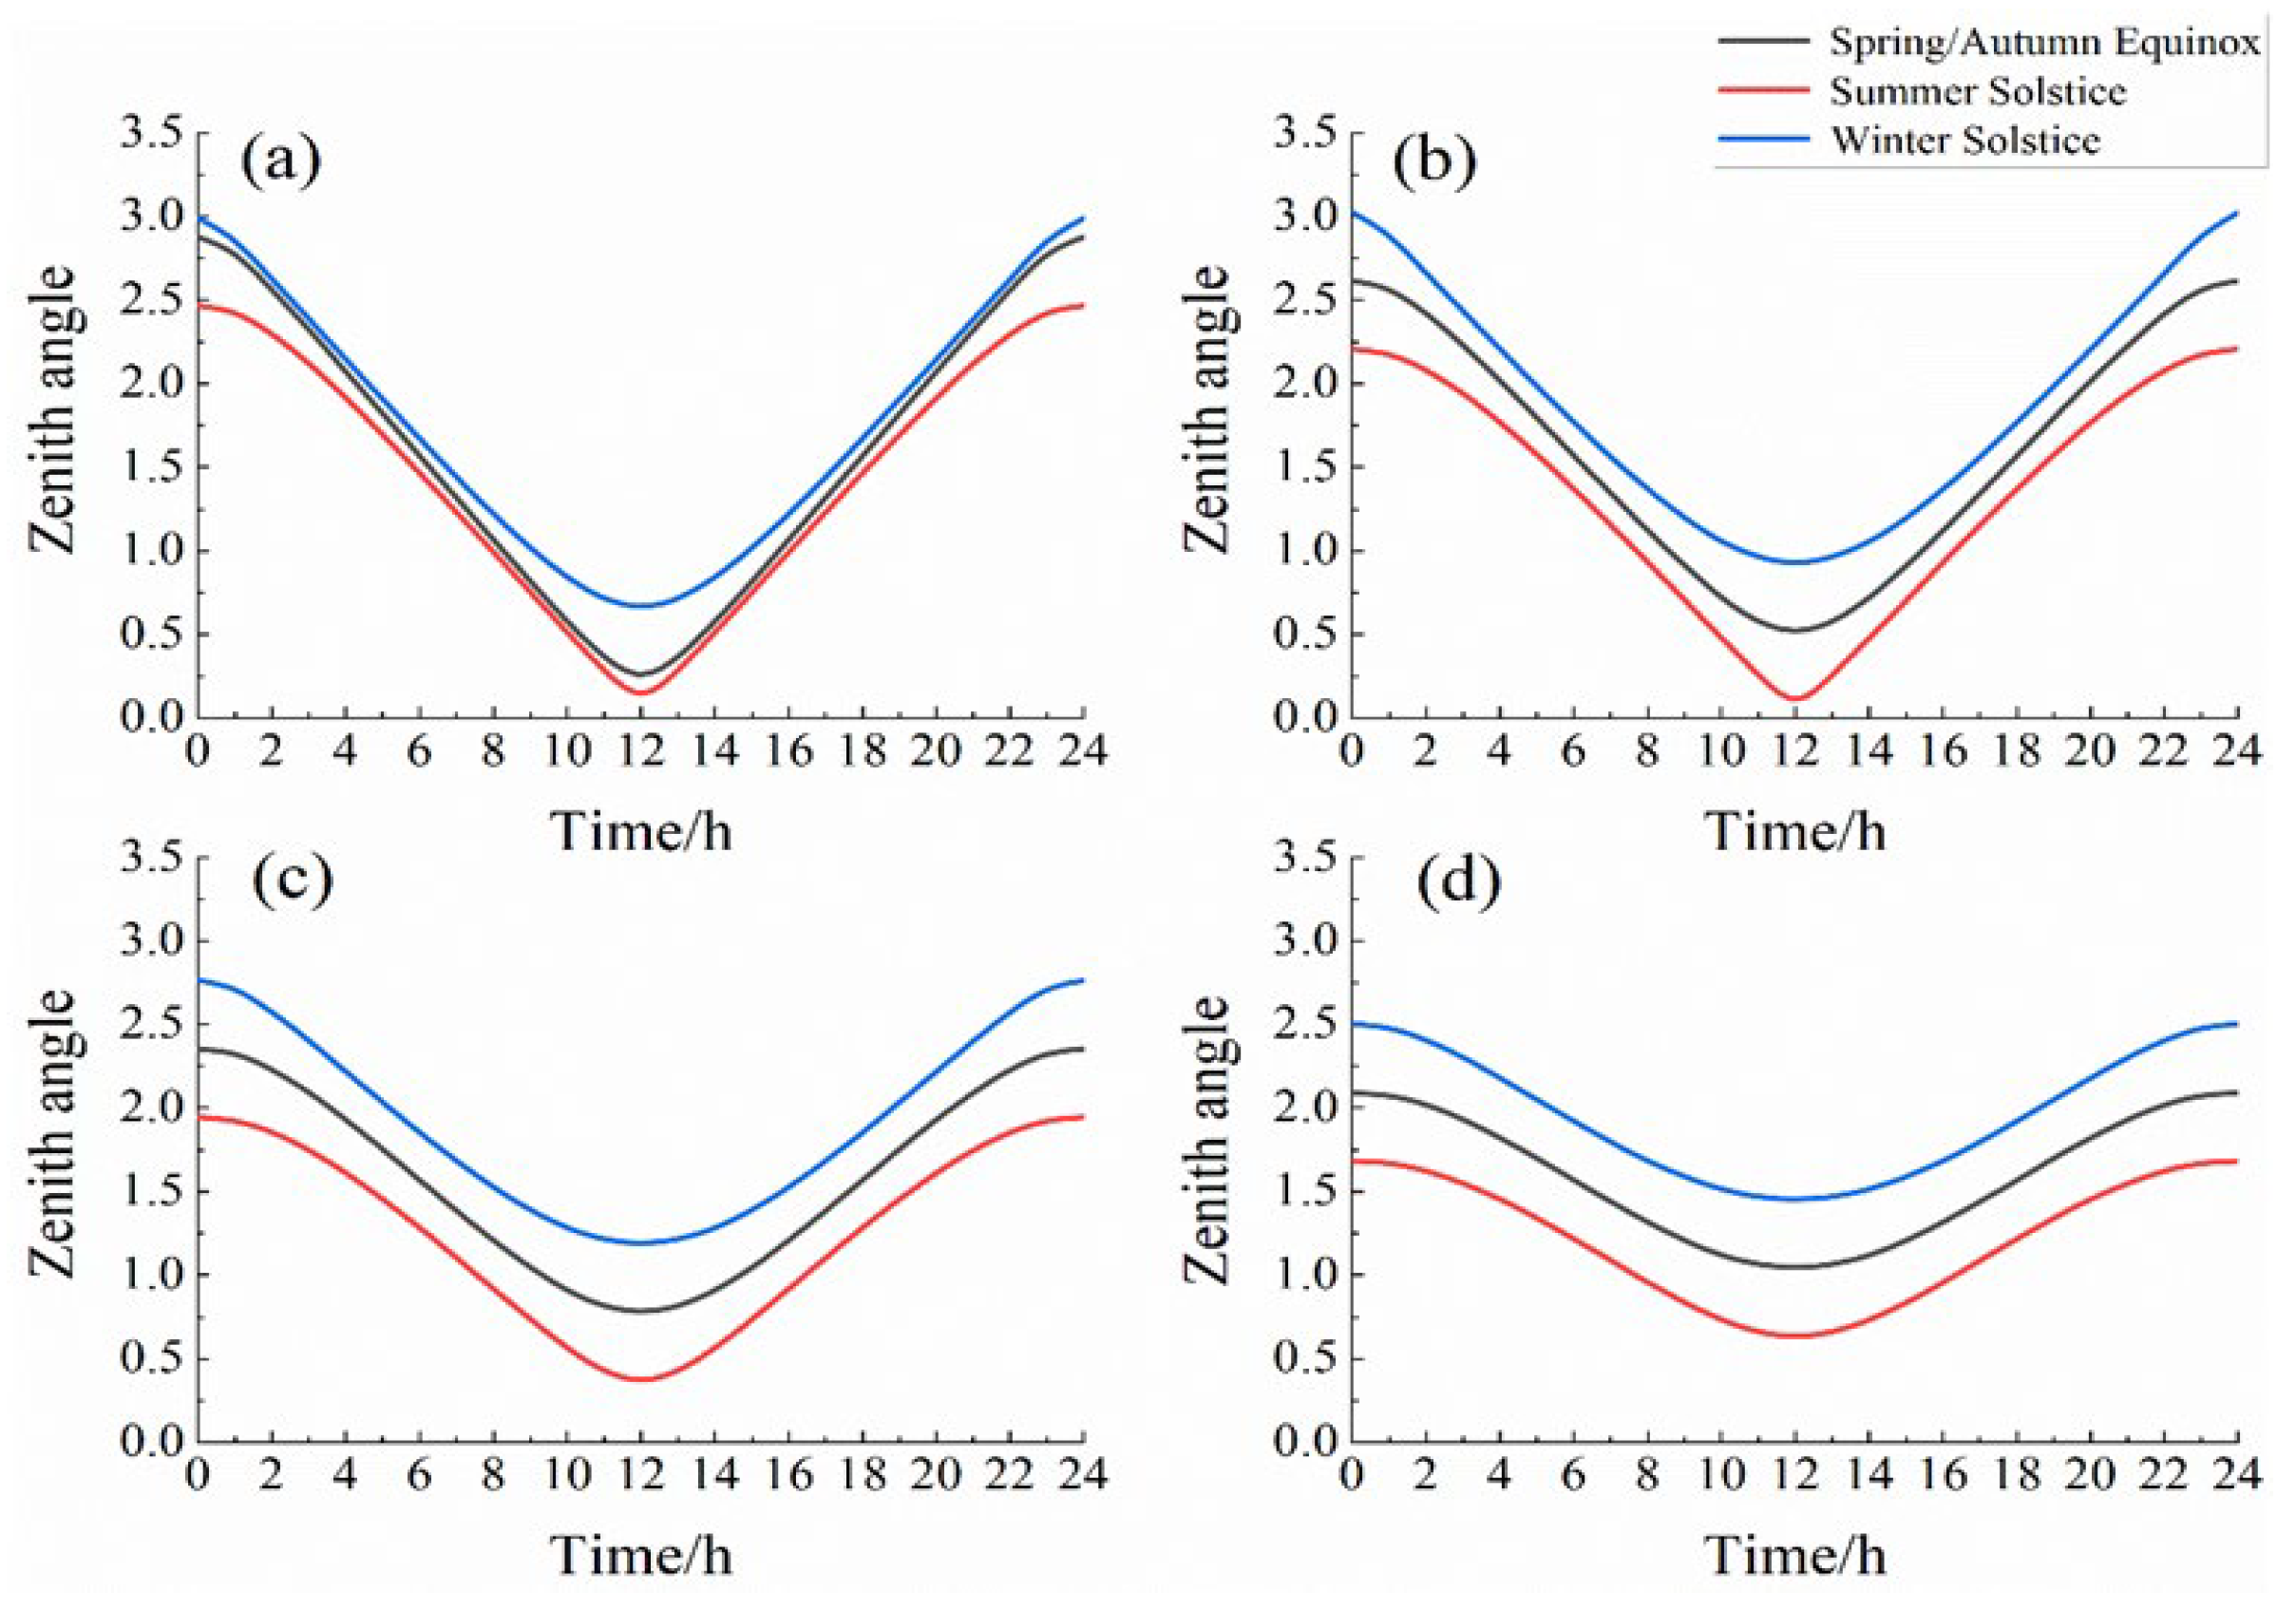
2.2.1. Direct Solar Radiation on Different Underlying Surfaces

The following equations governing the net energy budget of the Earth system were used in this study:
R n = G + H + λ E
where G is the ground heat flux, H is the sensible heat flux, E is the evapotranspiration rate and λ is the latent heat of vaporization.
H = T s T r γ a ρ c p
λ E = β e * T s e r γ s ρ c p γ
where Tr is the air temperature within the lowest layer of the atmospheric model, γa is the aerodynamic resistance between the surface and the lowest layer of the atmosphere, ρ and cp are the density and specific heat of air, β is the moisture availability function (0 ≤ β ≤ 1), e* (Ts) is the saturated vapor pressure at temperature Ts, er is the vapor pressure within the lowest layer of the atmospheric model and g is the psychrometric constant.
Solar radiation is the most direct factor that results in the variation in ground temperature and air temperature. The absorbent solar radiation on a level ground surface can be expressed as follows:
R s = S 0 cos Z
in which Rs is the absorbent solar radiation on a level ground surface; S0 is the solar constant, S0 = 1353.3 W·m−2, without consideration of atmospheric influences; Z is the solar zenith angle (Figure 2). Solar radiation on the Qinghai-Tibet Plateau is negatively correlated with latitude and positively correlated with altitude and relative sunshine duration. The sunshine duration, latitude and altitude have a dominant influence on the solar radiation of the ground surface [20]. Therefore, the influence of atmosphere was ignored in this study.
Z is calculated as follows:
cos Z = sin φ sin δ + cos ϕ cos δ cos ψ
in which φ is the latitude, γ is the solar declination and ψ is the time angle.
The solar zenith angle is closely related to the regional longitude, latitude and time. The variation in the zenith angle over time in 15°N, 30°N, 45°N and 60°N is shown in Figure 3.
The zenith in winter is larger than that in summer, and the solar altitude in summer is larger than that in winter. The solar zenith changes with time in a one-day cycle, which has the minimum value, and the solar altitude has the maximum value at noon. The heating area on the ground surface is small and the heat is concentrated with a large solar altitude, which has more solar radiation. With the increase in latitude, the difference in the solar zenith angle in spring and winter is increasingly obvious. The zenith angle at the summer solstice is smaller than that at the winter solstice. In 24 h during the winter solstice, the order of the solar zenith in different latitudes from high to low is 30°N > 15°N > 45°N > 60°N.
The declination γ (Figure 4) was calculated as follows:
δ = 23.45 sin 2 π 284 + N 365
The time angle ψ (Figure 4) was calculated as follows:
ψ = 15 × t 12
in which N is the data order: common year, 1 January is and 31 December is 365; leap year, 1 January is and 31 December is 366; ψ is 0 based on the local true solar time at noon.

2.2.2. Long-Wave Radiation on Different Underlying Surfaces

The long-wave radiation on ground surface Rl can be expressed as follows:
R l = v R s + R l n
in which v is the conversion ratio from total solar radiation to long-wave radiation on the ground surface. The conversion ratio on different underlying surfaces in the QTP is shown in Table 2. Rl|n is the equilibrium value of long-wave radiation at night; Rs is the direct solar radiation on the ground surface.
The equilibrium value of long-wave radiation on the ground surface at night is the radiation value that reaches an equilibrium status whereby the ground surface receives solar radiation during the day and releases effective radiation at night with the thermal insulation of the atmosphere [15]. The sine function can precisely calculate the equilibrium value of long-wave radiation on the ground surface at night every day, and the fitted equation of measured data is shown as follows [26]:
R l n = A + B × sin 2 π 12 × t + C
in which, A, B and C are coefficients fitted by the measured results, A is relative with altitude and latitude; C is π/3. A can be expressed as follows:
A = f H , φ = 631.33 H a 0 cos φ + 284.23 H H cos φ 527.13 H cos φ + 300 H a 0 H cos φ
in which H is the altitude, φ is the latitude and Ha0 is the average thickness of the atmosphere, which is 8072.5 m in the QTP [9].
B can be calculated via A as follows [26]:
B = 0.84 × A 303.42

2.2.3. Thermal Boundary Model

According to the Stefan–Boltzmann Law, the radiation temperature on different underlying surfaces can be calculated based on the long-wave radiation of the ground surface as follows:
T g = R l ε σ 1 4
in which T g is the radiation temperature, ε is the emissivity of a gray body, which is 1; σ is the Stefan–Boltzmann constant, which is 5.67 × 10⁻⁸ W·m−2·K−4.
However, the above equation did not consider the influence of atmosphere and precipitation under an ideal condition. The calculation result has some errors because the radiation temperature is different from the real temperature on the ground surface. The calculation result has a linear relationship with the real ground surface temperature. Therefore, a linear equation was adopted to modify the ground surface radiation temperature as follows:
T g = k T g + b
in which k and b are the fitted coefficient; Tg is the ground surface temperature. The k and b were fitted by the MODIS data of the ground surface temperature. The values of k and b of different underlying surfaces on the QTP are shown in Table 3.

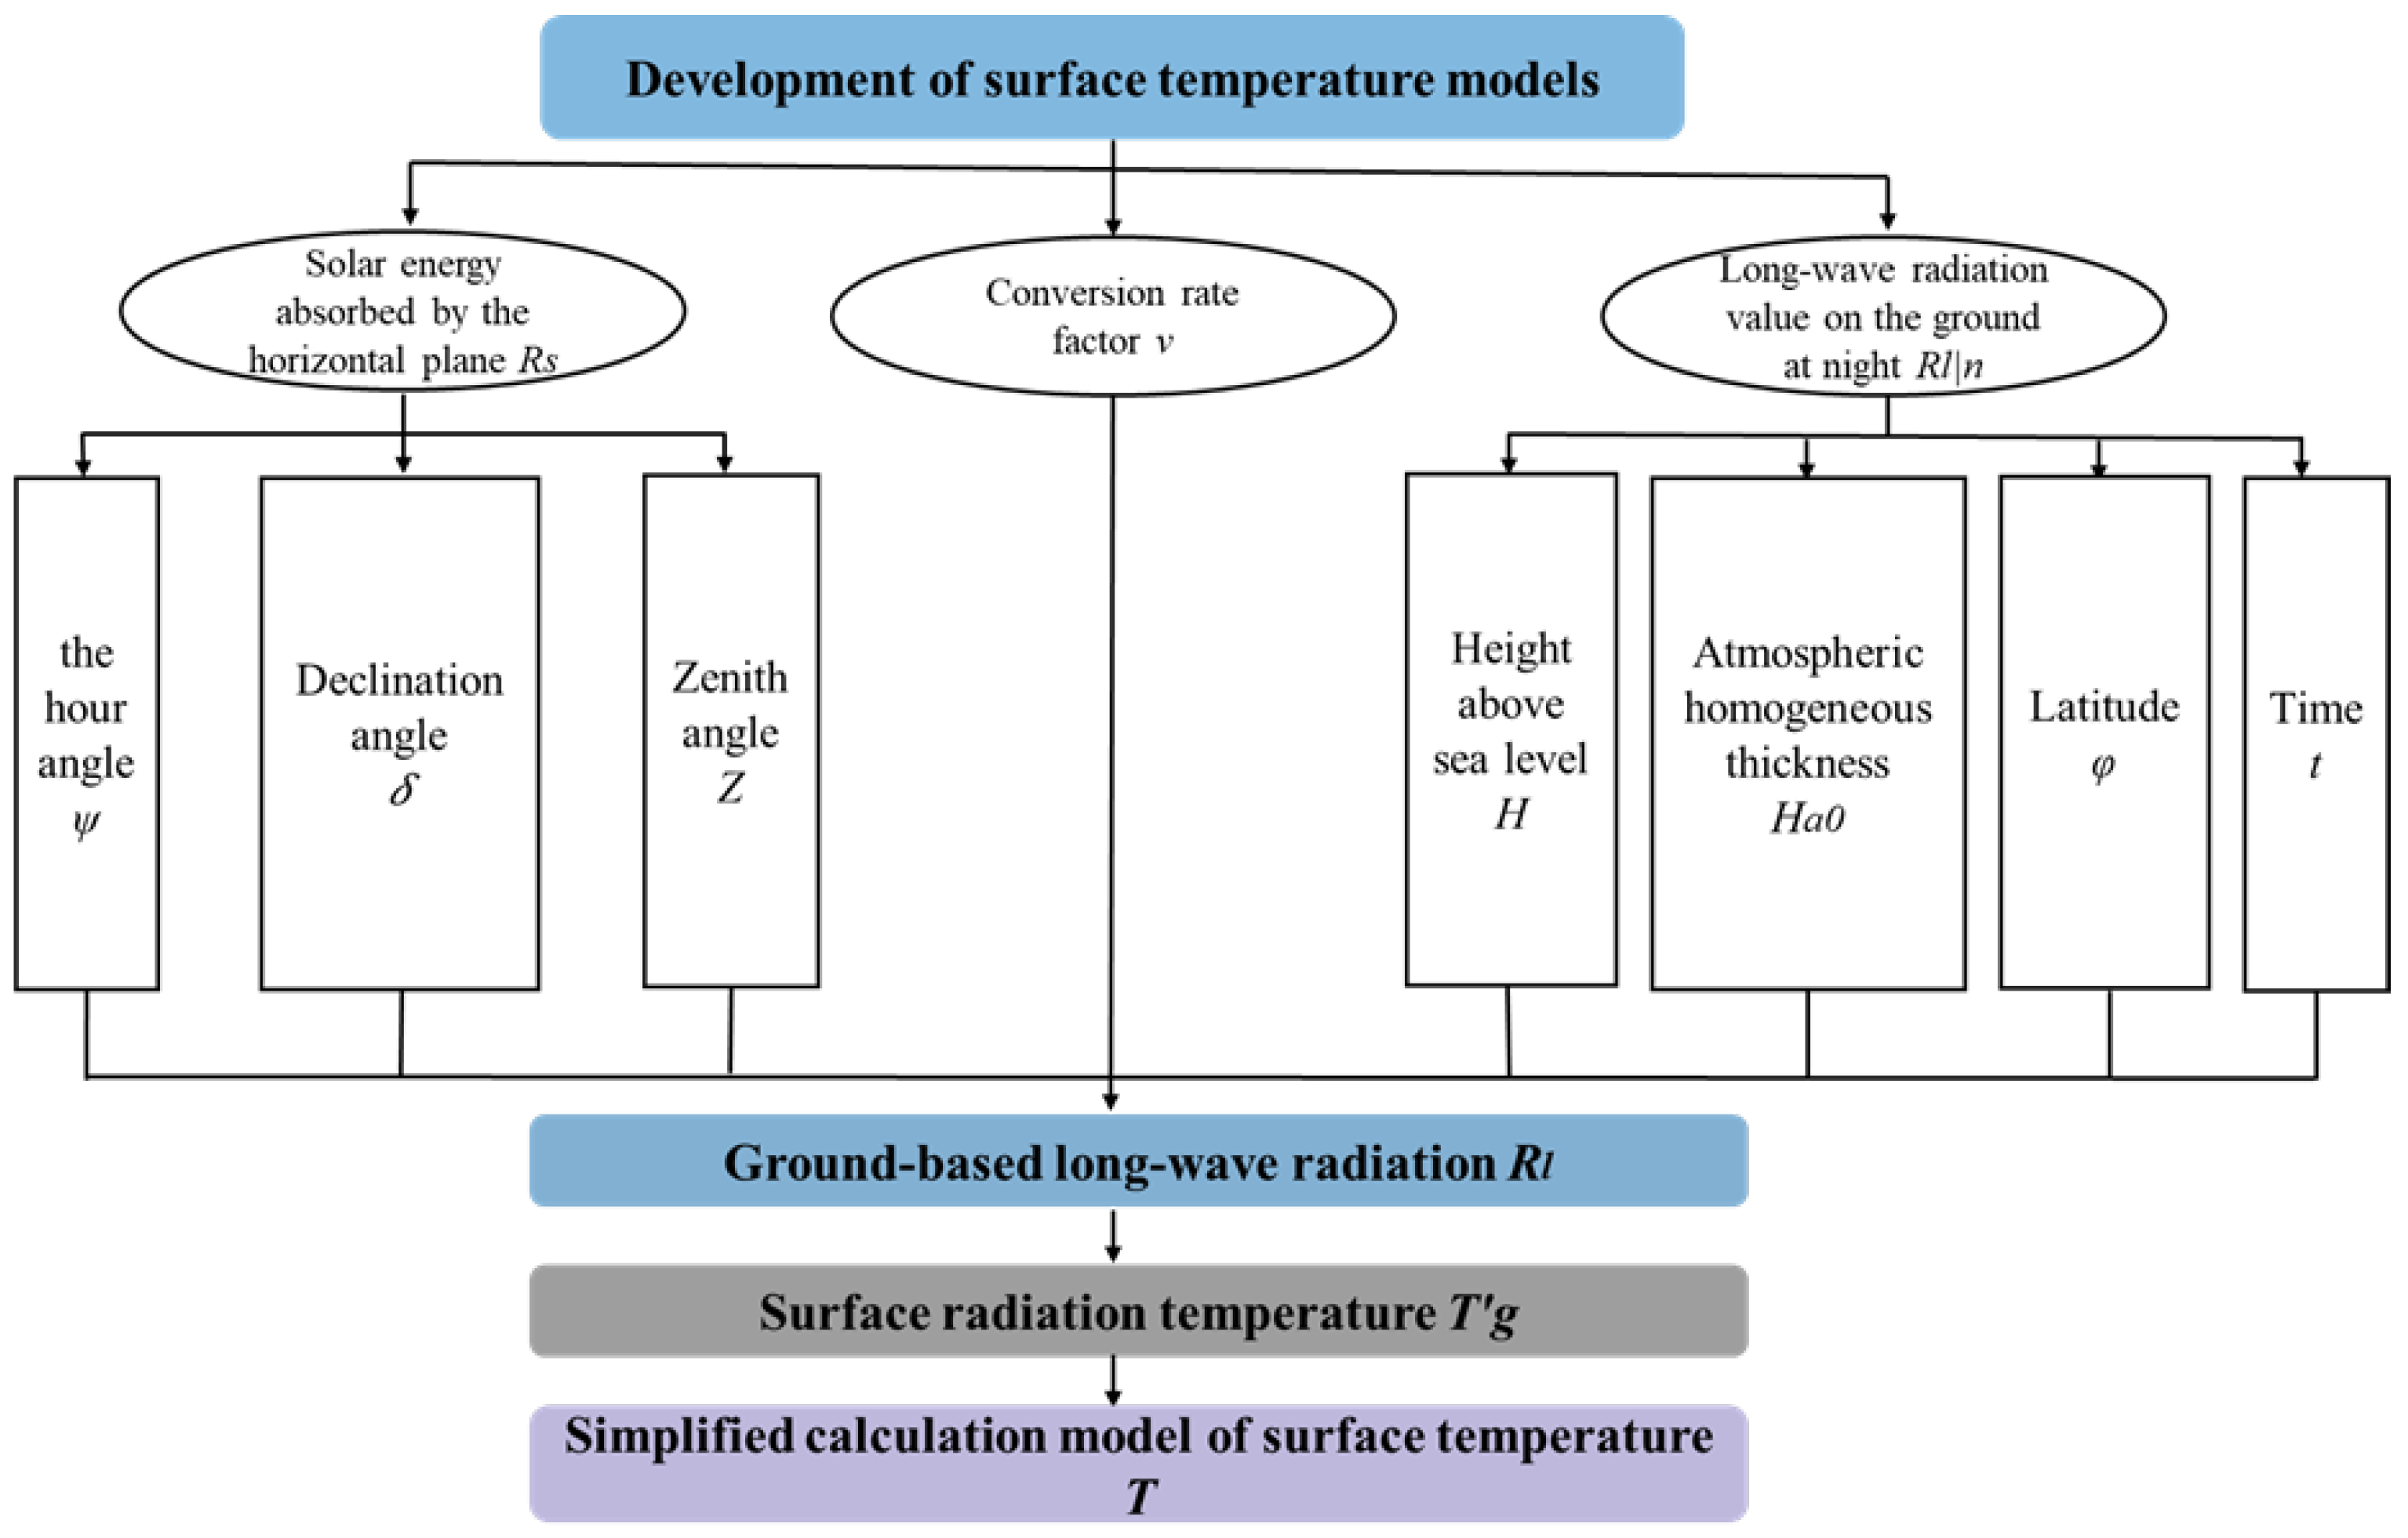
2.2.4. Process of Surface Temperature Calculation

Based on the determination of latitude, altitude and solar radiation, the hour angle, declination angle and zenith angle were calculated in the QTP. Then, the ground surface temperature could be approximately solved by the modified and simplified model based on the conversion coefficient and correction coefficient of different underlying surfaces. The surface temperature calculation process utilized in this study is shown in Figure 5.

3. Results

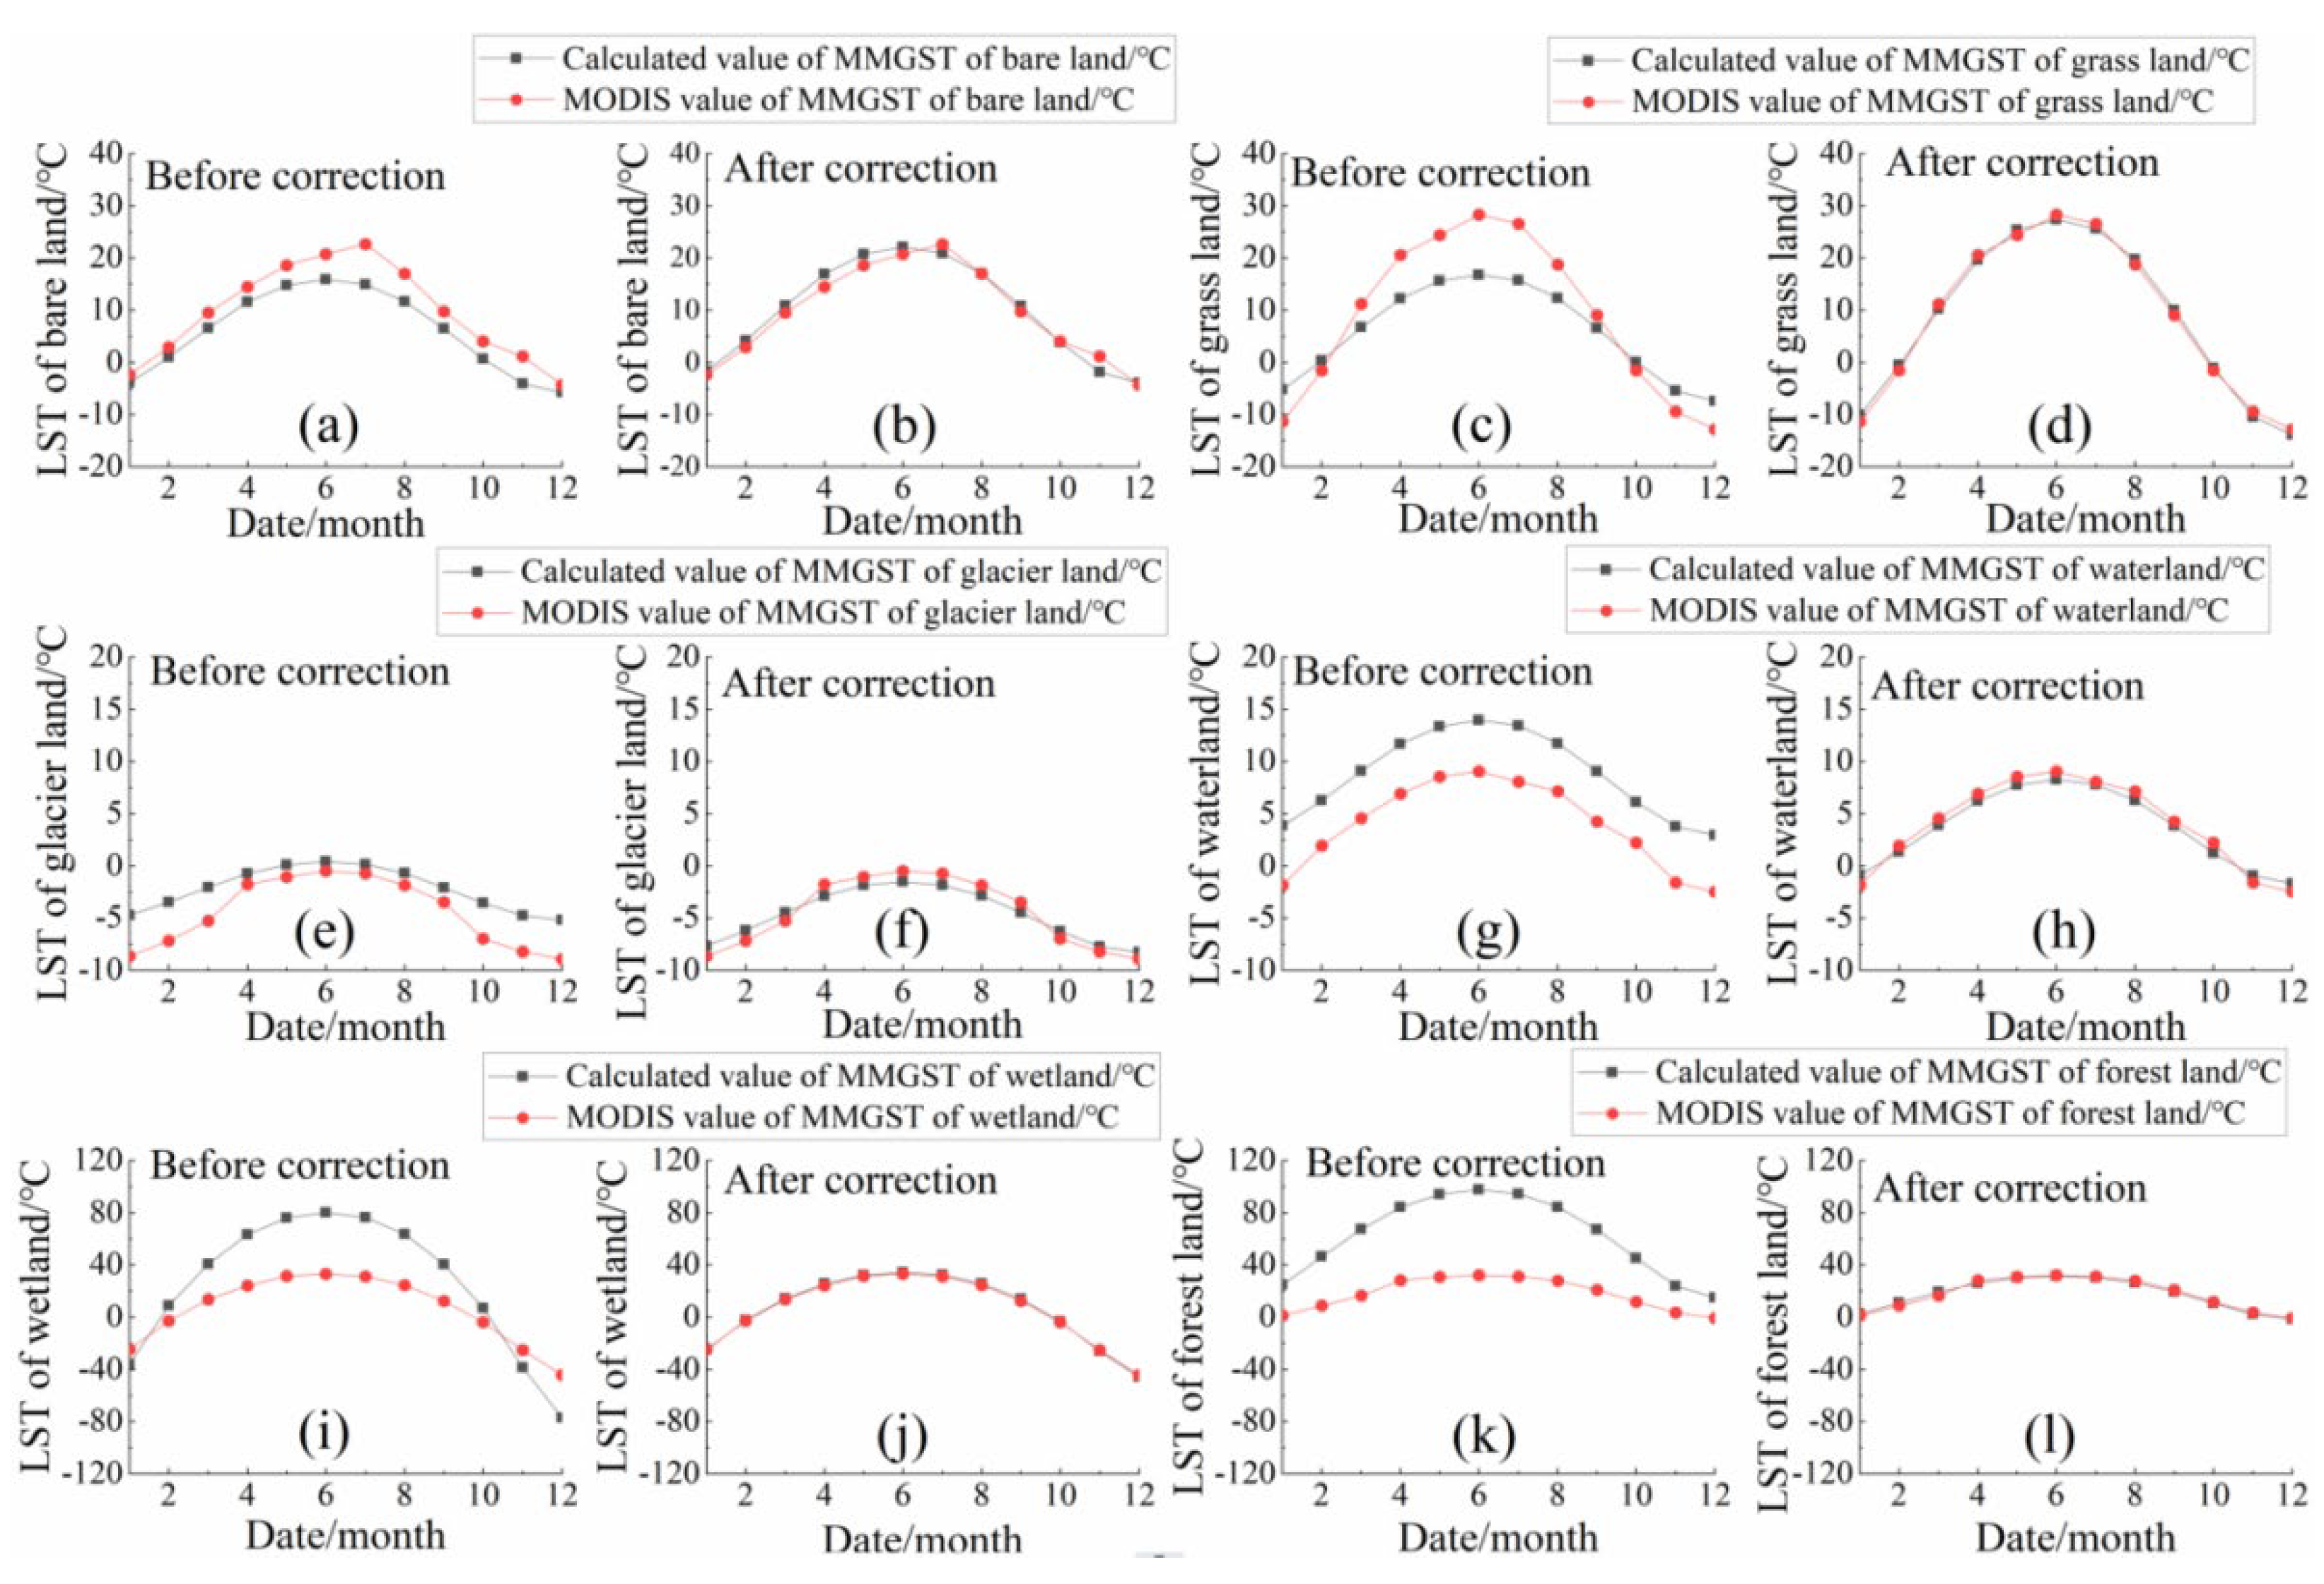
3.1. The Mean Monthly Ground Surface Temperature (MMGST)

The variation in mean monthly ground surface temperature (MMGST) calculated from the radiant ground surface temperature is shown in Figure 6. The variation in MMGST has a similar trend on different underlying surfaces; it reaches the maximum during May to August and reaches the minimum during December to January. The MMGST from MODIS can precisely validate the results of the modified calculation model on the ground surface temperature of different underlying surfaces.
The variation in MMGST for bare land is similar to that of grassland. The calculated MMGST is smaller than the MODIS data value. The MMGST of bare land in January, November and December is lower than 0 °C, and it is higher than 0 °C from February to October. The maximum value of MMGST reaches 20.74 °C in July, and the minimum reaches −4.29 °C in December. MMGST before the modification is higher than the MODIS result; the maximum difference is 7.79 °C in July, of which the minimum difference value is 2.49 °C after the modification.
The calculation results from the simplified model are larger than those of the MODIS data before correction. The minimum difference between the MODIS data and model results is 0.87 °C in July before correction, and it is 0.50 °C in November. The maximum temperature difference for water bodies before correction is 5.68 °C, and it is 1.0 °C after correction, with an increase of 82.39% in precision. The precision of the corrected temperature of wetland and forest increased by 95.35% and 87.07%, respectively. The study region has a high altitude; therefore, the influence of the latitude and underlying surface on MMGST is more significant than that of altitude. The variation in MMGST for forests, water bodies and glaciers throughout the whole year is smaller than that of wetland, grassland and bare land. The order of MMGST is forest > wetland > water body > glacier.

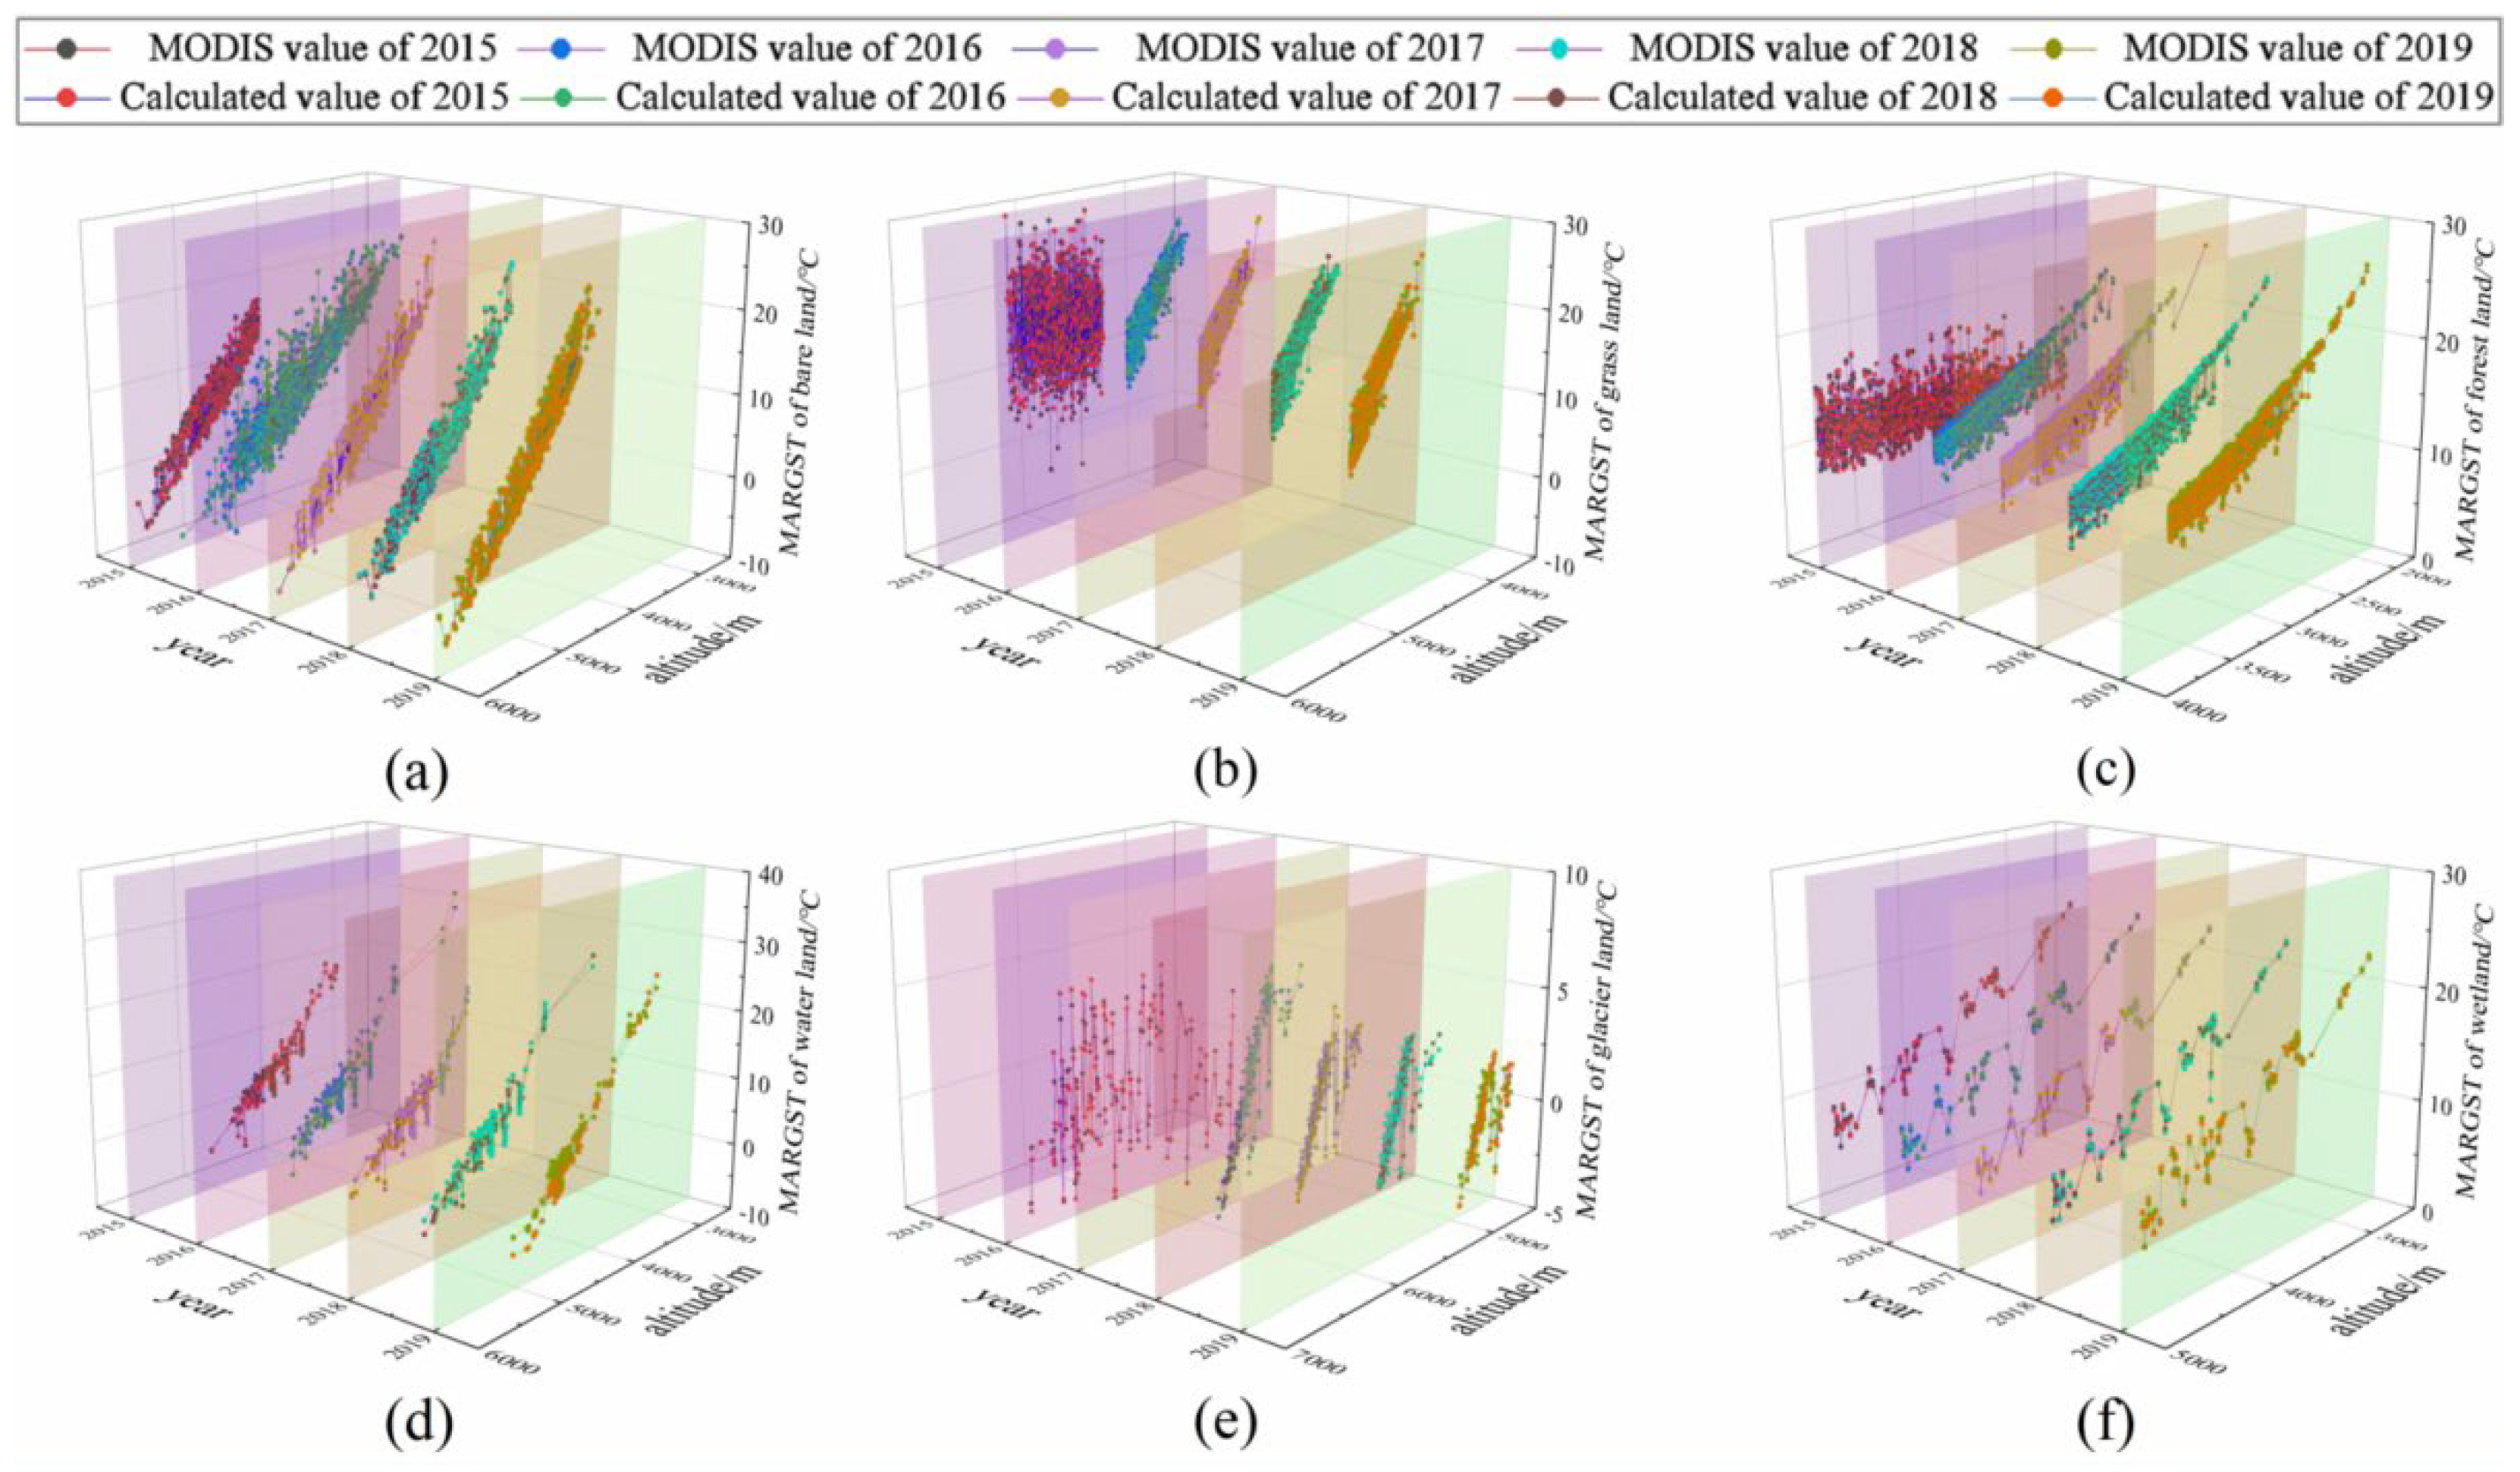
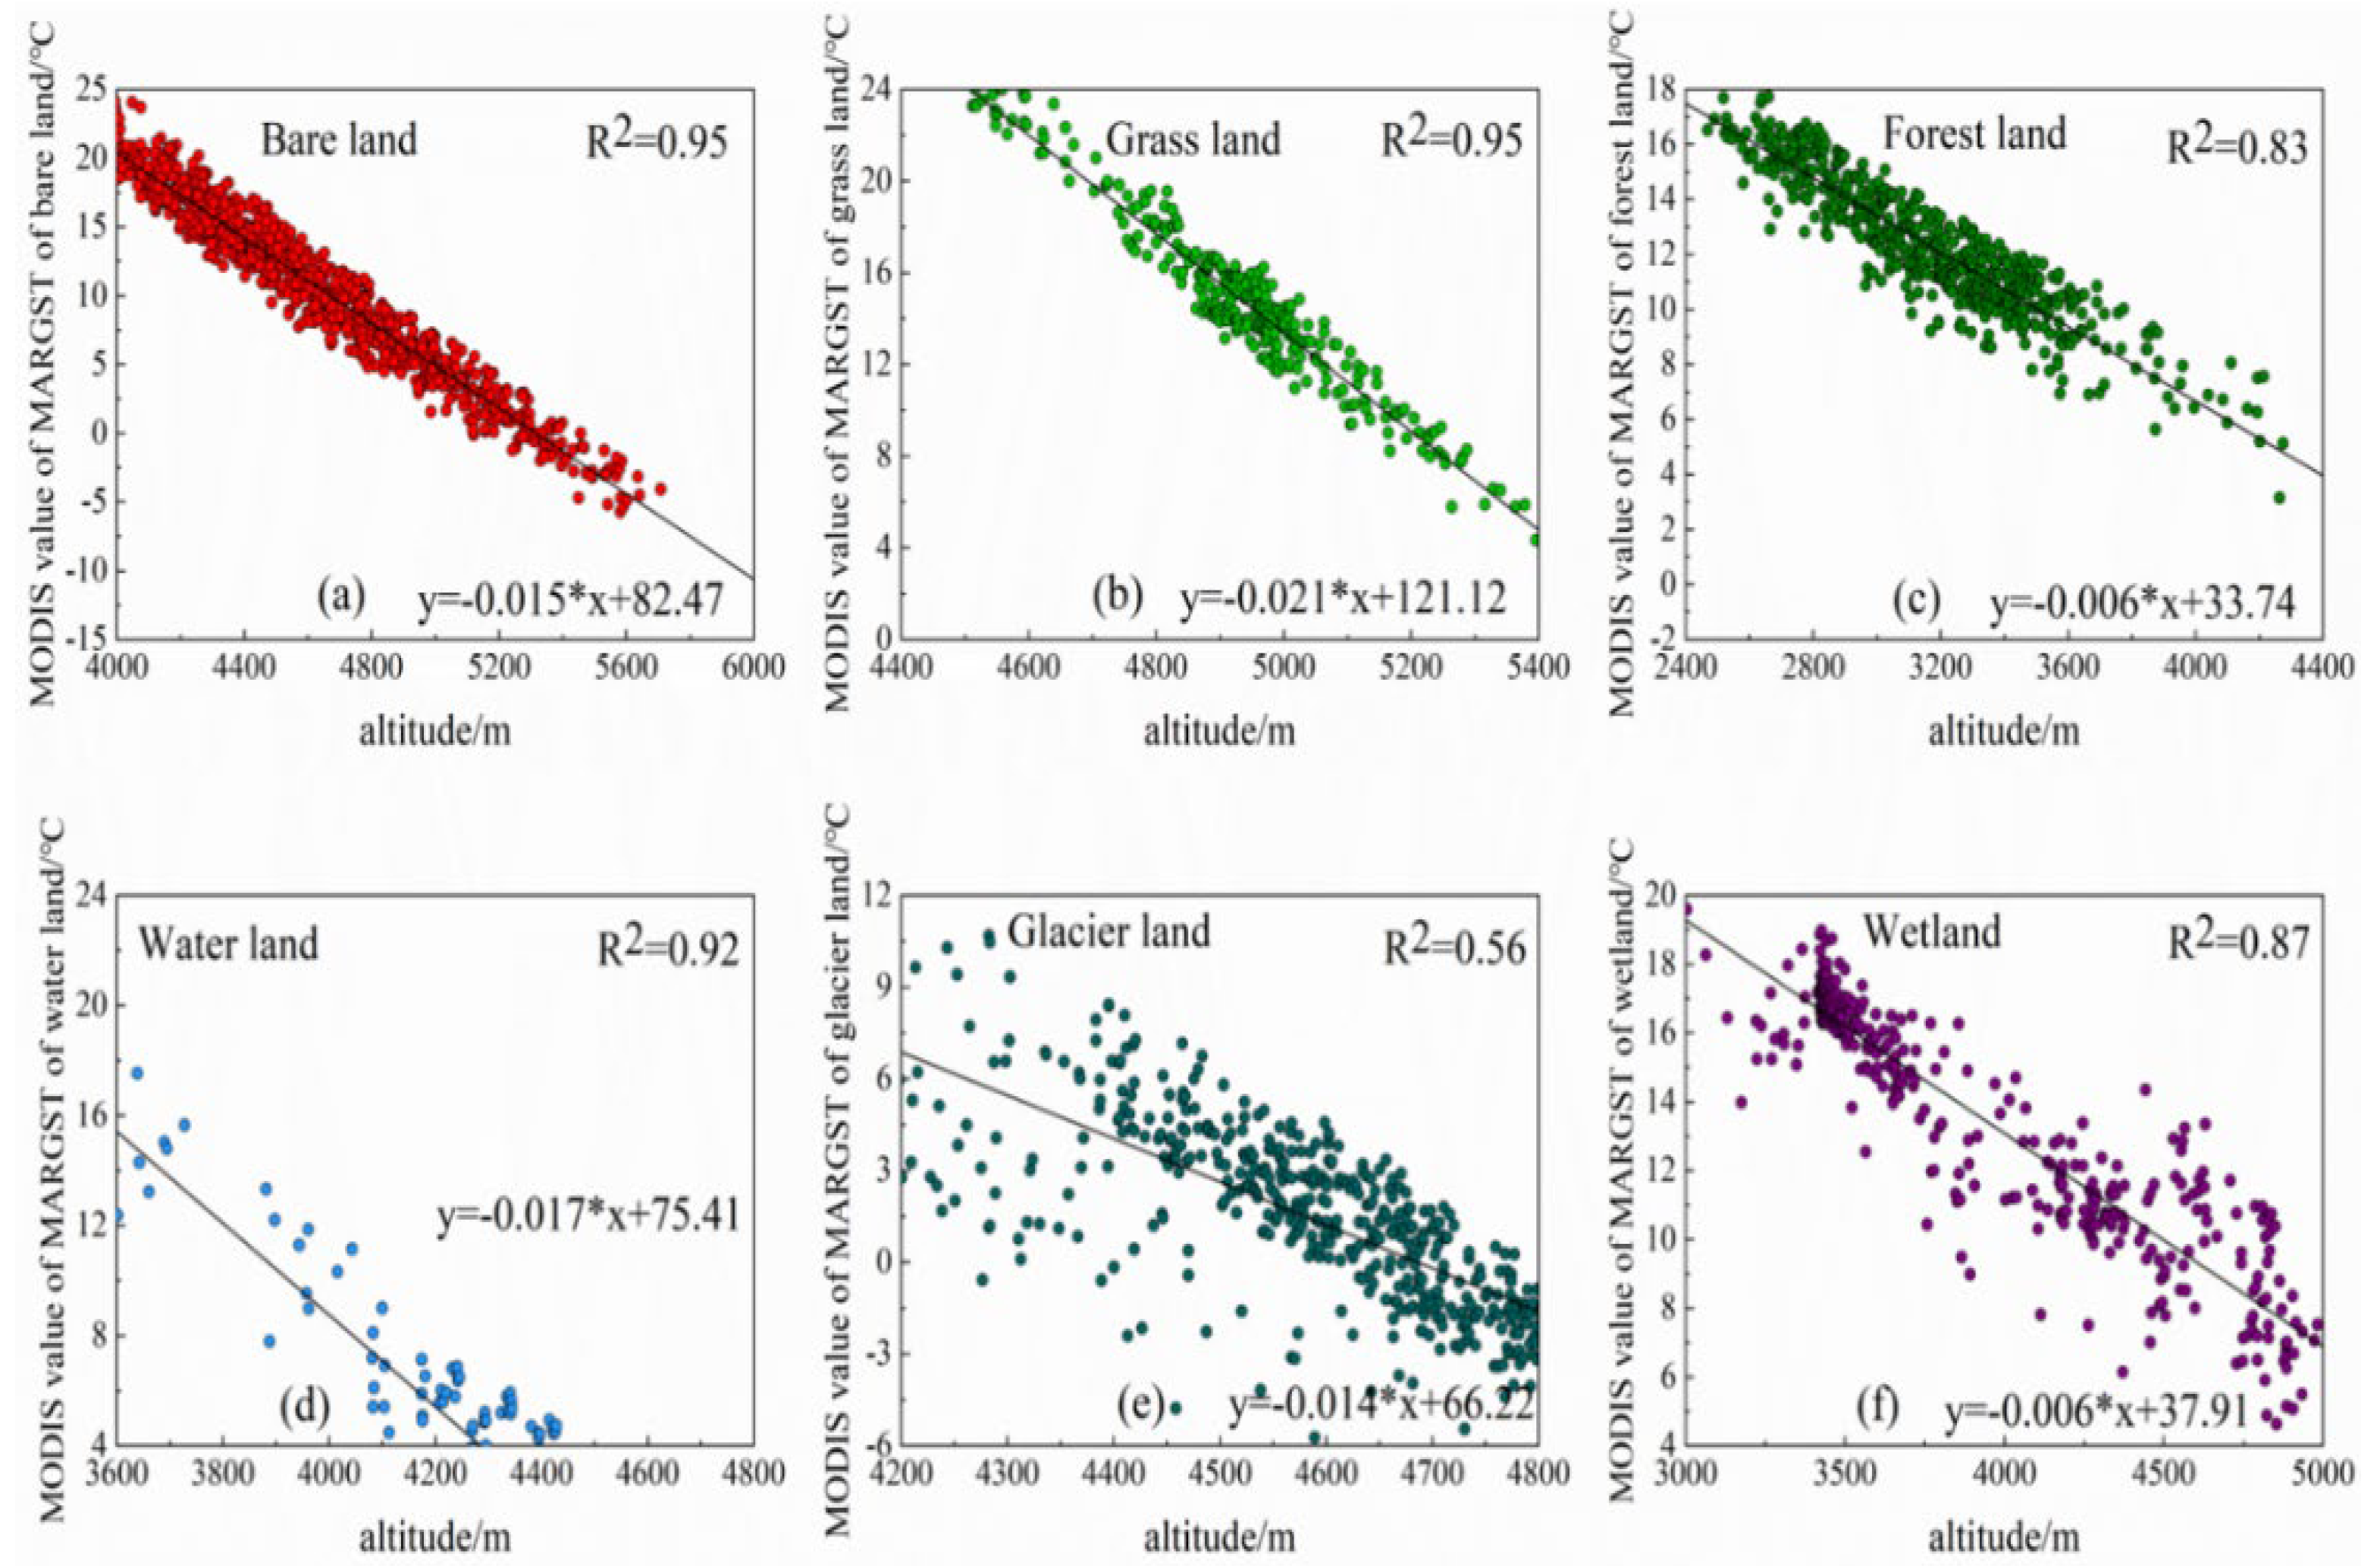
3.2. The Mean Annual Radiant Ground Surface Temperature (MARGST)

The comparison of the calculation results of the mean annual radiant ground surface temperature (MARGST) and modified MARGST on different underlying surfaces is shown in Figure 7, Figure 8 and Figure 9. The correlation coefficient R2, root-mean-square error (RMSE) and deviation bias statistics were obtained during the fitting. The calculation results of MARGST before modification were under the line y = x, which means that the calculation results are small, with the reason being that the bare land is relatively dry (Figure 6). The temperature after modification scatters uniformly on the two sides of the line y = x. The bias before and after the modification is 6.36 and 6.25, respectively, increasing by 1.73%. The RMSE before and after the modification is 4.66 and 1.27, respectively, decreasing by 72.75%. It is shown that the calculation results of MARGST after modification can precisely reflect the real temperature condition.
The calculation results of MARGST on wetland are large before modification. The RMSE before and after modification is 26.99 and 0.91, respectively, decreasing by 96.63% (Figure 7). The bias before and after modification is 14.65 and 3.82, decreasing by 73.92%. The radiant ground surface temperature for forests is higher than that on wetland before correction. The RMSE and bias for forests decreased by 97.52% and 85.54% after correction, respectively. The RMSE and bias of water bodies before correction were 5.82, which was induced by high humidity on the water surface. After correction, the RMSE and bias decreased by 17.01% and 77.32%, respectively. The simplified calculation model increased the accuracy of the temperature calculation results.

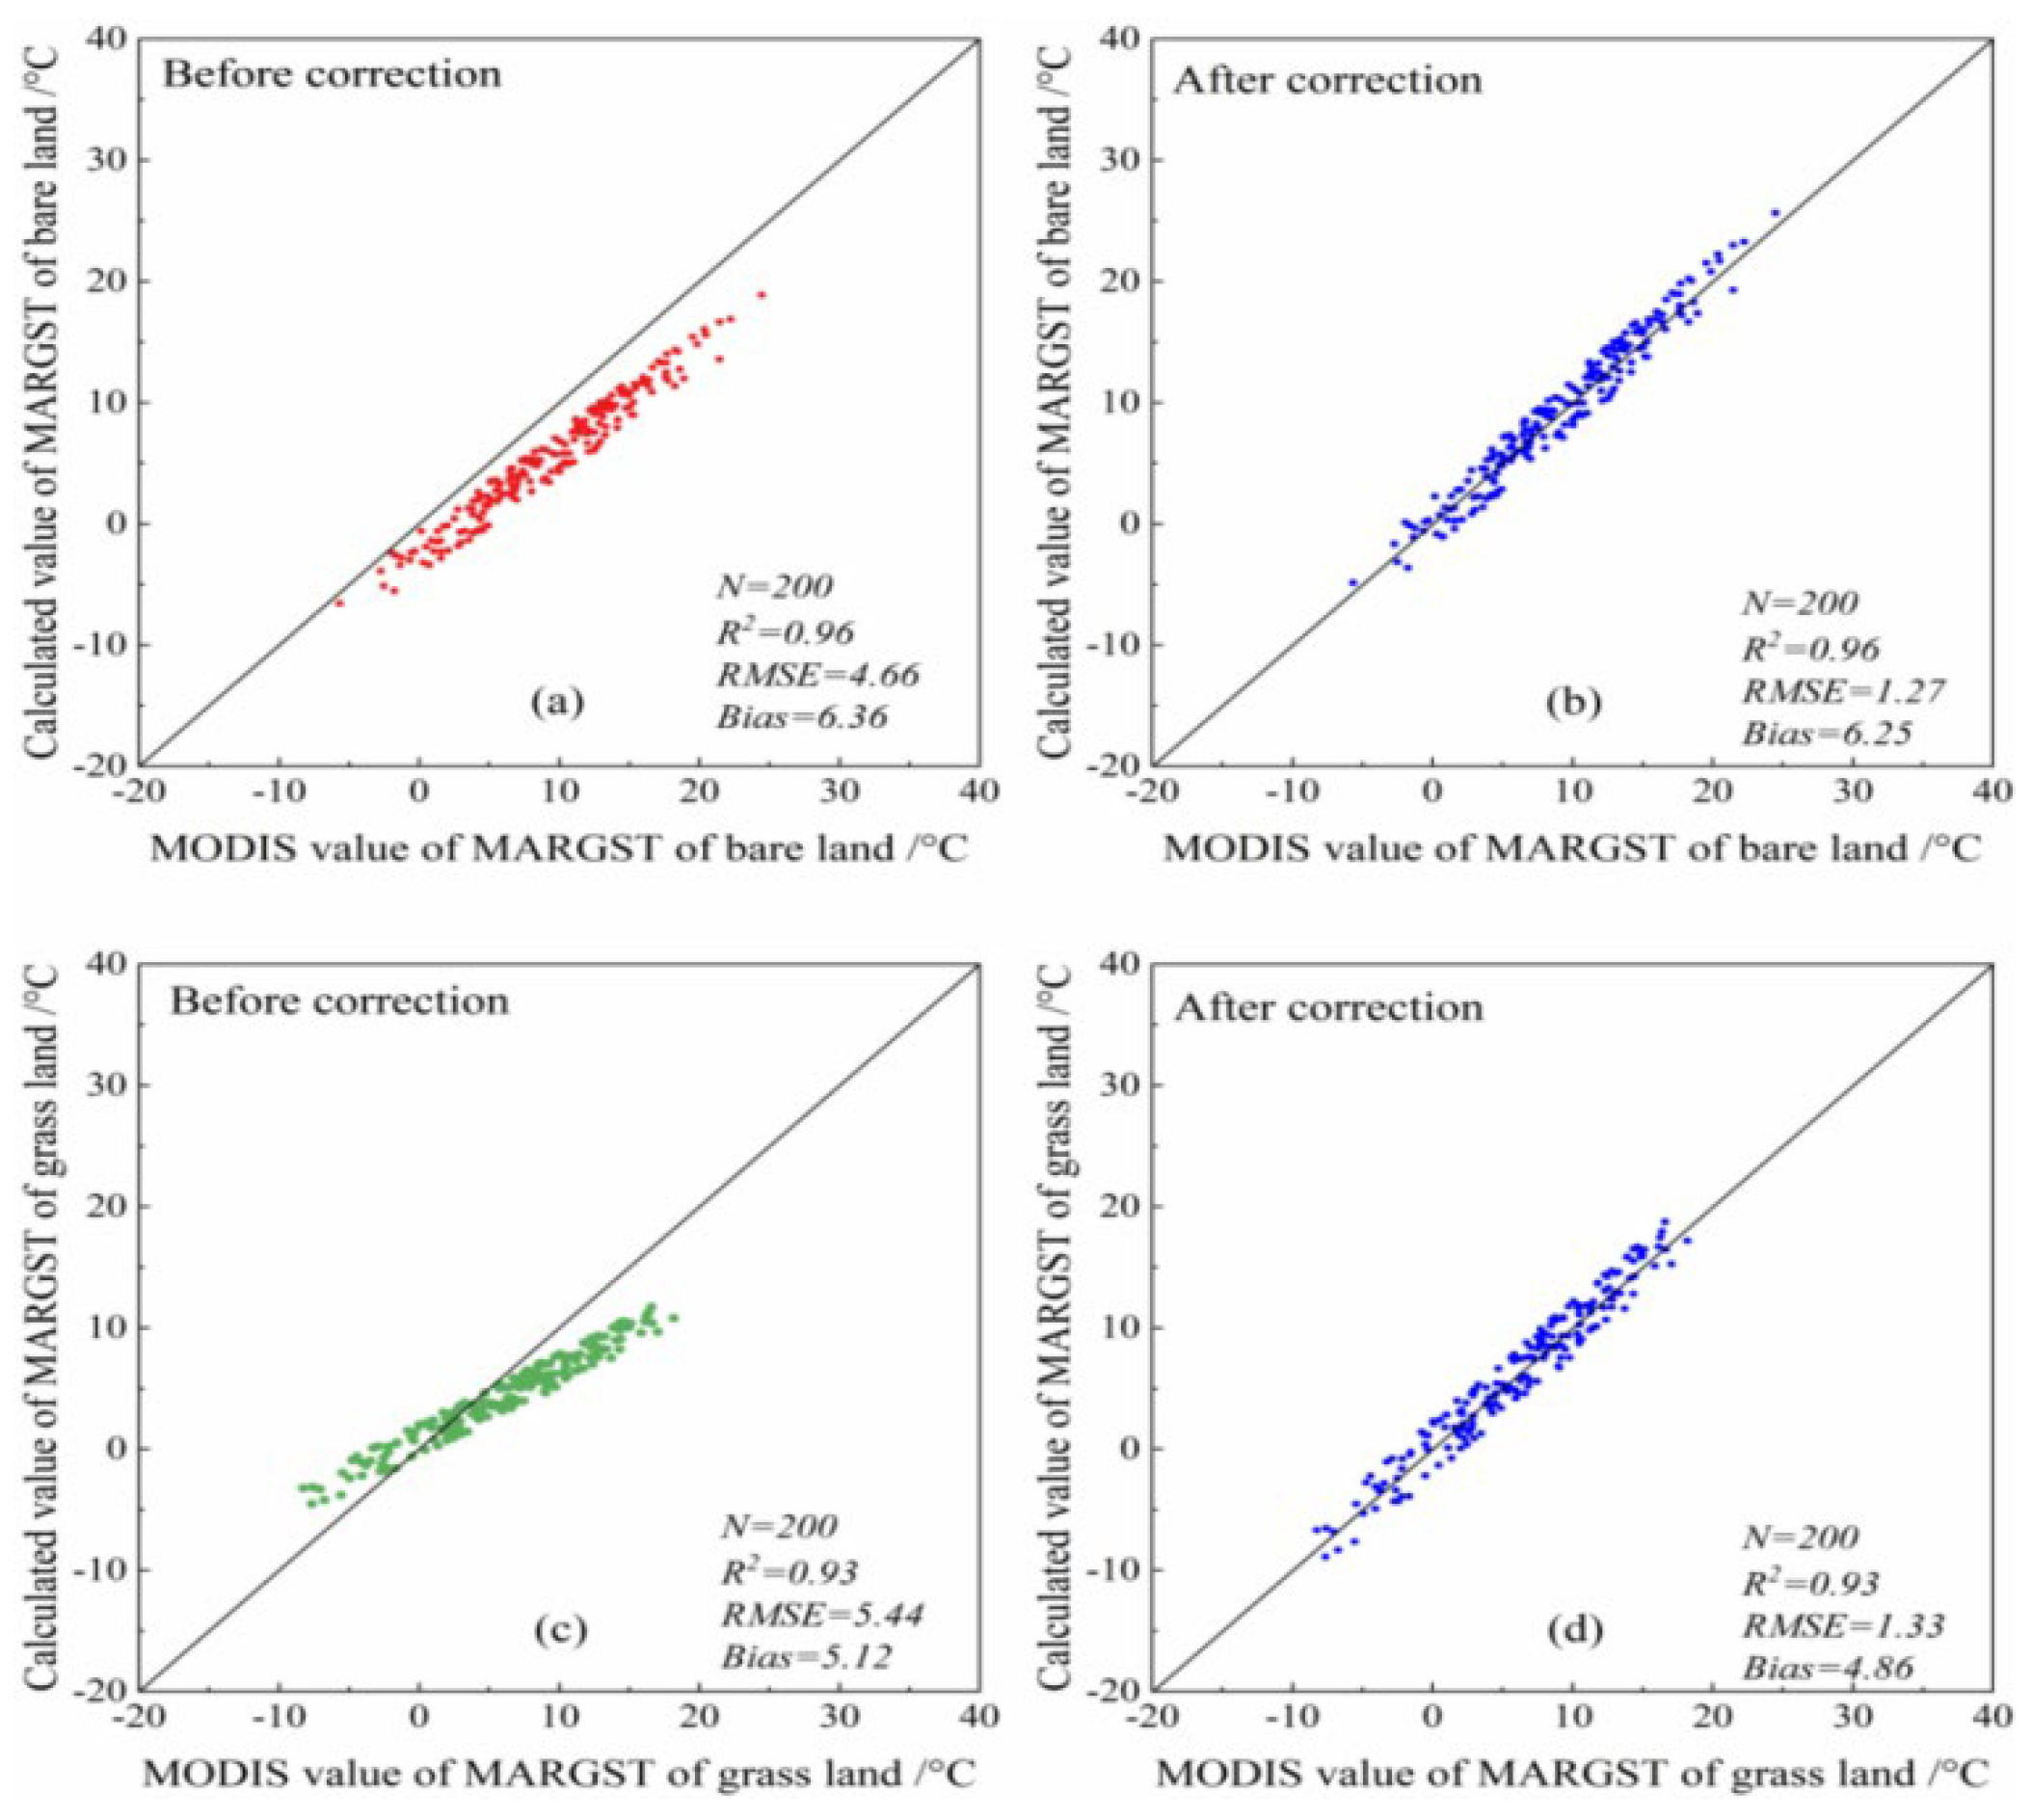
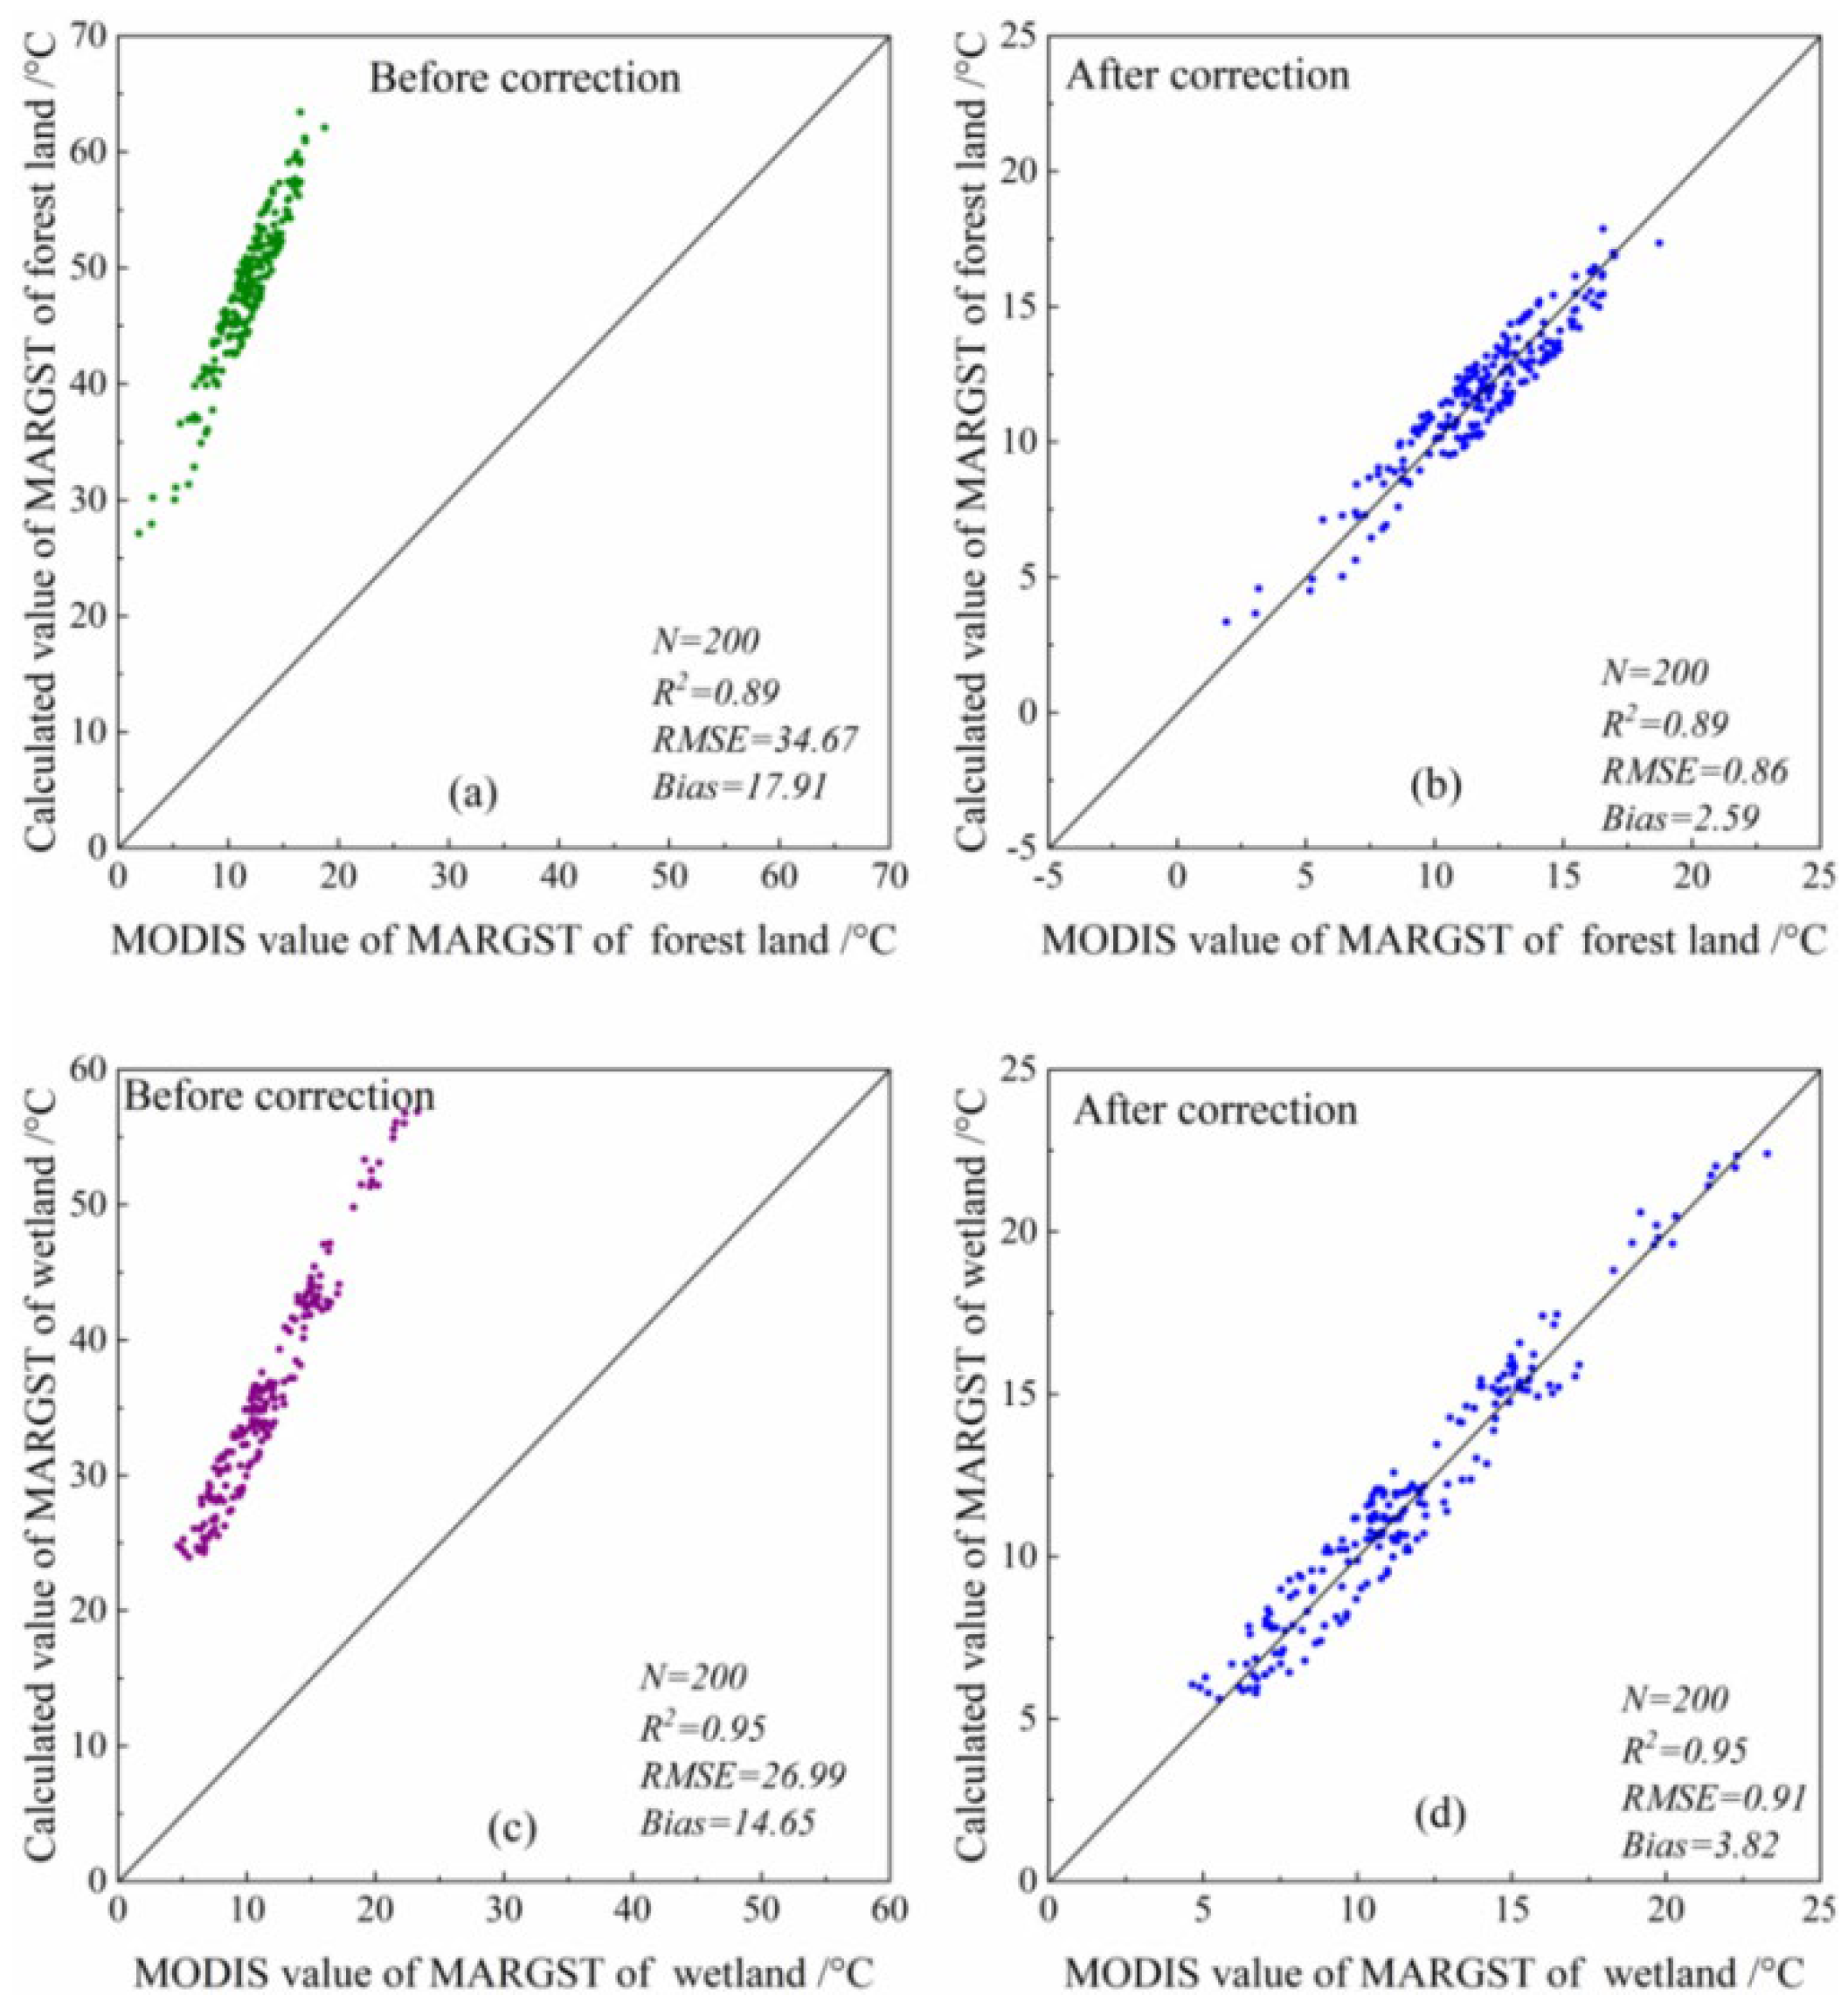
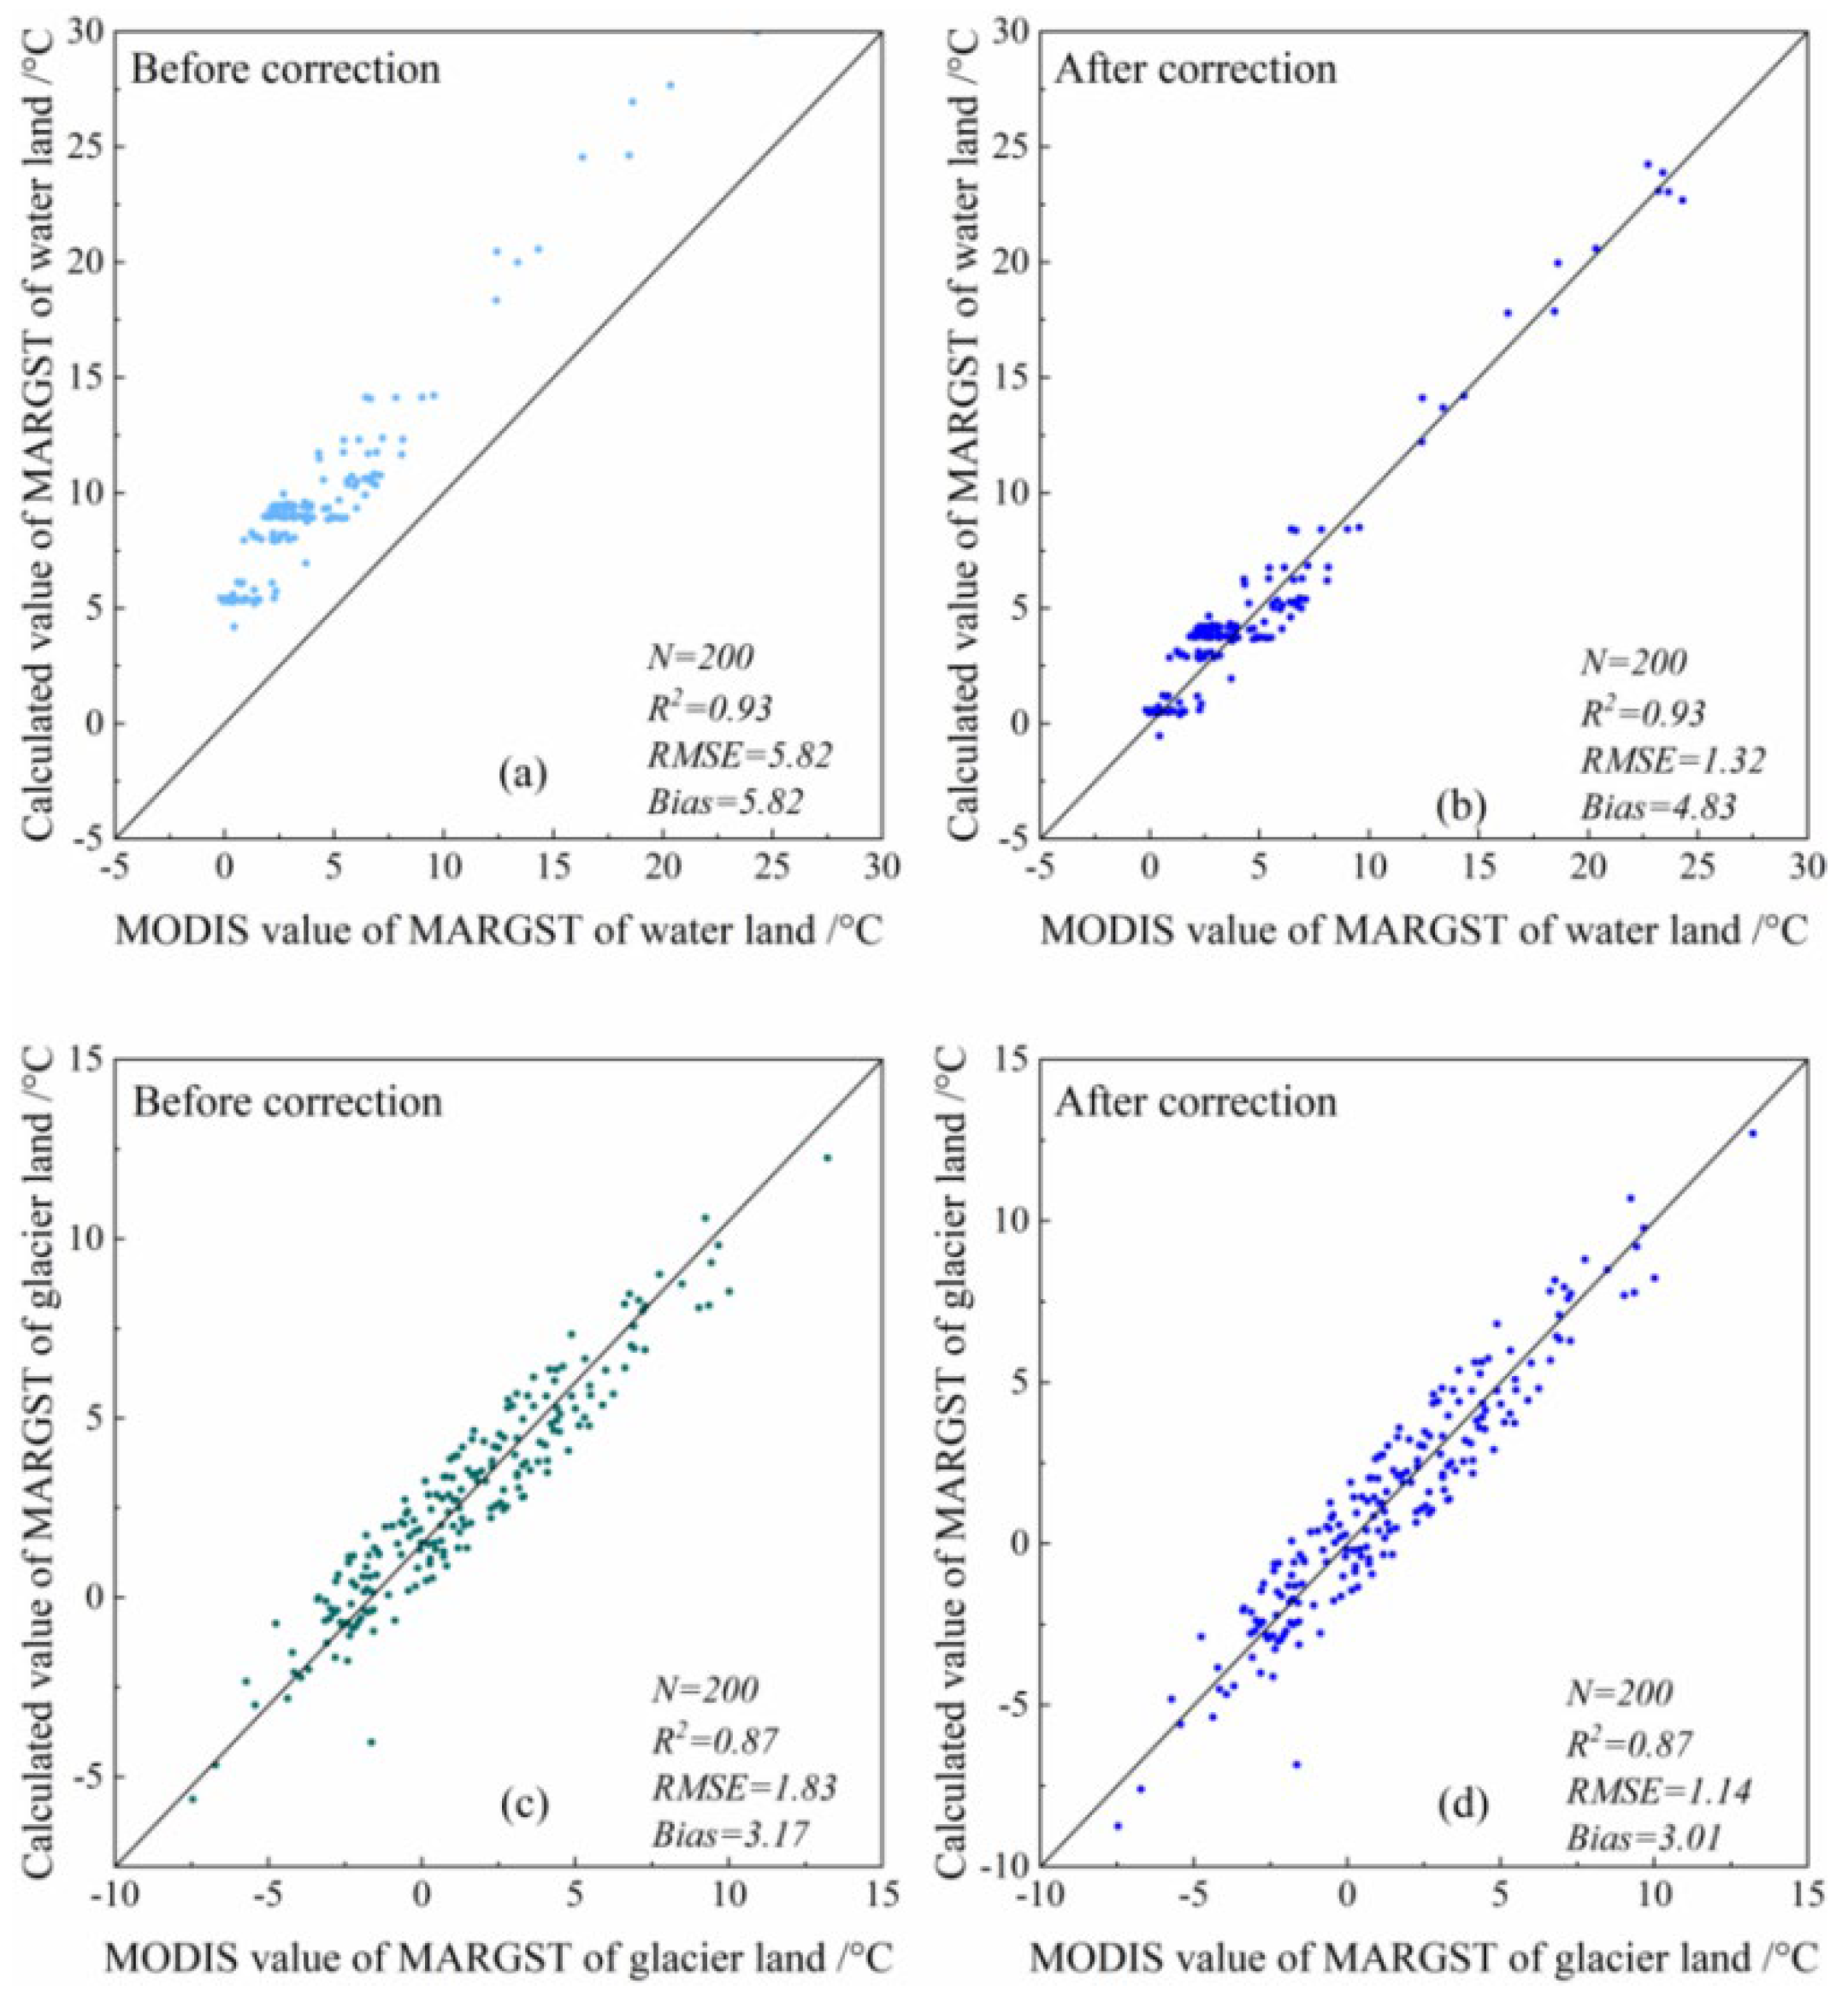
3.3. Results Validation

The altitude, longitude and latitude of different underlying surfaces on the Qinghai-Tibet plateau in 2015–2019 were obtained and inputted into the modified, simplified calculation model of MARGST. The calculation results were compared with the MODIS data on different underlying surfaces, which showed high goodness of fit (Figure 10). The R2 on different underlying surfaces is larger than 0.86, in the order of bare land > grassland > forest > wetland > glacier > water body. The RMSE on different underlying surfaces ranges from 0.97 to 1.42, and bias is lower than 5.89, which represents the good fitting results and high precision of model calculation.

4. Discussion

In the Qinghai-Tibet Plateau, the absorbing capacity of solar radiation is different on different underlying surfaces, and the conversion rate from total solar radiation to long-wave radiation on different underlying surfaces is different as well. The different underlying surfaces on the Qinghai-Tibet Plateau differ in optical, hydro-thermal, chemical and biochemical properties, as well in the process of ground surface radiation and energy exchange, which results in heterogeneity of land surface processes [27]. On different underlying surfaces, the total solar radiation is almost the same; however, the long-wave radiation is different, which is similar to the temperature distribution. The long-wave radiation was dominated by the canopy temperature, soil temperature and ground surface color [28].
The equilibrium value of long-wave radiation at night indicates a mechanism that absorbs solar radiation during the daytime and releases the effective radiant energy at night, which reaches an equilibrium state under the thermal insulation of the atmosphere. The equilibrium value of long-wave radiation at night varies with seasonal change and is related to the regional condition and altitude. In this paper, the order of the conversion rate coefficient on different underlying surfaces is grassland > wetland > forest > bare land > water body > glacier. Moreover, the ground surface temperature in high-altitude regions is influenced by ecological and environmental factors. The degradation of permafrost, decrease in seasonal snow and melting of glaciers will absorb thermal energy and lower the ground surface temperature. However, albedo decreased and the absorption capacity of solar radiation increased after the melting of snow and glaciers, which increased the ground surface temperature (Figure 11).
The variation in MMGST on different underlying surfaces showed a normal distribution in the Qinghai-Tibet Plateau. The radiant energy had the maximum in the south-west of China throughout the year. The solar radiation reaches the maximum value in summer, and the ground surface temperature has the maximum from June to August [29]. The conversion ratio coefficient is different on different underlying surfaces; therefore, the conversion ratio from total solar radiation to long-wave radiation on the ground surface and the order of ground surface temperature is grassland > wetland > forest > bare land > water body > glacier. The MMGST obtained by the simplified calculation model has a good fit with that of MODIS data for the entire year.
The calculation results of MARGST from the simplified model have a correlation coefficient higher than 0.9 with remote sensing data. After the modification, the calculation results reduce the deviation and mean square root. The ground surface temperature on different underlying surfaces can be inverted by the conversion ratio coefficient and modification coefficient, which are determined by the regional latitude and altitude. The horizontal ground surface temperature was calculated by solar radiation; however, the absorbance of solar radiation differs with the slope and aspect of different underlying surfaces. In this paper, the calculation results of the ground surface temperature have a limitation regarding the slope and aspect. For further study, other environmental factors, such as air temperature, wind speed, soil moisture, precipitation, land cover and transpiration, should be considered in the calculation model to obtain better results.

5. Conclusions

In this paper, the radiant ground surface temperature on different underlying surfaces was calculated based on the energy balance of ground surface radiation. A modified calculation model was built to precisely reflect the ground surface temperature on different underlying surfaces. Some conclusions are summarized as follows.
(1)
In the Qinghai-Tibet Plateau, the absorbance capacity of solar radiation differs on different underlying surfaces, which represents the ground surface temperature. The reasons are mainly associated with the difference in the conversion ratio from total solar radiation to ground surface long-wave radiation on different underlying surfaces. Based on the calculation model, the order of conversion ratio coefficient is distributed as follows: grassland > wetland > forest > bare land > water body > glacier.
(2)
A simplified calculation model of ground surface temperature was built on different underlying surfaces, which considered latitude, altitude and solar radiation. The ground surface temperature can be approximately solved by the conversion coefficient and correction coefficient on different underlying surfaces. From the calculated results of MMGST and MARGST, the modified model has a high correlation with the MODIS data, which is higher than 0.85, and the RMSE and deviation were improved by the modified model. The inter-annual variation in MMGST has a unimodal curve trend with rising and falling.
(3)
The simplified and modified model presented in this paper can calculate the ground surface temperature at every hour of every day. By comparison with the MODIS data, the calculated results are found to have high precision. The application of the model will be expanded to other regions with different altitudes. The existing temperature calculation model mainly focuses on the Qinghai-Tibet Engineering Corridor, which is based on monitoring data. The calculation results represent the given condition and not all the underlying surfaces. The model presented in this manuscript has a higher resolution and wider application potential in ground surface analysis.

Author Contributions

Conceptualization, M.C.; methodology, M.C. and F.L.; software, N.L.; validation, N.L.; formal analysis, Y.G.; investigation, Y.G. and Y.M.; resources, W.M.; data curation, N.L.; writing—original draft preparation, M.C.; writing—review and editing, F.L. and Y.M.; visualization, N.L.; supervision, W.M.; project administration, M.C.; funding acquisition, M.C. All authors have read and agreed to the published version of the manuscript.

Funding

This research was funded by the National Natural Science Foundation of China (Grant No. 42001065), Open Project of State Key Laboratory of Frozen Soils Engineering (Grant No. SKLFSE202106) and the University First-Class Discipline Construction Project of Ningxia, China (Grant No. NXYLXK2017A03).

Data Availability Statement

Not applicable.

Conflicts of Interest

The authors declare no conflict of interest.

References

  1. Wang, H.; Mao, K.; Mu, F.; Shi, J.; Yang, J.; Li, Z.; Qin, Z. A split window algorithm for retrieving land surface temperature from FY-3D MERSI-2 data. Remote Sens. 2019, 11, 2083. [Google Scholar] [CrossRef] [Green Version]
  2. Luo, J.; Zheng, J.Q.; Zhong, L.; Zhao, C.; Fu, Y. The Phenomenon of Diurnal Variations for Summer Deep Convective Precipitation over the Qinghai-Tibet Plateau and Its Southern Regions as Viewed by TRMM PR. Atmosphere 2021, 12, 745. [Google Scholar] [CrossRef]
  3. Schuur, E.A.G.; Bockheim, J.; Canadell, J.G.; Euskirchen, E.; Field, C.B.; Goryachkin, S.V.; Hagemann, S.; Kuhry, P.; Lafleur, P.M.; Lee, H.; et al. Vulnerability of Permafrost Carbon to Climate Change: Implications for the Global Carbon Cycle. Bioscience 2008, 58, 701–714. [Google Scholar] [CrossRef] [Green Version]
  4. Tian, J.; Chen, H.; Wang, Y.; Zhou, X. Methane production in relation with temperature, substrate and soil depth in Zoige wetlands on Tibetan Plateau. Acta Ecol. Sin. 2011, 31, 121–125. [Google Scholar] [CrossRef]
  5. Wang, J.; Wang, G.; Hu, H.; Wu, Q. The influence of degradation of the swamp and alpine meadows on CH4 and CO2 fluxes on the Qinghai-Tibetan Plateau. Environ. Earth Sci. 2010, 60, 537–548. [Google Scholar] [CrossRef]
  6. Zou, F.L.; Li, H.D.; Hu, Q.W. Responses of vegetation greening and land surface temperature variations to global warming on the Qinghai-Tibetan Plateau, 2001–2016. Ecol. Indic. 2020, 119, 106867. [Google Scholar] [CrossRef]
  7. Dumais, S.; Doré, G. An albedo based model for the calculation of pavement surface temperatures in permafrost regions. Cold Reg. Sci. Technol. 2016, 123, 44–52. [Google Scholar] [CrossRef]
  8. Wang, D.; Zhi, F.; Fang, J.; Li, H. Influence of solar radiation on surface thermal regime of different pavement types and its permafrost underlying embankment on the Qinghai-Tibetan Plateau. J. Highw. Transp. Res. Dev. 2008, 3, 38–43. [Google Scholar]
  9. Hu, Z.; Cheng, G.; Gu, L. Calculating method of global radiation and temperature on the roadbed surface of Qinghai-Xizang railway. Adv. Earth Sci. 2006, 21, 1304–1313. (In Chinese) [Google Scholar]
  10. Weng, Q.; Fu, P.; Gao, F. Generating daily land surface temperature at Landsat resolution by fusing Landsat and MODIS data. Remote Sens. Environ. 2014, 145, 55–67. [Google Scholar] [CrossRef]
  11. Hu, L.; Sun, Y.; Collins, G.; Fu, P. Improved estimates of monthly land surface temperature from MODIS using a diurnal temperature cycle (DTC) model. ISPRS J. Photogramm. Remote Sens. 2020, 168, 131–140. [Google Scholar] [CrossRef]
  12. Wu, Y.; Wang, N.; He, J.; Jiang, X. Estimating mountain glacier surface temperatures from Landsat-ETM+ thermal infrared data: A case study of Qiyi glacier, China. Remote Sens. Environ. 2015, 1639, 286–295. [Google Scholar] [CrossRef]
  13. Shen, S.; Leptoukh, G.G. Estimation of surface air temperature over central and eastern Eurasia from MODIS land surface temperature. Environ. Res. Lett. 2011, 31, 8–13. [Google Scholar] [CrossRef]
  14. Zhou, S.; Cheng, J. An improved temperature and emissivity separation algorithm for the advanced Himawari imager. IEEE Trans. Geosci. Remote Sens. 2020, 58, 7105–7124. [Google Scholar] [CrossRef]
  15. Hu, D.; Yu, W.; Yi, X.; Han, F.L. Boundary temperature features of the embankment in Qumar River region along the Qinghai-Tibet transportation engineering corridor. J. Glaciol. Geocryol. 2016, 38, 1332–1339. (In Chinese) [Google Scholar]
  16. Chou, Y.; Sheng, Y.; Zhu, Y. Study on the relationship between the shallow ground temperature of embankment and solar radiation in permafrost regions on Qinghai-Tibet Plateau. Cold Reg. Sci. Technol. 2012, 78, 122–130. [Google Scholar] [CrossRef]
  17. Huang, F.; Ma, W.; Li, M.S.; Ma, Y.M. Analysis on responses of land surface temperature on the Northern Tibetan Plateau to climate change. Plateau Meteorol. 2016, 35, 55–63. (In Chinese) [Google Scholar]
  18. Ma, W.; Mu, Y.; Zhang, J.; Yu, W.; Zhou, Z.; Chen, T. Lateral thermal influences of roadway and railway embankments in permafrost zones along the Qinghai-Tibet Engineering Corridor. Transp. Geotech. 2019, 21, 100285. [Google Scholar] [CrossRef]
  19. Luo, X.; Yu, Q.; Ma, Q.; Zhang, J.M. A prediction model on thermal boundary condition of embankment based on boundary layer theory. J. Cent. South Univ. 2019, 50, 168–178. (In Chinese) [Google Scholar]
  20. Li, R.; Zhao, L.; Wu, T.; Ding, Y.; Xin, Y.; Zou, D.; Xiao, Y.; Jiao, Y.; Qin, Y.; Sun, L. Temporal and spatial variations of global solar radiation over the Qinghai-Tibetan Plateau during the past 40 years. Theor. Appl. Climatol. 2013, 113, 573–583. [Google Scholar] [CrossRef]
  21. Wu, R.; Ma, Y. Comparative analyses on radiation characteristics in different areas over the Tibetan Plateau. Plateau Meteoro 2010, 29, 251–259. (In Chinese) [Google Scholar]
  22. Zhang, L.; Gao, L.; Chen, K. The variation characteristics of radiation balance and surface albedo in Wayanshan Wetland in the Qing-hai Lake watershed. J. Glaciol. Geocryol. 2018, 40, 1216–1222. (In Chinese) [Google Scholar]
  23. Zeng, J. The Characteristics and Parameterization of Land Surface Processes and Its Relationship with Climate over Northern China. Master’s Thesis, Chinese Academy of Meteorological Sciences, Beijing, China, 2011. (In Chinese). [Google Scholar]
  24. Li, Z.; Lyu, S.; Ao, Y.; Wen, L.; Zhao, L.; Wang, S. Long-term energy flux and radiation balance observations over Lake Ngoring, Tibetan Plateau. Atmos. Res. 2015, 155, 13–25. [Google Scholar] [CrossRef]
  25. Zhang, J.; Sun, W.; Du, W.T.; Chen, J.Z.; Qin, X. Characteristics of energy budget under different weather conditions in the ablation area of the Lao hugou Glacier No. 12, Qilian Mountains. J. Glaciol. Geocryol. 2020, 42, 332–343. (In Chinese) [Google Scholar]
  26. Yi, X.; Hu, D.; Yu, W.B.; Liu, W.B. Study on the temperature boundary of embankment and its calculation model of the Qinghai-Tibet Highway in permafrost area. J. Glaciol. Geocryol. 2017, 39, 336–342. (In Chinese) [Google Scholar]
  27. Gu, X.; Ma, Y.; Ma, W.; Sun, F.L. Climatic characteristics of surface radiation flux over the Qinghai-Tibetan Plateau. Plateau Meteorol 2018, 37, 1458–1469. (In Chinese) [Google Scholar]
  28. Zeng, J.; Zhang, Q. A comparative study of the characteristics of the clear-sky land surface processes over the different underlying surfaces in the northern part of China during July-September 2008. Acta Meteorol. Sin. 2012, 70, 821–836. [Google Scholar]
  29. Chen, C.N.; Tian, L.; Zhu, L.Q.; Zhou, Y.K. The Impact of Climate Change on the Surface Albedo over the Qinghai-Tibet Plateau. Remote Sens. 2021, 13, 2336. [Google Scholar] [CrossRef]
Figure 1. Distribution map of underlying surfaces on the Qinghai-Tibet Plateau.
Remotesensing 14 05219 g001
Figure 2. Schematic diagram of solar zenith angle.
Remotesensing 14 05219 g002
Figure 3. Variation in solar zenith angle with different latitude: (a) 15°N; (b) 30°N; (c) 45°N and (d) 60°N.
Remotesensing 14 05219 g003
Figure 4. Schematic diagram of declination angle and hour angle.
Remotesensing 14 05219 g004
Figure 5. Process of surface temperature calculation.
Remotesensing 14 05219 g005
Figure 6. Variation in ground surface temperature in each month ((a,b)—bare land; (c,d)—grassland; (e,f)—glacier land; (g,h)—waterland; (i,j)—wetland; (k,l)—forest land).
Remotesensing 14 05219 g006
Figure 7. The MARGST on bare land and grassland ((a,b)—bare land; (c,d)—grassland).
Remotesensing 14 05219 g007
Figure 8. The MARGST on forest and wetland ((a,b)—forest land; (c,d)—wetland).
Remotesensing 14 05219 g008
Figure 9. The MARGST on water and glacier land ((a,b)—water land; (c,d)—glacier land).
Remotesensing 14 05219 g009
Figure 10. Comparison of measured and calculated results of MARGST in 2015–2019 ((a)—bare land; (b)—grassland; (c)—forest land; (d)—water land; (e)—glacier land; (f)—wetland).
Remotesensing 14 05219 g010
Figure 11. Relationship between ground surface temperature and altitude on each underlying surface ((a)—bare land; (b)—grassland; (c)—forest land; (d)—water land; (e)—glacier land; (f)—wetland).
Remotesensing 14 05219 g011
Table 1. The land-use types in the Qinghai-Tibet Plateau.
CodeLand CoverNotes
20ForestLands covered by arbor, where the crown coverage is larger than 30%.
30GrasslandLands covered by natural herbosa, where the coverage is larger than 10%.
50WetlandLands located at the boundary between land and water, with wet soil, covered by helophyte or hygrophyte.
60Water bodyLands covered by liquid water in land, including rivers, lakes and reservoirs.
90Bare landLands with vegetation coverage less than 10%, including desert, gravel, bare rock, saline–alkaline land.
100GlacierLands covered by snow, glaciers or ice sheets.
Table 2. Coefficient of conversion ratio from total solar radiation to long-wave radiation on different underlying surfaces [21,22,23,24,25].
Underlying SurfaceTotal Solar Radiation Rs/(MJ·m−2)Long-Wave Radiation on Ground Surface Rl/(MJ·m−2)Equilibrium of Long-Wave Radiation at Night Rl|n/(MJ·m−2)Conversion Ratio Coefficient v
Bare land1011.083484.000322.4740.1598
Alpine meadow (10 cm)1089.583596.250290.7430.280
Alpine meadow1023.333448.508281.9490.163
Wetland480.429852.714364.1751.017
Forest804.0001011.000323.7220.855
Water body453.150359.083319.8350.087
Glacier971.228361.8432323.7220.0393
Table 3. Modified equation of ground surface temperature on different underlying surfaces.
Underlying SurfaceModified Equation of Ground Surface TemperatureR2RMSEBias
Bare landTg = 1.2 T g + 30.961.276.25
GrasslandTg = 1.7 T g − 1.20.931.334.86
WetlandTg = 0.51 T g − 6.60.950.913.82
ForestTg = 0.4 T g − 7.50.890.862.59
Water bodyTg = 0.9 T g − 4.30.931.324.83
GlacierTg = 1.2 T g − 20.871.143.17
Publisher’s Note: MDPI stays neutral with regard to jurisdictional claims in published maps and institutional affiliations.

