Article

SUNS: A User-Friendly Scheme for Seamless and Ubiquitous Navigation Based on an Enhanced Indoor-Outdoor Environmental Awareness Approach

1
Department of Land Surveying and Geo-Informatics, The Hong Kong Polytechnic University, Hong Kong 999077, China
2
Research Institute for Artificial Intelligence of Things, Hong Kong Polytechnic University, Hong Kong 999077, China
*
Author to whom correspondence should be addressed.
Remote Sens. 2022, 14(20), 5263; https://doi.org/10.3390/rs14205263
Submission received: 10 August 2022 / Revised: 17 October 2022 / Accepted: 17 October 2022 / Published: 21 October 2022
(This article belongs to the Topic Multi-Sensor Integrated Navigation Systems)

Abstract

:
Ubiquitous and seamless indoor-outdoor (I/O) localization is the primary objective for gaining more user satisfaction and sustaining the prosperity of the location-based services (LBS) market. Regular users, on the other hand, may be unaware of the impact of activating multiple localization sources on localization performance and energy consumption, or may lack experience deciding when to enable or disable localization sources in different environments. Consequently, an automatic handover mechanism that can handle these decisions on a user’s behalf can appreciably improve user satisfaction. This study introduces an enhanced I/O environmental awareness service that provides an automated handover mechanism for seamless navigation based on multi-sensory navigation integration schemes. Moreover, the proposed service utilizes low-power consumption sensor (LPCS) indicators to execute continuous detection tasks and invoke GNSS in confusion scenarios, and transition intervals to make the most firm decision on the credibility of the LPCS-triggered transition and compensate for indicator thresholds. In this manner, GNSS are used for short intervals that help reduce detection latency and power consumption. Consequently, the proposed service guarantees accurate and reliable I/O detection while preserving low power consumption. Leveraging the proposed service as an automated handover helped realize seamless indoor-outdoor localization with less switching latency, using an integrated solution based on extended Kalman filter. Furthermore, the proposed energy-efficient service was utilized to confine crowdsourced data collection to the required areas (indoors and semi-indoors) and prevent excess data collection outdoors, thereby reducing power drainage. Accordingly, the negative impact of data collection on the user’s device can be mitigated, participation can be encouraged, and crowdsourcing systems can be widely adopted.

1. Introduction

Location and environmental awareness (i.e., indoor-outdoor (I/O) detection) are crucial contexts for many services. A location-aware application can adapt itself to instantaneously provide the most convenient services, improve the quality of the experience, increase user satisfaction, and avoid churn. It is crucial to be aware of the user’s location to provide lifesaving healthcare services such as surveillance programs, first responders, and firefighters. In addition to helping save lives, location awareness is used to improve business operations. Location-based services (LBS) are in continuous demand for commercial purposes. However, it is important to note that there is a need to gain more user satisfaction to sustain the prosperity of the LBS market. Offering more facilitation in users’ daily lives by improving performance and extending the availability of LBS can help achieve such an objective. In practice, it is possible to obtain most outdoor localization services using global navigation satellite systems (GNSS). However, accurate GNSS services are unavailable in enclosed places, such as indoor and deep urban environments, owing to satellite signal blocking and attenuation. The unfortunate fact is that this is where most people spend the majority of their time. The lack of accurate localization services in these areas and when shuttling from indoor to outdoor areas hinders ubiquitous and seamless navigation.
To this end, the development of seamless and ubiquitous navigation systems (SUNS) has attracted significant attention from both the academic and industrial communities. As shown in Figure 1, existing seamless positioning studies can be classified into two main categories: systems-based unified signals, and systems-based integrated outdoor and indoor techniques. Pertaining to the former category, LOCATA, developed by Rizos and Yang [1], utilizes the same terrestrial signal and unified receivers indoors and outdoors to ensure navigation continuity. An indoor messaging system (IMES), developed by Kohtake, et al. [2], proposes to deploy anchor nodes that transmit signals with a similar GPS structure. In the IMES, the same GPS chipset receiver can be used indoors and outdoors; however, dedicated transmitters are required. Similarly, Zou, et al. [3] proposed deploying sources for an inverse GNSS signal in each building room. These systems-based unified signals can be beneficial in buildings with open budgets (e.g., airports) and large open spaces with a clear line of sight, but it would be costly to generalize them as a universal solution [4]. Fortunately, sensors and communication receivers embedded in modern smartphones eliminate the cost barrier of end-user devices to adopting systems-based multi-sensory integration for SUNS. Consequently, integrating off-the-shelf indoor and outdoor technologies is more cost-effective than a systems-based unified signal, and is preferred as a low-cost and ubiquitous system.
Wireless positioning systems based on signals observed from the ambient environment, and inertial navigation systems based on infrastructure-free measurements are typically integrated. Wireless localization has significantly advanced over the past few decades. Despite advancements in GNSS-based outdoor navigation, indoor positioning remains an open issue and hinders the widespread use of LBS. Indoors, the absence or degradation of GNSS signals, complexity of indoor environments, signal propagation, and the need to use low-grade devices hinder the achievement of accurate and ubiquitous LBS using wireless localization.
Several indoor positioning technologies have been proposed to extend the coverage of LBS, such as WiFi, cellular, Bluetooth Low Energy (BLE), ultra-wideband (UWB), light, sound, and magnetic field (MF) [5]. Among these technologies, pervasive signals, such as WiFi-based received signal strength (RSS), have been extensively studied to achieve widespread adoption. In contrast to multi-trilateration-based solutions, fingerprinting provides a more accurate solution owing to the mitigation of multipath effects. As a result of using the fingerprinting localization method, the system comprises online and offline stages. In the online localization phase, the continuous activation of the sensors required for indoor and outdoor localization to cover all scenarios is energy-intensive, because the most commonly used outdoor and indoor receivers (GNSS and WiFi) are power-hungry. On the other hand, leaving the onus of activating the sensors required for each environment as user-borne is user-unfriendly.
The requirements of the offline fingerprinting stage must be considered when incorporating fingerprinting techniques into a self-deployable and ubiquitous localization system. The common manual training and updating approaches for offline fingerprinting databases are time-consuming and labor-intensive [6], limiting the scalability of such pervasive technologies. The autonomous generation of these databases is a way to leverage such ubiquitous technologies for developing self-deployable systems. Crowdsourcing-based indoor positioning systems have been proposed as a part of the offline database generation phase. With these systems, rather than hiring professionals, data from a building’s users are effortlessly collected and then used to generate databases autonomously. Such systems can promote the development of self-deployable systems.
In the existing indoor positioning systems (IPS)-based crowdsourcing, several improvements related to post-collection processes have been studied to enhance the quality of offline databases and the performance of fingerprinting solutions. For example, Zhang, et al. [7] proposed quality assessment criteria to select qualified inertial sensor data. Li, et al. [8] introduced accuracy indicators for fingerprinting solution based on crowdsourced databases. Indeed, improvements related to post-collection processes are crucial to achieving better database quality and online localization accuracy; however, the factors that facilitate the data collection process are essential to ensure the applicability and widespread use of such ubiquitous methods. To arouse the interest of smartphone users in participating in the data collection task, Yu, et al. [9] proposed an incentive mechanism by leveraging appropriate motivation measures. Attracting users through incentive schemes is vital for the adoption of crowdsourcing approaches. However, even with incentive motivations, ignoring the negative impact of data collection on users’ devices may bore them and discourage their participation. Consequently, the cost borne by the user device for collecting this data should be considered. To the best of our knowledge, almost all existing crowdsourcing systems assume explicit prior knowledge of the environment type. In real-world scenarios, this assumption keeps the devices continuously collecting data indoors and outdoors, which drains the batteries. From a broader perspective, existing IPS-based crowdsourcing studies neglect the cost borne by the user device while voluntarily collecting this data, even though user roles are the backbone of such systems.
A glaring gap revealed by investigating the existing seamless systems-based integrated techniques is that the handover algorithms that automatically switch between the integrated techniques hinder the development of such SUNS. Certain studies used low-power consumption sensors (LPCS) (e.g., light, magnetometer, cellular, and proximity) to design lightweight handover services. However, the indicators extracted from these LPCS have some limitations that could lead to errors in the detection results, thereby reducing the detection reliability [10]. Other studies incorporated GNSS indicators into LPCS indicators to enhance detection reliability. However, relying on GNSS (i.e., the most power-hungry receiver) for continuous I/O detection rapidly drains the power battery. A close analysis of both studies revealed tradeoffs between service reliability and energy consumption. Studies that developed lightweight services sacrificed reliability, while studies that combined GNSS with low-power sensors maintained their service reliability at the expense of power-saving. Both categories of existing handover mechanisms hinder the development of SUNS, as power-saving and reliable detection are required for SUNS.
In this study, handover mechanism based on an enhanced I/O detection approach is proposed. Compared to existing I/O detection services, our mechanism smartly guarantees reliable environmental detection while maintaining low power consumption. The benefits of the proposed I/O detection mechanism extend over both offline and online phases. In the online localization phase, seamless LBS can be realized by automatically invoking the localization technique for the corresponding environment, thereby reducing superfluous WiFi scanning outdoors and deactivating GNSS indoors. In the offline phase, I/O awareness is leveraged to manage the collection process of the crowdsourced data required for the autonomous generation of offline databases. The contributions of our study can be summarized as follows:
  • An enhanced I/O detector for smartphones with limited power budgets was proposed to achieve reliable environmental detection and maintain low power consumption;
  • A seamless indoor-outdoor localization scheme based on extended Kalman filter (EKF) was proposed by leveraging the proposed I/O detection service as an automated handover mechanism. Furthermore, the proposed service is utilized to manage the collection process of crowdsourced data, reduce the cost borne by the user device, and ensure widespread adoption of SUNS.
The remainder of this article is organized as follows. Related works are reviewed in Section 2. Section 3 describes the system development, proposed handover mechanism, and positioning estimation. The experiments, results, and evaluations are presented in Section 4. Finally, the conclusions and future work are presented in Section 5.

2. Related Work

In this section, we shed light on the existing works on two topics related to the development of ubiquitous and seamless navigation systems: handover mechanism based on I/O detection and indoor localization.

2.1. Handover Mechanism Based on Indoor-Outdoor Detection

This section reviews the existing I/O detection approaches that can act as a handover mechanism to automatically switch between the indoor and outdoor localization techniques, and achieve seamless navigation based on multi-sensory integration schemes. The handover process starts when trigger conditions are met. Such conditions can be derived by observing features that reflect approaching or departing from a positioning system domain to another. In fact, various indicators can be extracted from signal, environmental, and positioning system characteristics [4]. Other indicators can also be obtained from a priori navigation information, such as user path planning. Indoor and outdoor environments have distinct features that can be used to obtain trigger conditions. For SUNS-based multi-sensory integration, the handover mechanism should satisfy four stringent criteria, including: (a) high detection accuracy, such that when I/O results are accurate, appropriate navigation techniques are invoked and smooth navigation is ensured; (b) fast switching, because if a response is delayed, the detection results could become obsolete and positioning techniques might be incorrectly selected, resulting in lower positioning accuracy; (c) energy-saving, since the I/O detection runs as a background service, so the selected sensors for the detection task should be energy-efficient to be suitable for devices with constrained energy budgets; and (d) pervasive applicability, whereby the proposed mechanism should not rely on pre-surveys, external sources, or explicit user feedback.
In the literature, as listed in Table 1, several I/O detection approaches [11,12,13,14,15,16,17,18,19,20,21,22,23,24,25,26,27,28] were proposed based on features extracted from a single sensor and multiple sensors. Many indicators can be extracted from a single sensor, such as GNSS [11,12], WiFi [18,19], cellular [20,21,22], BLE [25], microphone [23], and magnetometer [24]; however, relying solely on one sensor’s indicators may degrade the detection robustness under complex scenarios. Ensuring high detection reliability under different conditions is crucial while developing a handover mechanism for SUNS. Incorporating multiple sensors can provide complementary characteristics to enhance detection robustness, overcoming limitations associated with relying solely on one sensor. In [13,14,15,16,17,26,27,28], several sensors were utilized, including accelerometers, GPS, light, magnetometer, proximity, cellular, microphone, temperature, pressure, and WiFi. IODetector [26] is an example of a lightweight I/O detection service that depends only on LPCS (i.e., light, MF, and cellular detection); however, such service is marred by low detection reliability [27]. Several studies utilized GNSS [13] or WiFi [14,15,16,17] together with LPCS to ensure high detection accuracy; however, such methods significantly consume the battery power. Table 1 summarizes the pros and cons of the existing I/O detection approaches. In summary, the existing handover I/O detection approaches have limitations regarding the development of energy-efficient and reliable I/O detection. The studies that developed lightweight services sacrificed detection reliability; in contrast, the studies that combined GNSS to LPCS maintained the service reliability but lost the advantage of energy saving. Both categories could hinder the development of SUNS since power saving together with reliable detection are highly required for user-friendly SUNS.

2.2. Indoor Localization Systems for Ubiquitous Navigation

The indoor environment is defined as a “seam” or blind area of GNSS services. In a broader sense, indoor areas and junctions between indoor and outdoor areas can be described as seams of LBS [4]. Extending localization availability to these areas ensures smooth and ubiquitous LBS. In the last two decades, several technologies have been proposed for the development of IPS. Different inertial and wireless technologies are utilized for IPS. Based on off-the-shelf inertial sensors, pedestrian dead reckoning (PDR) methods have been commonly used to provide reliable short-term localization and support the development of self-deployable IPS, by bridging the wireless localization outages [29]. Seamless positioning schemes were proposed in [30,31] based only on an inertial navigation system. However, the sole reliance on inertial sensors makes the navigation system highly prone to inertial sensor problems, such as heading drift, sensor bias, and the misestimation of attitude angles due to the flexible portability of handheld devices. Additionally, inertial systems require position and heading initialization. Smartphones’ richness with multiple sensors empowers utilizing wireless signals to update the PDR solution and curb heading drift [32].
As mentioned earlier, several wireless technologies have been proposed for the development of IPS. Jiang, et al. [33] proposed integrating UWB with GNSS and inertial sensors to provide seamless positioning; however, the reliance on UWB transmitters as base stations hinders the ubiquity of the proposed system and requires pre-knowledge of the base stations’ locations. WiFi is primarily used for networking and internet connection. These functions contribute to the widespread deployment of WiFi access points (APs) in current buildings and the inclusion of WiFi chips in almost all mobile devices. Therefore, WiFi RSS is commonly employed for the development of IPS. It is worth noting that strict restrictions from large service providers, such as Apple or Google, are applied on obtaining WiFi RSS measurements or using them for localization purposes. Indeed, such restrictions curb the widespread leveraging of WiFi RSS; however, the development of IPS-based WiFi RSS is still a hot research area since these omnipresent measurements do not add an additional cost to the developed IPS. In recent years, BLE beacons have been compatible with different smartphone models and have gained increasing popularity for positioning purposes; however, the replacement of pervasive WiFi APs with BLE beacons is not cost-effective while developing ubiquitous localization systems. Relying only on auxiliary anchor nodes such as BLE beacons requires an additional deployment cost, makes the developed IPS applicable to only small-scale domains (such as malls, factories, hospitals, and airports), and limits LBS ubiquity.
As mentioned, WiFi fingerprinting approaches provide a more accurate solution than multi-trilateration-based solutions. However, the common manual training and updating approaches for offline fingerprinting databases are time-consuming and labor-intensive [6], and hinder the development of a self-deployable and ubiquitous localization system. A 3D graph was proposed by Pendão and Moreira [34], Ref. [35] to rapidly model the radio propagation environment without previous knowledge about the environment. In the literature, different regression and interpolation models have been proposed to reduce human intervention and accelerate the generation process [36,37,38], especially when databases are generated using traditional training methods, such as static surveying or dynamic walking. However, a certain level of supervision is still required for such approaches. Self-deployable systems can be developed by autonomously generating the offline databases from pervasive resources. Crowdsourcing systems can promote the development of self-deployable systems. Utilizing regression and interpolation models together with crowdsourcing systems can boost generation processes and extend spatial database coverage. However, almost all existing IPS-based crowdsourcing was focused on improving post-collection processes, such as the quality of offline databases and the performance of fingerprinting solutions. Nevertheless, it is essential to facilitate the process of data collection to ensure the widespread use and applicability of crowdsourcing systems. In practical use, data collection management should be considered to avoid annoying users. Indeed, this management requires an enhanced I/O detection approach to reduce the impact of data collection on users’ devices.

3. Methods

3.1. System Development

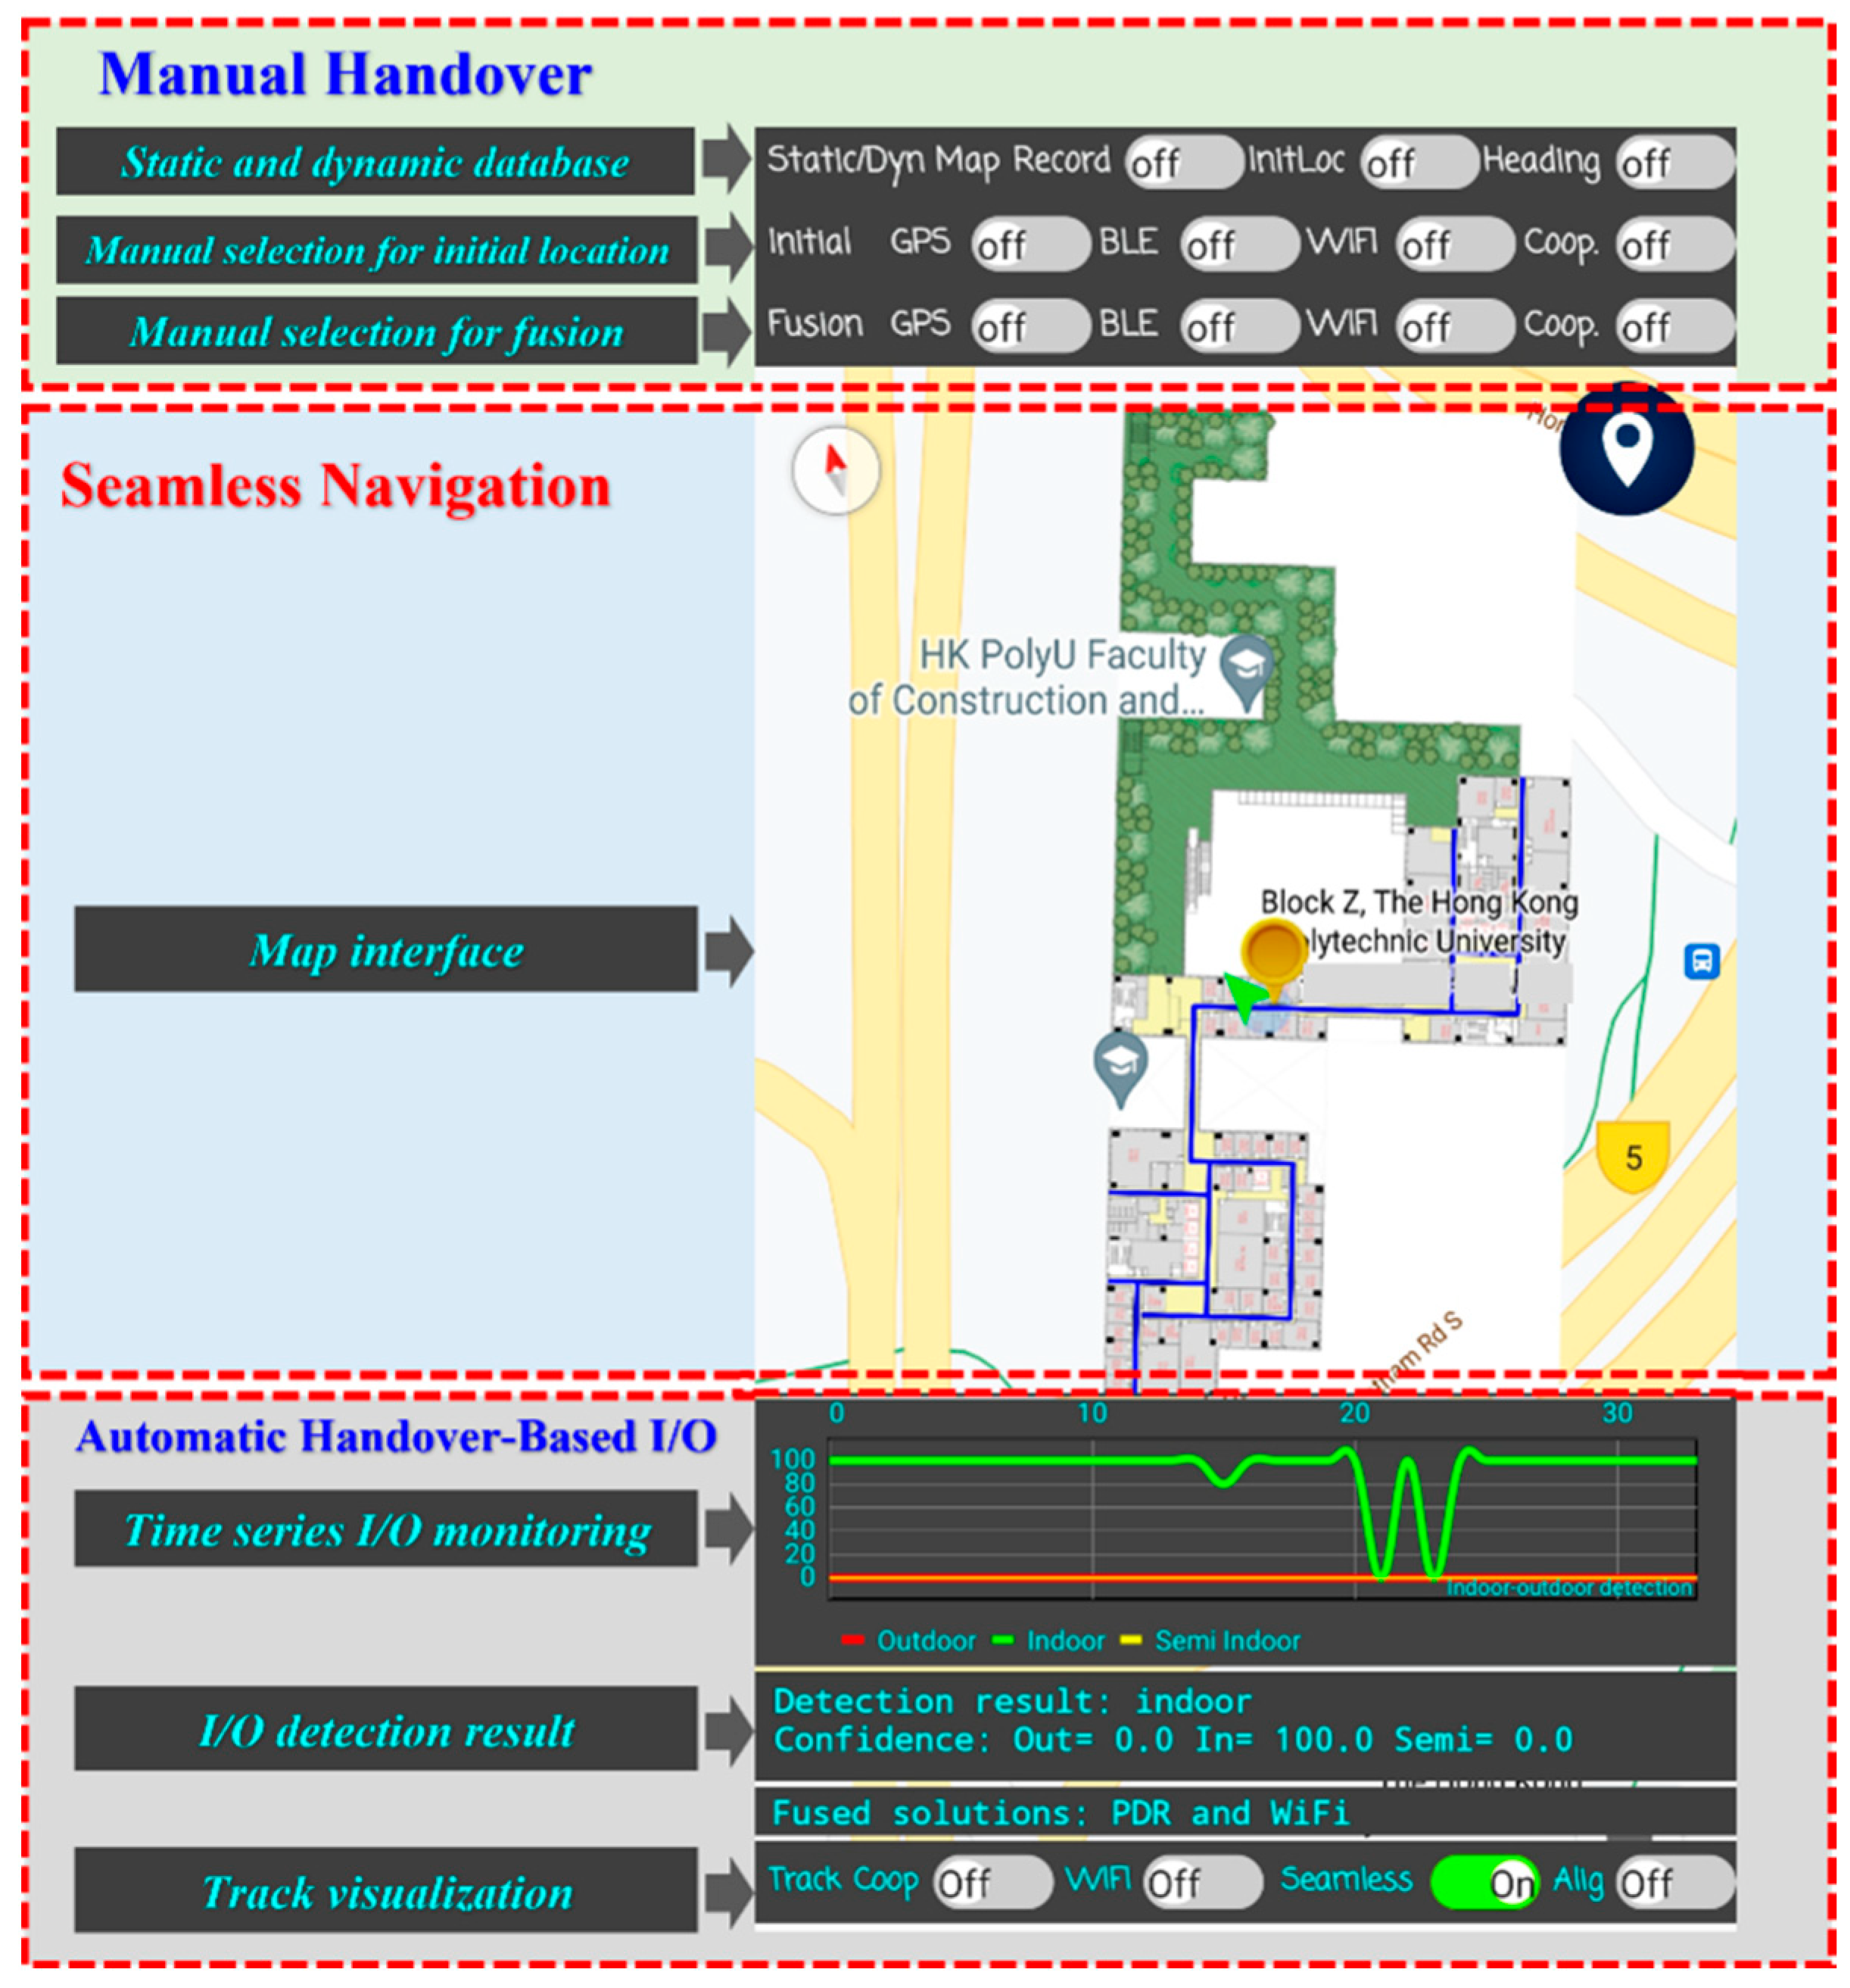
An Android application was developed to apply the proposed system to real-world scenarios. The developed application was written in Java code and utilized a Google Maps API as the user interface to display the user’s location (see the middle panel in Figure 2). The developed application comprises a real-time navigation system. In addition to providing real-time navigation, this application can collect pervasive data from end-users. The collected data were uploaded to a real-time Google cloud server service called “Firestore” that was also utilized to retrieve the offline signatures of the generated database. Firestore is a flexible, scalable database designed for mobile, web, and server development. Through real-time listeners, Firestore keeps data synchronized across client apps regardless of network latency or Internet connection. Reads and writes to Firestore can be performed with a latency of less than 10 milliseconds. Furthermore, data were secured using the Cloud Firestore Security Rules and Identity and Access Management (IAM); refer to [39] for more details.
Regarding the handover mechanism, as mentioned earlier, a handover process can be implemented automatically, as shown in the lower part of Figure 2, or manually, depending on user participation; an example of manual handover can be found in the upper part of Figure 2 (notably, this panel was implemented for testing purposes). However, leaving the onus of the handover process on the user (as in manual handover) is user-unfriendly and requires experienced users. A live chart was developed for the simultaneous and continuous monitoring of the results of the proposed automatic I/O detection (see the lower panel in Figure 2). The results of I/O detection were utilized to automatically alter the localization techniques required for the ambient environment and to manage data collection.

3.2. System Overview

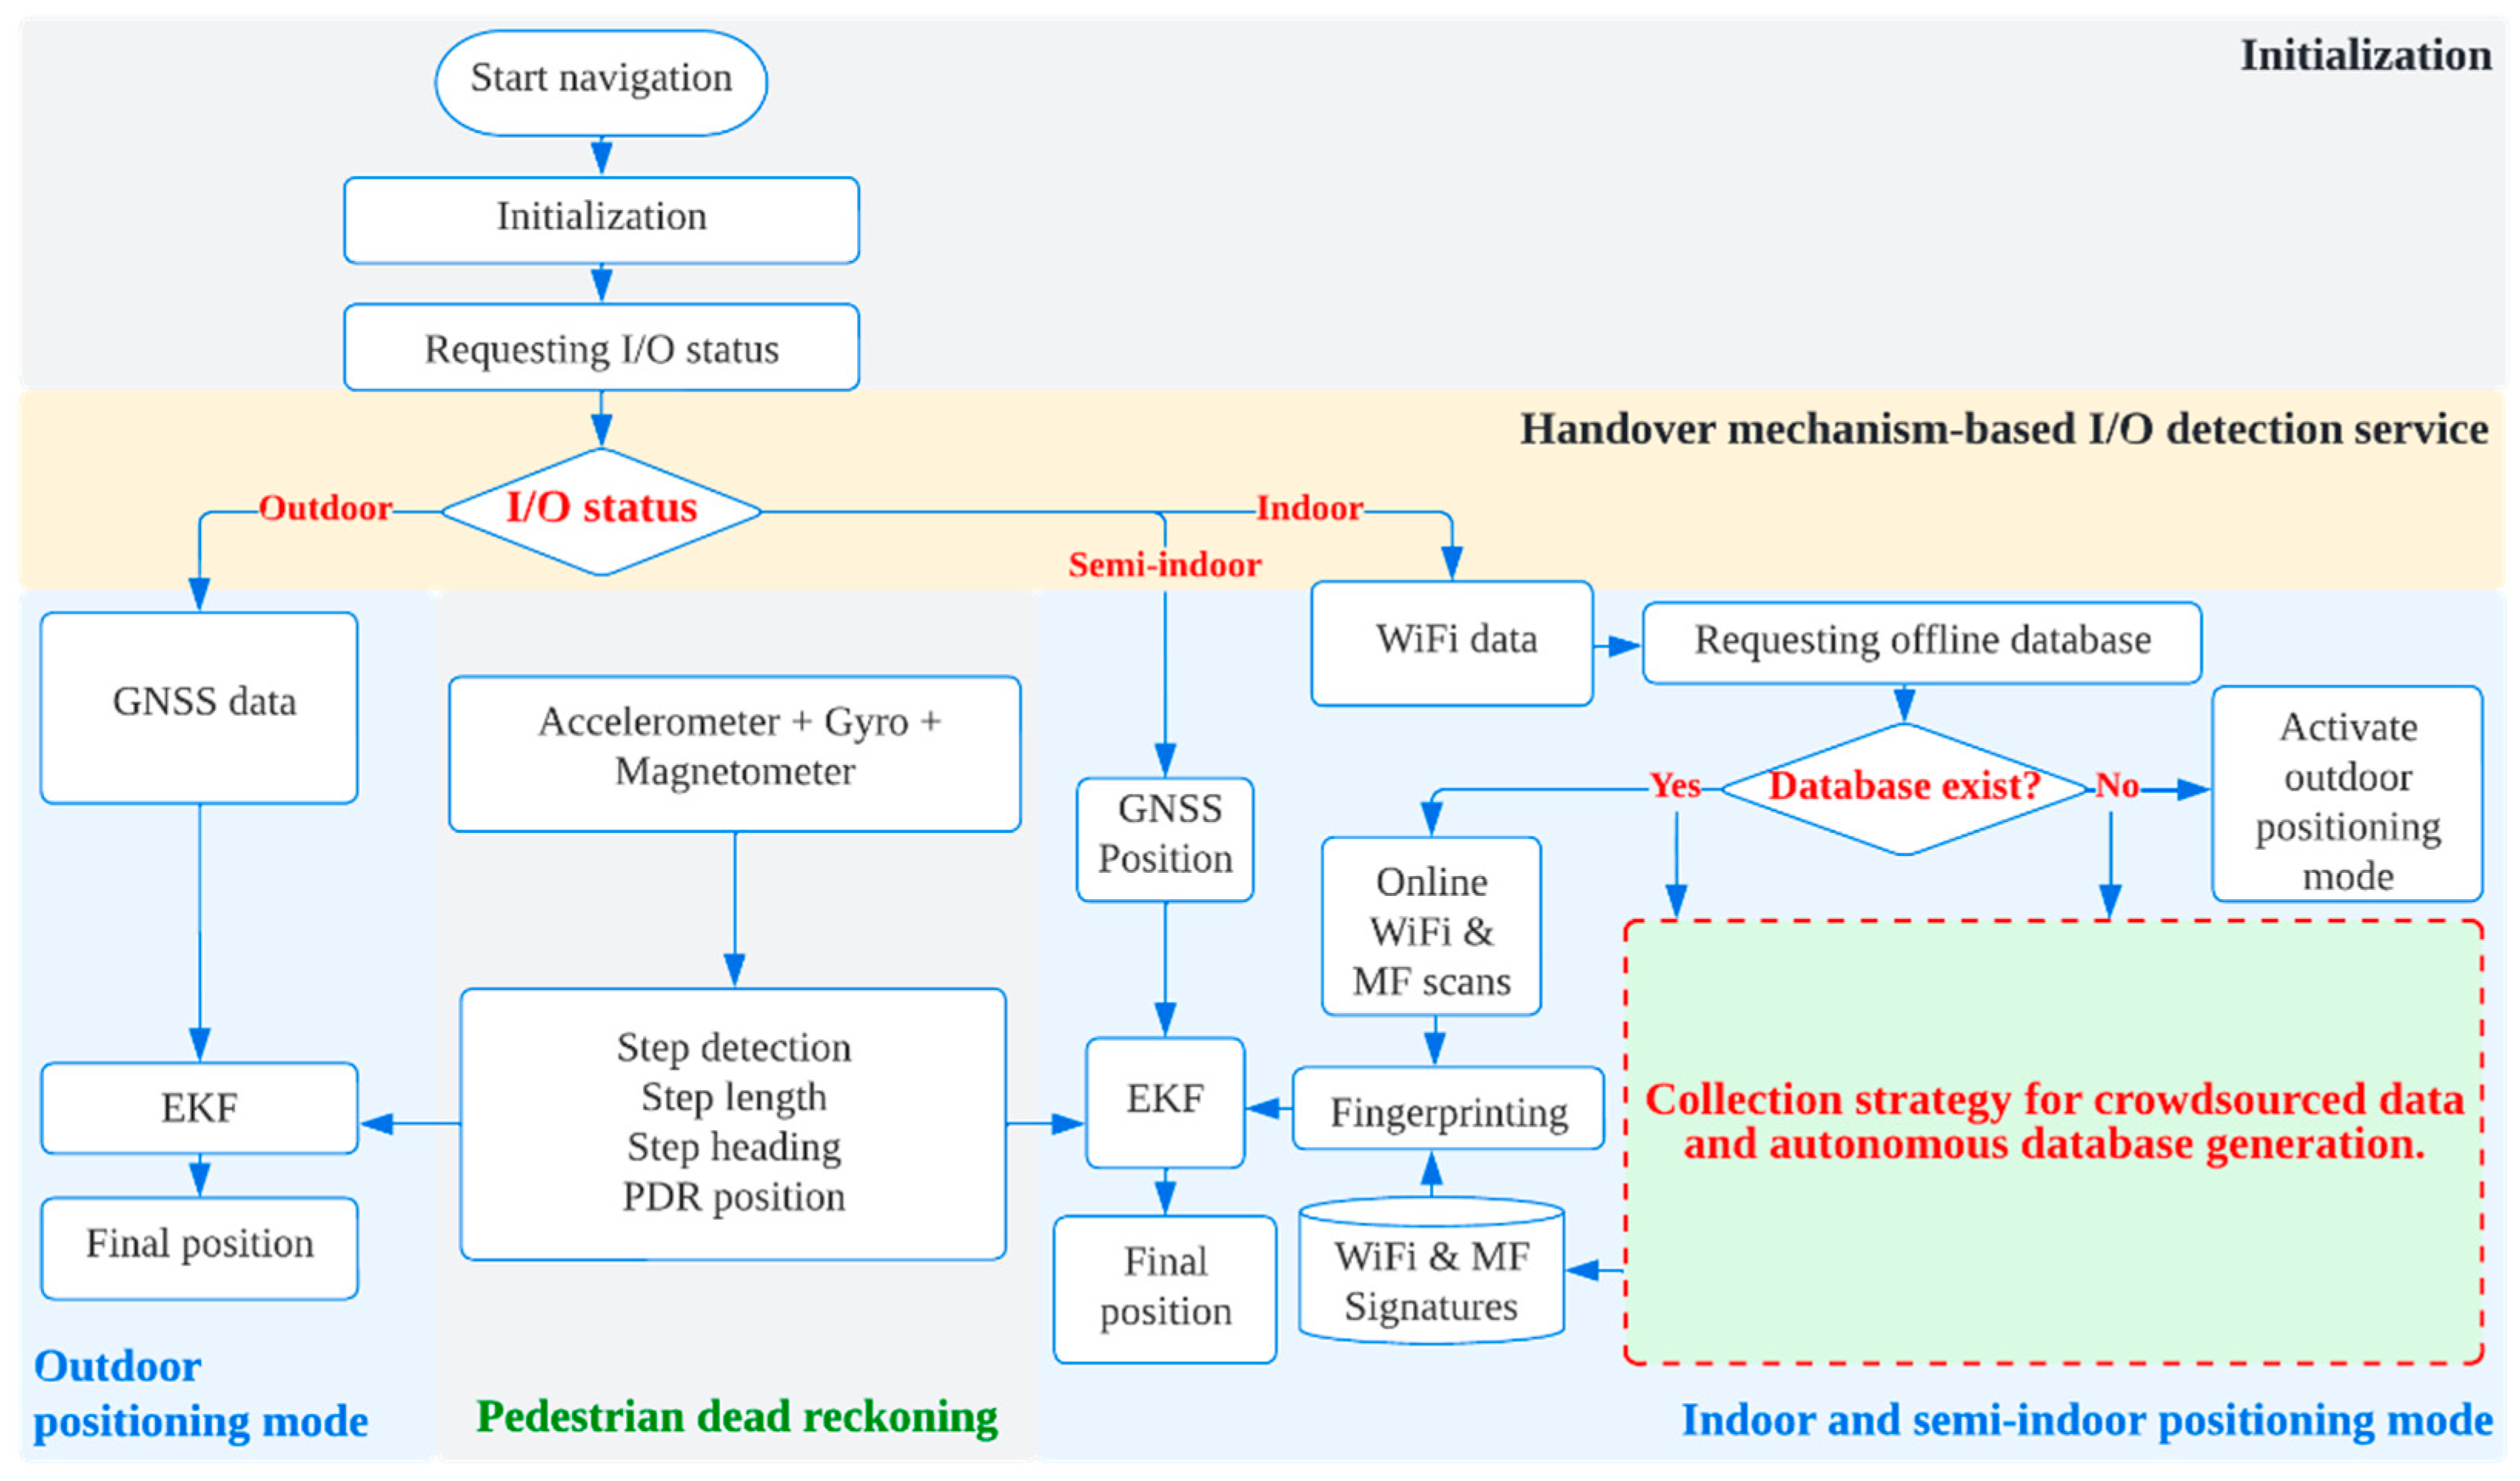
Figure 3 presents a schematic of the proposed system for seamless and ubiquitous navigation. As shown in Figure 3, as soon as the user requested a navigation service, the first step was to estimate the initial position and heading. Subsequently, handover mechanism based on I/O detection was invoked to determine the ambient environment type; refer to Section 3.4 for more details. The handover mechanism was utilized to alter the localization techniques and update the user’s position, as described in Section 3.5. In order to update the PDR solution, fingerprinting approach-based WiFi RSS was utilized since fingerprinting mitigates multipath effects and provides a more accurate solution than multi-trilateration. To overcome the manual training and updating of offline fingerprinting databases, crowdsourced data were collected, to autonomously generate the required offline fingerprinting databases [40] and enable the leveraging of pervasive signals to develop a self-deployable and ubiquitous system. Accordingly, the proposed scheme comprises an offline engine to store the collected crowdsourced data and generate offline fingerprinting databases, and an online engine to localize the user.
In the online engine, the GNSS solution was fused with estimated inertial positioning solution-based PDR if the I/O detection service distinguished the ambient environment as an outdoor area. Indoors, the fingerprinting solution was estimated and integrated with the PDR solution. Both GNSS and WiFi fingerprinting solutions were integrated with the PDR solution for semi-indoor scenarios. An EKF was used in all scenarios to fuse the available solutions. Additionally, when the ambient environment was distinguished as an indoor or semi-indoor area, the developed application activated the collection mode of crowdsourced data. This prevented excessive data collection in outdoor areas and reduced power drainage.

3.3. Initial Position and Heading

We estimated the initial absolute position using GNSS measurements. The initial GNSS position was used to display the map of the user’s location in the interface. The basic service set identifiers (BSSID) of the WiFi APs obtained from the initial online WiFi scan were utilized to invoke the offline fingerprinting databases in case the detected environment was an indoor area. The initial heading was estimated using the acceleration and magnetic field data. First, the roll φ and pitch θ angles were estimated from the acceleration measurements as:
φ = arctan ( a y , a z ) θ = arctan ( a x , a y sin φ + a z cos φ ) ,
where a x , a y ,   and a z   are the acceleration values relative to the device coordinate system (DCS) in the x, y, and z directions. The accelerometer measurements could not be used to estimate the change in the heading angle around the z-axis. Thus, the acceleration vector was used to rotate the device frame parallel to the horizontal navigation plane. The magnetometer was then used to estimate the magnetic heading angle ψ m a g measured relative to the magnetic north, as follows:
ψ m a g = arctan ( m y cos φ + m x sin φ sin θ m z sin φ cos θ , m x cos θ m z sin θ )
where m x , m y , and m z are the magnetic field values relative to the DCS in the x , y , and z directions. The magnetic declination ( δ d e c ) was considered to estimate the heading angle relative to the North Pole ( ψ ) as follows: ψ = ψ m a g δ d e c . Notably, the inertial sensor measurements were converted from the DCS to the navigation coordinate system (NCS) using the quaternion. The proposed I/O detection service was then invoked to decide the ambient environment type, as discussed in the following section.

3.4. Handover Mechanism Based on Environmental Awareness

3.4.1. Rationale

In our framework, we propose handover mechanism based on I/O detection that smoothly runs on any smartphone and satisfies four conditions: (a) high detection accuracy; (b) fast switching; (c) energy efficiency; and (d) pervasive applicability. As mentioned previously, smartphones contain different types of sensors that can provide distinct features for I/O detection. We initially checked the power consumed by each sensor to select power-saving sensors to implement an energy-efficient detection approach. The study performed by Khan, et al. [41] investigated the power consumption of the smartphone sensors. They computed the power consumed by each sensor while the user was stationary or walking in indoor and outdoor environments (refer to [41] for more experimental details). From the investigation results, it was observed that: (1) GPS and WiFi are the most power-hungry receivers while walking or stationary; (2) light, proximity, and accelerometer are the lowest power-consuming sensors in all test cases; and (3) the magnetometer consumes less power but more than the light and proximity sensors.
To select the appropriate sensors, we applied an exclusion strategy (i.e., eliminating sensors that did not meet the four most common conditions). The first sources discarded were Bluetooth receivers, because of their limited applicability. WiFi was the next source excluded even though it complies with the pervasive applicability criterion because it apparently consumes high levels of power while providing variant detection capability under complex scenarios. Owing to their primary functionality, smartphones remain connected to nearby cellular towers. Therefore, the marginal power consumption of the collecting-cell RSS for I/O detection was negligible. On this basis, cellular RSS is utilized for I/O detection. Light, magnetometers, and proximity sensors were considered because of their low power consumption. Their mere reliance on LPCS guarantees that energy-efficient services can be obtained. However, the indicators extracted from these sources have some limitations in different scenarios (as will be discussed in detail in the following subsections) that could lead to misdetection results and reduce detection reliability.
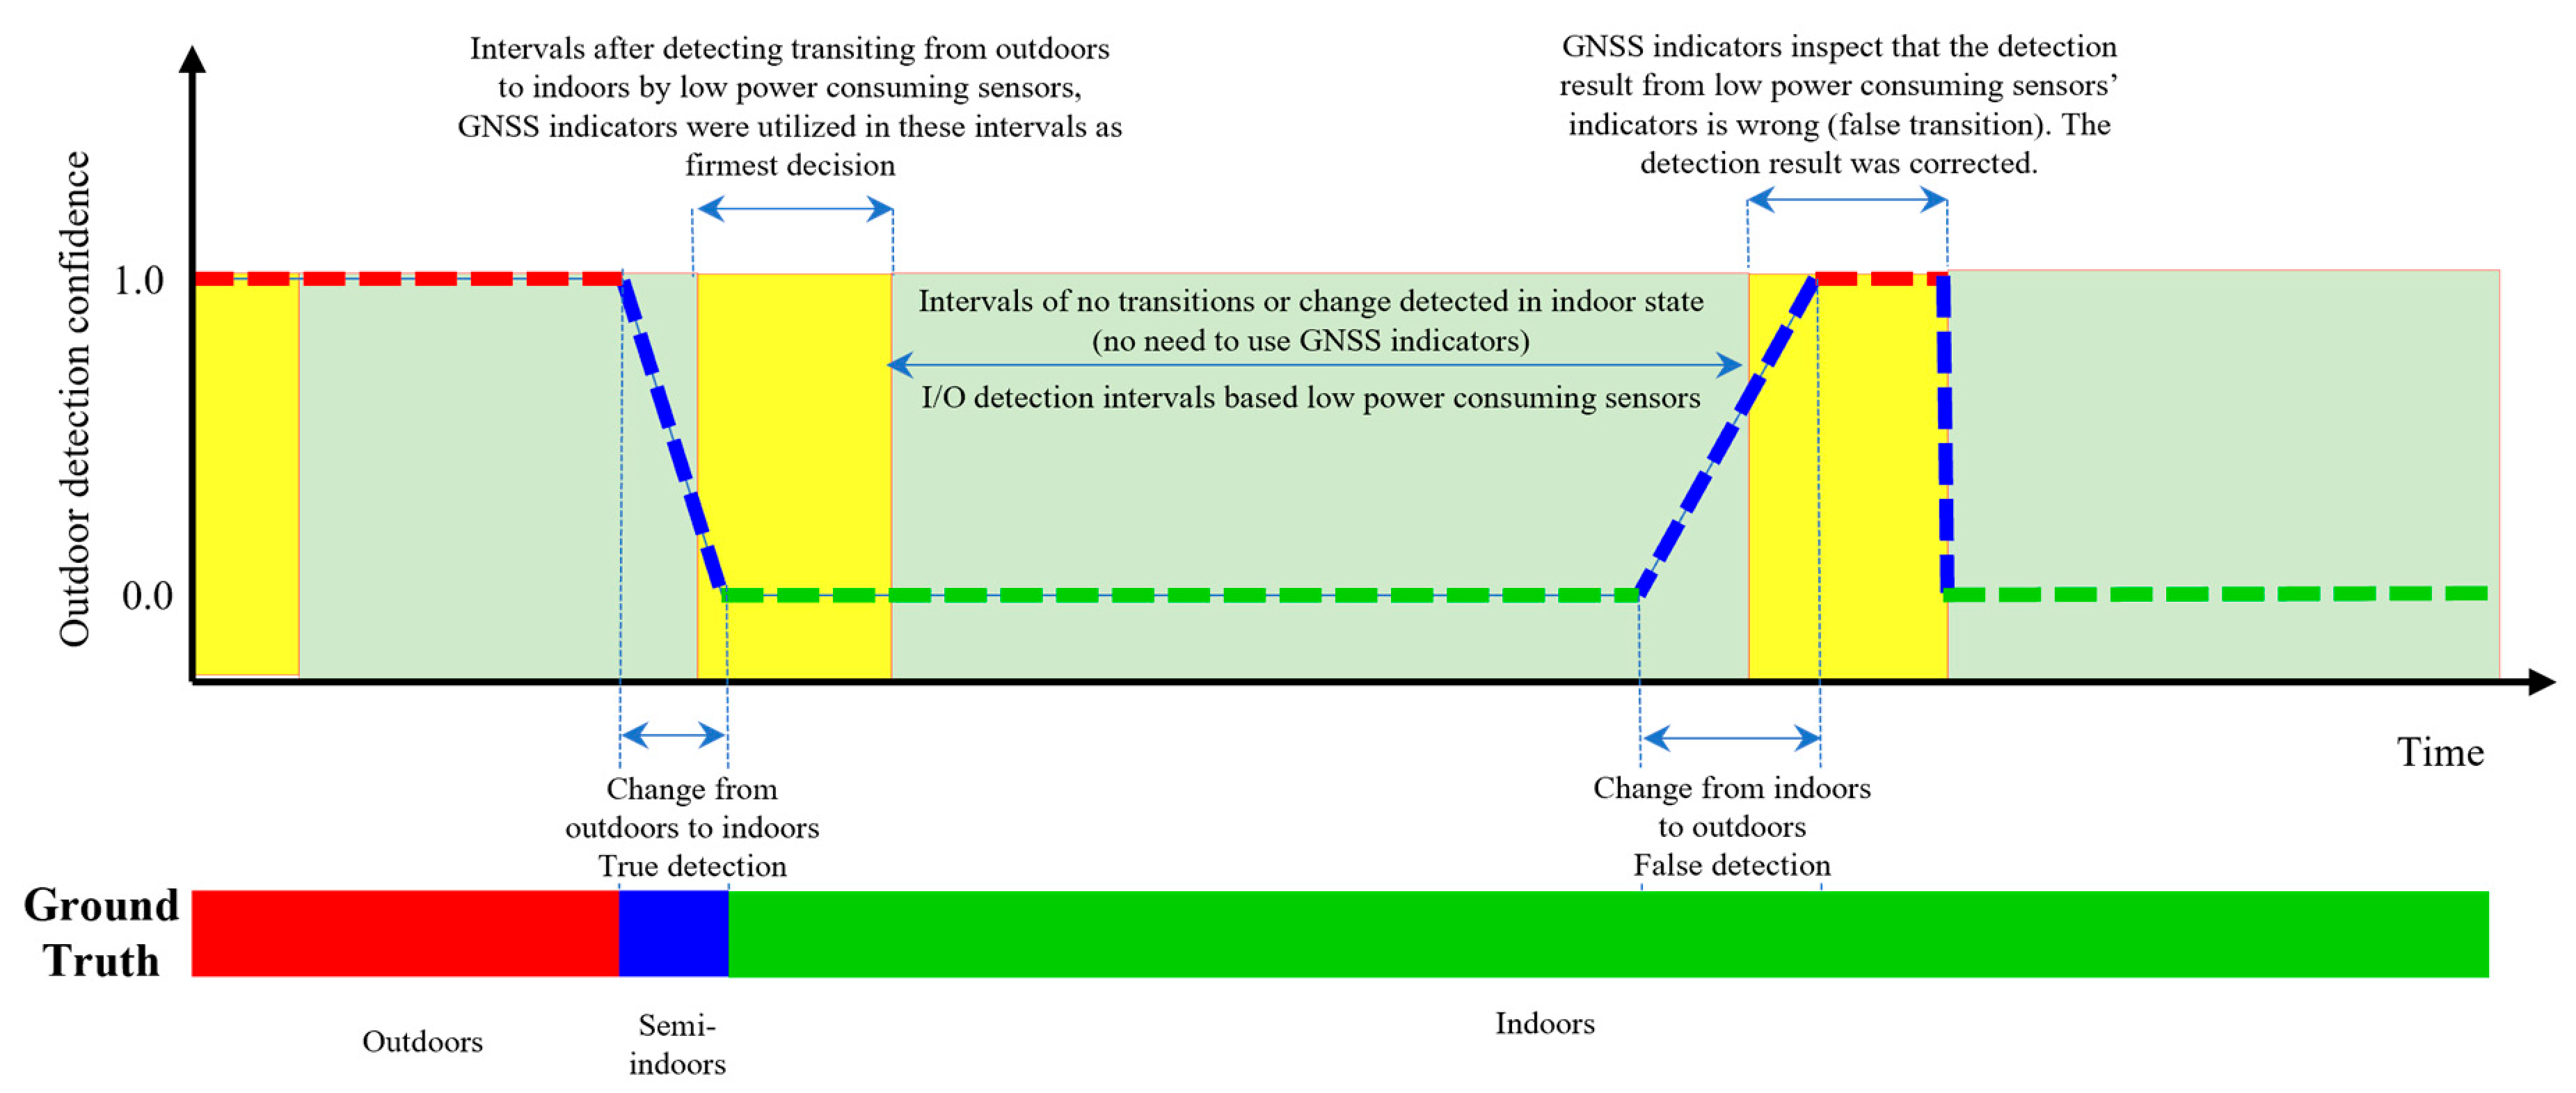
For our I/O detection method, we mainly depended on energy-efficient sensors (i.e., light, proximity, cellular, and magnetometer) for continuous I/O detection (i.e., the green area in Figure 4) to save battery power. These sensors were also utilized to observe the intervals of the sudden change from the indoor to outdoor state or vice versa (see Figure 4) to invoke the GNSS receiver to give the firmest decision on the credibility of the transition. Subsequently, GNSS were activated for short intervals (i.e., the transition intervals plotted by the yellow area in Figure 4). Consequently, in contrast to the existing studies, we obtained reliable detection while saving battery power. The following subsections illustrate the utilization of each sensor in the I/O detection service.

3.4.2. Utilizing Light Intensity as an I/O Detection Indicator

Even on cloudy or rainy days, sunlight has a much higher visible spectrum than indoor artificial light. Light sensors can detect light in invisible ranges such as infrared or ultraviolet wavelengths [27]. Inspired by this, the apparent differences between the detected light intensity indoors and outdoors were used as an indicator for I/O detection. However, at night (i.e., in the absence of sunlight), the utilization of artificial light sources indoors and outdoors provides the same range of light intensity, which makes the light indicator useless. Additionally, blocking the light from reaching the light sensor (e.g., placing the smartphone in a pocket, bag, or over the ear while calling) is another obstacle to exploiting light as an I/O indicator. Such blockage hinders the measurement of the actual light intensity and results in false detections. To identify whether the light sensor was exposed or blocked, the proximity sensor, embedded in the same position as the light sensor, was exploited. The proximity sensor returns a distance in cm ( d p r o x ) that reflects the vacancy surrounding the device. From a power-saving perspective, the proximity sensor requires a low level of power [41] and can be leveraged to ensure the reliability of the light indicator. A proximity distance threshold (i.e., 3.0 cm) was defined to determine whether the measured light intensity could be used as an I/O indicator. The detected light intensity was denoted by I . Initially, sunrise–sunset intervals were computed to determine the sunlight intervals. During the day, the proximity distance was inspected; if d p r o x was higher than 3 cm, the measured light intensity was utilized as an I/O indicator. I was compared to the light intensity threshold τ I o u t (i.e., 3000 Lux) that was used to define the default threshold for maximum I outdoors. Notably, with changes in weather conditions (e.g., sunny, foggy, rainy, and cloudy), the light intensity threshold was accordingly adjusted. For example, on a sunny day, at noon, light could have an intensity higher than the default threshold (i.e., I > τ I o u t ), and outdoor detection with a high confidence could be confirmed; τ I o u t could automatically be compensated for after checking the confidence of the GNSS indicators. For more clarification, if the detected light intensity was higher than 3000 Lux, the user was almost certainly exposed to sunlight because the light intensity of artificial light indoors cannot achieve such levels. On a sunny day, light intensity could exceed 3000 Lux, and confidence of the user being outdoors could then increase if the threshold used to define the maximum intensity was constant at 3000 Lux; however, the detected intensity would give the same outdoor confidence of other days with other weather conditions because the change would be in the weather, not in the type of environment. Therefore, the algorithm was designed to self-compensate the light intensity threshold to avoid over- or under-estimation of I/O confidence in these scenarios. In contrast, during the night or during sensor blocking, other sensor indicators were utilized to distinguish the ambient environment.

3.4.3. Utilizing Cellular RSS as an I/O Detection Indicator

The epoch-by-epoch values of cellular RSS vary over time, place, and antenna models [26]. In contrast, RSS variations within short intervals are indicative of environmental changes. When the ambient environment changes, abrupt variation in cellular RSS can be observed because the walls can block line-of-sight paths to cell towers. RSS variation can help minimize the possibility of false detection compared with using the epoch-by-epoch RSS value, especially when applied to a variety of devices and places. In summary, cellular RSS variation is independent of factors that could hinder its universal application. However, the RSS variation in a single tower has two inherent limitations. First, the handover from one tower to another normally causes a significant change in cellular RSS. Here, the RSS variation may not correctly indicate I/O transition. Second, the user may experience dramatic changes (false bursts) in cellular RSS in a semi-outdoor environment when turning around at a corner [21]. Corner effects may lead to incorrect transitions and detections.
When a smartphone is within the range of multiple cell towers, the detection accuracy can be improved by leveraging all visible cell towers instead of only the connected tower. Thus, the signal strength of all cell towers and their RSS variations were measured. This provided a solution to the tower handover problem because the cell tower connected to the device may have been one of the observed cell towers. Exploiting the observed set of cell towers helped mitigate false bursts and corner effect problems. An indication of false bursts was obtained when the RSS of the connected cell tower varied significantly, although the RSS of other towers remained unchanged. On this basis, for the i t h observed tower ( 0 i n ) , the change in the observed RSS over the last N seconds (i.e., N = 10 ) was estimated as: Δ Rss i = Rss t Rss t N . The positive change in Δ Rss i over the threshold τ Δ R s s (i.e., τ Δ R s s = 10   dBm ) was considered a transition from indoors to outdoors and vice versa. The confidence C Δ Rss of this transition was computed based on the change observed from the other towers as: C Δ Rss = Δ Rss . s / n , where s is the number of towers observed with a positive Δ Rss and n is the total number of observed towers.

3.4.4. Utilizing Magnetic Fields as an I/O Detection Indicator

Indoors, metallic structures and electrical cables interfere with magnetic field signals and cause higher MF disturbances than outdoors. The difference between the observed indoor and outdoor variation can be used as an I/O indicator. However, the glaring impact of this phenomenon can be observed while the user is walking, yet decays in static mode [24,26]. Thus, in our I/O detection approach, the stationary and moving modes were checked first. While moving, the MF detector determines the average variance over the last recorded N seconds (i.e., N = 10 ) to serve as an I/O indicator. If the average MF variance is larger than the threshold τ m (i.e., 150 μ T ), the MF detector provides an indication of the indoor environment. Therefore, I/O confidence was estimated as a function of magnetic variation and pedestrian speed. At stationary intervals, the small variance detected in all scenarios hinders using the MF variance as an I/O indicator.

3.4.5. Utilizing GNSS Measurements as an I/O Detection Indicator

As discussed in the previous subsections, the indicators of LPCS have different limitations. GNSS indicators are trusted sources and can make final decisions when LPCS are exposed to confusion. Thus, we utilized GNSS indicators in intervals (see Figure 4, yellow zones) when the LPCS triggered an I/O transition. GNSS indicators were employed at these intervals to inspect and confirm the decisions of the LPCS. Two types of GNSS measurements were used to determine whether the user was outdoors or indoors, including the ratio of the signal power to the noise power ( s n r ), and the number of observed satellites ( n s ) (i.e., observed with s n r > 0 ). A high n s and s n r indicates high confidence of being outdoors. The n s was directly used to estimate the detection confidence as: C ns = n s / n s o u t , where n s o u t is the threshold used to define the maximum number of satellites in open sky areas (i.e., n s o u t = 9 with s n r > 0 ).
The confidence of being outdoors was computed based on s n r as: C snr = s n / s n r o u t , where s n r o u t is the threshold used to define the maximum s n r in open sky areas (i.e., s n r o u t = 25 ). Additionally, the maximum change in the s n r over the last N seconds was estimated to represent the variation in the s n r , as follows:
Ω s n r = m a x ( s n r i s n r i + ( N / 2 ) 1 )
Higher values of Ω s n r increase the probability of being indoors. For example, when Ω s n r is observed higher than the threshold τ Ω s n r (i.e., 7) together with a low n s , it provides a powerful indication of being indoors. Accordingly, the confidence in being outdoors was computed based on Ω s n r as C Ω s n r = τ Ω s n r / Ω s n r .

3.4.6. Integration of I/O Indicators

The indicators of the sensors used have weaknesses and strengths. The light indicator enables precise detection and fast switching [22]. However, the effectiveness of such an indicator is limited to the availability of sunlight and exposed light sensors. The MF variation indicator is only effective in the dynamic mode. The credibility of cellular RSS variation must be supported by another source in confusing situations (e.g., corner effects and false bursts). GNSS can provide a reliable decision, but they can slow down the response and drain battery power. The integration of these sources can help in achieving arbitrated decisions.
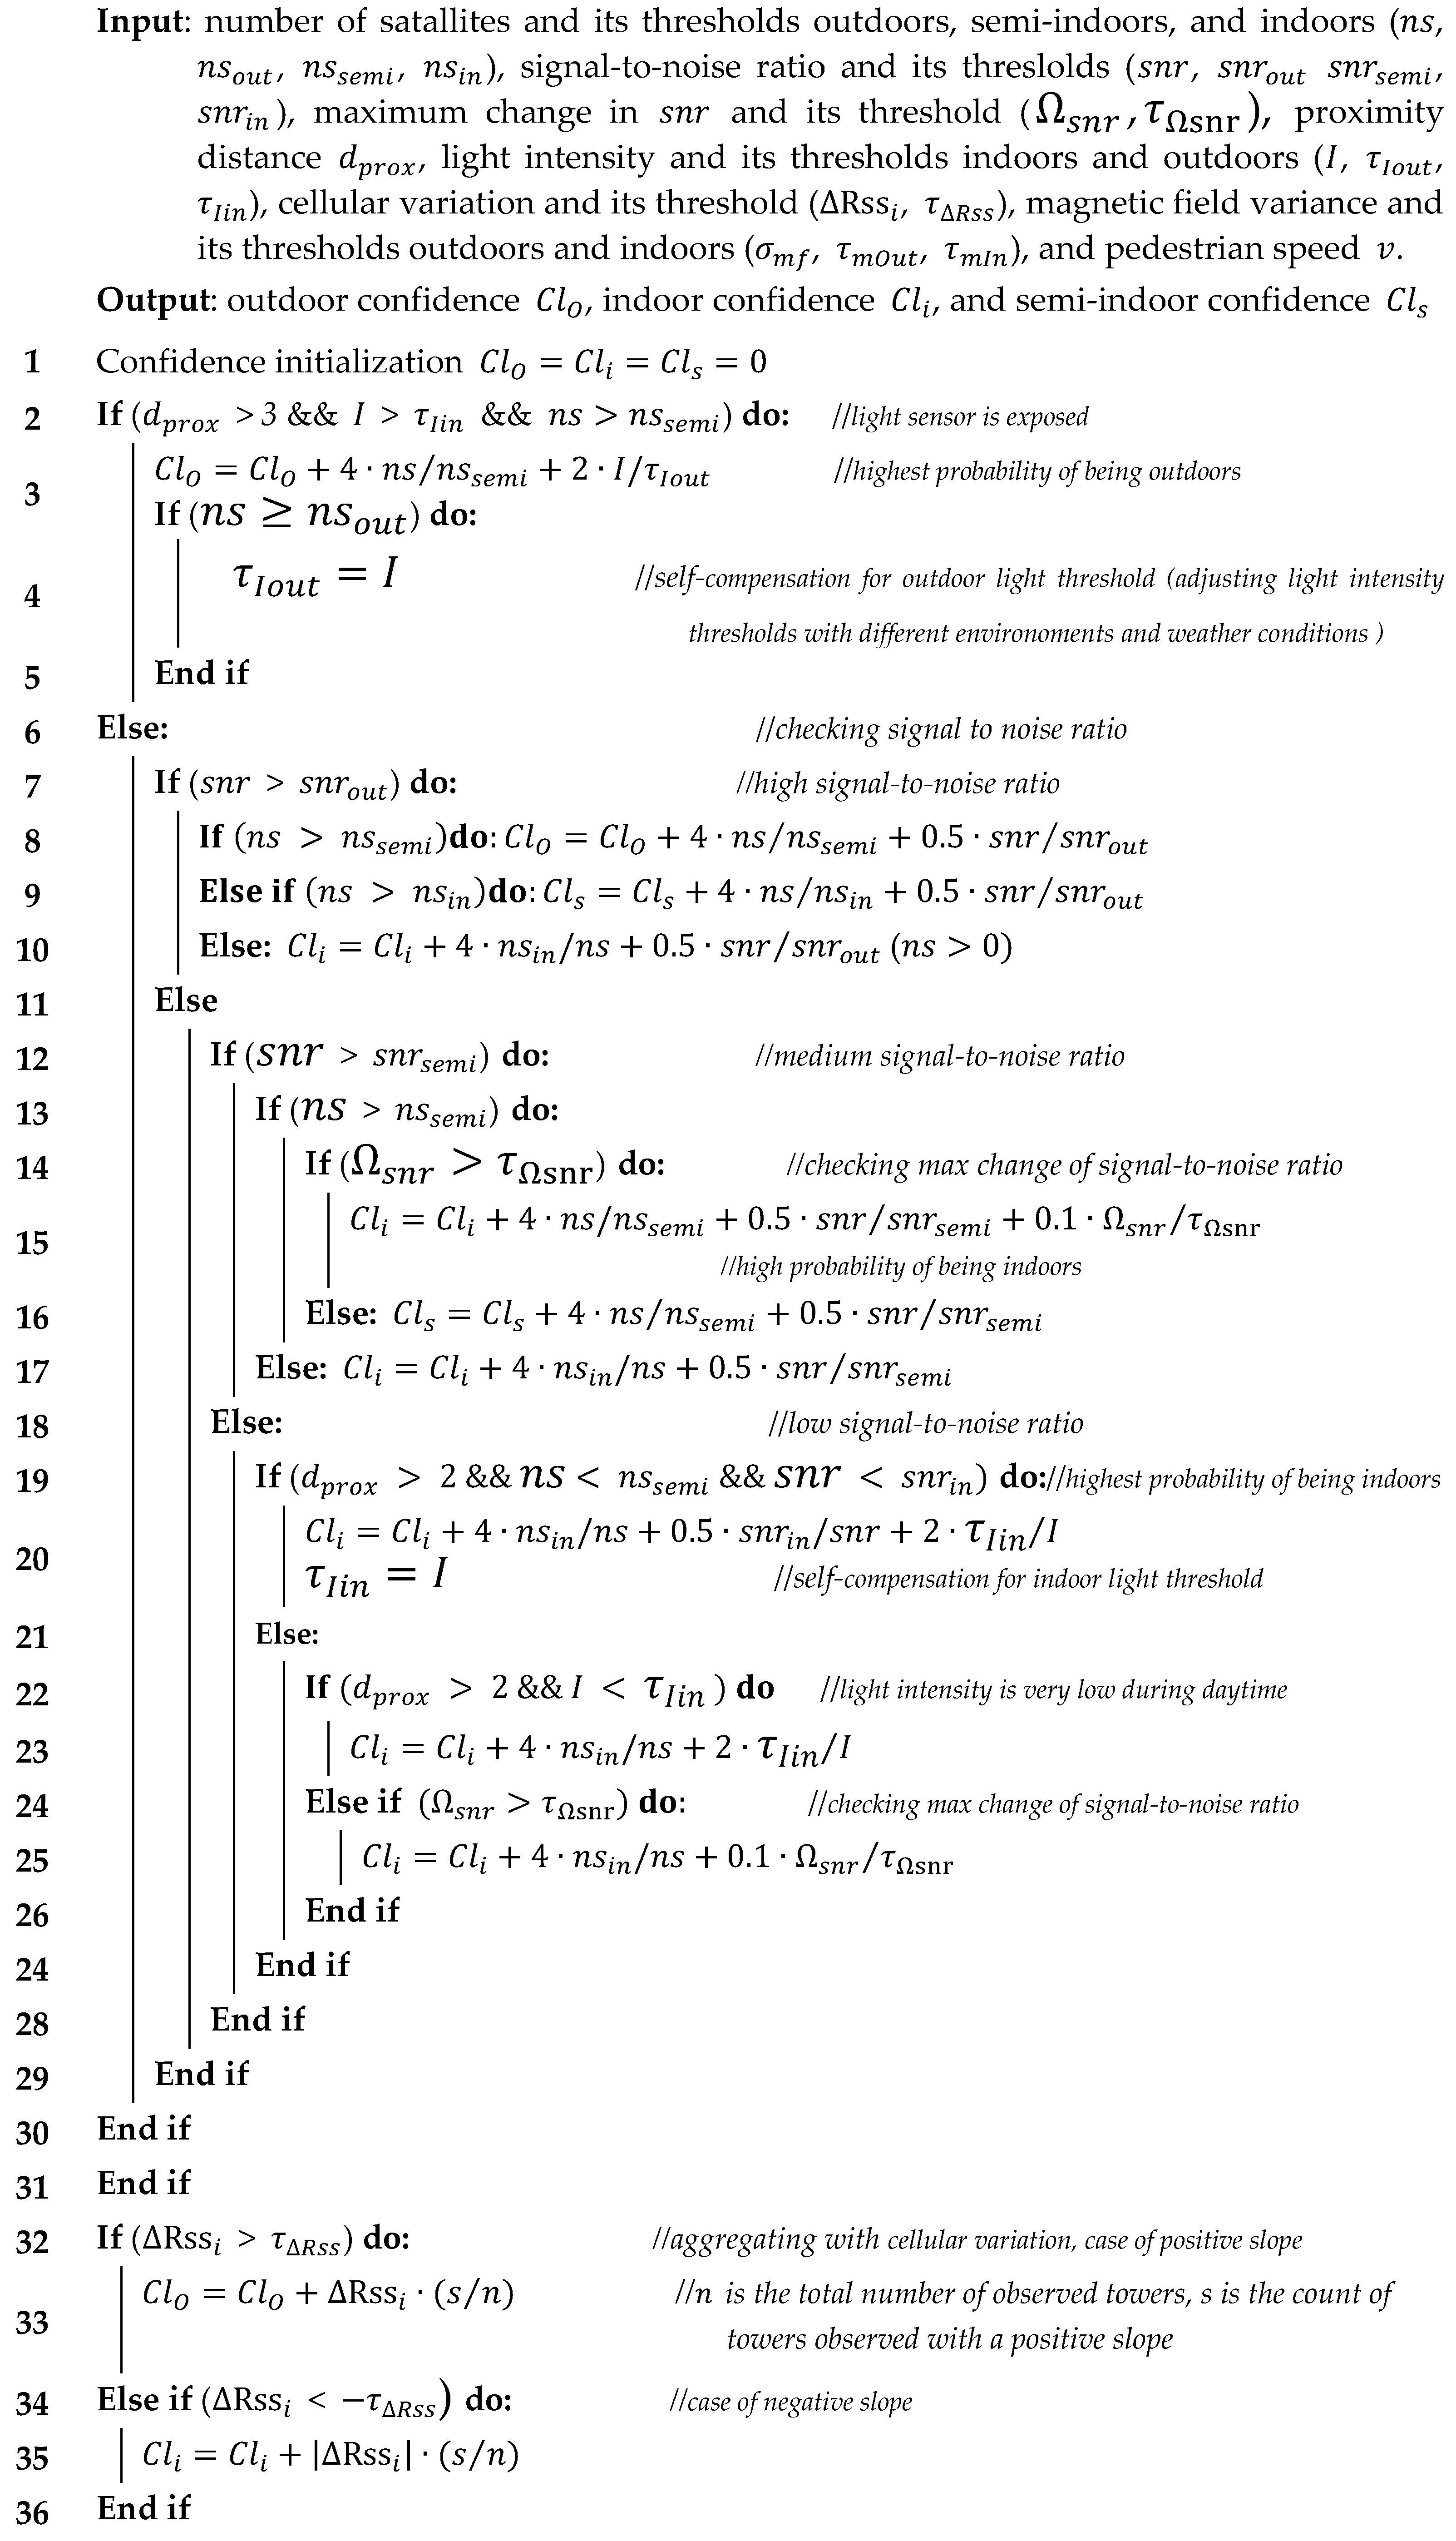
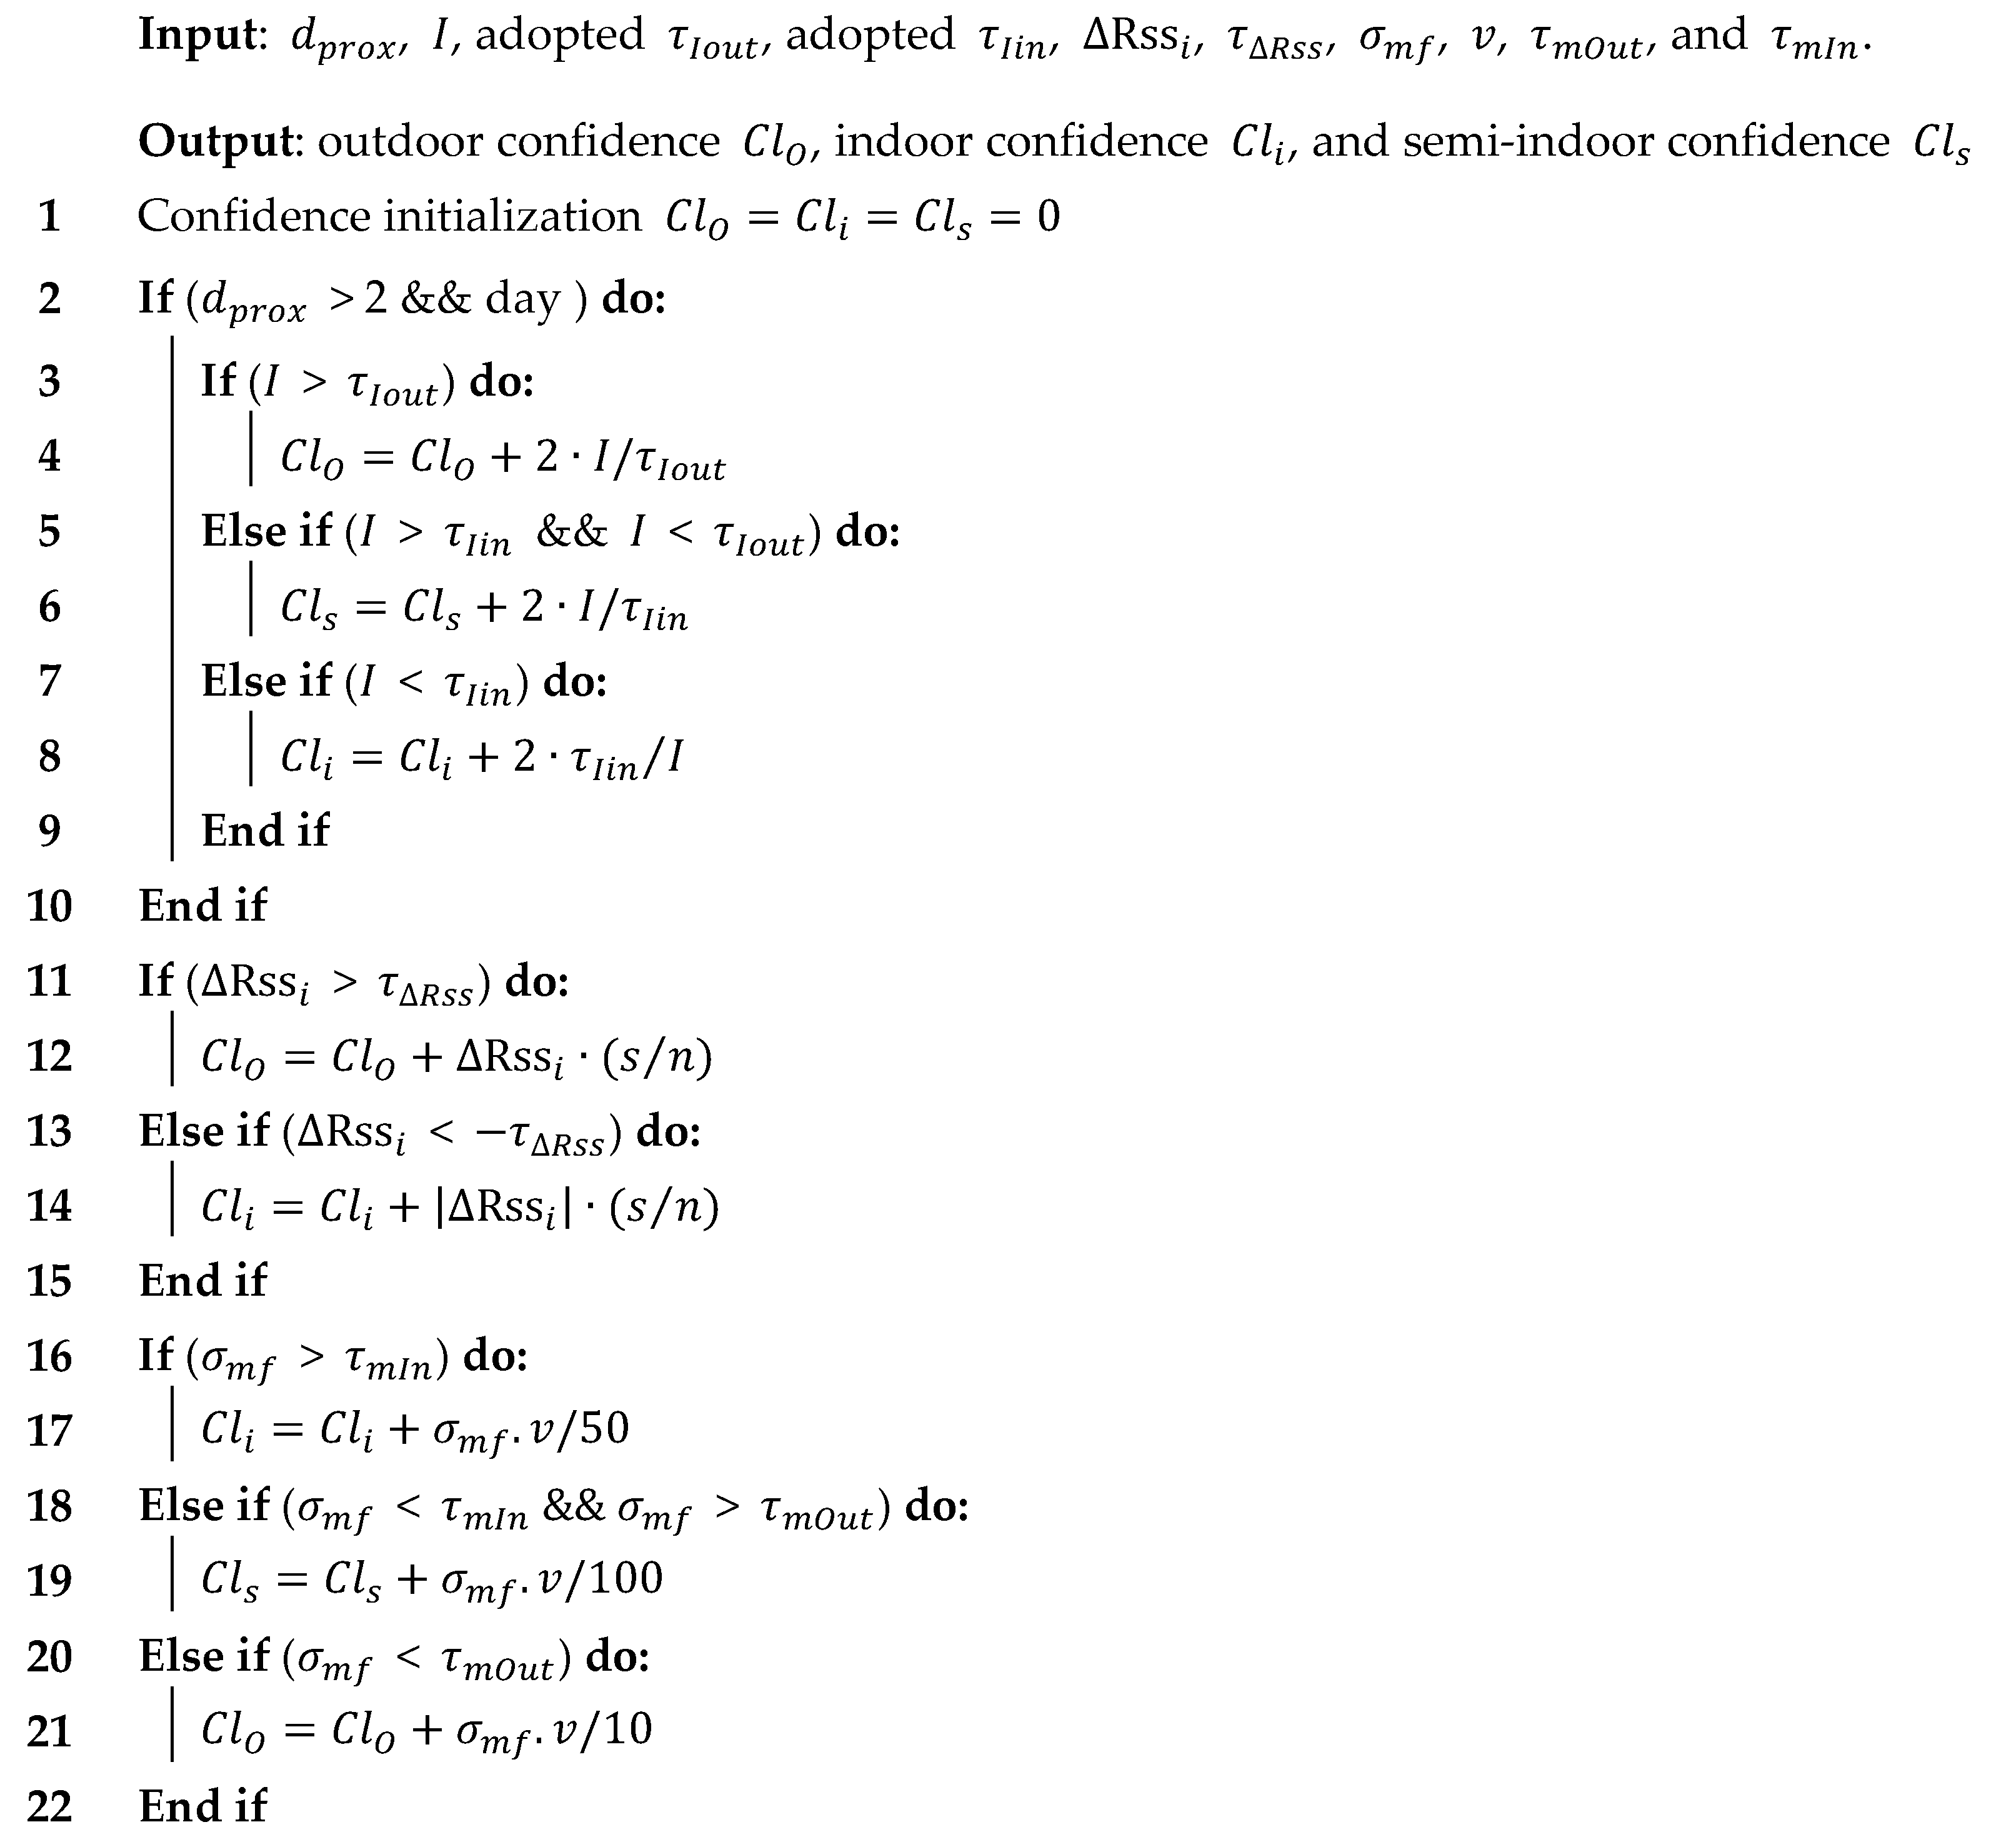
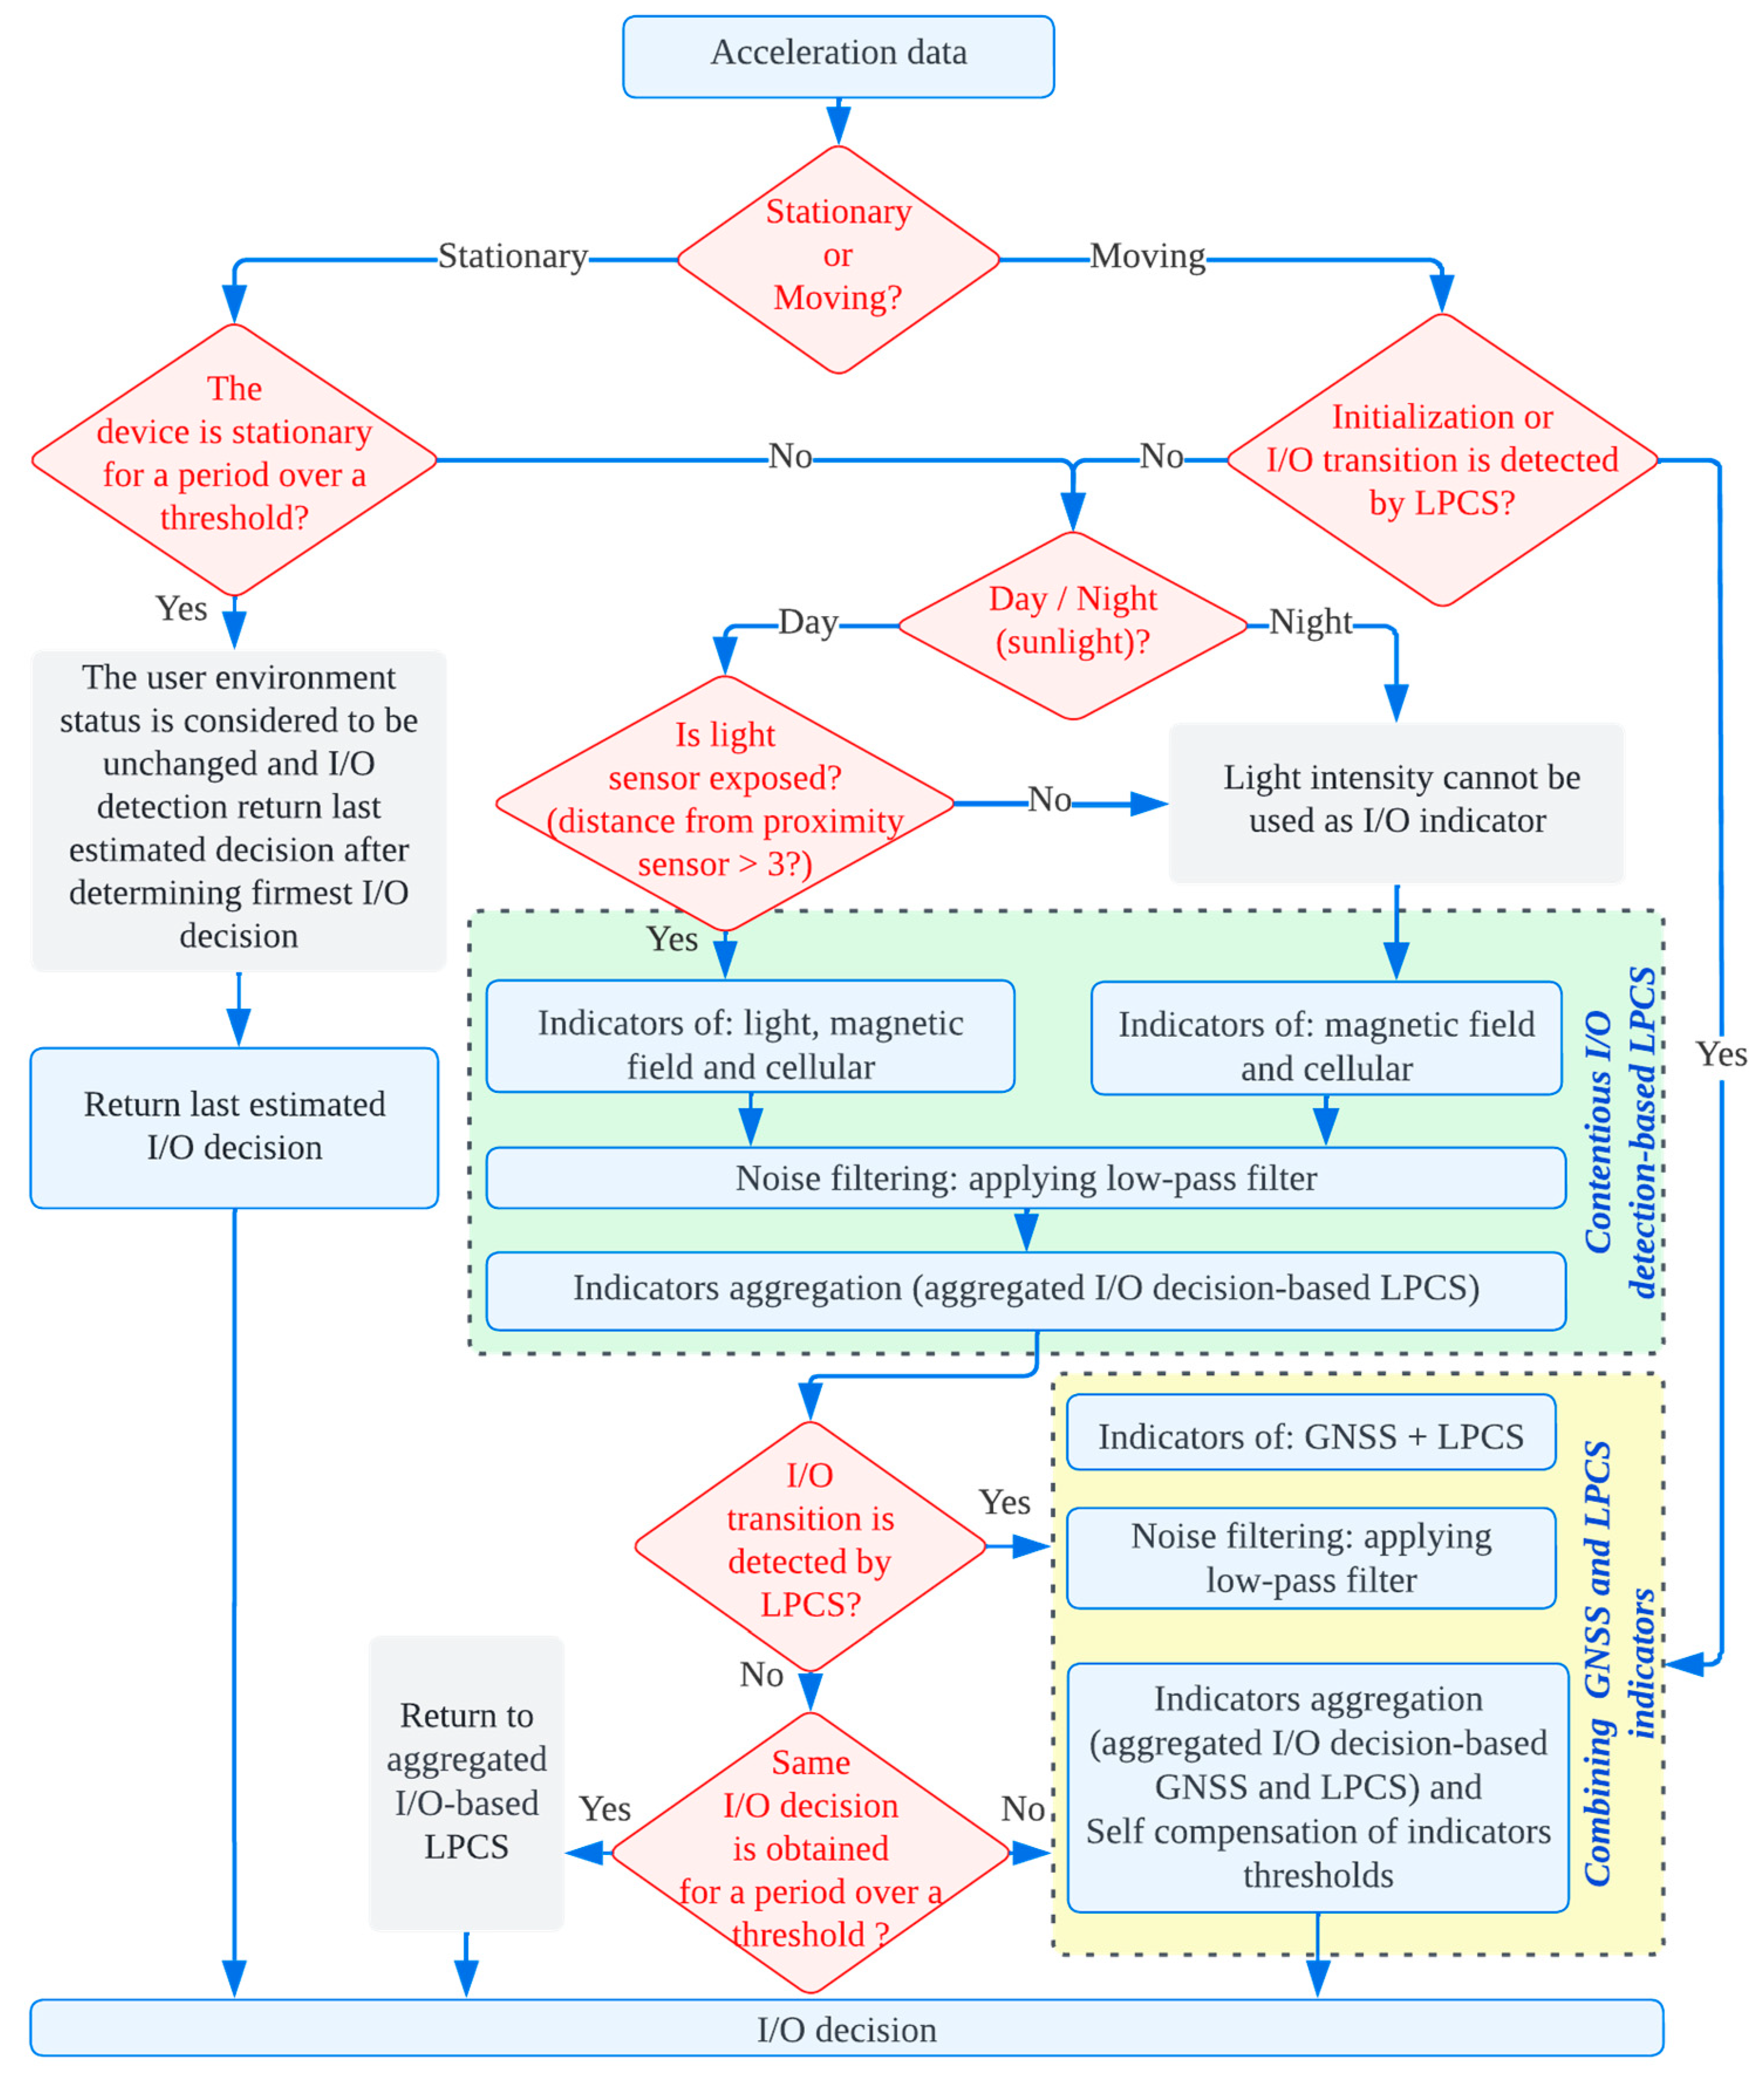
Figure 5 shows a flowchart of the proposed I/O detection algorithm. The algorithm procedure is as follows. Acceleration data was frequently observed to monitor stationary and moving intervals. After passing a certain period in the stationary mode, the status of the user environment is considered unchanged, and the I/O detection service returns the last estimated decision once the firmest I/O decision has been made. In the moving mode, first, the day and night were distinguished, and the proximity distance was determined to check the usability of the light intensity as an I/O indicator. The indicators of LPCS were then invoked for continuous I/O detection. To mitigate false extremes and obtain indicators with less noise, the raw measurements were filtered using a low-pass filter, and the filtered current measurement x ̀ t was estimated as follows:
x ̀ t = α x t + ( 1 α ) x ̀ t 1
where x t is the current measurement, x ̀ t 1 is the filtered value of the previous epoch, and α is a constant between 0 and 1 that represents the influence of the previous state on the current state. Subsequently, the confidence levels for the possible environments were estimated using the filtered measurements for each indicator. Algorithms 1 and 2 present the aggregated I/O decision based on LPCS and GNSS indicators, and LPCS only, respectively.
Algorithm 1: Aggregated I/O decision-based LPCS and GNSS indicators
Remotesensing 14 05263 i001
Remotesensing 14 05263 i002
Algorithm 2: Aggregated I/O decision-based LPCS indicators
Remotesensing 14 05263 i003

3.5. Position Estimation

3.5.1. Position Estimation Based on EKF

The I/O detection service was utilized to determine the appropriate localization technique by distinguishing the ambient environment and switching between localization techniques when the user shuttled from indoors to outdoors or vice versa. Based on the ambient environment, GNSS or WiFi were then requested and utilized to update the inertial positioning solution. PDR was preferred to establish the fusion model and update the user location, because step detection fit the low precision of low-cost accelerometers in smartphones [42]. Owing to the nonlinearity of the PDR model, the EKF, a nonlinear version of the Kalman filter with a simple and effective computational estimation process, was used [43] to fuse the PDR and GNSS or WiFi fingerprinting solutions. Based on the PDR method, the user position ( x k , y k ) was updated as soon as a new step k was triggered. The following formula expresses the position and heading updates based on the PDR method:
{ x k = x k 1 + ( 1 + s k )   s l k sin ( h k ) + σ x y k = y k 1 + ( 1 + s k )   s l k cos ( h k ) + σ y s k = s k 1 + σ s h k = h k 1 + Δ h k + σ h
where s l k and s t indicate the distance moved and distance correction, respectively. h k and Δ h k are the heading and heading changes, respectively. σ x , σ y , σ s , and σ h are the east, north, distance, and heading noises, respectively. Accordingly, we defined the state vector as x = [ δ x δ y δ s l δ h ] T , where δ is the error of each parameter. EKF theory is based on linearizing an estimate of the current mean and covariance. Thus, the transition model was linearized using a partial derivative. On this basis, the state equation can be described as x t = A t 1 | t x t 1 + B ω t , where A t 1 | t indicates the state transition matrix from epoch t 1 to t , B is the system noise matrix, and ω t is the system noise vector with the covariance matrix Q : ω t 1 N ( 0 , Q t 1 ) . By linearizing the transition model, the transition matrix was formulated as:
A t 1 | t = [ 1 0 s l k sin ( h k ) ( 1 + s )   s l k cos ( h k ) 0 1 s l k cos ( h k ) ( 1 s )   s l k sin ( h k ) 0 0 1 0 0 0 0 1 ]
The observation model can be represented as: z t = C t x t + υ t , where C t is the matrix used to estimate the predicted measurement z t from the predicted state x t , and υ t is the observation noise, which is assumed to have a zero mean with the covariance matrix R : υ t N ( 0 , R t ) . The localization results from the inertial sensors and wireless measurements were incorporated into the observation vector as z t = [ Δ x Δ y Δ s Δ h ] T , where Δ is the bias in each parameter. The transition C matrix is defined as d i a g ( c 1 ,   c 2 ,   c 3 , c 4 ) and the covariance R matrix is denoted as d i a g ( r 1 ,   r 2 ,   r 3 , r 4 ) . The parameters of the EKF were updated based on the ambient environment and the available measurements. The following subsections illustrate the estimation of the main components of the PDR method and localization estimation for both indoor and outdoor modes.

3.5.2. Inertial Positioning Based on PDR

Because the precision of smartphone accelerometers is low and results in cubical increases in positioning errors over time [44], our system prefers to use PDR over the inertial navigation system (INS) [29,45]. The PDR scheme consists of three main components: step detection, length estimation, and heading estimation. Regarding step detection, analyzing the acceleration patterns enables the detection of the events of walked steps. Before applying the detection algorithm, the raw acceleration data was filtered to clearly observe the walked steps with less noise or false detection results. The filtered linear acceleration value in the z-direction relative to the NCS was selected as the most sensitive axis that gave the firmest indication of the step signature, regardless of the activity or the device pose [46]. The step detection algorithm was then applied to count the triggered steps. We relied on the time-based peak and valley detection approach for the step detection task, which depends on gait cycle characteristics [47], to capture each step’s peak and valley acceleration. One of these characteristics of the human step is that it consists of two parts, i.e., rising and falling. Depending on pedestrian speed, a complete gait cycle should last for a specific duration [48]. Acceleration peaks and valleys were accordingly detected.
Regarding step length estimation, the nonlinear model introduced in [49] was utilized to dynamically estimate the length of each triggered step. This model assumes that the length is nonlinearly correlated with the total vertical acceleration change of each step as follows: s l i = β ( a i p e a k + | a i v a l l e y | ) 0.25 , where a k p e a k and a k v a l l e y are the peak and valley acceleration for step i , respectively. β is the pedestrian’s profile parameter. Herein, β was initialized to 0.55, and a calibrated parameter was obtained when the user walked in a straight line between two points with high confidence in their location estimation.
For step heading estimation, the relative heading of the gyroscope provides a weak long-term solution, and the absolute compass heading has a high short-term variation (i.e., it reaches 50° indoors) owing to magnetic interference [50]. Because the two sources have complementary error characteristics, a weighted fusion algorithm [46] was used to take advantage of them. The contribution of each source is constrained by two factors: (1) the correlation between the heading of the two sources and (2) the availability of quasi-static periods of magnetic field observations qualified to update the accumulated gyroscopic heading. Quasi-static periods are usually considered as a high confidence interval for determining reliable absolute heading with less disturbance. In the fusion algorithm, among the compass, gyroscope integral, and previous step headings, the best candidates were selected to contribute part of their weights (see [46] for more details).

3.5.3. Position Estimation in Indoor Environments

Per the decision of the proposed I/O detection service, when the ambient environment was distinguished as an indoor area, the application queried about the availability of a trained database for the occupied area and activated the collection mode of crowdsourced data. The end-user data were collected based on the procedures expressed in the next subsection. After collecting the required data, a Python code was developed to autonomously analyze and generate the radio map in the offline engine. Refer to [51] for more details about the procedures and results of the database generation method. With the availability of the database of the equipped location, the end-user application, that had permission to access the database, could query and retrieve the RPs data instantly from Cloud Firestore.
(a)
Merits of Crowdsourced Data Collection with the Proposed I/O detection Model
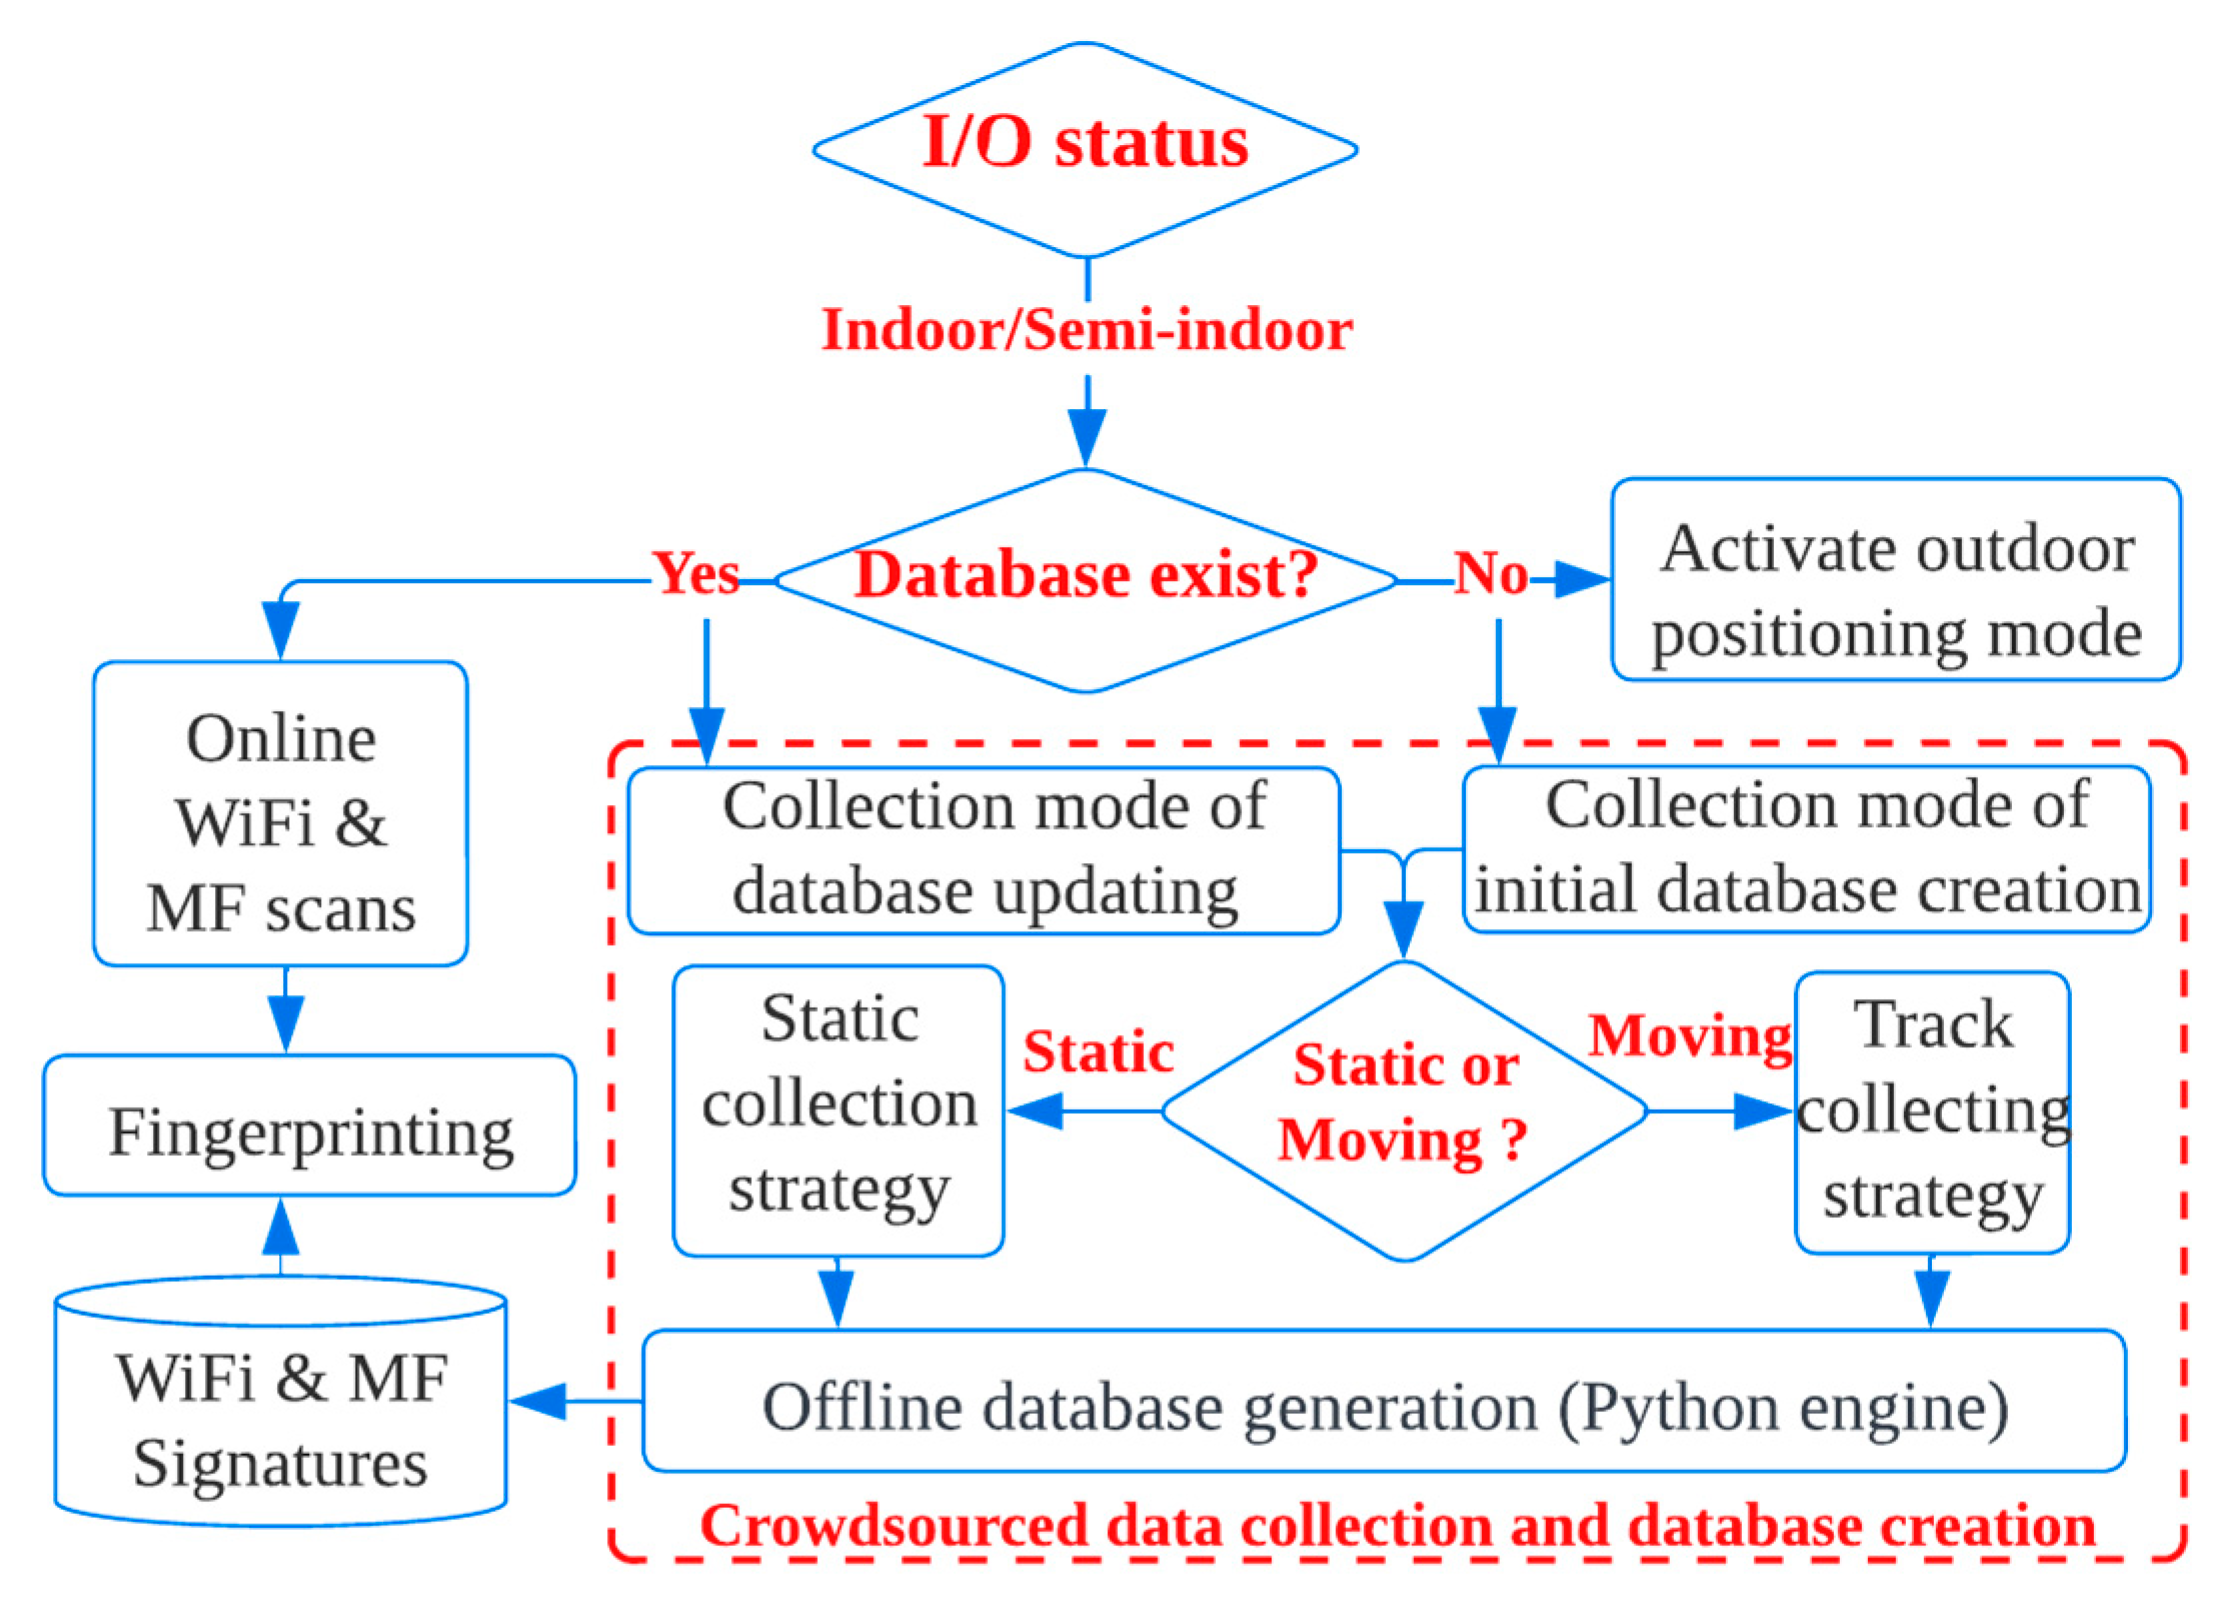
As mentioned earlier, collecting crowdsourced data and deriving reliable locations of the collected pervasive signatures can enable the autonomous generation of offline databases needed for fingerprinting-based localization, which helps develop self-deployable systems. The collection of crowdsourced data should be made user-friendly to boost the widespread adoption of IPS-based crowdsourcing. This could promote universal indoor positioning solutions. Figure 6 summarizes the procedures followed to manage data collection and convert the collection of crowdsourced data into a user-friendly process with the help of the proposed I/O detection service. The following factors manage the collection of crowdsourced data.
1-
I/O environmental awareness: Outdoors, the availability of GNSS eliminates the need to collect crowdsourced signatures. In contrast, in indoor areas or when transitioning from indoors to outdoors, owing to the absence of accurate GNSS localization, crowdsourced signatures must be collected to train fingerprint databases; consequently, once the proposed I/O detection service detects indoor or semi-indoor areas, the system activates the collection mode. Distinguishing the type of ambient environment accurately with low power consumption helped curb the collection of crowdsourced data in the required areas. This also helped reduce battery drain by preventing excess outdoor data collection. Notably, data collection was not immediately prevented after transiting from indoors to outdoors. Conversely, the system continued to collect data for a certain period. This period is permitted to detect GNSS observations with high accuracy (e.g., >5.0 m) and a low horizontal dilution of precision (HDOP) (e.g., <20) to act as an anchor node. With capturing anchor nodes, the localization of the collected traces was accordingly adjusted. Figure 7 depicts the impact of I/O discrimination on the overall collected traces after their adjustment, where it can be seen that: (1) the collected traces were densified in the indoor and semi-indoor areas; and (2) although serval traces were walked outdoors (in the garden), I/O discrimination confined data collection in the required areas.
In addition to leveraging I/O awareness, two other factors were considered in the crowdsourced data collection process.
2-
Initial database generation or updating: In indoor environments, furniture layouts, WiFi APs settings, and network updates are likely to undergo frequent changes. Thus, although data for a specific area is collected and the database is already created, data collection should not be discontinued. Conversely, according to the related literature [52,53,54,55], data collection and database updating are frequently required to keep the pace with the frequent changes in indoor environments. Knowing that the equipped area lacks a database (i.e., requires initial generation) or that the database is already created (i.e., requires database updating) is beneficial for the data collection process for the following reason: if a specific area lacks localized signatures, the system collects crowdsourced data with a sampling rate higher than that used for updating to accelerate the initial generation and condense the collected signatures by each RP. Conversely, as long as the database of a certain area has already been trained, collecting excessive data is not required. Instead, only a small amount of data is required to assess any changes in the environment and update the database. Consequently, the subsequent collection was conducted at a lower sampling rate.
3-
User motion mode: Identifying static and dynamic modes can help manage data collection and reduce excess collection in a static state, either for the initial creation or updating. The distinction between stationary and walking modes is usually performed using acceleration data and step detection results. From the perspective of power consumption, an accelerometer is an LPCS. Thus, the sensor used to observe these modes is not a power drainer. The decision based on the walking mode significantly helps to reduce the power consumption arising from excess collection. In static intervals, where a user occupies a fixed geographic position, the continuous collection of signatures for a fixed location does not extend the spatial database coverage; instead, it only measures the signature variation. Therefore, there was no need to collect much data and thus, a low collection rate was considered (i.e., a signature was recorded every 3 min). In contrast, continuous collection in the dynamic mode covers different locations and extends the spatial database coverage. Consequently, crowdsourced data were collected in the walking mode with a sampling rate higher than that of the static mode. In the dynamic mode, the raw inertial sensor data were recorded with a sampling frequency for the accelerometers and magnetometer equal to 50 Hz. A higher sampling frequency equal to 100 Hz was used for the gyroscope to allow for the accurate estimation of angular changes. The WiFi scan interval was 2 to 4 s.
(b)
Online Fingerprinting
With the availability of a trained radio map for the equipped area, online position-based fingerprinting was estimated as soon as a WiFi scan was triggered. Notably, in the offline engine of the proposed scheme, we divided the generated radio map to sub-clusters based on the locations of the maximum RSS values of the radio map APs, as proposed in [56]. As a result, the generated radio map comprised sub-clusters of RPs. In the online fingerprinting stage, the online signatures were compared with the RPs of one sub-cluster instead of the RPs of the whole database. To find out the nearest sub-cluster, a regional match was performed by comparing the online RSS values with RSS values assigned to the center of each sub-cluster. To estimate the fingerprinting position, the KWNN algorithm was applied on the RPs of the sub-cluster with the highest match.
The minimum summation of the Euclidean distance between the online measurements and the offline RPs data was estimated to select the best K-neighboring RPs, based on the following expression:
δ r s s = j = 1 n ( p j R P p j o n l i n e ) 2
where p j R P and p j o n l i n e are the offline and online signatures for AP j , respectively. δ r s s is the RSS difference between the offline and online RSS. n is the number of APs scanned by RP. The online position can then be estimated as:
x i , f p s t = ( x f p s , y f p s ) = ( i = 1 K ( x i R P · w i ) , i = 1 K ( y i R P · w i ) )
where ( x i R P , y i R P ) is the position of a selected RP  i { 1 , , K } , and K is the number of best neighboring RPs selected to estimate the fingerprinting position. Weight w i is computed as follows:
w i = 1 ( δ i ) 2 i = 1 K ( 1 δ i ) 2
where δ is the difference between offline and online signatures. An indication of the expected error in the fingerprinting estimate can be obtained from the distance among the best K-RPs. Obtaining adjacent set of K-neighboring RPs (i.e., with a short distance from the best estimate) should reflect a high overlap between the RPs that cover the range of online RSS variation. High overlapping is expected to lead to accurate positioning estimation [57]. Therefore, from the best K-neighboring RPs returned from the fingerprinting algorithm, the expected error can be deduced by calculating the average weighted distance between the best K fingerprints, as follows:
σ f p s 2 = i = 1 K ( w i · ( x f p s x i R P ) 2 + ( y f p s x i R P ) 2 2 ) i = 1 K ( w i )
Subsequently, the EKF was updated as follows. Parameters c 1 and c 2 were set to 1. Δ x and Δ y were estimated as Δ x = x f p s x P D R and Δ y = y f p s y P D R and z t was updated. The covariance matrix was also updated to:   r 1 = r 2 = σ f p s 2 .

3.5.4. Position Estimation in Outdoor Environments

Since 2016, it has been possible to obtain raw GNSS observations from smartphones. Smartphones can enhance their positioning performance in outdoor areas by leveraging this technology, thereby ditching the black box positioning concept [58]. A variety of positioning methods has been explored in recent years to enhance smartphone positioning, including dual- and single-frequency precise point positioning (PPP) and real-time kinematic (RTK) [59]. In this study, we did not focus on how GNSS precision can be improved. When the I/O service distinguished the ambient environment outdoors, GNSS localization information was requested and utilized to update the inertial positioning solution. Once the GNSS positioning solution was updated, the z t parameters were updated as: Δ x = x G N S S x P D R and Δ y = y G N S S y P D R . Parameters c 1 and c 2 were set to 1. The covariance matrix was also updated as r 1 = r 2 = σ G N S S 2 . σ G N S S was estimated based on the precision and the horizontal dilution of precision reported by the smartphone.
When a user walks in a straight line between two locations with high accuracy, such as A and B, the step length is calibrated as:
s l c a l i b = l ^ A B N = ( d x A B ) 2 + ( d y A B ) 2 N
where l ^ A B is the actual distance between A and B; d x A B and d y A B are the easting and northing distances between A and B, respectively; and N is the number of steps triggered between A and B. In the fusion model, the length parameters were updated to: Δ s = s l c a l i b s l i m p , c 3 = 1 ,   a n d   r 3 = 0.005 , where s l i m p   is the empirical step length. Similarly, the step heading was calibrated after walking in a straight line between these two points by computing the error in the estimated heading as follows:
h δ = arctan ( y A r y B m x A r x B m ) arctan ( y A r y B r x A r x B r )
where the superscripts m and r refer to the measured and reference locations of A and B, respectively. In the EKF model, the heading parameters were updated as Δ h = h δ ,   c 4 = 1 ,   a n d   r 4 = 0.001 . Finally, the integrated user position is estimated as follows:
x t = x t 1 + δ x + ( 1 + s + δ s )   s l k sin ( h k + δ h ) y t = y t 1 + δ y + ( 1 + s + δ s )   s l k cos ( h k + δ h )

4. Experiments, Results, and Evaluations

4.1. Test Area

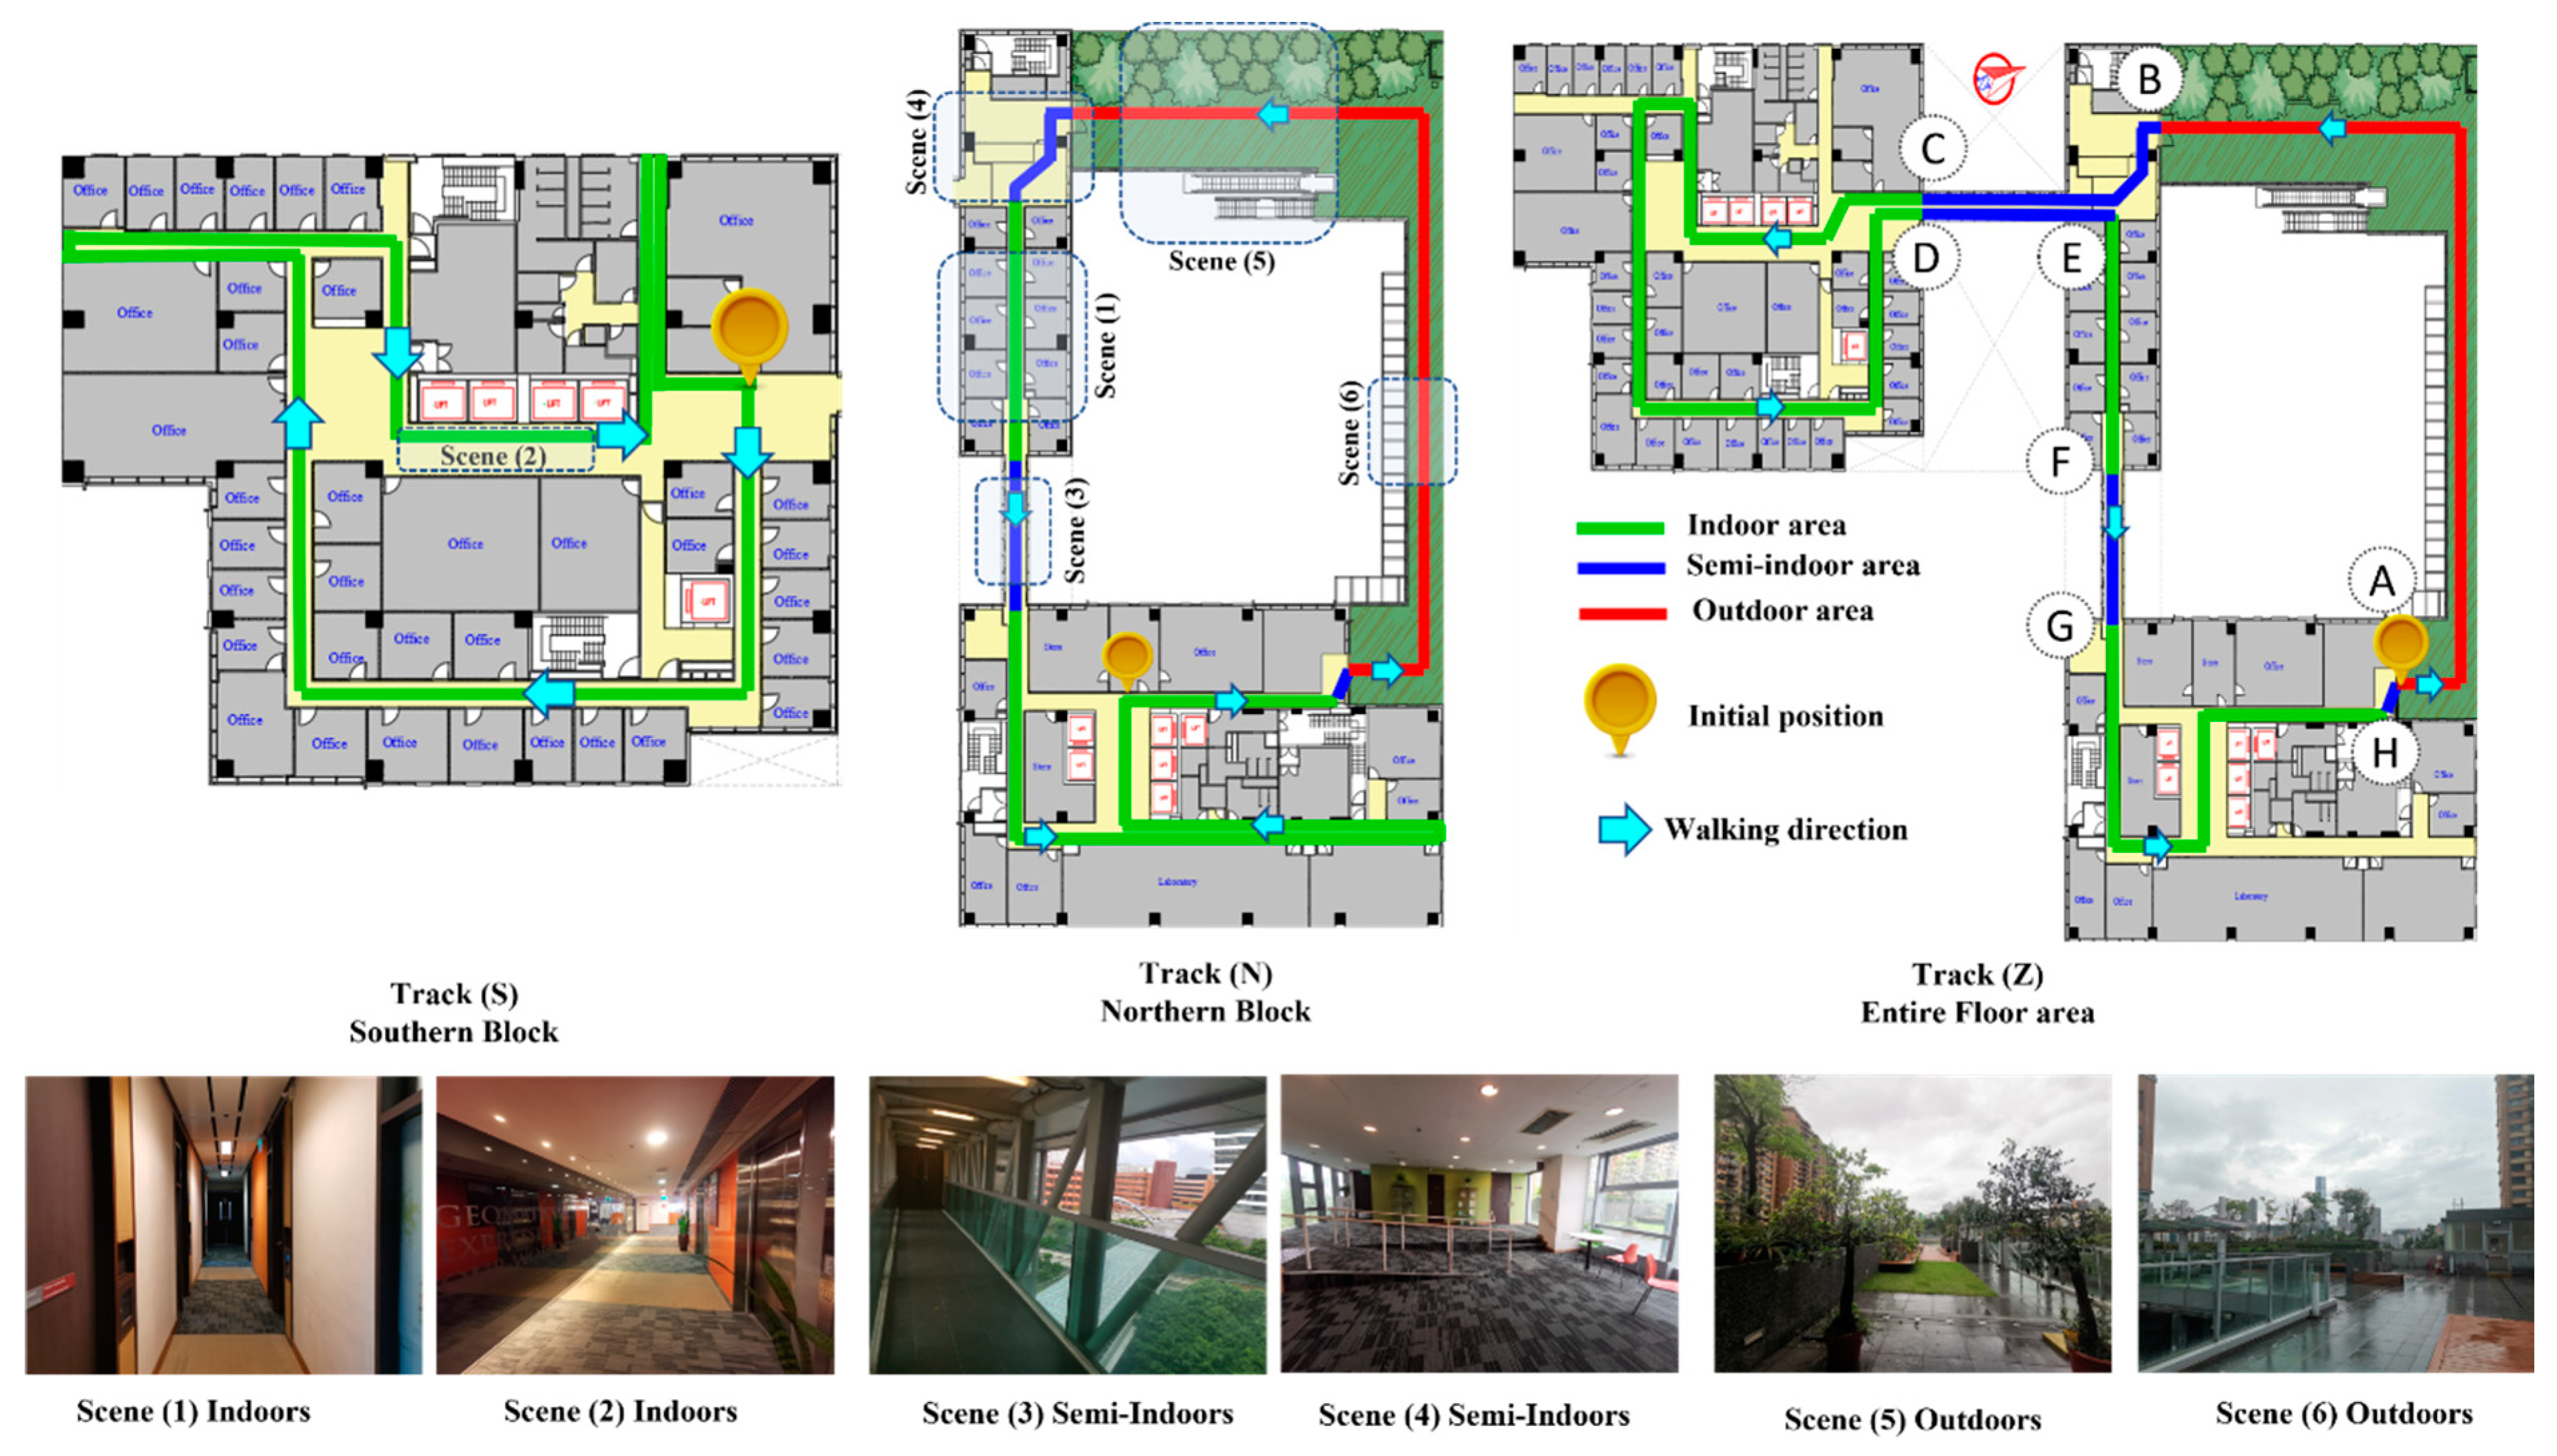
This section describes the experimental area and setup. The tests were conducted using the prototypical Android application described in Section 3.1. Different smartphones, including the Huawei Mate 20 Pro, Samsung Note 8, Huawei P20, and Samsung G7, were utilized to test the proposed system in various scenarios. A large campus floor was used as the test site. This floor, depicted in Figure 8, is located on Floor 6 of Block Z, Hong Kong Polytechnic University, with an area of approximately 7200 m2. The test field comprised two building blocks connected by two bridges and an outdoor garden, which provided a good environment for testing seamless positioning and I/O detection performance. The tests were conducted day and night, on cloudy and sunny days. The smartphones were carried in a horizontal handheld pose while evaluating the online positioning performance. Figure 8 shows different scenes of indoor environments represented by the northern block (scene 1) and southern block (scene 2), semi-indoor environments represented by bridges (scene 3) and indoor-outdoor transitions (scene 4), and outdoor environments represented by garden areas (scenes 5 and 6). Tracks (S), (N), and (Z) are samples of the walked tracks to evaluate the proposed scheme.

4.2. Evaluation of I/O Detection

We designed I/O detection tests to ensure that the performance of the proposed detection approach satisfied the four conditions required for seamless navigation: high detection accuracy, fast switching, energy efficiency, and pervasive applicability. In terms of universal applicability, the utilized detection indicators were extracted from off-the-shelf sensors and pervasive observations, which guaranteed the wide applicability of the proposed detection approach. The detection performance was also evaluated using various smartphone models to ensure the independence of the proposed system on the platform. In the following sections, we evaluate the detection accuracy, latency, and energy consumption.

4.2.1. Detection Accuracy

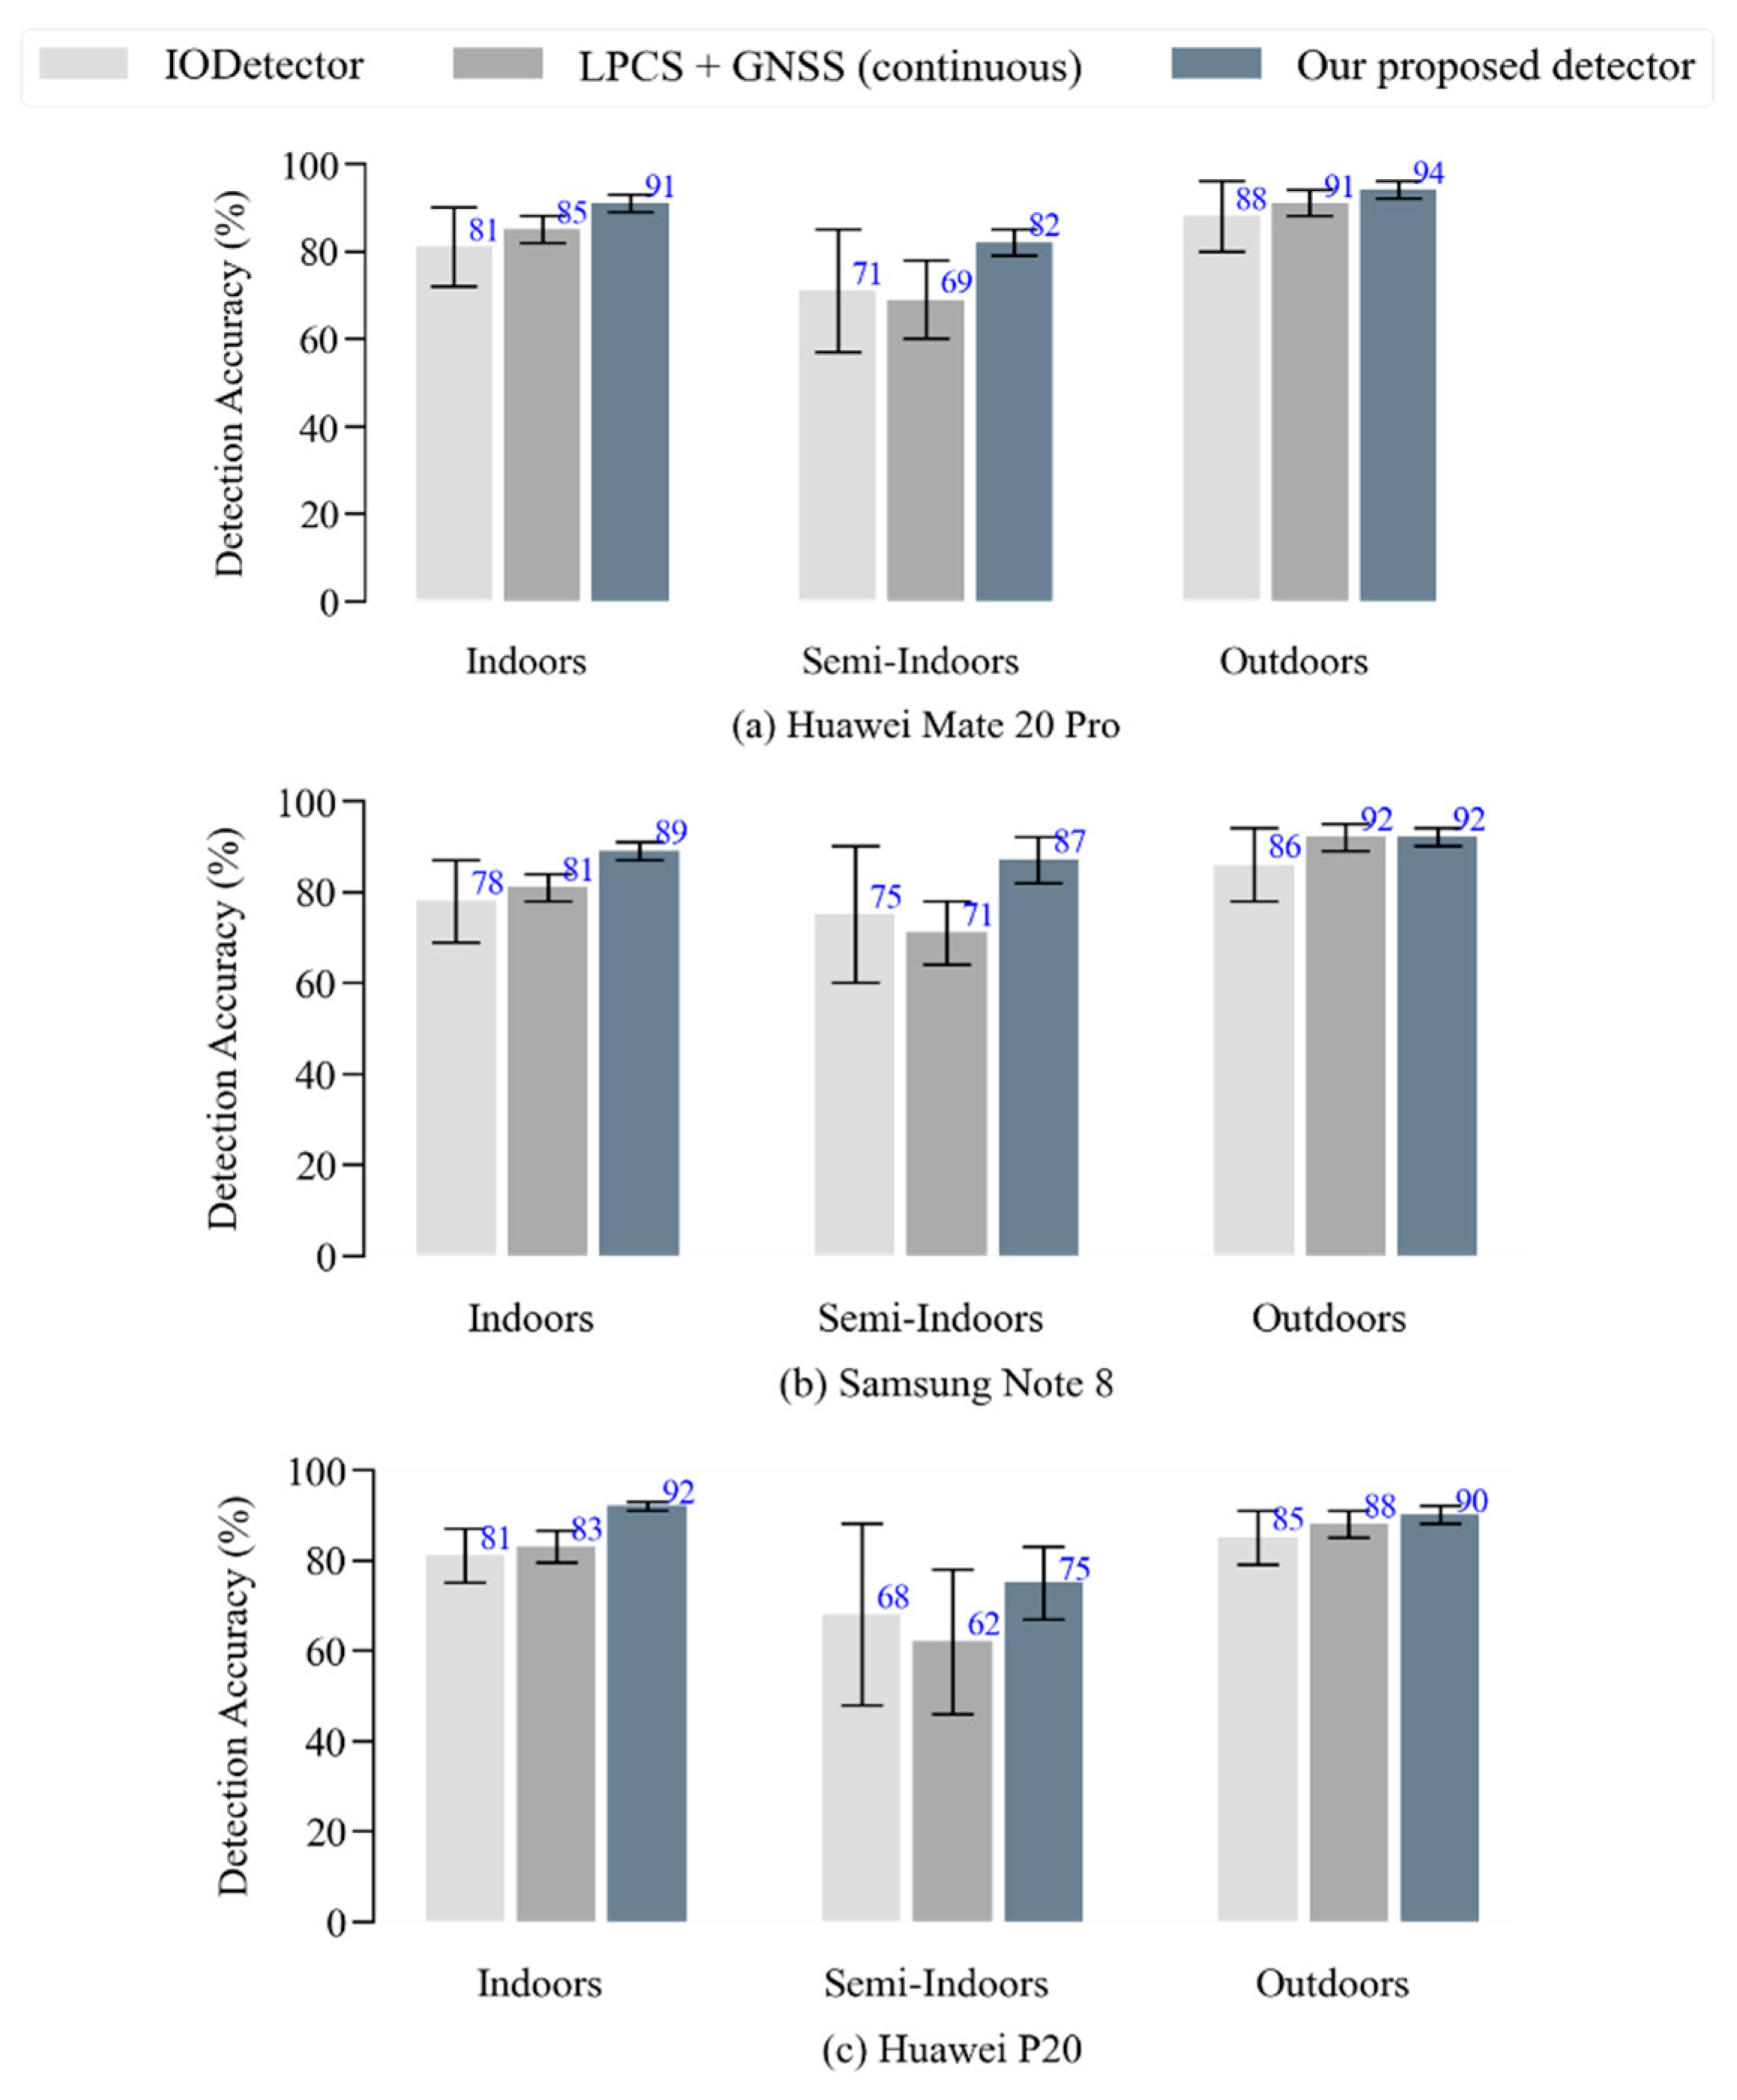
We evaluated the detection accuracy of our I/O detection approach through several tests conducted in indoor, semi-indoor, and outdoor areas, using three devices (Huawei Mate 20 Pro, Samsung Note 8, and Huawei P20). Additionally, the detection accuracies of the IODetector approach [26] were estimated under the same conditions. The IODetector approach utilizes indicators inferred from sensors with low power consumption, such as light, MF, and cellular. Moreover, the results of another detection approach named “LPCS+GNSS (continuous)” were determined by continuously combining the GNSS with indicators inferred from sensors with low power consumption as proposed in existing studies such as [13,14,15]. The detection results of the proposed approach were compared with those of the two aforementioned approaches. Figure 9 shows the average detection results of each device in each environment, and the variations in the results of the tests are indicated by error bars. Together with the smartphone utilized to conduct the I/O detection test, another smartphone was used to capture the time and ground truth of the environment type. The environment type estimated by the detection approach was then compared with the ground truth to determine the detection accuracy.
Indoors, the average detection accuracy of the proposed approach reached approximately 90% compared with 81% and 83% for the IODetector and (LPCS+GNSS (continuous)), respectively. Outdoors, the average detection accuracy of the proposed approach was 92% compared with 86% and 90% for the IODetector and (LPCS+GNSS (continuous)), respectively. The detection accuracy for the semi-indoor areas was much lower than that for the indoor and outdoor areas, with an average accuracy of 81%, compared with 71% and 67% for the IODetector and (LPCS+GNSS (continuous)), respectively. Furthermore, in almost all scenarios, the variations in the detection results of the proposed approach were less than those for the IODetector and (IODetector and GNSS). The experimental results indicate that the proposed detection approach accurately distinguished the I/O environments in most cases and outperformed other approaches.

4.2.2. Detection Latency

In the walking mode, continuous I/O detection with a low latency is required to avoid utilizing outdated detection results, thereby quickly selecting proper positioning techniques. Track (Z), as shown in Figure 8, is a convenient test field to evaluate the latency of the detection response when transitioning from indoors to outdoors because it comprises several transitions from outdoors to indoors. In this experiment, a user started walking from an outdoor area at point A to several indoor and semi-indoor areas, and then returned to the same starting point, as depicted in Figure 8. The duration of each environment was recorded using a stopwatch that served as the ground truth. Figure 10 presents the detection results for the three approaches: the proposed detection approach, the IODetector, and LPCS+GNSS (continuous).
For certain durations in semi-indoor areas, the detection results of the IODetector varied and provided errors in detection or of an unknown status, despite no change in the ambient environment. The detection errors were reduced using the LPCS+GNSS (continuous) approach, where GNSS indicators were combined with the indicators of low-power-consuming sensors. The errors associated with our detection approach were less than those observed by the other two approaches.
In terms of detection latency, in the transition intervals from indoors to outdoors or vice versa, the proposed detection approach, like the IODetector, experienced fast switching with a low latency of ~3 s compared with 5–8 s for LPCS+GNSS (continuous). The proposed detection approach, on average, requires 2 to 3 s to realize that a transition occurred from outdoors to indoors or vice versa (i.e., convergence time). The continuous combination of GNSS indicators with light indicators may explain the delay in the detection response of (LPCS+GNSS (continuous)). To conclude, using GNSS indicators during transition intervals is advantageous instead of relying on them continuously. In this manner, the light indicator detects the environment change quickly, and GNSS are then used to inspect and confirm the reported transition. Consequently, the possible delay in the response owing to continuously incorporating GNSS was alleviated, and detection reliability was achieved.

4.2.3. Power Consumption

The battery percentage change over time was used to experimentally evaluate the power consumption of our detection performance. All non-involved factors, such as screen brightness, CPU performance, and networking activity, were kept constant to test battery drain. Moreover, all auto-update features and data synching were disabled. Power consumption was calculated by charging the smartphone to 100% of its battery life and then recording the time spent to decrease it by 1%. Each test involved draining the battery from 100% to 90%. The experiments were conducted in three different scenarios: indoors, outdoors, and with several transitions from indoors to outdoors.
The results of the experiments are presented in Table 2. The “GNSS” test shows that the battery was drained when only GNSS indicators were used for detection. It can be observed that detection services based on GNSS or LPCS+GNSS (continuous) drain the battery power faster than the IODetector and the proposed detection service. Incorporating GNSS indicators into our approach in the transition intervals increased the power consumption by a lower margin compared with the power consumed by the IODetector. With this low margin of power consumption, the proposed approach maintained its detection reliability and addressed the low detection accuracy of lightweight I/O detection services, such as the IODetector.

4.3. Comparison with Existing I/O Detection Studies

In this section, we compare our I/O detection results with those of our counterparts. Table 3 summarizes the performance comparison between these methods and our detection approach. The IODetector [26] leveraged low-power-consuming sensors to develop a lightweight approach that achieved an overall accuracy of approximately 86% in indoor and outdoor areas. This accuracy was reduced to 71% in the transition intervals (semi-indoor areas). A similar approach was developed in [27], which relied on a semi-supervised method that improved the accuracy in trained environments to 88%. In [16], WiFi–RSS measurements were combined with light and cellular indicators to improve the localization accuracy in rural and urban areas. However, utilizing WiFi for continuous I/O detection consumes more energy than lightweight approaches and the overall accuracy is not significantly enhanced. Moreover, the SenseIO [16] can only classify indoor and outdoor areas similar to [13] and [15]. In [13,15], GNSS indicators were continuously utilized together with other sensor indicators. This combination was designed to distinguish between indoor and outdoor environments, and did not consider detecting challenged areas (semi-indoor areas). Compared with our counterparts, our detection approach incorporated GNSS indicators in the transition intervals, which increased the power consumption by a lower margin than lightweight detection services such as the IODetector [26]. With this low margin of power consumption, the proposed approach improved the detection reliability in semi-indoor areas with a detection accuracy of 82% compared with 71% for the IODetector. In addition, the detection of indoor and outdoor areas reached approximately 92%. In this manner, we addressed the low detection accuracy and reliability of existing lightweight I/O detection services while reducing power consumption.

4.4. Seamless Positioning Performance

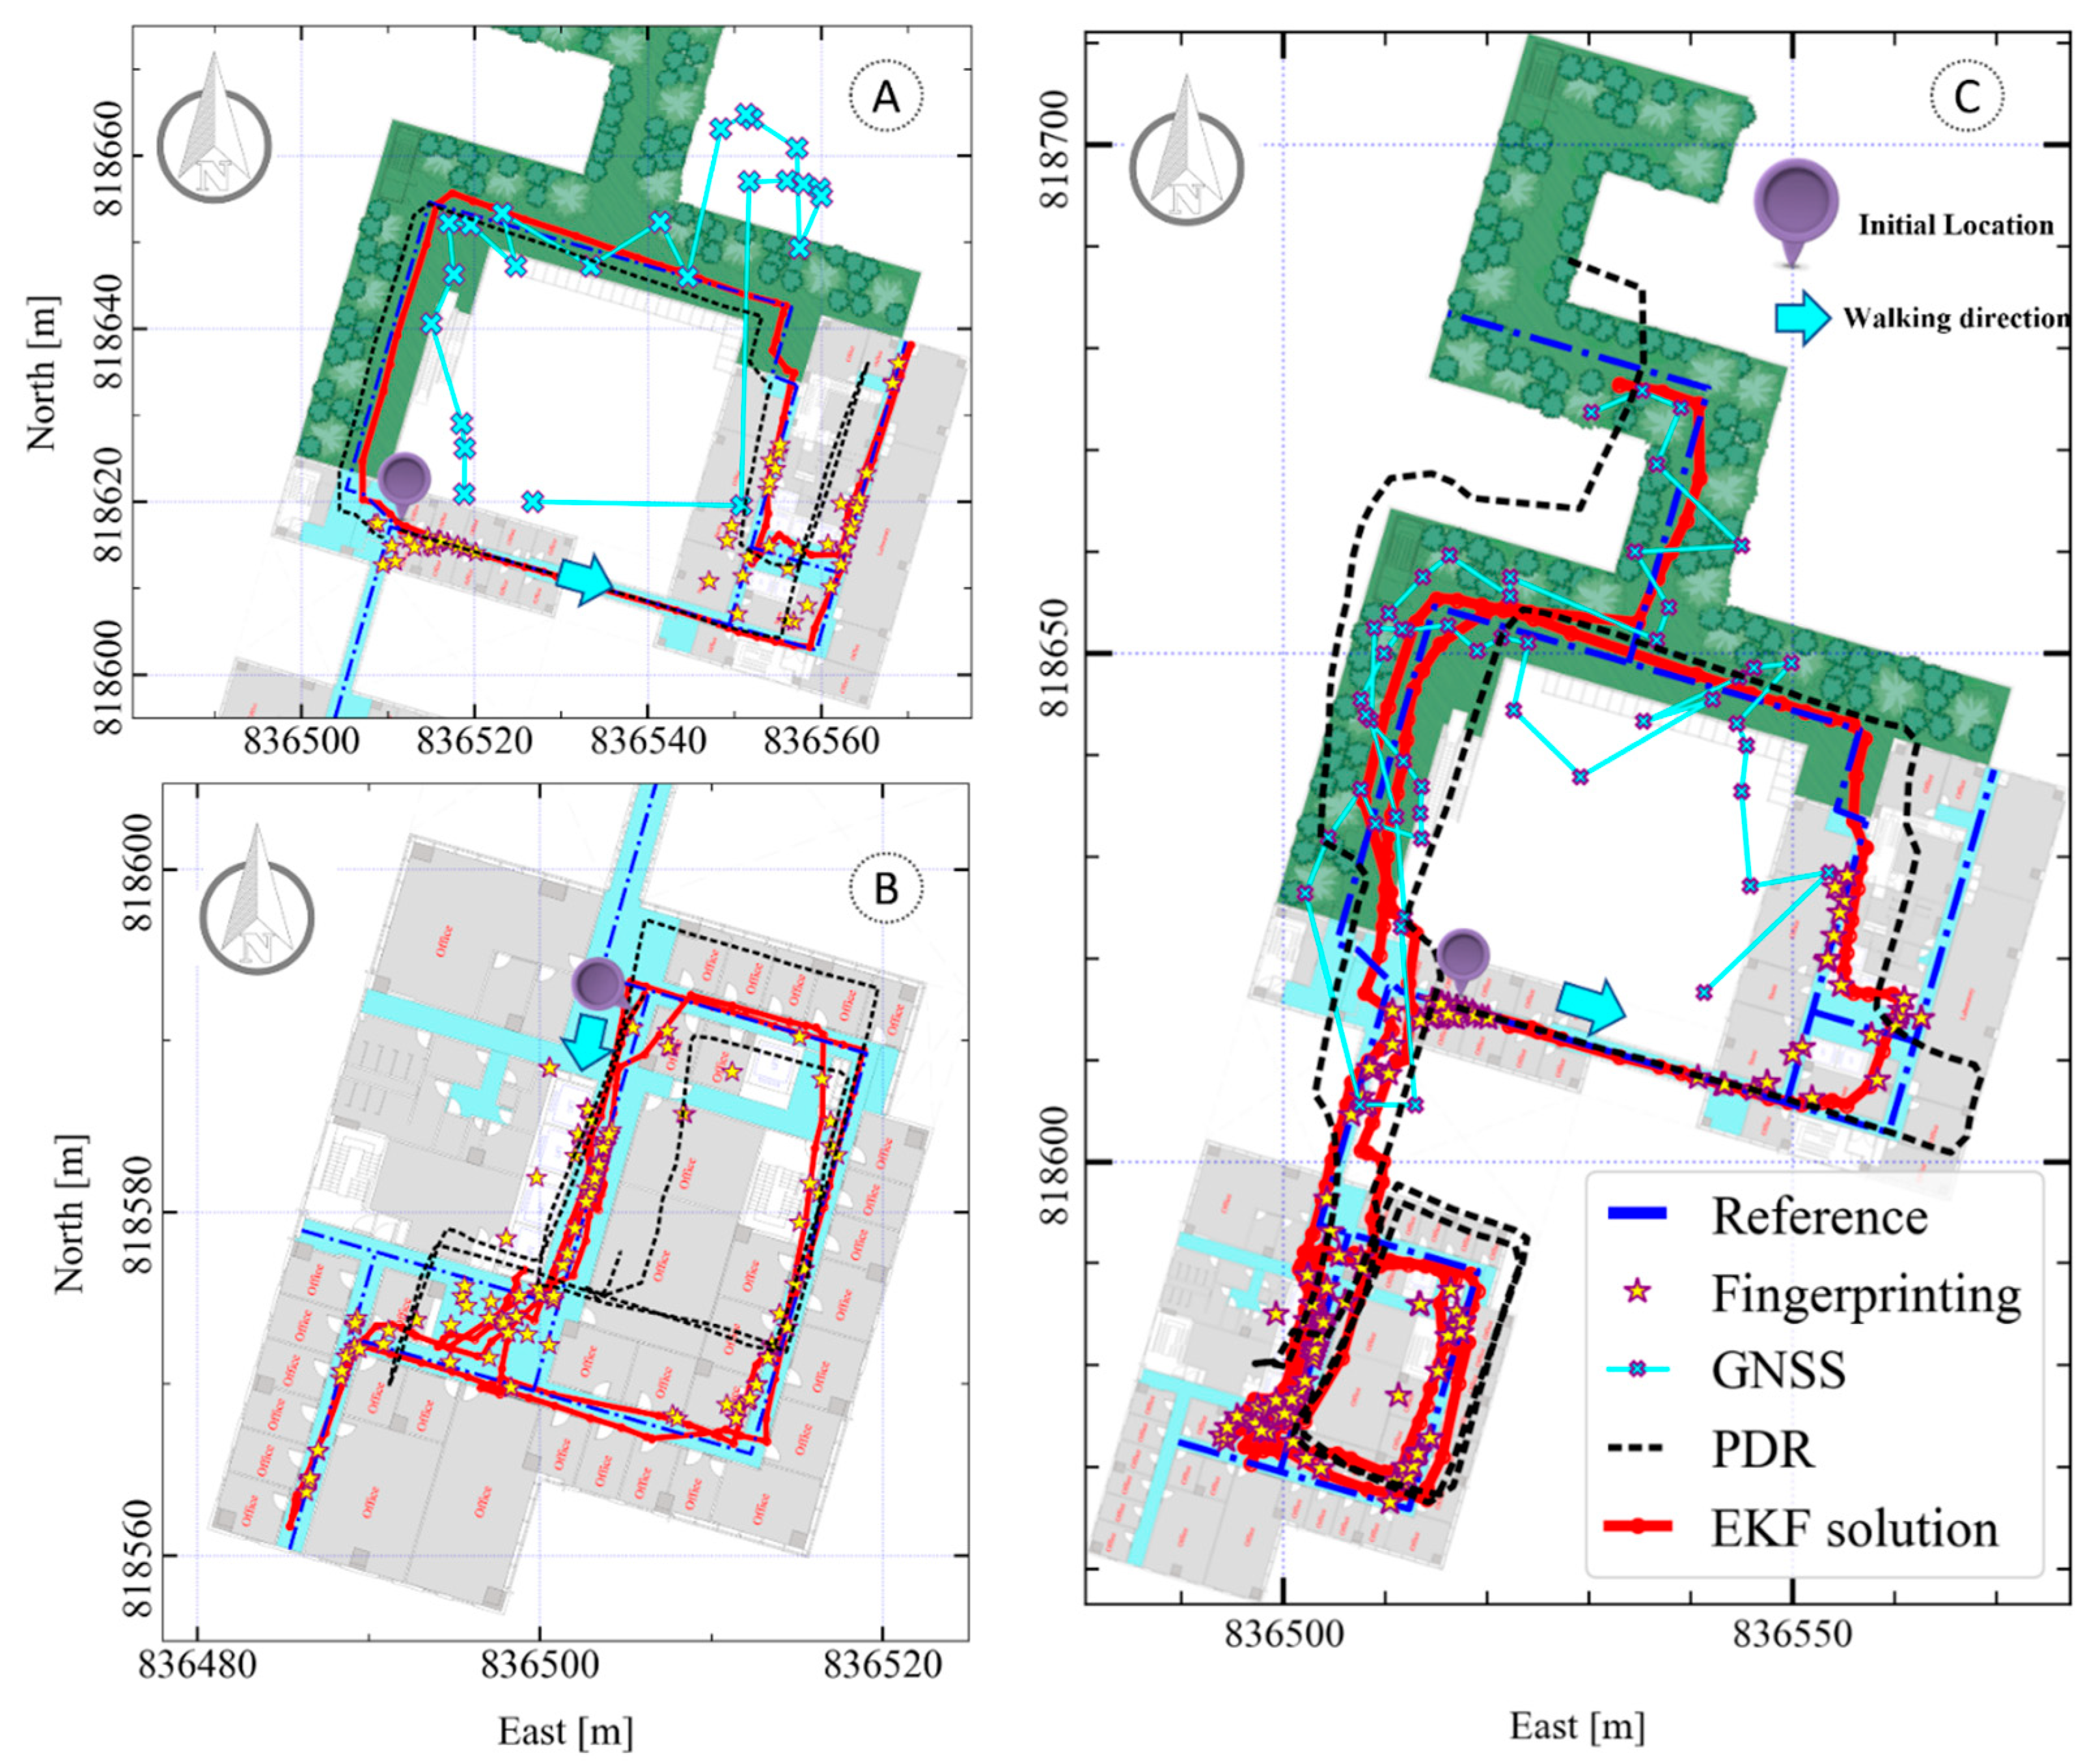
Figure 11 shows the positioning performance of tracks A, B, and C. Track A was walked in the northern block and the attached garden, while track B covered most of the southern block. More than 1000 steps were walked on track C. This long track started from the north block toward the garden, then to the south block where two loops were walked, and finally to the garden. Ground truth points were created for evaluating the positioning performance of the proposed system using the following setups. A Trimble R10 GNSS Receiver was used to determine the absolute location of benchmarks in the garden. In order to obtain other benchmark points on the floor, garden benchmarks were equipped with Leica total stations. We used the floor benchmarks to georeference a digital floor plan (in AutoCAD). We leveraged the proposed method in [60] to create check points in online positioning tests by marking distinct features on the user interface screen. Based on these features, the online location was referenced. The enrichment of the floor plan with many distinct landmarks such as gates, corners, elevators, stairs, and office doors encourages utilizing the chosen method. Additionally, cost effectiveness is among the key benefits of using the chosen method. The georeferenced map allowed us to label and estimate the absolute positions of floor landmarks (i.e., distributed at approximately 6.0 m-distances). Then, an interactive Google Maps-based marker labeling option was developed to facilitate recording the check points in online positioning experiments.
In all tracks, the proposed I/O detection service successfully detected the ambient environment at its initial location. When the detected environment was indoors, the initial GNSS location and WiFi BSSID were firstly obtained. The initial GNSS location was used to invoke the map of the equipped area. The WiFi BSSID were used to check the availability of an offline fingerprinting database of the occupied area. Notably, the database of the floor area was generated autonomously from collected crowdsourced data. Refer to [51] for more details about the procedures and results of the database generation method. More than 1350 RPs were generated from crowdsourced data. The WiFi fingerprinting solution was estimated with the availability of the floor database, and the initial location was updated. In addition, the I/O detection services altered the localization techniques when transitioning from indoors to outdoors or vice versa, and utilized the appropriate technique for the corresponding environment.
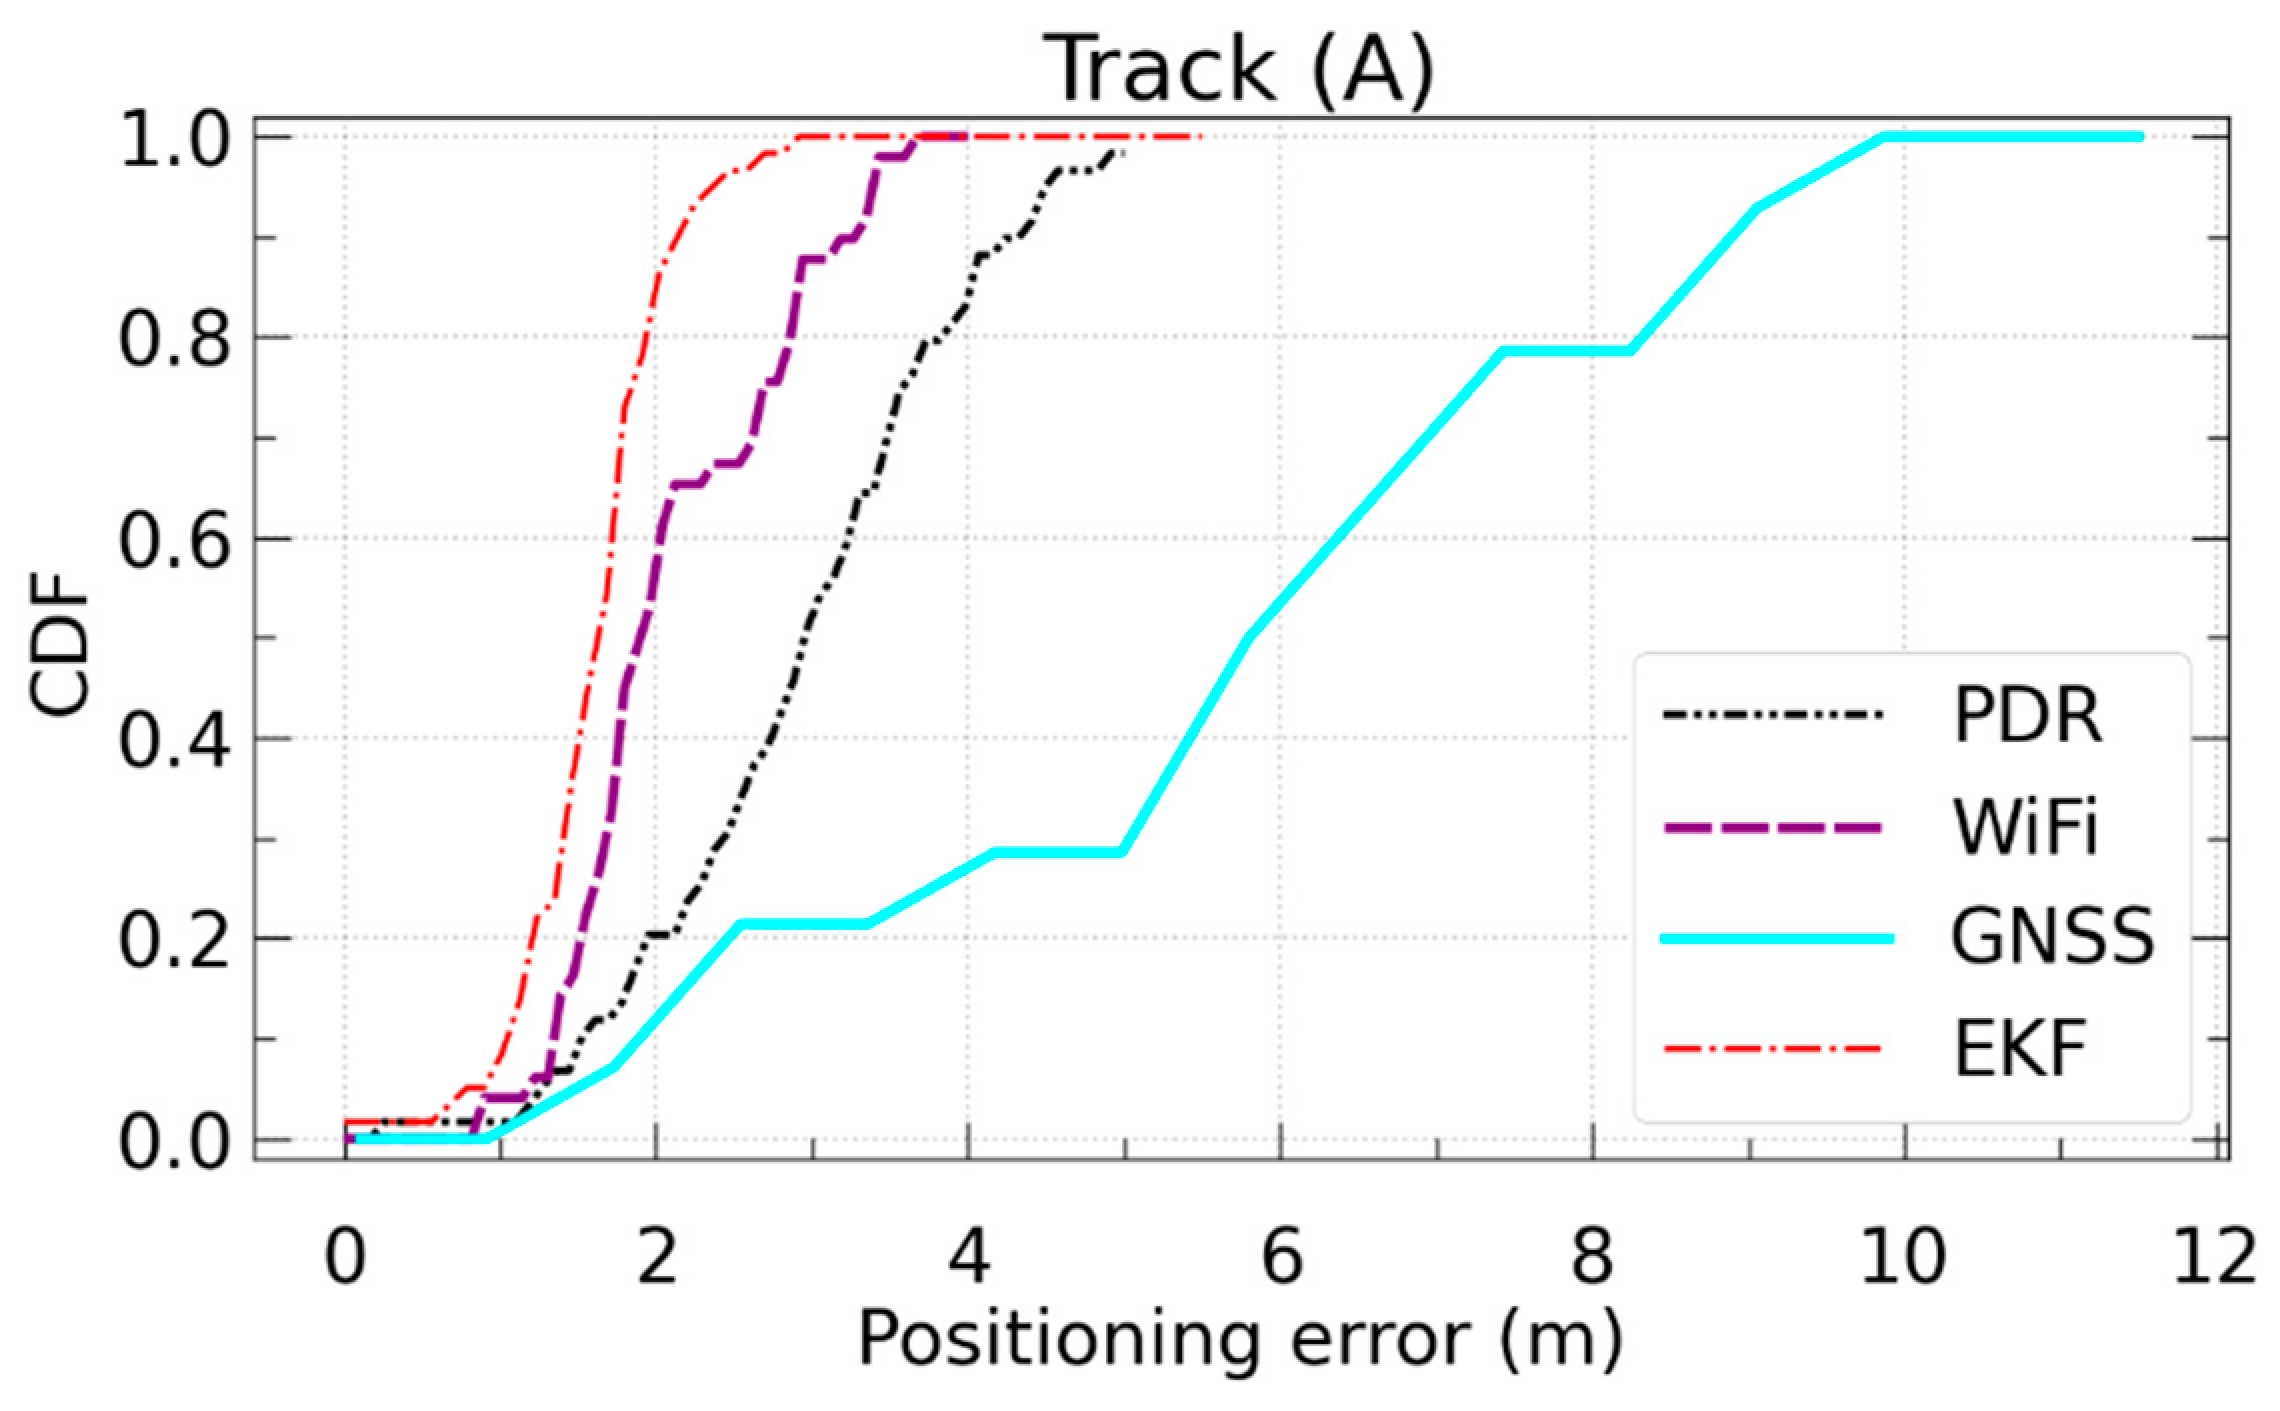
Figure 12 shows the cumulative distribution function (CDF) of the positioning error for the PDR, WiFi fingerprinting, GNSS, and EKF solutions for tracks A, B, and C. Table 4 lists the mean positioning accuracy and 90% of the localization error for the PDR, fingerprinting, GNSS, and EKF solutions for tracks A, B, and C. The fingerprinting solution achieved approximately 2.3 m over the three tracks with a 90% error of less than 4.0 m, while the mean and 90% errors of the PDR solution reached approximately 3.6 m and 5.1 m, respectively. The integrated solution based on EKF achieved a mean error of 2.1 m with 90% errors less than 2.9 m. Notably, the high number of WiFi APs within the test area (33 APs) and their distribution along narrow corridors may have helped in achieving high fingerprinting accuracy. Test areas with less density of WiFi APs or open spaces may result in lower positioning accuracy.

4.5. Computational Complexity

For smartphone real-time localization, the position should be rapidly estimated to achieve seamless positioning and better user experience, otherwise the proposed scheme becomes tedious and useless. In practice, the estimated position should be updated in a time interval of less than the duration of a human step cycle. Hence, the proposed scheme should provide efficient positioning performance with a low computational complexity. In the online positioning stage of the proposed scheme, a KWNN algorithm was used to estimate the WiFi fingerprinting position. The computational complexity for KWNN is O ( n ) , where n is the number of offline fingerprints. In the online fingerprinting stage, after determining the nearest sub-cluster, the KWNN algorithm was applied on the sub-cluster RPs. The execution time of the KWNN algorithm is between 0.50 and 0.650 ms (for about 330 RPs per sub-cluster).
An EKF was used to fuse the PDR solution with the GNSS and WiFi fingerprinting solutions. Compared to the common fusion approaches, such as particle filter (PF) and unscented Kalman filter (UKF), EKF has a lower computational cost than the PF and is much simpler than the UKF. The PF has a complexity equal to O ( P L 2 ) , where P is the number of particles and L is the dimensions of the state parameter. To achieve better estimation performance, the number of particles should be larger than L . Compared to the PF, the complexity of the EKF is much lower, whereby the computational process for the PF requires P / L times the EKF. The EKF and UKF are the common versions of the KF proposed for solving the nonlinear models by linearization. The computational complexity of both filters equals O ( L 3 ) . However, the estimation process of the EKF is much simpler than the UKF. The execution time of the EKF is between 0.27 and 0.32 ms. A Huawei Mate 20 Pro smartphone (model LYA-L29, powered by a Kirin 980 octa-core processor and 6 GB of RAM) with an Android OS ran the proposed application to obtain the results. The EKF efficiently succeeded to provide a real-time positioning solution.

5. Conclusions

In this study, we proposed an enhanced indoor-outdoor environmental awareness service that is convenient for conducting a user-friendly handover mechanism for seamless navigation based on multi-sensory integration. Compared with existing I/O detection services, the proposed service guarantees reliable I/O detection while maintaining low power consumption for smartphones with limited power budgets. The proposed I/O detection service achieved an approximately 90% detection accuracy with low detection errors in transition areas between indoor and outdoor environments. Moreover, the proposed detection approach reduces the latency and power drain owing to the dependency on GNSS indicators only at the transition intervals. The benefits of the proposed I/O detection approach extend over online and offline localization stages. Leveraging the proposed detection service, the integrated solution based on EKF realized seamless indoor-outdoor localization with less switching latency and achieved a mean error of 2.1 m with 90% errors of less than 2.9 m. In the offline engine, the collection of crowdsourced data was confined to indoor and semi-indoor areas by virtue of accurately distinguishing the ambient environment type. As a result, battery consumption was reduced by preventing excessive data collection. There are several avenues for extending our study. The first is to investigate other indicators for I/O detection. The second is to suggest other factors such as smartphone capabilities for user-friendly crowdsourced data collection. The third is to measure user satisfaction with device performance, which can be conducted through questionnaires. The fourth is to extensively investigate the impact of both short-term and long-term database updating on the localization accuracy and the factors associated with the data collection process while updating the generated databases.

Author Contributions

Conceptualization, A.M. and W.C.; software, A.M.; writing—original draft preparation, A.M., writing—review and editing, A.M. and W.C.; supervision, W.C. All authors have read and agreed to the published version of the manuscript.

Funding

This research was supported by the University Grants Committee of Hong Kong under the scheme Research Impact Fund on the project R5009-21 and the research fund from the Smart Cities Research Institute, Hong Kong Polytechnic University.

Conflicts of Interest

The authors declare no conflict of interest.

References

  1. Rizos, C.; Yang, L. Background and Recent Advances in the Locata Terrestrial Positioning and Timing Technology. Sensors 2019, 19, 1821. [Google Scholar]
  2. Kohtake, N.; Morimoto, S.; Kogure, S.; Manandhar, D. Indoor and outdoor seamless positioning using indoor messaging system and GPS. In Proceedings of the International Conference on Indoor Positioning and Indoor Navigation (IPIN2011), Guimarães, Portugal, 21–23 September 2011; pp. 21–23. [Google Scholar]
  3. Zou, D.; Niu, S.; Chen, S.; Su, B.; Cheng, X.; Liu, J.; Liu, Y.; Li, Y. A smart city used low-latency seamless positioning system based on inverse global navigation satellite system technology. Int. J. Distrib. Sens. Netw. 2019, 15. [Google Scholar] [CrossRef] [Green Version]
  4. Zou, D.; Meng, W.; Han, S.; He, K.; Zhang, Z. Toward Ubiquitous LBS: Multi-Radio Localization and Seamless Positioning. IEEE Wirel. Commun. 2016, 23, 107–113. [Google Scholar] [CrossRef]
  5. Li, Y.; Zhuang, Y.; Zhang, P.; Lan, H.Y.; Niu, X.J.; El-Sheimy, N. An improved inertial/wifi/magnetic fusion structure for indoor navigation. Inf. Fusion 2017, 34, 101–119. [Google Scholar] [CrossRef]
  6. Li, Y.; Zhuang, Y.; Lan, H.; Niu, X.; El-Sheimy, N. A Profile-Matching Method for Wireless Positioning. IEEE Commun. Lett. 2016, 20, 2514–2517. [Google Scholar] [CrossRef]
  7. Zhang, P.; Chen, R.; Li, Y.; Niu, X.; Wang, L.; Li, M.; Pan, Y. A Localization Database Establishment Method Based on Crowdsourcing Inertial Sensor Data and Quality Assessment Criteria. IEEE Internet Things J. 2018, 5, 4764–4777. [Google Scholar] [CrossRef]
  8. Li, Y.; He, Z.; Gao, Z.; Zhuang, Y.; Shi, C.; El-Sheimy, N. Toward Robust Crowdsourcing-Based Localization: A Fingerprinting Accuracy Indicator Enhanced Wireless/Magnetic/Inertial Integration Approach. IEEE Internet Things J. 2019, 6, 3585–3600. [Google Scholar] [CrossRef] [Green Version]
  9. Yu, T.; Gui, L.; Yu, T.; Wang, J. Walrasian Equilibrium-Based Incentive Scheme for Mobile Crowdsourcing Fingerprint Localization. Sensors 2019, 19, 2693. [Google Scholar] [CrossRef] [PubMed] [Green Version]
  10. Feriol, F.; Vivet, D.; Watanabe, Y. A Review of Environmental Context Detection for Navigation Based on Multiple Sensors. Sensors 2020, 20, 4532. [Google Scholar]
  11. Zhu, Y.; Luo, H.; Wang, Q.; Zhao, F.; Ning, B.; Ke, Q.; Zhang, C. A fast indoor/outdoor transition detection algorithm based on machine learning. Sensors 2019, 19, 786. [Google Scholar]
  12. Bui, V.; Le, N.T.; Vu, T.L.; Nguyen, V.H.; Jang, Y.M. GPS-Based Indoor/Outdoor Detection Scheme Using Machine Learning Techniques. Appl. Sci. 2020, 10, 500. [Google Scholar] [CrossRef] [Green Version]
  13. Balcazar Soto, J. Indoor-Outdoor Detection and Routing Using Bayesian Networks; Aalto University: Espoo, Finland, 2016. [Google Scholar]
  14. Zhu, Y.; Luo, H.; Zhao, F.; Chen, R. Indoor/outdoor switching detection using multisensor densenet and LSTM. IEEE Internet Things J. 2020, 8, 1544–1556. [Google Scholar] [CrossRef]
  15. Wang, L.; Sommer, L.; Riedel, T.; Beigl, M.; Zhou, Y.; Huang, Y. NeuralIO: Indoor Outdoor Detection via Multimodal Sensor Data Fusion on Smartphones. In Proceedings of the International Summit Smart City 360°, Braga, Portugal, 4–6 December 2019; pp. 127–138. [Google Scholar]
  16. Ali, M.; ElBatt, T.; Youssef, M. SenseIO: Realistic Ubiquitous Indoor Outdoor Detection System Using Smartphones. IEEE Sens. J. 2018, 18, 3684–3693. [Google Scholar] [CrossRef]
  17. Li, S.; Qin, Z.; Song, H.; Si, C.; Sun, B.; Yang, X.; Zhang, R. A lightweight and aggregated system for indoor/outdoor detection using smart devices. Future Gener. Comput. Syst. 2020, 107, 988–997. [Google Scholar] [CrossRef]
  18. Canovas, O.; Lopez-de-Teruel, P.E.; Ruiz, A. Detecting indoor/outdoor places using WiFi signals and AdaBoost. IEEE Sens. J. 2016, 17, 1443–1453. [Google Scholar] [CrossRef]
  19. Shtar, G.; Shapira, B.; Rokach, L. Clustering Wi-Fi fingerprints for indoor–outdoor detection. Wirel. Netw. 2019, 25, 1341–1359. [Google Scholar] [CrossRef] [Green Version]
  20. Wang, W.; Chang, Q.; Li, Q.; Shi, Z.; Chen, W. Indoor-Outdoor Detection Using a Smart Phone Sensor. Sensors 2016, 16, 1563. [Google Scholar] [CrossRef] [Green Version]
  21. Saffar, I.; Morel, M.L.A.; Singh, K.D.; Viho, C. Semi-Supervised Deep Learning-Based Methods for Indoor Outdoor Detection. In Proceedings of the ICC 2019–2019 IEEE International Conference on Communications (ICC), Shanghai, China, 20–24 May 2019; pp. 1–7. [Google Scholar]
  22. Montella, S.; Berruet, B.; Baala, O.; Guillet, V.; Caminada, A.; Lassabe, F. A Funnel Fukunaga-Koontz Transform for Robust Indoor-Outdoor Detection Using Channel State Information in 5G IoT Context. IEEE Internet Things J. 2022, 9, 14018–14029. [Google Scholar] [CrossRef]
  23. Sung, R.; Jung, S.-H.; Han, D. Sound based indoor and outdoor environment detection for seamless positioning handover. ICT Express 2015, 1, 106–109. [Google Scholar] [CrossRef] [Green Version]
  24. Ashraf, I.; Hur, S.; Park, Y. MagIO: Magnetic field strength based indoor-outdoor detection with a commercial smartphone. Micromachines 2018, 9, 534. [Google Scholar] [CrossRef] [Green Version]
  25. Zou, H.; Jiang, H.; Luo, Y.; Zhu, J.; Lu, X.; Xie, L. Bluedetect: An ibeacon-enabled scheme for accurate and energy-efficient indoor-outdoor detection and seamless location-based service. Sensors 2016, 16, 268. [Google Scholar] [CrossRef] [PubMed] [Green Version]
  26. Li, M.; Zhou, P.; Zheng, Y.; Li, Z.; Shen, G. IODetector: A generic service for indoor/outdoor detection. ACM Trans. Sens. Netw. TOSN 2014, 11, 1–29. [Google Scholar] [CrossRef]
  27. Radu, V.; Katsikouli, P.; Sarkar, R.; Marina, M.K. A semi-supervised learning approach for robust indoor-outdoor detection with smartphones. In Proceedings of the 12th ACM Conference on Embedded Network Sensor Systems, Memphis, TN, USA, 3–6 November 2014; pp. 280–294. [Google Scholar]
  28. Anagnostopoulos, G.G.; Deriaz, M. Automatic switching between indoor and outdoor position providers. In Proceedings of the 2015 International Conference on Indoor Positioning and Indoor Navigation (IPIN), Melbourne, Australia, 13–16 October 2015; pp. 1–6. [Google Scholar]
  29. Ye, J.; Li, Y.; Luo, H.; Wang, J.; Chen, W.; Zhang, Q. Hybrid Urban Canyon Pedestrian Navigation Scheme Combined PDR, GNSS and Beacon Based on Smartphone. Remote Sens. 2019, 11, 2174. [Google Scholar] [CrossRef]
  30. Zeng, Q.; Wang, J.; Meng, Q.; Zhang, X.; Zeng, S. Seamless pedestrian navigation methodology optimized for indoor/outdoor detection. IEEE Sens. J. 2017, 18, 363–374. [Google Scholar] [CrossRef]
  31. Tao, X.; Zhu, F.; Hu, X.; Liu, W.; Zhang, X. An enhanced foot-mounted PDR method with adaptive ZUPT and multi-sensors fusion for seamless pedestrian navigation. GPS Solut. 2022, 26, 13. [Google Scholar] [CrossRef]
  32. Zhu, X.; Qu, W.; Qiu, T.; Zhao, L.; Atiquzzaman, M.; Wu, D.O. Indoor Intelligent Fingerprint-Based Localization: Principles, Approaches and Challenges. IEEE Commun. Surv. Tutor. 2020, 22, 2634–2657. [Google Scholar] [CrossRef]
  33. Jiang, W.; Cao, Z.; Cai, B.; Li, B.; Wang, J. Indoor and Outdoor Seamless Positioning Method Using UWB Enhanced Multi-Sensor Tightly-Coupled Integration. IEEE Trans. Veh. Technol. 2021, 70, 10633–10645. [Google Scholar] [CrossRef]
  34. Pendão, C.; Moreira, A. FastGraph Enhanced: High Accuracy Automatic Indoor Navigation and Mapping. IEEE Trans. Mob. Comput. 2021, 20, 1027–1045. [Google Scholar] [CrossRef]
  35. Pendão, C.; Moreira, A. FastGraph—Organic 3D Graph for Unsupervised Location and Mapping. In Proceedings of the 2018 International Conference on Indoor Positioning and Indoor Navigation (IPIN), Nantes, France, 24–27 September 2018; pp. 206–212. [Google Scholar]
  36. Martínez-González, A.; Monzó-Cabrera, J.; Martínez-Sáez, A.J.; Lozano-Guerrero, A.J. Minimization of measuring points for the electric field exposure map generation in indoor environments by means of Kriging interpolation and selective sampling. Environ. Res. 2022, 212, 113577. [Google Scholar] [CrossRef]
  37. Mendoza-Silva, G.M.; Costa, A.C.; Torres-Sospedra, J.; Painho, M.; Huerta, J. Environment-aware regression for indoor localization based on WiFi fingerprinting. IEEE Sens. J. 2021, 22, 4978–4988. [Google Scholar] [CrossRef]
  38. Bi, J.; Wang, Y.; Li, Z.; Xu, S.; Zhou, J.; Sun, M.; Si, M. Fast radio map construction by using adaptive path loss model interpolation in large-scale building. Sensors 2019, 19, 712. [Google Scholar] [CrossRef] [PubMed] [Green Version]
  39. Google. Firestore. Available online: https://firebase.google.com/docs/firestore (accessed on 6 October 2022).
  40. Zhou, B.; Ma, W.; Li, Q.; El-Sheimy, N.; Mao, Q.; Li, Y.; Gu, F.; Huang, L.; Zhu, J. Crowdsourcing-based indoor mapping using smartphones: A survey. ISPRS J. Photogramm. Remote Sens. 2021, 177, 131–146. [Google Scholar] [CrossRef]
  41. Khan, I.; Khusro, S.; Ali, S.; Ahmad, J. Sensors are power hungry: An investigation of smartphone sensors impact on battery power from lifelogging perspective. Bahria Univ. J. Inf. Commun. Technol. BUJICT 2016, 9, 8–19. [Google Scholar]
  42. Mansour, A.; Chen, W.; Luo, H.; Li, Y.; Wang, J.; Weng, D. Drift Control of Pedestrian Dead Reckoning (PDR) for Long Period Navigation under Different Smartphone Poses. Eng. Proc. 2021, 10, 21. [Google Scholar]
  43. Julier, S.J.; Uhlmann, J.K. Unscented filtering and nonlinear estimation. Proc. IEEE 2004, 92, 401–422. [Google Scholar] [CrossRef]
  44. Li, Y.; Georgy, J.; Niu, X.; Li, Q.; El-Sheimy, N. Autonomous Calibration of MEMS Gyros in Consumer Portable Devices. IEEE Sens. J. 2015, 15, 4062–4072. [Google Scholar] [CrossRef] [Green Version]
  45. Wang, Q.; Ye, L.; Luo, H.; Men, A.; Zhao, F.; Ou, C. Pedestrian walking distance estimation based on smartphone mode recognition. Remote Sens. 2019, 11, 1140. [Google Scholar] [CrossRef] [Green Version]
  46. Kang, W.; Han, Y. SmartPDR: Smartphone-Based Pedestrian Dead Reckoning for Indoor Localization. IEEE Sens. J. 2015, 15, 2906–2916. [Google Scholar] [CrossRef]
  47. Pappas, I.P.I.; Popovic, M.R.; Keller, T.; Dietz, V.; Morari, M. A reliable gait phase detection system. IEEE Trans. Neural Syst. Rehabil. Eng. 2001, 9, 113–125. [Google Scholar] [CrossRef]
  48. Guo, G.; Chen, R.; Ye, F.; Chen, L.; Pan, Y.; Liu, M.; Cao, Z. A pose awareness solution for estimating pedestrian walking speed. Remote Sens. 2019, 11, 55. [Google Scholar] [CrossRef] [Green Version]
  49. Weinberg, H. Using the ADXL202 in pedometer and personal navigation applications. Analog. Devices AN-602 Appl. Note 2002, 2, 1–6. [Google Scholar]
  50. Li, Y.; Zahran, S.; Zhuang, Y.; Gao, Z.; Luo, Y.; He, Z.; Pei, L.; Chen, R.; El-Sheimy, N. IMU/Magnetometer/Barometer/Mass-Flow Sensor Integrated Indoor Quadrotor UAV Localization with Robust Velocity Updates. Remote Sens. 2019, 11, 838. [Google Scholar] [CrossRef] [Green Version]
  51. Ahmed Mansour, J.Y.; Li, Y.; Luo, H.; Wang, J.; Weng, D.; Chen, W. Everywhere: A Framework for Ubiquitous Indoor Localization. IEEE Internet Things J. 2022; submitted. [Google Scholar]
  52. Huang, B.Q.; Xu, Z.D.; Jia, B.; Mao, G.Q. An Online Radio Map Update Scheme for WiFi Fingerprint-Based Localization. IEEE Internet Things J. 2019, 6, 6909–6918. [Google Scholar] [CrossRef]
  53. Taniuchi, D.; Maekawa, T. Automatic update of indoor location fingerprints with pedestrian dead reckoning. ACM Trans. Embed. Comput. Syst. TECS 2015, 14, 1–23. [Google Scholar] [CrossRef]
  54. Chang, Q.; Van de Velde, S.; Wang, W.P.; Li, Q.; Hou, H.T.; Heidi, S. Wi-Fi Fingerprint Positioning Updated by Pedestrian Dead Reckoning for Mobile Phone Indoor Localization. Lect. Notes Electr. En. 2015, 342, 729–739. [Google Scholar] [CrossRef]
  55. Chang, K.; Han, D. Crowdsourcing-based radio map update automation for Wi-Fi positioning systems. In Proceedings of the 3rd ACM SIGSPATIAL International Workshop on Crowdsourced and Volunteered Geographic Information, Dallas, TX, USA, 4 November 2014; pp. 24–31. [Google Scholar]
  56. Chen, W.; Chang, Q.; Hou, H.-T.; Wang, W.-P. A novel clustering and KWNN-based strategy for Wi-Fi fingerprint indoor localization. In Proceedings of the 2015 4th International Conference on Computer Science and Network Technology (ICCSNT), Harbin, China, 19–20 December 2015; pp. 49–52. [Google Scholar]
  57. Lemelson, H.; Kjærgaard, M.B.; Hansen, R.; King, T. Error estimation for indoor 802.11 location fingerprinting. In Proceedings of the International Symposium on Location-and Context-Awareness, Tokyo, Japan, 7–8 May 2009; pp. 138–155. [Google Scholar]
  58. Zhu, F.; Tao, X.L.; Liu, W.K.; Shi, X.; Wang, F.H.; Zhang, X.H. Walker: Continuous and Precise Navigation by Fusing GNSS and MEMS in Smartphone Chipsets for Pedestrians. Remote Sens. 2019, 11, 139. [Google Scholar] [CrossRef]
  59. Bahadur, B. A study on the real-time code-based GNSS positioning with Android smartphones. Measurement 2022, 194, 111078. [Google Scholar] [CrossRef]
  60. Popleteev, A. Indoor positioning and floor plan based ground truth: Can you really click where you are? In Proceedings of the 15th International Conference on Mobile and Ubiquitious Multimedia (MUM-2016), Rovaniemi, Finland, 12–15 December 2016. [Google Scholar]
Figure 1. Classification of seamless and ubiquitous localization systems.
Remotesensing 14 05263 g001
Figure 2. The prototype application developed for seamless and ubiquitous navigation.
Remotesensing 14 05263 g002
Figure 3. Schematic diagram of the proposed seamless and ubiquitous navigation system.
Remotesensing 14 05263 g003
Figure 4. Utilizing GNSS and LPCS indicators in the proposed I/O detection approach.
Remotesensing 14 05263 g004
Figure 5. A flowchart of the proposed I/O detection algorithm.
Remotesensing 14 05263 g005
Figure 6. Crowdsourced data collection strategy.
Remotesensing 14 05263 g006
Figure 7. The impact of I/O discrimination on collecting crowdsourced data. It can be observed that although several tracks were walked in the garden area, utilizing the I/O detection approach confined the collected data to indoor and semi-indoor areas (i.e., the GNSS denied areas that lacked localized signatures).
Remotesensing 14 05263 g007
Figure 8. Test areas. In Track (Z), the letters (A–H) refer to the start of the transitions from indoors to outdoors or vice versa used to evaluate the detection latency in Figure 10.
Remotesensing 14 05263 g008
Figure 9. I/O detection accuracy using different detection approaches and smartphone models in indoor, semi-indoor, and outdoor areas.
Remotesensing 14 05263 g009
Figure 10. The switching responses of different I/O detection services. The positions of the transitions (A–H) are plotted in Figure 8.
Remotesensing 14 05263 g010
Figure 11. Seamless positioning performance for different tracks (A)–(C).
Remotesensing 14 05263 g011
Figure 12. The CDF of the error in positioning for PDR, WiFi fingerprinting, GNSS, and EKF for tracks (AC).
Remotesensing 14 05263 g012aRemotesensing 14 05263 g012b
Table 1. The state-of-the-art of indoor-outdoor detection approaches.
ApproachSensors Used for DetectionLow PowerHigh
Reliability
Fast
Switching
Ubiquity
BLEMFLightProx.CellWiFiGPSPress.SoundTemp.
Power-consuming approaches[11]
[12]
[13]
[14]
NeuralIO [15]
SenseIO [16]
[17]
WIFI Boost [18]
[19]
Power-saving approaches[20]
[21]
[22]
[23]
MagIO [24]
BlueDetect [25]
IODetector [26]
[27]
[28]
Table 2. Battery power consumption for different I/O detection services.
SystemAverage Minutes to Reduce 1% of Battery Life
Environment Indoors
without
Transitions
Outdoors
without
Transitions
Indoors and
Outdoors with
Transitions
GNSS4.724.954.65
IODetector5.555.605.52
LPCS+GNSS (continuous)4.554.224.10
The proposed detection
service
5.505.585.45
Table 3. Comparison between the performance of the proposed I/O detection and its counterparts.
I/O Detection ApproachSensors Used for DetectionDetection AccuracyPower Consumption
IODetector [26]Light, cellular, and magnetismThe overall accuracy was ~86%, reduced to 71% in the transition intervals (semi-indoor areas). Low
[27]Light, cellular, and magnetismThe overall accuracy was ~88% in familiar
environments and 82% in unfamiliar environments.
Low
SenseIO [16]Light, cellular, and WiFiThe overall accuracy of indoor and outdoor detection was ~91%, and the semi-indoor areas were not considered for detection.High
[13]Light, cellular, magnetism, and GNSS (continuous)The overall accuracy of indoor and outdoor detection was ~89%, and the semi-indoor areas were not considered for detection.High
[15]Light, cellular, magnetism, GNSS, sound, and temperatureThe overall accuracy of indoor and outdoor detection was ~94%, and the semi-indoor areas were not considered for detection.High
The proposed approach Light, cellular, magnetism, and GNSS (in the transition intervals)The proposed approach achieved an overall accuracy of ~92%, with 82% in semi-indoor areas.Low with a marginal increase in semi-indoor areas
Table 4. Positioning accuracies of the PDR, fingerprinting, GNSS, and EKF solutions.
SolutionMean (m)90% (m)
TrackABCABC
PDR2.84.73.54.35.85.2
Fingerprinting2.12.42.23.33.93.4
GNSS4.8-4.49.2-8.5
EKF1.62.22.42.42.73.5
Publisher’s Note: MDPI stays neutral with regard to jurisdictional claims in published maps and institutional affiliations.