1. Introduction
The Soil Moisture and Ocean Salinity (SMOS) mission is a joint program led by the European Space Agency (ESA) with participation of the “Centre National d’Etudes Spatiales” (CNES) in France and the “Centro Para el Desarrollo Tecnológico Industrial” (CDTI) in Spain. Its main scientific objectives are to observe soil moisture over land and sea surface salinity over oceans. SMOS was launched on 2 November 2009, and it completed the commissioning phase in May 2010. Although initially foreseen to last five years, the mission duration has been extended given the excellent performance and continuous good health of SMOS. As soon as SMOS data analysis began, it became clear that it was strongly affected by radio-frequency interference (RFI), which was distributed worldwide, in particular over large parts of Europe, China, Southern Asia, and the Middle East [
1,
2,
3]. The RFI has an important impact in the data quality of both the soil moisture and the sea surface salinity retrievals, and it leads to significant amounts of data being discarded since they are unusable by scientific users or operational agencies.
The ESA RFI Monitoring and Information Tool (ERMIT) is the tool that has been developed after 12 years of evolution in monitoring, detecting, and reporting interfering sources observed by SMOS. The tool, which has recently become public, allows users to access information about the RFI sources observed by SMOS in a new, user-friendly and detailed way. This information is potentially useful for users to perform studies related to RFI detection or localization techniques, to show statistics on global RFI contamination in the 1400–1427 MHz band, to compare the RFI observed by SMOS with other missions, to correlate the evolution of the RFI scenario in the L-band of certain regions with other related events, and of course to report the sources detected to the National Authorities for their mitigation on the field.
2. Radio Frequency Interference-Regulatory Framework
Despite the existing regulations at an international level, SMOS observations have been strongly impacted by RFI since the beginning of the mission operations, which jeopardizes part of its scientific retrieval in certain areas of the world (
Figure 1). This limits the possible mission return on investment as areas affected by RFI might experience data loss or underestimation of soil moisture and ocean salinity retrieval values.
The 1400–1427 MHz frequency band is allocated on a primary basis to the Earth exploration satellite service (EESS) (passive), space research (passive) and radio-astronomy services. The 1400–1427 MHz band is subject to provision No. 5.340 of the International Telecommunications Union (ITU) Radio Regulations (RR), meaning that all in-band emissions are prohibited [
4]. The unwanted emissions from active services in adjacent frequency bands have the potential to cause harmful interference to passive sensors operating in the EESS (passive).
The maximum unwanted power levels from adjacent active services into the 1400–1427 MHz band are limited by Resolution 750 (Rev. WRC-19).
Figure 2 is a graphical representation of Resolution 750. For International Mobile Telecommunication (IMT) systems operating Mobile Services in the 1427- 1452 MHz band, the unwanted emission limits (measured at the antenna port) are −72 dBW/27 MHz for IMT base stations and −62 dBW/27 MHz for IMT mobile stations. These limits for IMT are mandatory, while for other services Resolution 750 only resolves to “urge administrations to take all reasonable steps to ensure that unwanted emissions of active service stations (…) do not exceed certain recommended maximum levels”. These other services and their limits are: (a) Radiolocation Service (radars): −29 dBW/27 MHz; (b) Fixed Service (point-to-point links): −45 dBW/27 MHz; (c) Mobile Service: −60 dBW/27 MHz for standard mobile stations, −45 dBW/27 MHz for transportable radio-relay stations and −28 dBW/27 MHz for aeronautical telemetry stations; (d) Space Operation Service (Earth-to-space): −36 dBW/27 MHz.
In setting these limits to active services in adjacent bands, Resolution 750 highlights that “administrations should be aware that EESS (passive) sensors provide worldwide measurements that benefit all countries, even if these sensors are not operated by their country”. In Europe the recommended unwanted emission levels have been adopted and were made mandatory, as decided in the CEPT Decision ECC/DEC/ (11)01. This decision provides a clear and non-ambiguous message for the long-term EESS (passive) band’s protection. In addition, it also gives a clear sign to the international community about the recognition by Europe of the societal and economical value of the applications leveraged by EO data provided by the EESS, which are key for climate monitoring and natural disasters prediction.
The interference criteria for passive remote sensors are specified in Recommendation ITU-R RS.2017. For the 1400–1427 MHz band, the maximum interference level is −174 dBW/27 MHz, and this level may be exceeded during 0.1% of a measurement area of 10 M-km2, or 0.1% of the observation time.
RR Article 15, and in particular its provisions No. 15.21 (section on Reports on Infringements) and Nos. 15.22–15.46 (section on Procedure in case of harmful interference), is applicable in cases of harmful interference. For this, in addition to the form in RR Appendix 10, Recommendation ITU-R RS.2106 provides the RFI reporting form to be used by administrations to report additional detailed information on interference to EESS passive sensors.
3. From Manual RFI Monitoring and Detection to ERMIT
Since the beginning of operations, the RFI-related work has been divided into three main branches:
- 1.
Monitoring and detection: Monitoring of the SMOS frequency-band and detection of new interfering sources with their geolocation and signal characteristics. This branch also includes the follow-up of the evolution of the sources already detected;
- 2.
Database: Log of all sources detected, sorted by country or region. All characteristics detected during the monitoring process are stored;
- 3.
Reporting and operational coordination: Reporting procedure to the national authorities or other organizations in accordance with the ITU RR and Recommendations, with the aim of locating and turning off interfering equipment. This branch also includes the operational coordination with national authorities and tracking of all actions performed.
The initial RFI reporting policy focused on extremely strong sources that appeared in early satellite observations. The immediacy of results was prioritized over creating something consistent, and although this reporting activity more than achieved its objectives, an evolution of all its parts was going to be necessary.
In this approach, detection and tracking consisted of manual analysis in ESAC of L1C products (i.e., geolocated brightness temperatures) one by one using the VISAT (SMOS product reader) software. The “RFI database” was populated by manually tracking information from persistent sources and stored in spreadsheets. The reporting method consisted of spreadsheets and screenshots (
Figure 3) sent by email, along with a cover letter to the appropriate National Regulatory Authorities [
5]. Reports were prepared for especially problematic cases.
This approach worked for the first very strong permanent sources detected, but the large number of RFI sources made that manual process unmanageable.
In order for the team to scale up the reporting effort, the need for automation became evident. For this, several automatic interference detection algorithms were developed [
6,
7]. Based in astronomical image processing and on L1C products, the ESAC RFI detection algorithm detects and locates RFI sources on a daily basis [
8]. There was already a detection algorithm created by Centre d’Etudes Spatiales de la Biosphère (CESBIO) for operational use with the aim of flagging RFI in scientific products, but it was necessary to develop one aimed at detecting persistent sources over time in order to report them for later mitigation in the field. The RFI data were consolidated every month based on the ESAC algorithm detections, and after comparison with CESBIO’s RFI List to rule out possible false positives.
Scripts were also created to generate automatic maps of both brightness temperature (BT) (see
Figure 4) and probability (see
Figure 5), which makes it much easier to illustrate the reports and give a local or global image of the interference environment and data pollution situation.
An FTP was configured to save the information from all the sources detected in the spreadsheets. A standard document format was also created to inform National Regulatory Authorities and access to the ITU Satellite Interference Reporting and Resolution System (SIRSS) began for the official reporting of all harmful interference cases; it was accepted by ITU as an official template [
9]. The reporting is carried out by the
Agence Nationale des Fréquences (ANFR), i.e., the French administration, in close cooperation and fluid communication with the ESA.
Once the automatic daily RFI detection system was nominally working, and with the aim of homogenizing the sources detected in the past with manual methods, it was decided to reprocess the data from the beginning of the mission. For that, unique RFI sources were tracked in order to maintain consistency. Additionally, the BT and probability maps were generated using the data collected since 2010 and all the statistics were calculated for this period. This process has generated homogeneous data from the beginning of the session. This is reflected in the following:
~8000 unique RFI sources
- o
With information on location, brightness temperature, geographical data, orientation, averaged data, etc.;
~800,000 observations
- o
Including each brightness temperature map and with information of timestamp, location, brightness temperature, etc.;
~4500 global probability maps;
~1,200,000 regional probability maps.
The increase in the amount of information has made it necessary to create a database and an interface to access it. This is what the ERMIT tool is all about.
4. ERMIT: An Integrated Tool to Detect, Store, and Display Information about SMOS RFI
ERMIT is the tool implemented at ESAC with the purpose of handling and managing the information on RFI collected by SMOS.
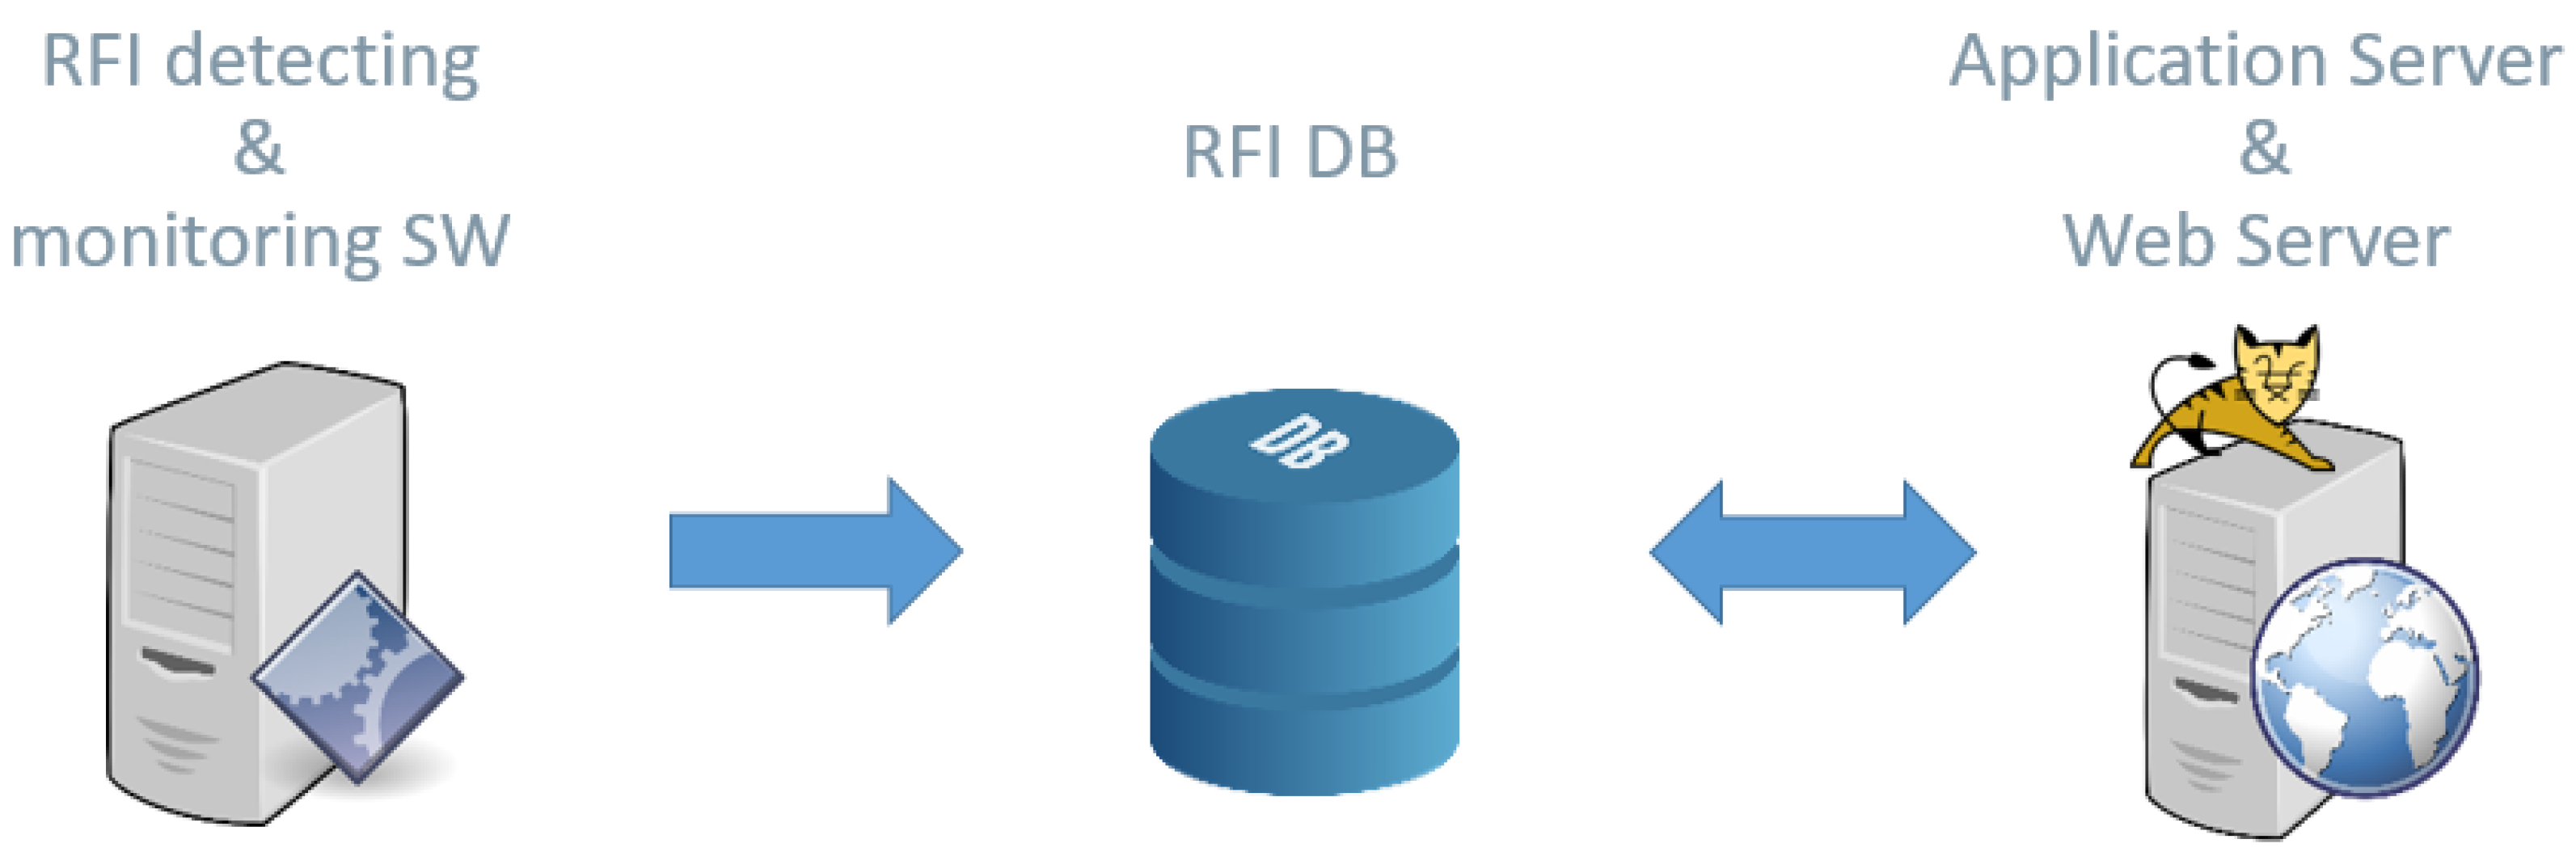
ERMIT has three main components: a set of software tools to monitor and detect RFI sources in the SMOS products, an RFI database (DB) where the output of the software is stored [
10], and a “server” component, which actually comprises of two servers: an application server and a web server (
Figure 6).
The RFI monitoring tools implemented at ESAC generate information about the interferences detected by SMOS that is stored in the RFI DB such as coordinates, brightness temperatures, date and time the RFI source is visible from SMOS, etc., as well as maps, reports, statistics, and more. Data in the RFI database is made available thanks to a web interface to access the information stored in the database, not only for internal use but also for external access. This website is modular, and its functionalities can increase as needed.
ERMIT was initially developed as an internal tool for improving the efficiency of the SMOS RFI team in their daily tasks of spectrum monitoring and RFI processing (e.g., RFI detecting and reporting). However, it soon became apparent that it could also be useful for external users.
ERMIT allows different types of user profiles, based on the intended purposes and needs:
Internal profiles:
ESA/SMOS: This user profile is used by the RFI team to access more information than previously described users. RFI information is important for other ESA missions, both missions in a design phase such as the future Copernicus missions CIMR or ROSE-L, as well as missions in an operational phase which sometimes request information from SMOS. Finally, information about RFI is also useful for other SMOS-related teams as it is the case of the SMOS calibration team, Expert Science Laboratories (like CESBIO, IFREMER, etc.), the frequency management team, and other scientific researchers interested in knowing about the active RFI sites at any time everywhere all around the world.
Admin: This is the profile to perform the daily global monitoring tasks by the Data Payload Ground System (DPGS) team or any kind of administration tasks, including operations on the RFI DB.
Additional user profiles could be created, if required, and any request for specific information and proposals for new functionalities that can be provided through the ERMIT tool will also be taken into account.
5. Information Available in ERMIT
The data available in ERMIT is updated daily and is accessible according to the user’s privileges. ERMIT data is available via the web at the following url:
https://rfi.smos.eo.esa.int (accessed on 25 September 2022) (
Figure 7).
ERMIT provides different information related to RFI, including:
Maps: maps of “RFI probability”, i.e., the percentage of samples contaminated by RFI for any location on the ground. These maps are computed every day using a 15-day running window. They are produced at three extension levels:
- a.
RFI probability worldwide maps;
- b.
RFI probability continental maps;
- c.
RFI probability country maps (
Figure 8).
Statistics, charts, and plots: A variety of statistical information is elaborated on a monthly basis as soon as the RFI DB is populated with the consolidated data, including the following plots and charts:
- a.
Time evolution of RFI sources worldwide;
- b.
Time evolution of RFI sources by continent;
- c.
Time evolution of RFI sources by country (
Figure 9);
- d.
Bar and pie charts worldwide and broken down by continent and country (
Figure 10);
- e.
Ranking of RFI severity per country: to determine the priorities for RFI reporting, a country ranking has been implemented. This consists in ordering the countries of the world by their number of sources of interference, their strength, and the polluted area, showing the most problematic regions in a simple way.
Reports: One of the main purposes of the RFI team is to report the active RFI sources in each country to their respective National Regulatory Authorities (NRA). Some reports are privately issued in the SIRRS (Satellite Interference Reporting and Resolution System) platform, hosted by the ITU. These reports are only accessible to the NRA of the reported country, ANFR and the reporting administration, and the ESA as the affected operator, whereas other reports are public and visible for all ITU SIRRS users. Recently, some reports are being prepared in coordination with NASA. In these cases, both agencies agree on which countries to report to, and then each submits their own reports. When reports are coordinated between the ESA and NASA, they reach the reported country at approximately the same time.
Information on individual RFI sources: Information about individual RFI sources is stored in the RFI DB such as:
- a.
List of RFI sources with information such as coordinates, brightness temperature, country, etc.;
- b.
SMOS RFI passes list: List of SMOS passes associated with an individual RFI source as well as BT maps linked to specific SMOS passes, keeping track of all passes throughout the SMOS mission;
- c.
Information on each SMOS pass over the location of each RFI source, keeping track of all these passes throughout the SMOS mission (
Figure 11);
- d.
Alarms: Configurable alarms can be set up to check in an automatic way whether a specific RFI source is active or not during a period of time, or to be aware of new RFI sources above a certain BT threshold.
6. Interfering Devices Identified
During these years, the SMOS RFI team has found several types of interference sources according to their topology, power, and behavior [
1]. They can be broken down by intensity: high power (a) vs. low power (b); by emission features: omnidirectional (c) vs. directive (d) vs. pulsed (e) probably scanning beam; or by spatial distribution: extended (f) vs. isolated (g). Three types of RFI sources have been detected in the purely passive band 1400–1427 MHz: (a) In-band emissions from either unauthorized or malfunctioning equipment, (b) Excessive out-of-band emissions from radar systems operating in the lower adjacent band, and (c) spurious emissions (intermodulation, harmonic and parasitic emissions) from devices operating in the upper adjacent band.
6.1. Intensity: Very Strong Power Emitters
Very strong emitters (BT > 5000 K) are the most damaging sources to science data, some of which achieve more than 1 million Kelvin, and manage to blind the entire instrument of the satellite, allowing large parts of data to be polluted (
Figure 13, right). When the interfering source is close to the sea, it causes the same annoying effects on the SMOS ocean products, polluting large areas of ocean data (
Figure 13, left).
6.2. Intensity: Moderate Power Emitters
Although some interfering devices transmit with a low power (<1 W) within the 1400–1427 MHz band, they are nevertheless observed by the instrument, reaching a brightness temperature > 1000 K. Low power makes geolocation by SMOS difficult as well as its location in the field. In some cases, the cause of the interfering signal is a leak in poorly isolated RF equipment, making it even more difficult to locate the source. In the following figures (
Figure 14 and
Figure 15), an interfering television amplifier due to poor filtering is shown next to its observation on a SMOS Level-1 Land map:
6.3. Emission Pattern: Omnidirectional Antennas
Omnidirectional antennas are observed in all the products of SMOS regardless of the direction of the passes. They are used for broadcasting applications, such as push-to-talk systems, TV/radio stations, etc. As an example, an interference was detected in Albania due to a TV/Radio broadcasting system (
Figure 16).
During measurements performed by Albanian authorities (AKEP Albania) using a spectrum analyzer in the band 1400–1427 MHz, it resulted that the source of interference was a broadcaster subject with an audiovisual signal which transmits analog TV and radio FM signals.
6.4. Emission Pattern: Directional Antennas
Regarding the radiation pattern of the transmission device, we can distinguish the interfering directional antennas by analyzing the differences between ascending and descending passes of SMOS. Directional antennas are usually observed with different powers in the ascending and descending passes. In the ideal case, when the direction of the antennas is aligned with the satellite direction, they are observed in one direction, while not in the other.
These types of sources are usually terrestrial radiolinks with different objectives: wireless CCTV cameras (
Figure 17), point-to-point communication networks, data transmission systems, etc.
6.5. Emission Pattern: Pulsed Signals
The most common sources of this kind are radars with excessive unwanted emission levels, and they are very difficult to limit. Unwanted emissions limits to maximum levels are defined in Res. 750 (Rev. WRC-19). They are easy to locate from space (<1 km error) and in the field. As they are usually very powerful sources, their impact on SMOS data is very harmful. An example of a pulse-shaped signal in the time domain is shown in
Figure 18:
6.6. Spatial Distribution: Extended Areas
Regardless of their power, large areas of extended sources are observed in some urban zones. This distribution of interferences makes it very difficult to locate each source, since they could overlap each other and it is impossible to know exactly how many devices are interfering. In the following figures, several cases can be observed: Japan, where multiple low-power emitters create a large area of interference, South Korea, where a mixture of powerful and weak emitters composes an area of overlapped interferences (
Figure 19), and Moscow, where more than four powerful emitters blind its entire urban area (
Figure 20):
7. Interference from Lower-Frequency Bands
On top of those interferences caused either by in-band emissions or unwanted emissions from active services in adjacent frequency bands, some interference can be caused by emissions from lower-frequency bands further away from the SMOS band.
This type of interference source has been detected by SMOS coming from various bands and devices, such as transmissions with a combination of two TV channels, harmonic emissions (second or third harmonic) from base stations of cellular networks, or other transmitters that fall within the protected frequency band.
Figure 21 shows an example of harmonic interference from the fundamental frequency of the emission within the band 470–476 MHz from a TV broadcast relay station operating without a filter. In this case, the third harmonics of its video and sound signals were interfering with SMOS’s band.
Reinforcement of the aim to protect the electromagnetic spectrum in the prohibited 1400–1427 MHz band is a must, including the regulation of new lower frequency allocations to services with the risk of interference from frequency mixers or harmonic emissions.
8. Conclusions
The experience of SMOS with harmful radio frequency interference for the past 12 years shows that the radio environment is complex and its reality may diverge significantly from what can be expected based on the regulatory framework of the band 1400–1427 MHz. This is due to both in-band unauthorized emissions and out-of-band excessive unwanted emissions.
The ESA and the SMOS RFI teams have devoted considerable resources to the detection and reporting of interference cases worldwide, with the associated impacts in cost, manpower, and definition of RFI processes. These proved to be essential in controlling the interference environment, maximizing the mission performance and its scientific return. The efficiency of monitoring and reporting interference has improved remarkably with the development of the tools described above. The lessons learned and the work done in the framework of the SMOS mission for the L-band are fully adaptable and scalable, making them useful for present and future missions and EO applications in other frequency bands.
ERMIT is accessible to users at
https://rfi.smos.eo.esa.int (accessed on 25 September 2022) and depending on the user profile, allows the following information about SMOS RFI to be obtained:
Global, regional and country-wide RFI Probability maps;
Statistics, charts, and plots elaborated monthly;
Reports sent to the National Administrations;
Detailed information on individual RFI sources.
Thanks to all the work carried out during these 12 years with different tools now centralized with ERMIT, the number of affected pixels in SMOS land products has been reduced from more than 6% to less than 3% (
Figure 22). Taking into account the proliferation of wireless equipment around the world, this work has to continue so that this contamination does not grow again.

