Abstract
Water use efficiency (WUE) reflects the balance between carbon assimilation and water consumption in terrestrial ecosystems. Considering the fragile conditions of global water resources, the evaluation of regional WUE variation characteristics and response mechanisms is critical for promoting sustainable ecological development and water resource utilization. Based on gross primary productivity (GPP) and evapotranspiration (ET) datasets, combined with vegetation and meteorological data, this study examined the spatiotemporal variations, annual variation contribution rate, and driving mechanism of WUE in Inner Mongolia from 2001 to 2020. The main results are as follows: (1) The interannual and spatial variations of GPP, ET, and WUE all exhibited increasing trends, with WUE increasing in approximately 70% of the region and significantly increasing in 22.35% of pixels exhibiting a significant increase. Areas with the most significant increases were located in the Horqin sandy land and Mu Us sandy land. (2) The highest WUE values were observed in the summer season, followed by autumn and winter, and the lowest in spring. (3) Among all vegetation types, the typical steppe ecosystems contributed most to the interannual variability (IAV) of GPP, ET, and WUE, with values of 169.89%, 141.09%, and 193.42%, respectively. While the coniferous forest contributed least or negatively to GPP, ET, and WUE IAV, with values of −36.28%, 28.20%, and −32.86%, respectively. (4) The primary driver of WUE variation was found to be GPP, which contributed 59.36%, mainly in the central and western regions. The remaining 40.64% was attributable to ET, concentrated in the northeast region. (5) Human activities significantly affected WUE, with a contribution (about 53.52%) larger than that of climate change (nearly 46.48%). Increased precipitation improves vegetation WUE and is the most important climate factor influencing WUE variations. These findings will aid the formulation of vegetation protection and water resource management strategies in water-stressed areas.
1. Introduction
The carbon dioxide (CO2) level in the atmosphere has increased exponentially since the industrial revolution [1,2,3]. The continuous increase of atmospheric CO2 had a significant effect on the patterns of the carbon–water cycle and the carbon–water balance of exchanges in terrestrial ecosystems, posing serious threats to ecological sustainability and human survival [1]. Water use efficiency (WUE) is a common variable for measuring the interaction of carbon assimilation and water loss in terrestrial ecosystems, it is also an important parameter reflecting the sensitivity of ecosystems to climate change [4,5,6]. The vegetation WUE consists of two main components: gross primary productivity (GPP) and evapotranspiration (ET) [6,7,8]. GPP is the amount of carbon fixed by terrestrial vegetation via photosynthesis and represents the largest carbon flux in the global terrestrial carbon cycle [9,10,11]. ET is an important water vapor flux that refers to the water used by an ecosystem through transpiration or surface evaporation and influences water and energy distribution between the land surface and the atmosphere [12]. The study of vegetation WUE can not only provide an in-depth understanding of ecosystem change patterns but also explain how ecosystems respond to climate changes and water resources, laying the groundwork for promoting vegetation productivity and ecological construction in water-stressed areas.
Numerous studies have shown that the variability of WUE is related to a variety of factors, including human activities (vegetation greenness) [13,14,15], climate factors [16,17], CO2 fertilization and N deposition [18], canopy conductance [19], and drought [6]. In arid ecosystems, WUE variability is mostly influenced by human activity and climate factors [20,21,22]. For example, Bai et al. [21] found that WUE variations in the arid ecosystems of China were controlled by precipitation. Xu [22] suggested that precipitation promoted vegetation WUE in dryland regions of China. Du et al. [20] pointed out that WUE in northern China presented a dominant increasing trend and WUE variability was primarily controlled by climate factors (precipitation, temperature, and solar radiation), with climate accounting for 84% and human activities accounting for approximately 16%. Nevertheless, Guo et al. [5] found that human activities played a critical role in the increase of WUE in the Beijing–Tianjin Sandstorm Source region, with a relative contribution of 88.2%, followed by precipitation and temperature, which contributed only 11.8%. The impact of climate change and human activity on WUE in water-limited regions remains debatable.
Inner Mongolia is the third largest province and region in China (12.3% of China’s land area); it has vast grassland resources and mineral resources, which are important for the ecological environment protection and economic growth of China [23,24,25]. However, located in arid and semi-arid environments, Inner Mongolia has a fragile ecological environment and uneven distribution of water resources, due to which, it is extremely sensitive to climate change [26,27,28]. With the country’s rapid economic development and increasing level of urbanization, the water resources and terrestrial biodiversity of Inner Mongolia have seen a substantial decline in recent decades [23,24,25,29,30,31,32,33]. In response, the Chinese government has been implementing many large-scale ecosystem restoration and governance efforts since the 1950s. To use limited water resources sensibly and effectively, a more comprehensive and in-depth study of the WUE characteristics in water-limited areas is necessary. Therefore, this study selected Inner Mongolia as the study area and quantitatively assessed the variation characteristics of WUE and its response mechanism to human activity and climate change by combining climate data (temperature, precipitation, and solar radiation). The specific main objectives are: (1) to explore the spatiotemporal variations and trends of regional GPP, ET, and WUE; (2) to investigate the seasonal variations characteristics of GPP, ET, and WUE; (3) to depict the variations in GPP, ET, and WUE for different vegetation types and their contribution to IAV; (4) to determine the sensitivity and contribution of GPP and ET to WUE IAV; and (5) to evaluate the positive–negative effects of human activity and climate on variations in WUE. The findings are expected to provide a reference basis for future rational planning of vegetation restoration and water resource management.
2. Materials and Methods
2.1. Study Area
Inner Mongolia (Inner Mongolia Autonomous Region) is located on the northern border of China (37°24′–53°23′N, 97°12′–126°04′E) and it represents the third largest province and region in China, with an area of 118.3 × 10⁴ km2. Inner Mongolia belongs to a temperate continental climate with cold winters and hot summers. It has complex and diverse landforms, with the terrain inclining from southwest to northeast, sequentially covering the Mu Us sandy land, Otindag sandy land, Horqin sandy land, and Da Hinggan Ling Mountains (Figure 1c). As an important animal husbandry production base in China, Inner Mongolia has rich and diverse vegetation types, with grassland being the most prevalent vegetation type, including meadow steppe, typical steppe, and desert steppe, which account for approximately 46.13% of the total area (Figure 1b).
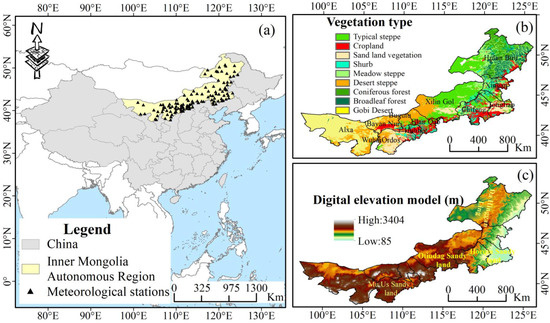
Figure 1.
Overview of the study region, (a) Geographical location and meteorological stations, (b) Vegetation types, and (c) Digital elevation model (DEM).
2.2. Data Sources
In this study, the global OCO-2-based solar-induced chlorophyll fluorescence product (GOSIF) GPP and the Global Land Evaporation Amsterdam Model version 3.5a (GLEAM) ET remote sensing products were used to calculate WUE. GOSIF GPP (2001–2020) is a long-term series dataset based on solar-induced chlorophyll fluorescence (http://data.globalecology.unh.edu/, accessed on 15 May 2022), with a spatial resolution of 0.05°and 8-day time step [34]. GLEAM product ET is estimated from observed precipitation, surface soil moisture, and vegetation moisture content as the control conditions by using Priestley-Taylor algorithms and combining multi-source remote sensing data [35,36]. The GLEAM 3.5a datasets (https://www.gleam.eu/, accessed on 15 May 2022) span from 1981 to 2020, with a spatial of 0.25°and a daily time step. ET products were resampled to 0.05° to unify the spatial resolution of the ET and GPP products.
Meteorological datasets include daily temperature, precipitation, and sunshine hours data from the China Meteorological Data Network (http://data.cma.cn/, accessed on 15 May 2022). This network covers meteorological data from 118 stations in Inner Mongolia from 2001 to 2020, as shown in Figure 1a. Using the FAO Penman–Monteith formula, the sunshine hours were used to calculate solar radiation data [37]. These data were interpolated to a spatial resolution of 0.05° × 0.05 using the kriging interpolation method. Vegetation type data were derived from a 1:1,000,000 raster map of vegetation type of Inner Mongolia with a spatial resolution of 0.0083°. In this map, the study area is divided into 9 vegetation types. In this study, the Gobi Desert was excluded because its vegetation was relatively sparse and some areas even had no vegetation cover.
Elevation Data (DEM) with a resolution of 90 m and land use/land cover data (2000, 2010, and 2020) with a resolution of 1 km were drawn from the Resource and Environmental Science Data Platform of the Chinese Academy of Sciences (https://www.resdc.cn/, accessed on 15 May 2022). The land use data mainly included 6 primary land use types (Cropland, Forest, Grassland, Water bodies, Built-up land, and Unused land), and 25 secondary land use types. Considering the characteristics of the wide distribution of grasslands in Inner Mongolia, the land cover types were reclassified into 9 categories, namely cropland, forest, high-coverage grassland, medium-coverage grassland, low-coverage grassland, water bodies, built-up land, sandy land, and unused land. The degree of land use dynamics was also calculated for each league or city during the study period. A single dynamic degree reflecting the change of a specific land use type was assessed in the study area through the study period. The specific calculation formula is available in Wang et al. [38].
2.3. Methods
2.3.1. Ecosystem Water Use Efficiency
WUE (gC m−2 mm−1) is defined as the amount of carbon uptake per unit of water loss [39,40,41], whereas GPP (gC m−2 yr−1) and ET (mm yr−1) are frequently used to express carbon uptake and water loss at the ecosystem scale [17,42,43]:
2.3.2. Trend Analysis
The Theil–Sen median trend analysis is a non-parametric method for estimating time series trends, and it is immune to outliers [44,45]. The Mann–Kendall (M–K) test is a non-parametric method for assessing the significance of time series trends [46,47]. The two methods are often combined to determine the change trends of vegetation in time series data. The Theil–Sen median trend analysis is expressed as Equation (2):
Sen > 0 denotes an increasing trend in X; Conversely, it denotes a decreasing trend.
The Mann–Kendall test is expressed as Equation (3):
where, n is the time series length, and are the data values in the time series i and j (j > i), respectively. The is calculated as Equation (4):
The standard normal test statistic Z is calculated using Equation (5):
in which, a positive or negative Z indicates an increase or decrease. indicates a significant increase (or decrease) in the time series at a confidence level of α = 0.05.
2.3.3. Calculating the Contribution of Interannual Variability (IAV)
The contribution of IAV of a grid cell or vegetation type j to regional WUE (GPP or ET) IAV is defined as [48]:
where, is the WUE anomaly (departure from a long-term trend) of j vegetation types in year t; is the regional WUE anomaly, so that . By this definition, is the average relative anomaly for regional j weighted with the absolute global anomaly .
2.3.4. Multiple Regression Residual Analysis
Residual analysis is the most popular method for investigating the different effects of climate and human activities on vegetation [49,50]. In this study, changes in WUE over the study period were hypothesized to be influenced solely by climate change and human activities. We established multiple regression models between WUE and climatic variables (temperature, precipitation, and solar radiation) for each pixel and evaluated them using F-statistics. WUE during the study period was then predicted using the multiple regression models to represent the influence of only climate change. The difference between the observed WUE (WUEobs) and predicted WUE (WUEpv) was then taken as the response of human activities on WUE, namely residual WUE (WUERV). The equations for calculating these values are as follows:
where, P, T, and R represent precipitation, temperature, and solar radiation, respectively; and a, b, and c are regression coefficients of multiple linear regression, respectively. Based on the standards presented in Table 1, the main driving factors of variations in WUE were identified and the positive and negative effects of climate change and human activity on WUE were estimated.

Table 1.
Standards for identifying the main drivers of WUE change and methods for calculating contribution rates.
2.3.5. Relative Contribution Statistical Method
Multiple regression linear models have been developed between multiple independent and dependent variables to assess the degree to which the various independent variables explained the dependent variable [17,51,52]. This method computes the linear relationship between independent and dependent variables and employs standard regression coefficients to express the sensitivity of the independent variable to the dependent variable [17,52]. The ratio of the absolute value of the regression coefficient of each variable to the sum of the absolute values of all regression coefficients can be used to calculate the relative contribution rate of an independent variable to the dependent variable [51].
3. Results
3.1. Spatial and Temporal Variations in GPP, ET, and WUE
Regarding the interannual variations of GPP, ET, and WUE in Inner Mongolia from 2001 to 2020 (Figure 2), regional GPP showed a significant increasing trend (6.28 gC m−2 yr−1 a−1, p < 0.01), with a mean of 481.51 gC m−2 yr−1. The lowest and highest GPP were observed in 2001 (412.26 gC m−2 yr−1) and 2018 (561.38 gC m−2 yr−1), respectively. ET also showed a significant increasing trend (2.70 mm yr−1 a−1, p < 0.01), with a mean of 327.77 mm yr−1, but its increasing trend was significantly smaller than that of GPP. The lowest and highest ET were observed in 2008 (290.87 mm yr−1) and 2015 (371.18 mm yr−1), respectively. Under the combined action of GPP and ET, regional WUE also showed a significant increasing trend (0.006 gC m−2 yr−1 a−1, p < 0.01), and annual WUE ranged between 1.16 and 1.60 gC m−2 mm−1, with a mean of 1.35 gC m−2 mm−1. Its interannual values fluctuated widely from 2001 to 2020, with the lowest and highest values in 2001 (1.16 gC m−2 mm−1) and 2018 (1.60 gC m−2 mm−1), respectively.
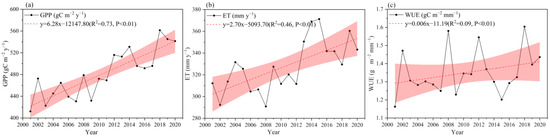
Figure 2.
Interannual variations of (a) GPP, (b) ET, and (c) WUE in Inner Mongolia from 2001 to 2020 (The red shades highlight the 95% confidence interval. The black lines are time series of regional annual GPP, ET, and WUE, while the red dashed lines represent the trend).
As shown in Figure 3, WUE and GPP exhibited similar spatial patterns, the higher values in the northeast and lower values in the southwest. In contrast, ET exhibited a spatial pattern of decreasing from east to west and south to north. From the spatial distribution of their trends (Figure 3), GPP, ET, and WUE all exhibited an increasing trend. Regarding GPP, approximately 96.39% of the pixels showed an increasing trend, of which, areas with significant increase accounted for 48.89% of all pixels, mainly distributed in the eastern regions and Mu Us sandy land in the southwest. Regarding ET, approximately 87.97% of the pixels showed an increasing trend, and areas with significant increases accounted for 39.91% of the total pixels and appeared in the central and eastern parts of the study area. Nevertheless, 12.03% of the area showed a slight decrease, scattered in the northeast and western parts. The WUE statistics show that the increase and decrease trends accounted for 70% and 30%, of which, areas with significant increase and decrease accounted for approximately 22.35% and 2.63% of all pixels. Areas with significant increases were mainly located in the Horqin sandy land in the southeast and the Mu Us sandy land in the southwest, whereas areas with significant and slight decreases were concentrated in the central part of Xilin Gol league and the Da Hinggan Ling Mountains in the northeast.
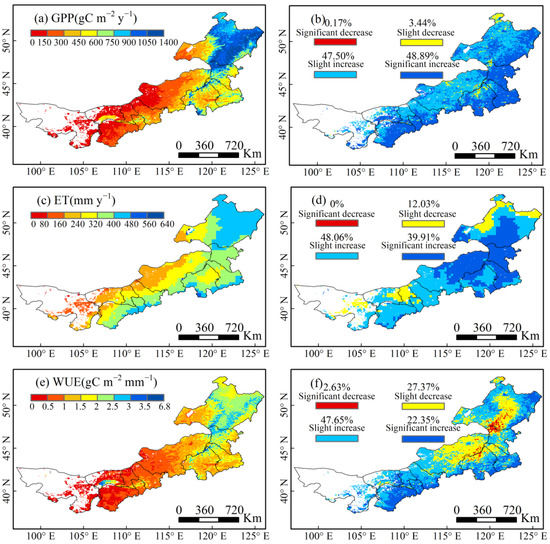
Figure 3.
Spatial differences of annual average (a) GPP, (c) ET, (e) WUE, and (b,d,f) their trends (significance levels of 0.05) in Inner Mongolia from 2001 to 2020.
3.2. Seasonal Characteristics of GPP, ET, and WUE
WUE exhibited a generally consistent spatial pattern across the four seasons, with higher values in the northeast and lower values in the southwest (Figure S1). The seasonal WUE values in Inner Mongolia exhibited the overall characteristics of summer > autumn > winter > spring (Figure 4). Among the four seasons, the highest mean value (1.77 gC m−2 mm−1) was observed in summer (June–August), with minimum and maximum values of 0.02 and 6.89 gC m−2 mm−1, respectively. The mean WUE values in autumn (September–November) and winter (December–February) were 1.36 gC m−2 mm−1 and 0.78 gC m−2 mm−1, respectively. More specifically, 50% of WUE values in autumn were primarily concentrated between 0.89 and 1.71 gC m−2 mm−1, while 50% of WUE values in winter were primarily concentrated between 0.16 and 1.18 gC m−2 mm−1. However, the lowest mean WUE value was observed in spring (March-May) at 0.40 gC m−2 mm−1, with minimum and maximum values of 0 to 2.24 gC m−2 mm−1, respectively. For GPP, the highest mean value was observed in summer, with a value of 353.82 gC m−2 yr−1, the 50% of GPP values in summer were primarily concentrated between 131.39 and 562.15 gC m−2 yr−1. Whereas, the lowest mean GPP was observed in winter (20.09 gC m−2 yr−1), and 50% of GPP values in winter were primarily concentrated between 11.60 and 25.65 gC m−2 yr−1. The seasonal GPP values showed the characteristics of summer > autumn > spring > winter. The mean ET was the highest in summer (176.28 mm yr−1), the 50% of ET values in summer were primarily concentrated between 142.44 and 213.74 mm yr−1, respectively. Followed by spring and autumn, with mean values of 81.89 mm yr−1 and 62.11 mm yr−1, respectively. For spring and autumn, 50% of ET values in spring were primarily concentrated between 61.29 and 105.86 mm yr−1, while 50% of ET values in autumn were primarily concentrated between 50.13 and 73.49 mm yr−1. The lowest mean ET was observed in winter at 20.84 mm yr−1, with minimum and maximum values of 0 and 44.88 mm yr−1, respectively.
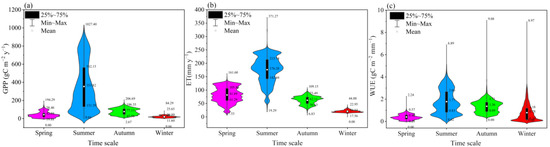
Figure 4.
Mean values of (a) GPP, (b) ET, and (c) WUE in various seasons in Inner Mongolia.
3.3. Contribution of Each Vegetation Type to GPP, ET, and WUE IAV
The primary vegetation types in Inner Mongolia are coniferous forests (6.23%), broadleaf forests (7.75%), meadow steppe (12.77%), typical steppe (23.36%), desert steppe (17.97%), shrubs (6.85%), cropland (13.76%), and sand land vegetation (11.31%). The annual average values of GPP, ET, and WUE for different vegetation types are presented in Figure 5. The relatively highest GPP values were found in broadleaf forests, coniferous forests, and meadow steppe in the study area, with values exceeding 800 gC m−2 yr−1. Among them, broadleaf forests showed the highest value, with a mean of 938.36 gC m−2 yr−1, followed by coniferous forests, meadow steppe, shrubs, cropland, typical steppe, and sand land vegetation. On the contrary, the desert steppe showed the lowest GPP (94.42 gC m−2 yr−1). Regarding ET, coniferous forests showed the highest value at 439.74 mm yr−1, followed by broadleaf forests, meadow steppe, shrubs, cropland, sand land vegetation, and typical steppe, with their average values exceeding 290 mm yr−1, while desert steppe showed the lowest value at 204.26 mm yr−1. Broadleaf forests showed the highest WUE value, with an average of 2.26 gC m−2 mm−1, while desert steppe showed the lowest WUE value at 0.46 gC m−2 mm−1. The mean values of WUE for different vegetation types followed the order: broadleaf forest > coniferous forest > meadow steppe > shrub > cropland > typical steppe > sand land vegetation > desert steppe.
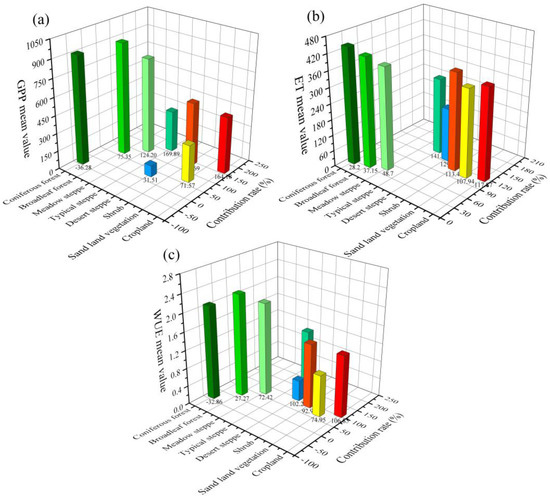
Figure 5.
The mean values of each vegetation type and their contribution to (a) GPP, (b) ET, and (c) WUE IAV in Inner Mongolia from 2001 to 2020.
Figure 5 depicts the contribution of each vegetation type to GPP, ET, and WUE IAV. The contribution of each vegetation type to GPP, ET, and WUE IAV showed some variability. We discovered that typical steppe contributed the most (169.89%) to GPP IAV from 2001 to 2020, followed by cropland ecosystem (164.18%), and they are mostly found in the southeast and western rivers regions. The area of the shrub only accounts for 6.85% of the total area, but they make a great contribution to GPP IAV in arid and semi-arid zones, with a value of 143.69%. The broadleaf forest and sand land vegetation contributed 75.35% and 71.57% to GPP IAV, respectively. The desert steppe ecosystems cover far more area than shrubs and sand land vegetation, but they contributed only 31.51%. Among all vegetation types, only coniferous forest ecosystems contribute negatively to GPP IAV, with a value of −36.28%. The typical steppe contributed the most (141.09%) to ET IAV and was primarily distributed in the western Hulun Buir and Xilin Gol regions. The desert steppe ecosystems were the second largest contribution to ET IAV (129.70%), followed by cropland (117.87%), shrubs (113.44%), and sand land vegetation (107.94%). By contrast, the meadow steppe, broadleaf forest, and coniferous forest ecosystems contributed the least to ET IAV, with a value of 48.70%, 37.15%, and 28.20%, respectively. More importantly, we found that typical steppe accounts for the largest fraction (193.42%) of the WUE IAV over this period, followed by cropland ecosystems contributed 106.85%. The desert steppe, shrubs, sand land vegetation, meadow steppe, and broadleaf forest ecosystems contributed to WUE IAV with 102.25%, 92.99%, 74.95%, 72.42%, and 27.27%, respectively. In contrast, we found that coniferous forest ecosystems account for the lowest fraction of the WUE IAV at −32.86%. In addtion, the WUE exhibits significant fluctuation at each vegetation type, with typical steppe anomalies being the greatest compared to other vegetation types. While desert steppe anomalies are more volatile for ET, coniferous forest anomalies are more prominent for GPP (Figure 6).
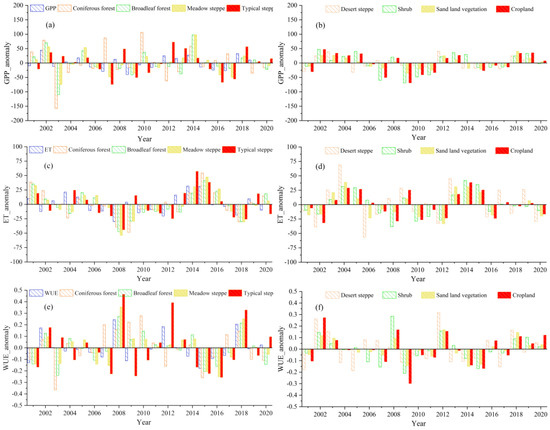
Figure 6.
The anomaly of GPP, ET, and WUE for different vegetation types from 2001 to 2020; (a,b) GPP, (c,d) ET, and (e,f) WUE.
3.4. Contributions and Sensitivity of GPP and ET to WUE
Variations in WUE are mainly attributed to changes in GPP and ET. Figure 7 shows the spatial patterns of the sensitivity coefficients of GPP and ET on WUE variations, with each pixel significant at the 0.05 significance level in F-statistics. A positive (negative) sensitivity coefficient shows that WUE increases (decreases) as GPP (ET) increases. WUE showed a sensitivity coefficient of 0.866 for GPP, with higher sensitivity in the eastern and southwestern regions. The sensitivity of WUE to ET was −0.606, with high sensitivity in the Da Hinggan Ling Mountains and low sensitivity in the western region. As shown in Figure 8c, the change in WUE in Inner Mongolia from 2001 to 2020 is mainly driven by GPP. The contribution of GPP to WUE was 59.36%, accounting for 83.82% of all pixels, widely distributed in most of the central and western parts of Inner Mongolia. The contribution of ET to WUE was 40.64%, accounting for 16.18% of the total pixels, mainly distributed in the Da Hinggan Ling Mountains in the northeast, the northern part of the Horqin sandy land, and the northern part of the Mu Us sandy land (Figure 8a,b). Figure 8 shows the spatial patterns of the relative contributions of GPP and ET to WUE variations, it exhibited opposite spatial pattern characteristics. Areas with a high contribution of GPP (>60%) were widely distributed in the central and western regions, accounting for 49.47% of the total pixels, whereas areas with a low contribution of GPP (<40%) were scattered in the north of the Mu Us sandy land and the south foot of the Da Hinggan Ling Mountains, accounting for 3.06% of the total pixels. Areas with a high contribution of ET (>60%) accounted for 3.06% of the total pixels, while areas with a low contribution of ET (<40%) accounted for 49.47% of the total area.
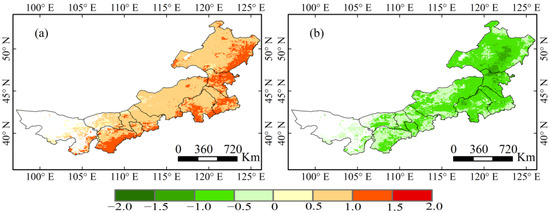
Figure 7.
Spatial distribution of sensitivity coefficients of (a) GPP and (b) ET to WUE in Inner Mongolia.
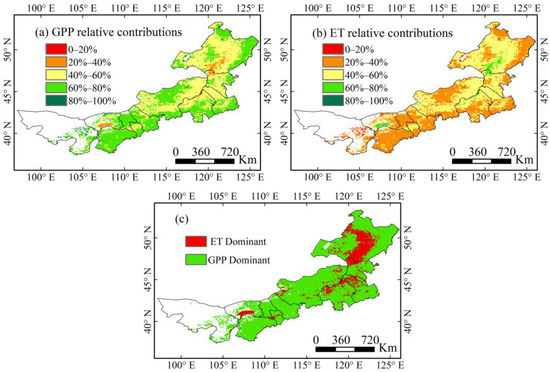
Figure 8.
Spatial pattern of relative contributions of (a) GPP and (b) ET to WUE in Inner Mongolia from 2001 to 2020; (c) Spatial distributions of dominant controlling factors (i.e., GPP or ET).
3.5. Drivers of WUE Variability
Figure 9 shows the negative and positive contributions of human activity and climate change to WUE in Inner Mongolia from 2001 to 2020. The result shows that human activities are the main driving factor of WUE changes in Inner Mongolia from 2001 to 2020, with human activities and climate contributing to 53.52% and 46.46%, respectively. Human activity exhibited positive effects on WUE in approximately 70.34% of the pixels, dispersed in central Xilin Gol, Hohhot, Bugutu, eastern Bayan Nur, eastern Ordos, and eastern and western Hulun Buir. Nevertheless, human activities showed minor negative effects in approximately 29.66% of the pixels, mainly focused on the Da Hinggan Ling Mountains, Horqin sandy land, Otindag sandy land, and western Mu Us sandy land. Among them, areas with a negative contribution of less than 75% (2.45%) were scattered in the south foot of the Da Hinggan Ling Mountains. Areas with positive and negative contributions of climate change to WUE accounted for 68.20% and 31.80% of the total pixels, respectively. Areas with positive contributions are widely spread in the eastern and western foot of the Da Hinggan Ling Mountains, the Horqin sandy land, the Otindag sandy land, and the western regions. Areas with negative contribution were located in central Xilin Gol, northern Chifeng, northern Tongliao, and the Da Hinggan Ling Mountains. In particular, areas with negative contributions exceeding 75% accounted for 2.34% of the entire study area, mainly concentrated in the Da Hinggan Ling Mountains.
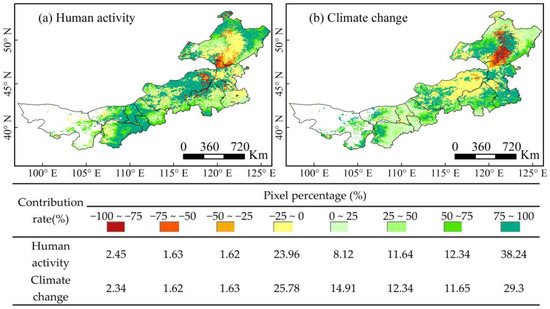
Figure 9.
Spatial distribution of positive and negative contributions of human activity and climate change on variations in WUE from 2001 to 2020.
Figure 10 shows the spatial pattern of sensitivity coefficients between WUE and climate factors in Inner Mongolia from 2001 to 2020. The results show that WUE is more sensitive to precipitation than other climatic variables. The sensitivity coefficient of WUE to precipitation was 0.345 ± 0.325, with high sensitivity in the western region and low sensitivity in the Da Hinggan Ling Mountains. With positive sensitivity coefficient in most areas except northeast regions, with a value of 0.447, accounted for 85.88% of the areas, indicating that WUE increases with increasing precipitation. 14.12% of regions showed a negatively sensitive (−0.276, Figure 10a) between WUE and precipitation, and it is primarily observed in the Da Hinggan Ling Mountains. According to Figure 10b, when precipitation is less than 400 mm, the WUE of Inner Mongolia increases with an increase of precipitation. However, when precipitation exceeds 400 mm, the sensitivity of the WUE to precipitation decreases. The temperature was the second most important climate factor influencing WUE and it mainly exhibited a negative sensitivity, with a value of −0.025 ± 0.217. Spatially, WUE was negatively sensitive to temperature in approximately 52.76% of regions (−0.189, Figure 10c), these negative sensitivity regions existed in the central and eastern parts of Inner Mongolia, indicating that the increase of temperature would decrease WUE. Furthermore, the high negative sensitivity coefficients areas located in the Otindag sandy land. A total of 47.24% of regions showed a positive sensitivity (0.159, Figure 10c) between WUE and temperature, which was mainly distributed in the northeast, southeast, and southwest part of the region. In addition, the sensitivity coefficient is predominantly positive when the temperature > 6 °C (Figure 10d), indicating that temperatures above 6 °C are advantageous for the exchange of water and carbon in vegetation, and it is predominantly negative when the temperature < 6 °C, indicating that temperatures below 6 °C are unfavorable for the exchange of water and carbon. The mostly positive sensitivity of WUE to solar radiation, with a value of 0.019 ± 0.231. More than 53.99% of regions showed a positive sensitivity between WUE and solar radiation (0.194, Figure 10e), which is mainly distributed in the northeast, southeast, and southwest part of the region. Areas with a negative sensitivity between WUE and solar radiation accounted for 46.01% of total pixels (−0.186, Figure 10e), with the majority of these pixels located in the central and eastern parts of Inner Mongolia. The high negative sensitivity coefficient was found in the Otindag sandy land, indicating that WUE decreased as solar radiation increased.
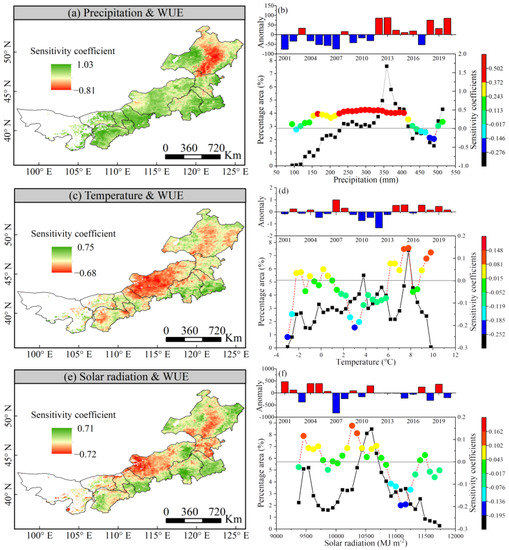
Figure 10.
Sensitivity coefficient and their gradient change between WUE and climate factors in Inner Mongolia from 2001 to 2020. (a,b) Precipitation, (c,d) Temperature, and (e,f) Solar radiation.
The sensitivity coefficients of various vegetation types toward precipitation were ranked from largest to smallest: sand land vegetation, cropland, desert steppe, typical steppe, shrub, meadow steppe, coniferous forest, and broadleaf forest, and all of them were positive except for coniferous forest, indicating that the vegetation WUE increased as precipitation increased. The sensitivity of desert steppe to temperature was highest, at a value of −0.107 ± 0.242. The sensitivity coefficients of broadleaf forest, meadow steppe, typical steppe, and desert steppe are all negative values, while coniferous forest, shrub and sand land vegetation, and cropland are all positive values. In addition, all vegetation types were positively sensitive to solar radiation except for coniferous forests and desert steppe. Of these, the desert steppe, cropland, and shrub ecosystems were more sensitive to solar radiation, with values of −0.134 ± 0.233, 0.116 ± 0.214, and 0.114 ± 0.212, respectively (Table 2).
Table 2.
Sensitivity of WUE to climate change for different vegetation types in Inner Mongolia.
4. Discussion
4.1. Evaluation of GPP, ET, and WUE
Changes in WUE in ecosystems have been explored using various methods at various spatial scales, including field control experiments, eddy covariance, isotope observation techniques, process-based models, and remote sensing products [13,17,53]. In this study, the long-term series datasets of GOSIF GPP and the GLEAM ET products were used. Many studies found that GOSIF GPP products have good performance in monitoring carbon sinks at regional and global scales [34,54]. Meanwhile, numerous studies have confirmed that GLEAM ET is highly applicable to various ecosystems, particularly grassland ecosystems in arid and semi-arid regions [36,55,56,57]. Therefore, the estimation of WUE in Inner Mongolia using GOSIF GPP and GLEAM ET products has certain reliability.
4.2. Variations of WUE
Our analysis showed that the WUE exhibited a decreasing trend from northeast to southwest, which is consistent with the previous research results [15,58]. The WUE of vegetation in Inner Mongolia showed some seasonal variability. Among the four seasons, the highest WUE was observed in summer, followed by autumn and winter, while the lowest WUE was observed in spring (Figure 6), which is inconsistent with the findings of Sun et al. [59], who discovered that WUE is the highest in summer, followed by autumn, spring, and winter. These findings were most likely attributable to the seasonal differences in GPP and ET. Seasonal GPP values followed the order summer > autumn > spring > winter. Seasonal ET values followed the order summer > spring > autumn > winter. As the temperature rises in spring, snow or ice covering the land surface begins to melt, resulting in a significantly higher ET in spring than in autumn and winter [52]. In the meantime, vegetation would only be in the green-up stage in spring, with lower productivity [60]. Therefore, ET would have a significantly stronger effect than GPP, thus leading to the lowest WUE in spring.
The mean values of GPP, ET, and WUE differed across various ecosystems. Our analysis shows that the broadleaf forest and coniferous forest had higher mean values of GPP, ET, and WUE than other vegetation types, but their contributions to GPP, ET, and WUE IAV were generally lower than those of typical steppe. This may be attributed to physiological properties, area proportion, and survival environment condition of vegetation types. The typical steppe contributes the most to GPP, ET, and WUE IAV in arid and semi-arid regions, which indicates that typical steppe ecosystems play an important role in arid and semi-arid ecosystems. The typical steppe in the study area is vast (23.36%), with relatively dense vegetation that allows for greater photosynthesis and efficient water exchange [58,61], which has resulted in the highest contribution to GPP, ET, and WUE IAV. Cropland was the second most important contributor to WUE IAV. The rational use of irrigation and fertilization techniques, as well as the advancement of tillage techniques and crop types, all contribute to a significant increase of greening (GPP), which aids in the improvement of WUE on cropland [62,63]. By contrast, the typical steppe ecosystem is more efficient than the forest at enhancing the use of water by vegetated ecosystems in arid and semi-arid zones.
In addition, WUE variations in Inner Mongolia were found to be mainly controlled by GPP (accounting for 83.82% of all pixels) and spread in the central and western regions; this finding agrees with that of Bai et al. [21] and Xue et al. [61]. However, Yang et al. [64] and Liu et al. [7] noted that GPP dominated WUE variations in humid regions, while ET dominated WUE variations in arid regions. This discrepancy could be attributed to the differences in analysis methods.
4.3. Response Mechanism of WUE to Human Activities and Climate Change
This study found that human activities are the primary drivers of WUE changes in Inner Mongolia, and their positive effects are stronger than their negative effects, which is consistent with previous findings [5,15]. Human activities induce an increase of WUE by increasing vegetation greenness through altered land cover [5]. The Chinese government has been implementing several large-scale ecological restoration projects since 2000, including the Grain for Green Project (since 1999), the Three Norths Shelter Forest Program (since 1978), and Grassland Ecological Protection Subsidy and Reward Policies (since 2010), all with the goal of restoring degraded ecosystem services by increasing vegetation greenness [32,65,66]. Driven by ecological restoration policies, positive changes have occurred in the forms of land cover. Figure 11 shows the Sankey diagram of land use transformations in Inner Mongolia from 2000 to 2020, the most dramatic transfer of land use mainly occurred in high-coverage grassland, medium-coverage grassland, and cropland, followed by forest, low-coverage grassland, and unused land. In particular, high-coverage grassland was largely converted into forest, medium-coverage grassland into high-coverage grassland, and cropland into high-coverage grassland. Furthermore, the transitions from forest to high-coverage grassland, low-coverage grassland to high-coverage grassland, and unused land to medium-coverage and high-coverage grassland were the most extensive. In general, high-coverage grassland and forest areas have increased in Inner Mongolia, and sandy land has decreased. Although the area of low-coverage grassland has slightly expanded, it is still much smaller than the increase of the area of high-coverage grassland and forest (Table S1). Therefore, the positive effects of human activities exceed the negative effects. Nevertheless, human activities have also negatively affected WUE changes in the Da Hinggan Ling Mountains in the northeast, the Horqin sandy land, and the western part of the Mu Us sandy land. The degree of land use dynamics for individual land use types confirmed that urban development and built-up land expansion are relatively serious in Hulun Buir, Xingan, Tongliao, Chifeng, and Xilin Gol (Figure 12 and Figure S2), which has greatly reduced the green area of the land surface, leading to decreases in WUE [67]. Therefore, environmental protection and rational land use planning should be strengthened in these areas.
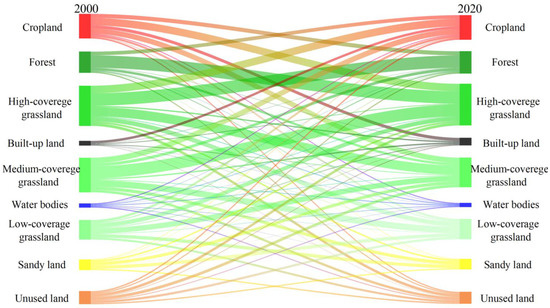
Figure 11.
Sankey maps of land use transformations in Inner Mongolia from 2000 to 2020.
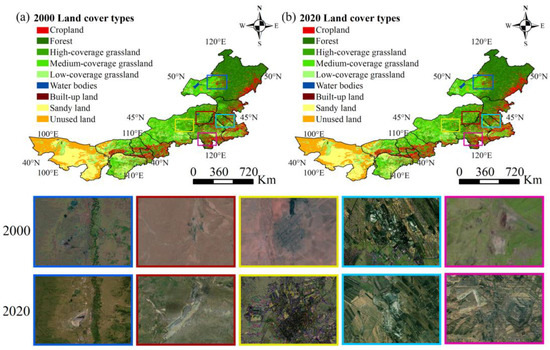
Figure 12.
Land use spatial change maps for each league or city in Inner Mongolia from 2000 to 2020.
The influence of climate factors on WUE is caused by changes in GPP and ET [15,68]. Precipitation was found to be the dominant climate factor regulating WUE variability in Inner Mongolia. The sensitivity between WUE and precipitation was mostly positive, indicating that the increase of precipitation promotes the increase of vegetation WUE, which agrees with the previous findings [21,69]. Located in arid and semi-arid regions, vegetation growth in Inner Mongolia is primarily limited by insufficient water supply, and precipitation is an important source of water for vegetation growth [21]. An increase of precipitation would increase GPP beyond the increase of ET, thus resulting in an increase of WUE [16]. Good consistency was found in the sensitivity of WUE with solar radiation and temperature (Figure 10b,c). Negative sensitivity coefficients were observed in the Xilin Gol and the Da Hinggan Ling Mountains. A decline of WUE in these regions may be attributed to higher temperatures and increased solar radiation, leading to an increase of ET greater than of GPP [59,70]. Furthermore, the decline of WUE in Xilin Gol could be attributed to the negative effects of climate change, while the decline of WUE in the Da Hinggan Ling Mountains could be attributed to the common inhibition effects of human activity and climate change.
5. Conclusions
WUE is a crucial indicator of the relationship between terrestrial carbon and water cycles, as well as an effective variable reflecting the response of productivity to water availability. This study adopted remote sensing data and meteorological data to examine variation characteristics of WUE and its response mechanism to human activity and climate change. The main findings can be summarized as follows:
- (1)
- The interannual change of GPP, ET, and WUE all showed significant increasing trends, with GPP showing a significantly larger increase than ET and WUE. Spatially, GPP, ET, and WUE showed an increasing trend. WUE showed increasing and decreasing trends in approximately 70% (22.35%) and 30% (2.63%) of the study area, respectively. Areas with significant increases were mainly distributed in the Horqin sandy land and the Mu Us sandy land, while areas with significant and slight decreases were concentrated in the central part of the Xilin Gol league and the Da Hinggan Ling Mountains in the northeast.
- (2)
- The seasonal WUE values followed the order summer (1.77 gC m−2 mm−1) > autumn (1.36 gC m−2 mm−1) > winter (0.78 gC m−2 mm−1) > spring (0.40 gC m−2 mm−1). This phenomenon may be related to seasonal differences in GPP and ET.
- (3)
- The mean values of GPP, ET, and WUE were higher in the broadleaf forest, coniferous forest, meadow steppe, shrubs, and cropland than in other vegetation types, whereas desert steppe ecosystems had the lowest. However, we discovered that typical steppe contributed the most to GPP, ET, and WUE IAV. While the coniferous forest contributed the least or negatively to GPP, ET, and WUE IAV. This phenomenon may be associated with the physiological structure, area distribution, and survival condition of vegetation types.
- (4)
- The sensitivity analysis of WUE to GPP and ET revealed that WUE was more sensitive to GPP than ET. The increase of WUE was mainly driven by GPP. Its contribution was 59.36%, accounting for 83.82% of total pixels, which covered most of the central and western regions and the eastern and western parts of Hulun Buir. The contribution of ET was 40.64%, accounting for 16.18% of the total pixels, which were scattered in the Da Hinggan Ling Mountains, the northern part of the Horqin sandy land, and the northern part of the Mu Us Sandy land.
- (5)
- Human activities and climate change were found to be the two main forces driving the variability of WUE, with contributions of 53.52% and 46.48%, respectively. Human activities were the primary cause of WUE changes and their positive effects were significantly stronger than their negative effects. Among climate factors, precipitation was the primary climate factor affecting WUE changes in Inner Mongolia, followed by temperature and solar radiation.
This study sheds light on the distribution characteristics of carbon and hydrology, as well as the response of carbon–water coupling to climate change and human activity in arid and semi-arid regions. It offers guidance on ecological environmental management and water resource utilization in water-limited regions.
Supplementary Materials
The following supporting information can be downloaded at: https://www.mdpi.com/article/10.3390/rs14215422/s1. Figure S1: Spatial pattern of annual average WUE in Inner Mongolia from 2001 to 2020. (a) Spring, (b) Summer, (c) Autumn, and (d) Winter. Figure S2: Degrees of land use dynamics for each league or city in Inner Mongolia from 2000 to 2020. Table S1: Land use transfer matrix in 2000–2020 (km2).
Author Contributions
Conceptualization, Formal analysis, Writing—original draft, L.M.; Methodology, Writing—reviewing & editing, S.T.; Investigation, Validation, Writing—review & editing, S.Y.; Project administration, Funding acquisition, Y.B.; Visualization, Software, X.H.; Resources, Data curation, T.A. All authors have read and agreed to the published version of the manuscript.
Funding
This study was supported by the International (Regional) Cooperation and Exchange Programs of National Natural Science Foundation of China (41961144019), National Natural Science Foundation of China (42061070, and 41861056), Fundamental Research Funds for the Inner Mongolia Normal University (2022JBBJ013), Science and Technology Planning Project of Inner Mongolia Autonomous Region (2021GG0183), and Program for Young Talents of Science and Technology in Universities of Inner Mongolia Autonomous Region (NJYT22030). We appreciate all the data developers and their managers, which provide enough data sources for conducting this work.
Institutional Review Board Statement
Not applicable.
Informed Consent Statement
Not applicable.
Data Availability Statement
Not applicable.
Acknowledgments
The authors would like to thank the Editors and the anonymous reviewers for their crucial comments, which improved the quality of this paper.
Conflicts of Interest
The authors declare no conflict of interest.
References
- Rahman, M.; Islam, M.; Gebrekirstos, A.; Bräuning, A. Disentangling the effects of atmospheric CO2 and climate on intrinsic water-use efficiency in South Asian tropical moist forest trees. Tree Physiol. 2020, 40, 904–916. [Google Scholar] [CrossRef]
- Naser, H.M.; Nagata, O.; Sultana, S.; Hatano, R. Carbon Sequestration and Contribution of CO2, CH4, and N2O Fluxes to Global Warming Potential from Paddy-Fallow Fields on Mineral Soil Beneath Peat in Central Hokkaido, Japan. Agriculture 2019, 10, 6. [Google Scholar] [CrossRef]
- IPCC. Climate Change 2021: The Physical Science Basis. Contribution of Working Group I to the Sixth Assessment Report of the Intergovernmental Panel on Climate Change; Cambridge University Press: Cambridge, UK; New York, NY, USA, 2021. [Google Scholar]
- Guo, F.; Jin, J.; Yong, B.; Wang, Y.; Jiang, H. Responses of water use efficiency to phenology in typical subtropical forest ecosystems—A case study in Zhejiang Province. Sci. China Earth Sci. 2020, 63, 145–156. [Google Scholar] [CrossRef]
- Guo, L.; Shan, N.; Zhang, Y.; Sun, F.; Liu, W.; Shi, Z.; Zhang, Q. Separating the effects of climate change and human activity on water use efficiency over the Beijing-Tianjin Sand Source Region of China. Sci. Total Environ. 2019, 690, 584–595. [Google Scholar] [CrossRef] [PubMed]
- Zhao, J.; Xu, T.; Xiao, J.; Liu, S.; Mao, K.; Song, L.; Yao, Y.; He, X.; Feng, H. Responses of Water Use Efficiency to Drought in Southwest China. Remote Sens. 2020, 12, 199. [Google Scholar] [CrossRef]
- Liu, X.; Feng, X.; Fu, B. Changes in global terrestrial ecosystem water use efficiency are closely related to soil moisture. Sci. Total Environ. 2019, 698, 134165. [Google Scholar] [CrossRef] [PubMed]
- Zhang, Q.; Chen, W. Ecosystem water use efficiency in the three-north region of china based on long-term satellite data. Sustainability 2021, 13, 7977. [Google Scholar] [CrossRef]
- Ma, J.; Zha, T.; Jia, X.; Tian, Y.; Bourque, C.P.-A.; Liu, P.; Bai, Y.; Wu, Y.; Ren, C.; Yu, H.; et al. Energy and water vapor exchange over a young plantation in northern China. Agric. For. Meteorol. 2018, 263, 334–345. [Google Scholar] [CrossRef]
- Chen, S.; Huang, Y.; Wang, G. Detecting drought-induced GPP spatiotemporal variabilities with sun-induced chlorophyll fluorescence during the 2009/2010 droughts in China. Ecol. Indic. 2020, 121, 107092. [Google Scholar]
- Pei, Y.; Dong, J.; Zhang, Y.; Yang, J.; Zhang, Y.; Jiang, C.; Xiao, X. Performance of four state-of-the-art GPP products (VPM, MOD17, BESS, and PML) for grasslands in drought years. Ecol. Inform. 2020, 56, 101052. [Google Scholar] [CrossRef]
- Ma, N.; Zhang, Y. Increasing Tibetan Plateau terrestrial evapotranspiration primarily driven by precipitation. Agric. For. Meteorol. 2022, 317, 108887. [Google Scholar] [CrossRef]
- Li, Y.; Shi, H.; Zhou, L.; Eamus, D.; Huete, A.; Li, L.; Cleverly, J.; Hu, Z.; Harahap, M.; Yu, Q.; et al. Disentangling climate and LAI effects on seasonal variability in water use efficiency across terrestrial ecosystems in China. J. Geophys. Res. Biogeosci. 2018, 123, 2429–2443. [Google Scholar] [CrossRef]
- Ma, J.; Jia, X.; Zha, T.; Bourque, C.P.-A.; Tian, Y.; Bai, Y.; Liu, P.; Yang, R.; Li, C.; Li, C.; et al. Ecosystem water use efficiency in a young plantation in Northern China and its relationship to drought. Agric. For. Meteorol. 2019, 275, 1–10. [Google Scholar] [CrossRef]
- Li, G.; Chen, W.; Li, R.; Zhang, X.; Liu, J. Assessing the spatiotemporal dynamics of ecosystem water use efficiency across China and the response to natural and human activities. Ecol. Indic. 2021, 126, 107680. [Google Scholar] [CrossRef]
- Liu, Y.; Xiao, J.; Ju, W.; Zhou, Y.; Wang, S.; Wu, X. Water use efficiency of China′s terrestrial ecosystems and responses to drought. Sci. Rep. 2015, 5, 13799. [Google Scholar] [CrossRef] [PubMed]
- Sun, S.; Song, Z.; Wu, X.; Wang, T.; Wu, Y.; Du, W.; Che, T.; Huang, C.; Zhang, X.; Ping, B.; et al. Spatio-temporal variations in water use efficiency and its drivers in China over the last three decades. Ecol. Indic. 2018, 94, 292–304. [Google Scholar] [CrossRef]
- El Masri, B.; Schwalm, C.; Huntzinger, D.N.; Mao, J.; Shi, X.; Peng, C.; Fisher, J.B.; Jain, A.K.; Tian, H.; Poulter, B.; et al. Carbon and water use efficiencies: A comparative analysis of ten terrestrial ecosystem models under changing climate. Sci. Rep. 2019, 9, 14680. [Google Scholar] [CrossRef]
- Zhao, J.; Feng, H.; Xu, T.; Xiao, J.; Guerrieri, R.; Liu, S.; Wu, X.; He, X.; He, X. Physiological and environmental control on ecosystem water use efficiency in response to drought across the northern hemisphere. Sci. Total Environ. 2021, 758, 143599. [Google Scholar] [CrossRef]
- Du, X.; Zhao, X.; Zhou, T.; Jiang, B.; Xu, P.; Wu, D.; Tang, B. Effects of Climate Factors and Human Activities on the Ecosystem Water Use Efficiency throughout Northern China. Remote Sens. 2019, 11, 2766. [Google Scholar] [CrossRef]
- Bai, Y.; Zha, T.; Bourque, C.P.-A.; Jia, X.; Ma, J.; Liu, P.; Yang, R.; Li, C.; Du, T.; Wu, Y. Variation in ecosystem water use efficiency along a southwest-to-northeast aridity gradient in China. Ecol. Indic. 2020, 110, 105932. [Google Scholar] [CrossRef]
- Xu, Q. Spatiotemporal variation of water use efficiency and its influencing factors in arid and semi-arid areas of China. Geogr. Sci. Res. 2021, 10, 126–136. [Google Scholar]
- Shang, C.; Wu, T.; Huang, G.; Wu, J. Weak sustainability is not sustainable: Socioeconomic and environmental assessment of Inner Mongolia for the past three decades. Resour. Conserv. Recycl. 2019, 141, 243–252. [Google Scholar] [CrossRef]
- Ma, Q.; Wu, J.; He, C.; Fang, X. The speed, scale, and environmental and economic impacts of surface coal mining in the Mongolian Plateau. Resour. Conserv. Recycl. 2021, 173, 105730. [Google Scholar] [CrossRef]
- Guo, D.; Song, X.; Hu, R.; Cai, S.; Hao, Y. Grassland type-dependent spatiotemporal characteristics of productivity in Inner Mongolia and its response to climate factors. Sci. Total Environ. 2021, 775, 145644. [Google Scholar] [CrossRef]
- Gao, T.; Yang, X.; Jin, Y.; Ma, H.; Li, J.; Yu, H.; Yu, Q.; Zheng, X.; Xu, B. Spatio-Temporal Variation in Vegetation Biomass and Its Relationships with Climate Factors in the Xilingol Grasslands, Northern China. PLoS ONE 2013, 8, e83824. [Google Scholar] [CrossRef] [PubMed]
- Su, R.; Yu, T.; Dayananda, B.; Bu, R.; Su, J.; Fan, Q. Impact of climate change on primary production of Inner Mongolian grasslands. Glob. Ecol. Conserv. 2020, 22, e00928. [Google Scholar] [CrossRef]
- Quan, Q.; Liang, W.; Yan, D.; Lei, J. Influences of joint action of natural and social factors on atmospheric process of hydrological cycle in Inner Mongolia, China. Urban Clim. 2022, 41, 101043. [Google Scholar]
- Li, S.; Verburg, P.H.; Lv, S.; Wu, J.; Li, X. Spatial analysis of the driving factors of grassland degradation under conditions of climate change and intensive use in Inner Mongolia, China. Reg. Environ. Chang. 2012, 12, 461–474. [Google Scholar] [CrossRef]
- Jin, Y.; Yang, X.; Qiu, J.; Li, J.; Gao, T.; Wu, Q.; Zhao, F.; Ma, H.; Yu, H.; Xu, B. Remote sensing-based biomass estimation and its spatio-temporal variations in temperate grassland, Northern China. Remote Sens. 2014, 6, 1496–1513. [Google Scholar]
- Dai, G.; Ulgiati, S.; Zhang, Y.; Yu, B.; Kang, M.; Jin, Y.; Dong, X. The false promises of coal exploitation: How mining affects herdsmen well-being in the grassland ecosystems of Inner Mongolia. Energy Policy 2014, 67, 146–153. [Google Scholar] [CrossRef]
- Zhang, Q.; Buyantuev, A.; Fang, X.; Han, P.; Li, A.; Li, F.Y.; Liang, C.; Liu, Q.; Ma, Q.; Niu, J.; et al. Ecology and sustainability of the Inner Mongolian Grassland: Looking back and moving forward. Landsc. Ecol. 2020, 35, 2413–2432. [Google Scholar] [CrossRef]
- Wang, S.; Li, R.; Wu, Y.; Zhao, S. Vegetation dynamics and their response to hydrothermal conditions in Inner Mongolia, China. Glob. Ecol. Conserv. 2022, 34, e02034. [Google Scholar] [CrossRef]
- Li, X.; Xiao, J. Mapping photosynthesis solely from solar-induced chlorophyll fluorescence: A global, fine-resolution dataset of gross primary production derived from OCO2. Remote Sens. 2019, 11, 2563. [Google Scholar] [CrossRef]
- Miralles, D.G.; Holmes, T.; De, J.; Gash, J.H.; Meesters, A.; Dolman, A.J. Global land-surface evaporation estimated from satellite-based observations. Hydrol. Earth Syst. Sci. Discuss. 2011, 7, 453–469. [Google Scholar] [CrossRef]
- Miralles, D.G.; Jiménez, C.; Jung, M.; Michel, D.; Fernández-Prieto, D. The wacmos-et project-part 2: Evaluation of global terrestrial evaporation data sets. Hydrol. Earth Syst. Sci. 2016, 20, 823–842. [Google Scholar] [CrossRef]
- ElNesr, M.N.; Alazba, A.A. Simple statistical equivalents of the Penman-Monteith formula’s parameters in the absence of non-basic climatic factors. Arab. J. Geosci. 2010, 5, 757–767. [Google Scholar] [CrossRef]
- Wang, Q.; Guan, Q.; Lin, J.; Luo, H.; Tan, Z.; Ma, Y. Simulating land use/land cover change in an arid region with the coupling models. Ecol. Indic. 2021, 122, 107231. [Google Scholar] [CrossRef]
- Yang, B.; Pallardy, S.G.; Meyers, T.P.; Gu, L.; Hanson, P.J.; Wullschleger, S.; Heuer, M.; Hosman, K.P.; Riggs, J.S.; Sluss, D.W. Environmental controls on water use efficiency during severe drought in an Ozark Forest in Missouri, USA. Glob. Chang. Biol. 2010, 16, 2252–2271. [Google Scholar] [CrossRef]
- Tang, X.; Ma, M.; Ding, Z.; Xu, X.; Yao, L.; Huang, X.; Gu, Q.; Song, L. Remotely monitoring ecosystem water use efficiency of grassland and cropland in China′s arid and semi-arid regions with MODIS data. Remote Sens. 2017, 9, 616. [Google Scholar] [CrossRef]
- Yuan, F.; Liu, J.; Zuo, Y.; Guo, Z.; Xu, X. Rising vegetation activity dominates growing water use efficiency in the Asian permafrost region from 1900 to 2100. Sci. Total Environ. 2020, 736, 139587. [Google Scholar] [CrossRef]
- Xu, H.; Zhang, Z.; Xiao, J.; Chen, J.; Zhu, M.; Cao, W.; Chen, Z. Environmental and canopy stomatal control on ecosystem water use efficiency in a riparian poplar plantation. Agric. For. Meteorol. 2020, 287, 107953. [Google Scholar] [CrossRef]
- Nie, C.; Huang, Y.; Zhang, S.; Yang, Y.; Zhou, S.; Lin, C.; Wang, G. Effects of soil water content on forest ecosystem water use efficiency through changes in transpiration/evapotranspiration ratio. Agric. For. Meteorol. 2021, 308, 108605. [Google Scholar] [CrossRef]
- Sen, P.K. Estimates of the Regression Coefficient Based on Kendall’s Tau. J. Am. Stat. Assoc. 1968, 63, 1379–1389. [Google Scholar] [CrossRef]
- Theil, H. A rank-invariant method of linear and polynomial regression analysis. Indag. Math. 1950, 12, 173. [Google Scholar]
- Kendall, M.G. Rank correlation methods. Griffin 1948, 59, 575–577. [Google Scholar] [CrossRef]
- Mann, H.B. Nonparametric tests against trend. Econom. J. Econom. Soc. 1945, 13, 245–259. [Google Scholar] [CrossRef]
- Ahlström, A.; Raupach, M.R.; Schurgers, G.; Smith, B.; Arneth, A.; Jung, M.; Reichstein, M.; Canadell, J.G.; Friedlingstein, P.; Jain, A.K.; et al. The dominant role of semi-arid ecosystems in the trend and variability of the land CO2 sink. Science 2015, 348, 895–899. [Google Scholar] [CrossRef]
- Wang, N.; Du, Y.; Liang, F.; Wang, H.; Yi, J. The spatiotemporal response of China′s vegetation greenness to human socio-economic activities. J. Environ. Manag. 2022, 305, 114304. [Google Scholar] [CrossRef]
- Zhou, Z.; Jin, J.; Yong, B.; Yu, L. Quantifying the influences of climate change and human activities on the grassland in the Southwest Transboundary Basin, China. J. Environ. Manag. 2022, 319, 115612. [Google Scholar] [CrossRef]
- Fu, J.; Gong, Y.; Zheng, W.; Zou, J.; Zhang, M.; Zhang, Z.; Qin, J.; Liu, J.; Quan, B. Spatial-temporal variations of terrestrial evapotranspiration across China from 2000 to 2019. Sci. Total Environ. 2022, 825, 153951. [Google Scholar] [CrossRef]
- Sun, S.; Song, Z.; Chen, X.; Wang, T.; Zhang, Y.; Zhang, D.; Zhang, H.; Hao, Q.; Chen, B. Multimodel-based analyses of evapotranspiration and its controls in China over the last three decades. Ecohydrology 2020, 13, e2195. [Google Scholar] [CrossRef]
- Huang, L.; He, B.; Han, L.; Liu, J.; Wang, H.; Chen, Z. A global examination of the response of ecosystem water-use efficiency to drought based on MODIS data. Sci. Total Environ. 2017, 601, 1097–1107. [Google Scholar] [CrossRef] [PubMed]
- Qiu, R.; Han, G.; Ma, X.; Xu, H.; Shi, T.; Zhang, M. A Comparison of OCO-2 SIF, MODIS GPP, and GOSIF Data from Gross Primary Production (GPP) Estimation and Seasonal Cycles in North America. Remote Sens. 2020, 12, 258. [Google Scholar] [CrossRef]
- Yang, X.; Yong, B.; Ren, L.; Zhang, Y.; Long, D. Multi-scale validation of GLEAM evapotranspiration products over China via ChinaFLUX ET measurements. Int. J. Remote Sens. 2017, 38, 5688–5709. [Google Scholar] [CrossRef]
- Bai, P.; Liu, X. Intercomparison and evaluation of three global high-resolution evapotranspiration products across China. J. Hydrol. 2018, 566, 743–755. [Google Scholar] [CrossRef]
- Li, S.; Wang, G.; Sun, S.; Hagan, D.F.T.; Chen, T.; Dolman, H.; Liu, Y. Long-term changes in evapotranspiration over China and attribution to climatic drivers during 1980–2010. J. Hydrol. 2021, 595, 126037. [Google Scholar] [CrossRef]
- Kim, D.; Baik, J.; Umair, M.; Choi, M. Water use efficiency in terrestrial ecosystem over East Asia: Effects of climate regimes and land cover types. Sci. Total Environ. 2021, 773, 145519. [Google Scholar] [CrossRef]
- Sun, H.; Bai, Y.; Lu, M.; Wang, J.; Tuo, Y.; Yan, D.; Zhang, W. Drivers of the water use efficiency changes in China during 1982-2015. Sci. Total Environ. 2021, 799, 149145. [Google Scholar] [CrossRef]
- Bao, G.; Chen, J.; Chopping, M.; Bao, Y.; Bayarsaikhan, S.; Dorjsuren, A.; Tuya, A.; Jirigala, B.; Qin, Z. Dynamics of net primary productivity on the Mongolian Plateau: Joint regulations of phenology and drought. Int. J. Appl. Earth Obs. Geoinf. 2019, 81, 85–97. [Google Scholar] [CrossRef]
- Xue, Y.; Liang, H.; Zhang, B.; He, C. Vegetation restoration dominated the variation of water use efficiency in China. J. Hydrol. 2022, 612, 128257. [Google Scholar] [CrossRef]
- Ambika, A.K.; Mishra, V. Substantial decline in atmospheric aridity due to irrigation in India. Environ. Res. Lett. 2020, 15, 124060. [Google Scholar] [CrossRef]
- Zou, J.; Ding, J.; Welp, M.; Huang, S.; Liu, B. Using MODIS data to analyse the ecosystem water use efficiency spatial-temporal variations across Central Asia from 2000 to 2014. Environ. Res. 2020, 182, 108985. [Google Scholar] [CrossRef] [PubMed]
- Yang, Y.; Guan, H.; Batelaan, O.; McVicar, T.R.; Long, D.; Piao, S.; Liang, W.; Liu, B.; Jin, Z.; Simmons, C.T. Contrasting responses of water use efficiency to drought across global terrestrial ecosystems. Sci. Rep. 2016, 6, 23284. [Google Scholar] [CrossRef] [PubMed]
- Feng, X.; Fu, B.; Piao, S.; Wang, S.; Ciais, P.; Zeng, Z.; Lü, Y.; Zeng, Y.; Li, Y.; Jiang, X.; et al. Revegetation in China’s Loess Plateau is approaching sustainable water resource limits. Nat. Clim. Chang. 2016, 6, 1019–1022. [Google Scholar] [CrossRef]
- Liu, Y.; Xiao, J.; Ju, W.; Xu, K.; Zhou, Y.; Zhao, Y. Recent trends in vegetation greenness in China significantly altered annual evapotranspiration and water yield. Environ. Res. Lett. 2016, 11, 094010. [Google Scholar] [CrossRef]
- Ouyang, X.; Wang, J.; Chen, X.; Zhao, X.; Ye, H.; Watson, A.E.; Wang, S. Applying a projection pursuit model for evaluation of ecological quality in Jiangxi Province, China. Ecol. Indic. 2021, 133, 108414. [Google Scholar] [CrossRef]
- Yang, L.; Feng, Q.; Wen, X.; Barzegar, R.; Adamowski, J.F.; Zhu, M.; Yin, Z. Contributions of climate, elevated atmospheric CO2 concentration, and land surface changes to variation in water use efficiency in Northwest China. Catena 2022, 213, 106220. [Google Scholar] [CrossRef]
- Xu, H.; Wang, X.; Zhao, C.; Zhang, X. Responses of ecosystem water use efficiency to meteorological drought under different biomes and drought magnitudes in northern China. Agric. For. Meteorol. 2019, 278, 107660. [Google Scholar] [CrossRef]
- Liu, Z.; Liu, Y.; Li, Y. Anthropogenic contributions dominate trends of vegetation cover change over the farming-pastoral ecotone of northern China. Ecol. Indic. 2018, 95, 370–378. [Google Scholar] [CrossRef]


Publisher’s Note: MDPI stays neutral with regard to jurisdictional claims in published maps and institutional affiliations. |
© 2022 by the authors. Licensee MDPI, Basel, Switzerland. This article is an open access article distributed under the terms and conditions of the Creative Commons Attribution (CC BY) license (https://creativecommons.org/licenses/by/4.0/).