Article

GPS-Derived Slant Water Vapor for Cloud Monitoring in Singapore

1
School of Electrical and Electronic Engineering, Nanyang Technological University, Singapore 639798, Singapore
2
Energy Research Institute@NTU, Singapore 637553, Singapore
*
Author to whom correspondence should be addressed.
Remote Sens. 2022, 14(21), 5459; https://doi.org/10.3390/rs14215459
Submission received: 27 September 2022 / Revised: 20 October 2022 / Accepted: 26 October 2022 / Published: 30 October 2022
(This article belongs to the Section Atmospheric Remote Sensing)

Abstract

:
This paper presents a GPS-derived slant water vapor technique for cloud monitoring in Singapore. The normalized slant wet delay ( S W D ) and slant water vapor ( S W V ) are introduced. The suitability of the normalized S W V over S W V for cloud monitoring is demonstrated, as it is not very sensitive to the satellite elevation angle. For better illustration and representation of the spatial distribution of the normalized S W V , the skyplot is discretized into different cells based on the azimuth and elevation angles to produce the spatial plot. The spatial plots are analyzed for cloud monitoring and compared alongside the sky images. The results show that the spatial plots of normalized S W V are generally consistent with the cloud formation observed in the sky images, hence demonstrating their usefulness for cloud monitoring. The probability distribution of the normalized S W V associated with cloudy and clear sky conditions is also analyzed, which shows that the mean values of normalized S W V associated with the former are higher. Finally, the time series of the normalized S W V is explored in relation to the solar irradiance. It is shown that the time series and spatial plots of normalized S W V are also consistent with the ratio of clear sky to measured irradiance.

1. Introduction

Cloud monitoring has attracted much interest over the years due to its various applications ranging from weather prediction to solar irradiance forecast [1,2]. Several researchers have conducted cloud monitoring using different methodologies. Among them, Ground-based Polarization Light Detection and Ranging (LIDAR) technique has been used to monitor the cloud properties [3]. The ground-based infrared (IR) radiometry has also been used for the detection of clouds in the troposphere based on the IR brightness temperature (IRBT) contrast [4]. In recent years, satellite-based image data [5], available from various sources, such as HIMAWARI [6], METOP [7], NOAA [8], MODIS [9,10,11], Landsat [9,12,13], Sentinel [13], etc., have been exploited for cloud monitoring and detection, with various on-board satellite instruments over different spectral bands. The ground-based whole sky imagers have also drawn ample attention from researchers for their various applications, including cloud monitoring and detection [14,15,16,17,18,19,20]. A Wide-Angle High-Resolution Sky Imaging System (WAHRSIS) has been developed to capture the hemispherical sky image in a single frame using a fish-eye lens [21]. Whole sky imagers provide a better spatial resolution for the localized and short-period analysis of the clouds. Various cloud segmentation and detection methods are proposed to analyze the different colors of the ground-based sky images [16,17,18,19,20,22]. While the existing methods perform well generally, there are a few drawbacks and limitations. Ground-based LIDAR and radiometry as well as satellite-based imagery generally suffer from lack of sufficient spatial and temporal resolutions [21,22]. The downward-oriented nature of the satellite images also may not capture the low-level cloud effectively [15]. Furthermore, satellite-based imaging methods are rather cost-inefficient, requiring costly satellite launches and instruments. On the other hand, the whole sky imager has better spatial and temporal resolutions, but its viewing angle may not be sufficient to fully capture the cloud formation near to the horizon.
The Global Navigational Satellite System (GNSS) was introduced in [23] for meteorological applications and could serve as a potential panacea to complement the aforementioned methods for cloud monitoring. GNSS provides an improved spatial and temporal resolution with a wide coverage area, which is a key factor in cloud monitoring for precise weather prediction [24]. GNSS also operates efficiently in all weather conditions, which is an advantage of using this technology over other existing methods for cloud monitoring. While microwave radiometers can be used for the retrieval of integrated cloud liquid and precipitable water vapor ( P W V ) [25], similar parameters could also be derived from the tropospheric delay in the GNSS signal, which are essential for meteorological studies. In [26,27], various components of the Global Positioning System (GPS) tropospheric delay, such as dry air, water vapor, and hydrometeors are analyzed. To date, the GPS has mostly been used for rainfall forecasting using P W V and atmospheric gradient in meteorological studies [28,29,30]. As cloud formation is the result of water vapor condensation, the amount of water vapor suspended in air are highly correlated to the liquid water content in cloud [31]. In fact, it has been shown in [31] that the integrated liquid water content ( I L W C ) has an approximate power function relation with the P W V in tropical regions. Hence, the GPS-derived P W V or the slant path water vapor can be exploited for cloud monitoring. In [32], the P W V derived from GPS data is utilized for cloud monitoring in Singapore. However, the P W V only represents the water vapor content along the zenith direction and does not include the water vapor content along individual satellite paths. Hence, the P W V is limited in its spatial information. To include individual satellite paths, we considered another GPS parameter, the residual for cloud monitoring in [33]. The residuals have also previously been shown to possess good correlation with rainfall events [34]. While the residual showed some promising results in cloud monitoring, it still does not provide the complete slant path water vapor content. This paper presents a new methodology of cloud monitoring using GPS-derived slant path water vapor, which will be corroborated with the hemispherical image captured by a whole sky imager developed in our own lab. The contributions of the paper are briefly summarized as follows:
  • A new methodology for cloud monitoring based on GPS-derived slant path water vapor is proposed. In particular, the normalized slant wet delay ( S W D ) and slant water vapor ( S W V ) are introduced, which are analyzed with respect to cloud formation. To the best of our knowledge, GPS-derived slant path water vapor has not been exploited before for cloud monitoring.
  • Using the normalized S W D or S W V , this work demonstrates its usefulness and potential in cloud monitoring. The normalized S W V is shown to be generally consistent with the cloud formation observed from whole sky imager spatially and temporally.
  • The normalized S W V values are quantified by obtaining the probability distributions associated with cloudy and clear sky conditions. It is shown that the mean values of the normalized S W V associated with cloudy conditions are higher than those of clear sky conditions.
  • As the cloud formation is closely related to the solar irradiance, the relations of the normalized S W V with respect to the solar irradiance is also ascertained. It is shown that the time series of normalized S W V is consistent with the temporal variation in solar irradiance.

2. Normalized Slant Wet Delay (SWD) and Slant Water Vapor (SWV)

The slant total delay ( S T D ) between a GPS satellite and a receiver on the ground can be expressed as:
S T D = S H D + S W D
where S H D and S W D are the slant hydrostatic delay and slant wet delay, respectively. The hydrostatic delay is generally due to the dry gases and particles in the atmosphere, while the wet delay is due to the water vapor content. As water vapor content in the atmosphere is generally associated with cloud formation, we shall focus on the slant wet delay ( S W D ) throughout this work. The S W D in (1) can be expanded into various components as follows [35,36,37,38]:
S W D ( e , ϕ ) = M F w ( e ) · Z W D + cot ( e ) ( G n cos ( ϕ ) + G e sin ( ϕ ) ) + ϵ
where Z W D is the zenith wet delay; M F w is the mapping function for the zenith wet delay; G n and G e are the delay gradient parameters in the north/south and east/west directions, respectively; ϵ is the postfit phase residual; e and ϕ are the satellite elevation and azimuth angles, respectively. Note that while the delay gradient parameters consist of dry and wet components, the wet component is the main contributor at around 90% [39,40]. Hence, the S W D due to horizontal gradients of the troposphere could be mainly related to changes in water vapor.
Equation (2) represents the path delay due to the water vapor content between the receiver and each satellite distributed over the space above the receiver. Hence, it can be used for the spatial and temporal monitoring of clouds. However, as the S W D is greatly influenced by the mapping function M F w , its direct usage for cloud monitoring is inhibited by different path delays arising from different satellite elevation angles. For instance, a satellite with a lower elevation angle near the horizon would inherently possess a larger path delay and obscure any change in delay due to spatial inhomogeneities. To mitigate such effects due to different elevation angles, the S W D needs to be normalized with the mapping function M F w . Hereby, we shall introduce the term normalized S W D , denoted and defined as:
S W D n o r m = S W D / M F w ( e ) = Z W D + cot ( e ) [ G n cos ( ϕ ) + G e sin ( ϕ ) ] + ϵ / M F w ( e ) .
The normalized S W D is made up of the Z W D plus the gradient terms and residuals. The inclusion of gradient terms and residuals in (3) contributes towards the change in delay due to spatial (horizontal) inhomogeneity, which in this case is largely due to water vapor content. Note that the Z W D alone could not provide sufficient spatial information on the water vapor content as it only contains a delay in the zenith direction. It is worth pointing out that in the absence of horizontal inhomogeneity, i.e., G n , G e , and ϵ are zero, the normalized S W D reduces to Z W D . In fact, the normalized S W D of (3) is equivalent tothe term “equivalent Z W D ” introduced in [41].
For the analysis of water vapor content within the atmosphere, the zenith wet delay, Z W D , is often converted into precipitable water vapor, P W V , which is the amount of water in a vertical column of a unit cross-sectional area (in mm). In the case of our proposed normalized S W D , it is converted into normalized slant waver vapor, S W V , via a dimensionless conversion factor P I as follows:
S W V n o r m = P I · S W D n o r m ,
which is denoted here as S W V n o r m . For the conversion factor P I , we shall adopt our proposed model [42]:
P I = 1 · sgn ( L a ) · 1.7 × 10 5 L a h f a c 0.0001 cos 2 π D O Y 28 365.25 + 0.165 1.7 × 10 5 L a 1.65 + f .
where L a is the latitude in degrees, D O Y is the day-of-year, h f a c is 1.48 for stations from the northern hemisphere and 1.25 for stations from southern hemisphere, and f = 2.38 × 10 6 H , with H being the station height. The factor f can be ignored for H < 1000 m. Henceforth, the normalized S W V will be exploited for cloud monitoring.

3. Normalized SWV for Cloud Monitoring

3.1. Data and Methodology

The GPS data used in this work were obtained from the International GNSS Service (IGS) station located at Nanyang Technological University, Singapore (station ID: NTUS), with coordinates 1.34 ° N, 103.67 ° E in Receiver Independent Exchange Format (RINEX). The photo of the IGS station is shown in Figure 1. The data considered in this work are from the months of April and May year 2016, where the sky images are also available for comparison and validation purposes. The RINEX data were processed with the GipsyX-1.5 software, and all relevant parameters of Z W D , G n , G e , and ϵ along with visible satellites′ e and ϕ , were extracted. The data processing was performed with the following specifications: (1) second-order ionospheric correction was implemented; (2) the elevation cut-off angle was set to 7 degrees; (3) ocean-loading coefficients of NTUS station were incorporated to improve the accuracy of the processed data; and (4) IGS final clock and orbit products were used in the processing of the atmospheric parameters. The residual ϵ is treated using the method in [43,44]. A correction map is generated where the mean value of residual in each bin is taken over a time period, excluding the outliers. Here, we chose the bin size of 10° by 10°. This correction map will include systematic effects or noise sources which always occur at a given elevation and azimuth, such as phase multipath and phase center variation errors. The processed residual was then obtained by subtracting the mean within each bin from the raw values to eliminate the aforementioned systematic effects. Utilizing the extracted parameters, the S W D can be computed via (2) with the appropriate mapping function, M F w . In this work, we chose the Neil mapping function [45]. Thereafter, the normalized S W V is computed via (3)–(5). The time resolution of the extracted parameters Z W D , G n , G e , and ϵ are 5 min. Hence, the normalized S W V was also obtained every 5 min.
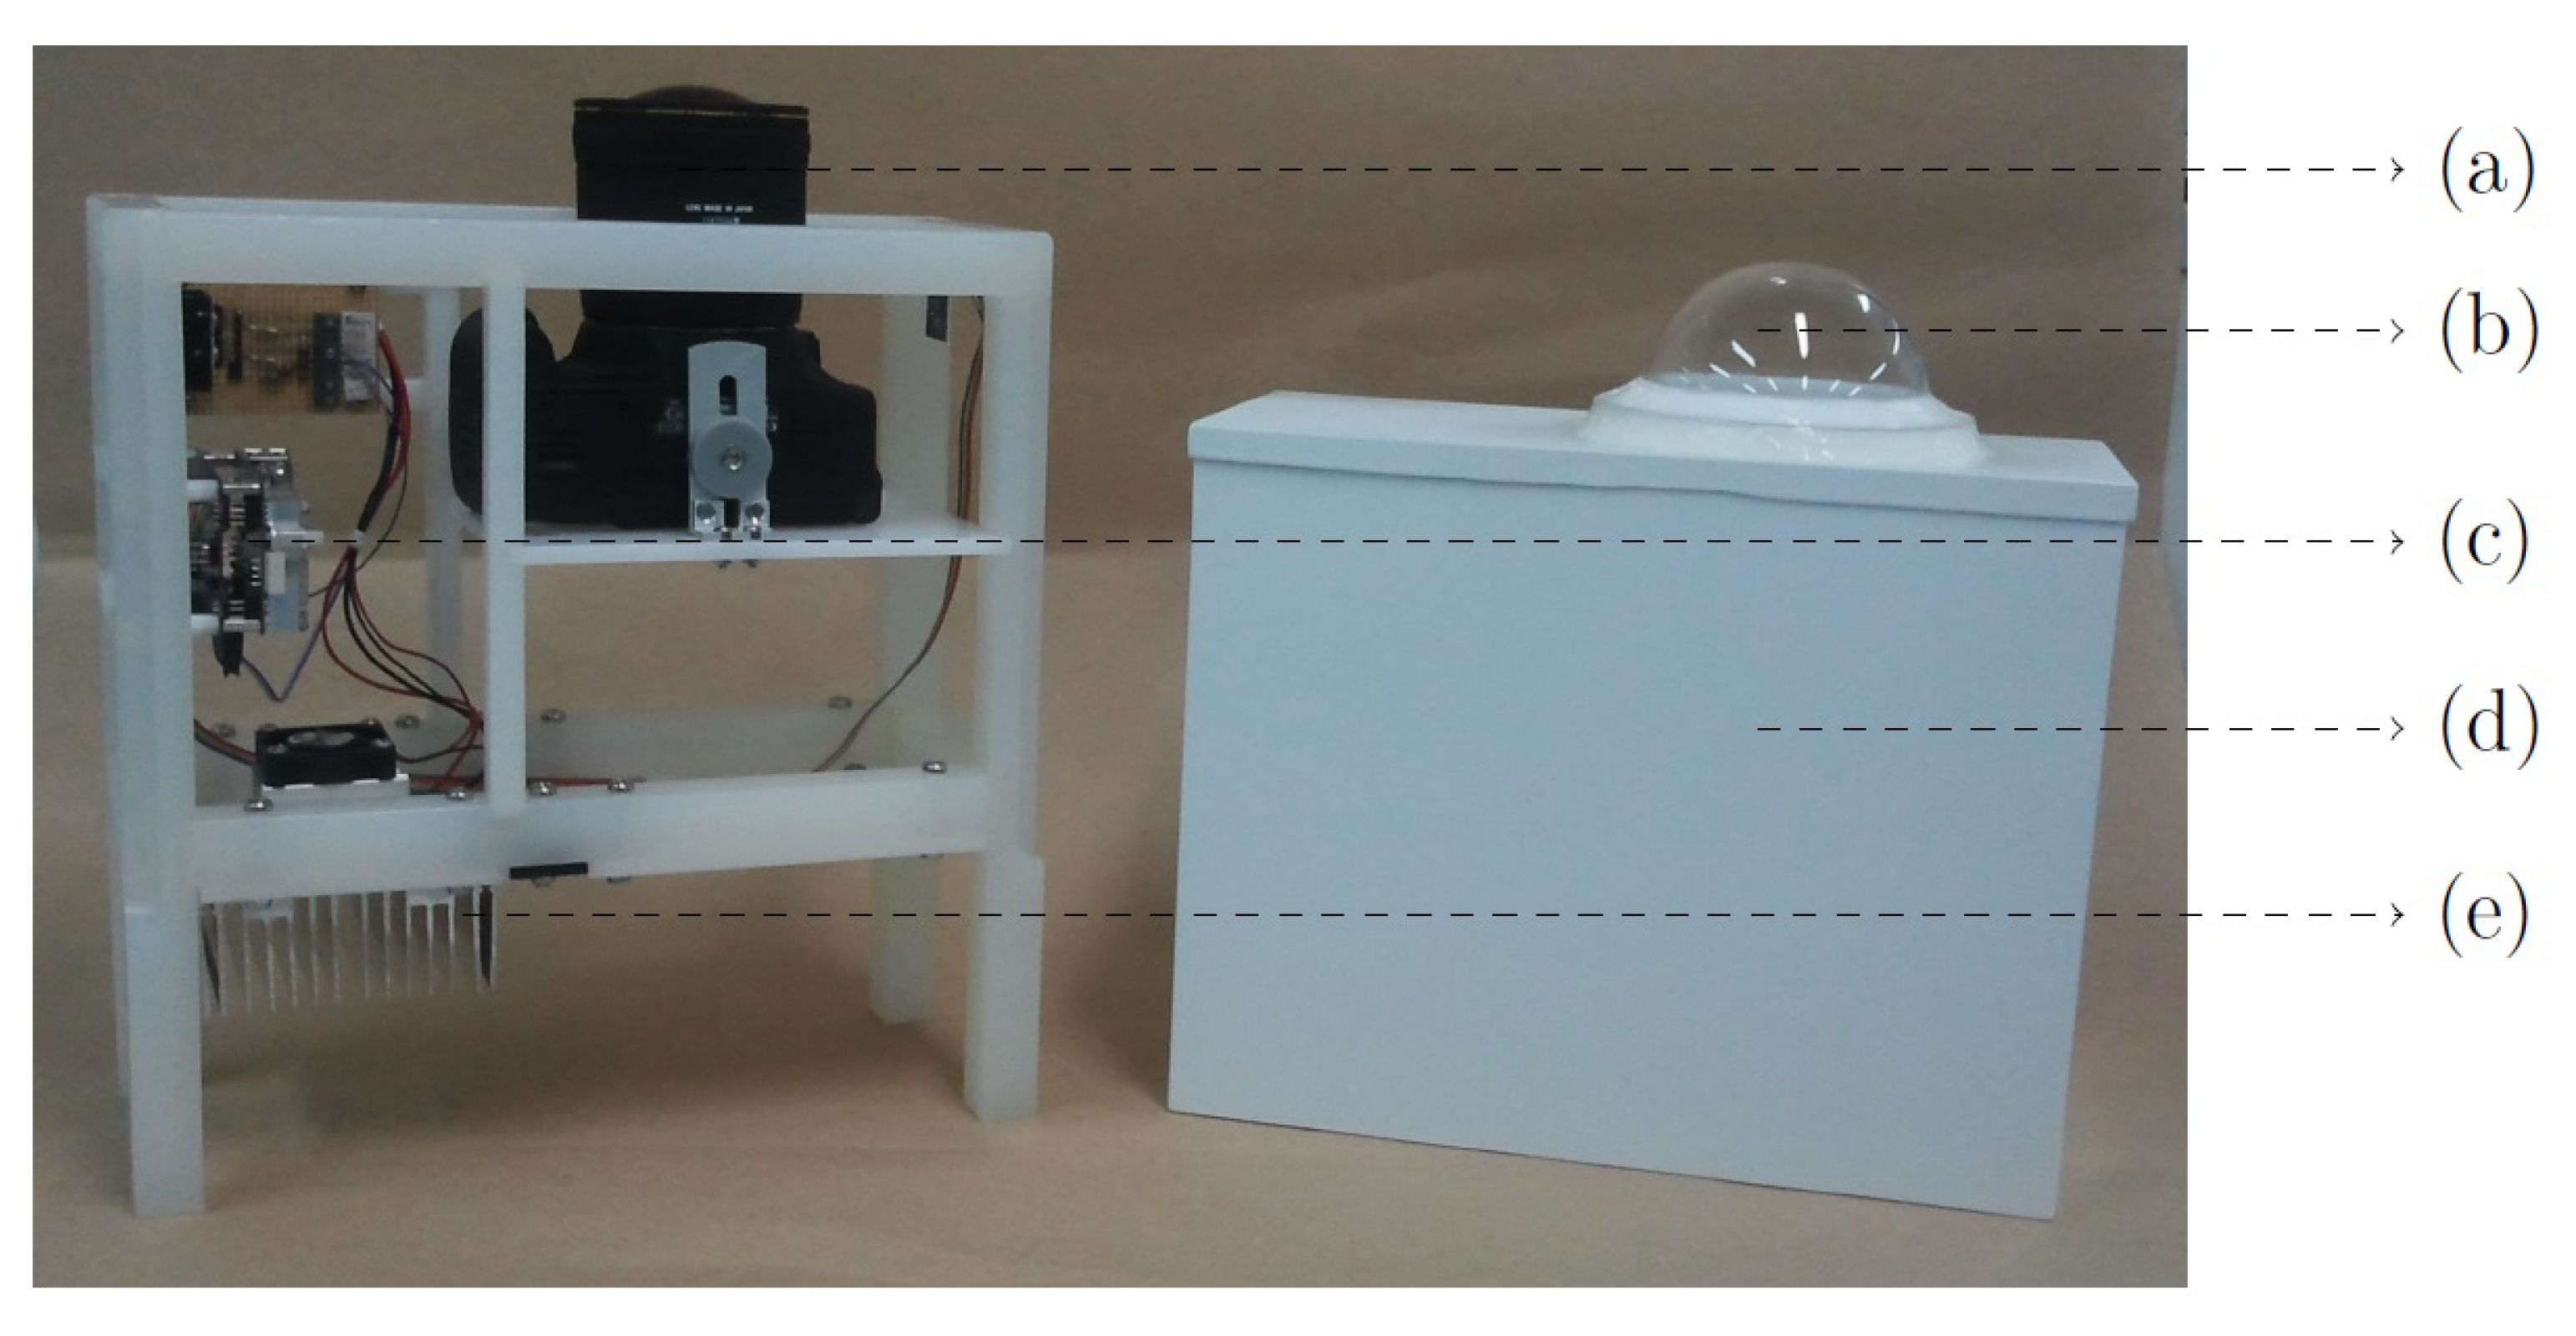
As previously mentioned, in conjunction with the GPS data, we also utilized a ground-based whole sky imager for comparison and validation. The whole sky imager used here is our developed low-cost sky imager known as the Wide-Angled High-Resolution Sky Imaging System (WAHRSIS) [21], also located at Nanyang Technological University, Singapore. The photo of the WAHRSIS’s design is shown in Figure 2, which includes (a) a DSLR camera, (b) a dome, (c) an ODROID board, (d) the casing, and (e) a thermoelectric cooler with fans. The sky images were recorded at the same time resolution as the normalized S W V , i.e., every 5 min. The sky image data involved in this work were captured in the months of April and May in 2016 during the day.

3.2. Comparison between S W V and Normalized S W V

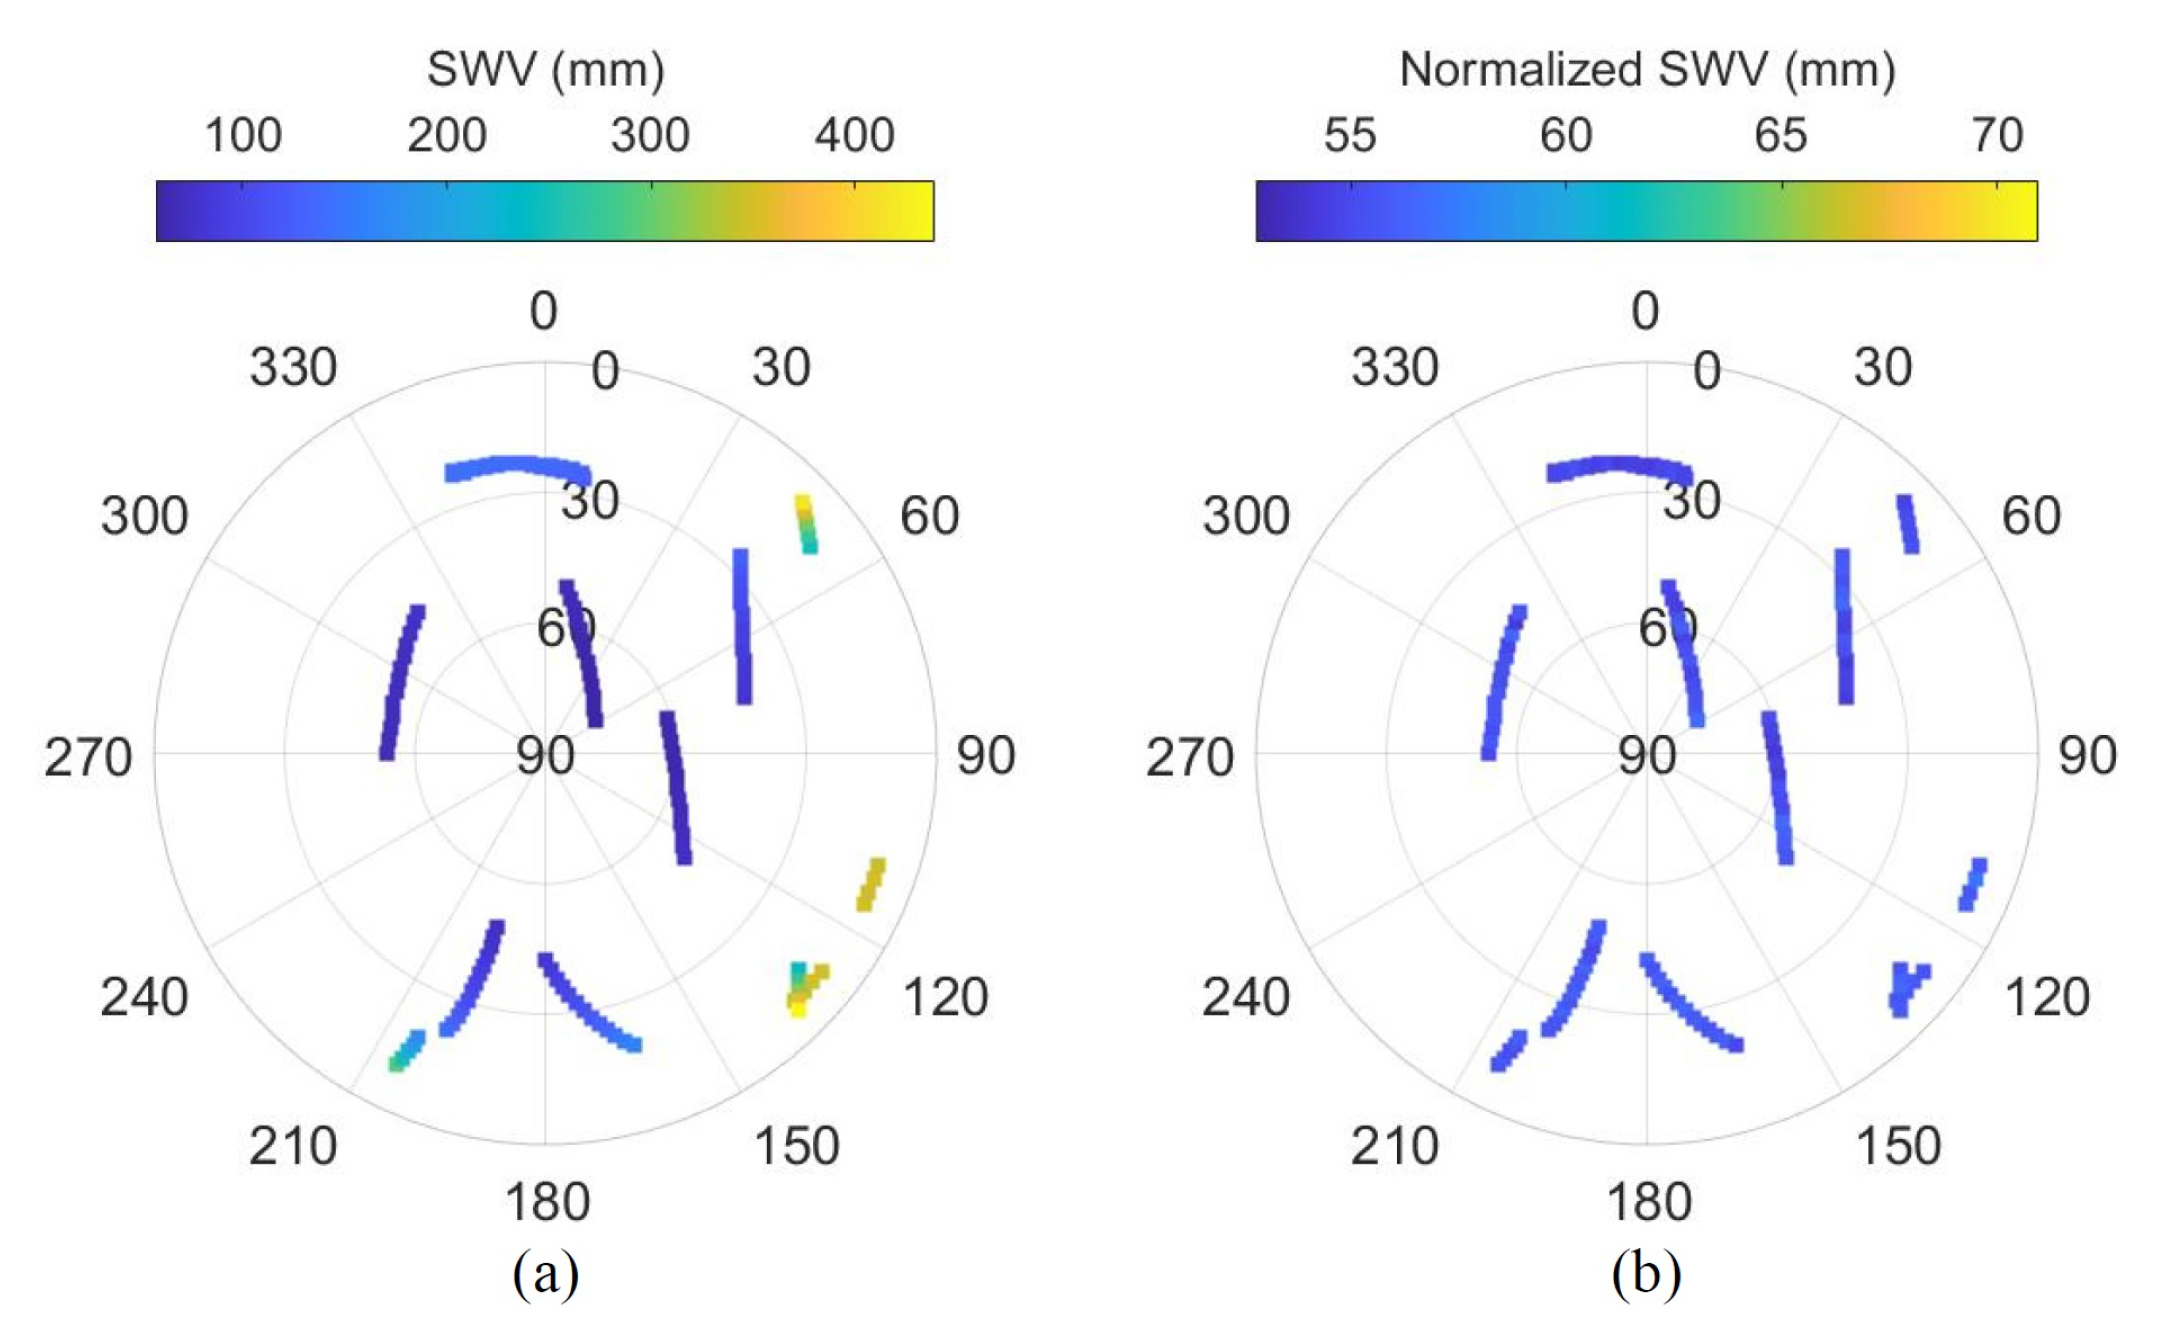
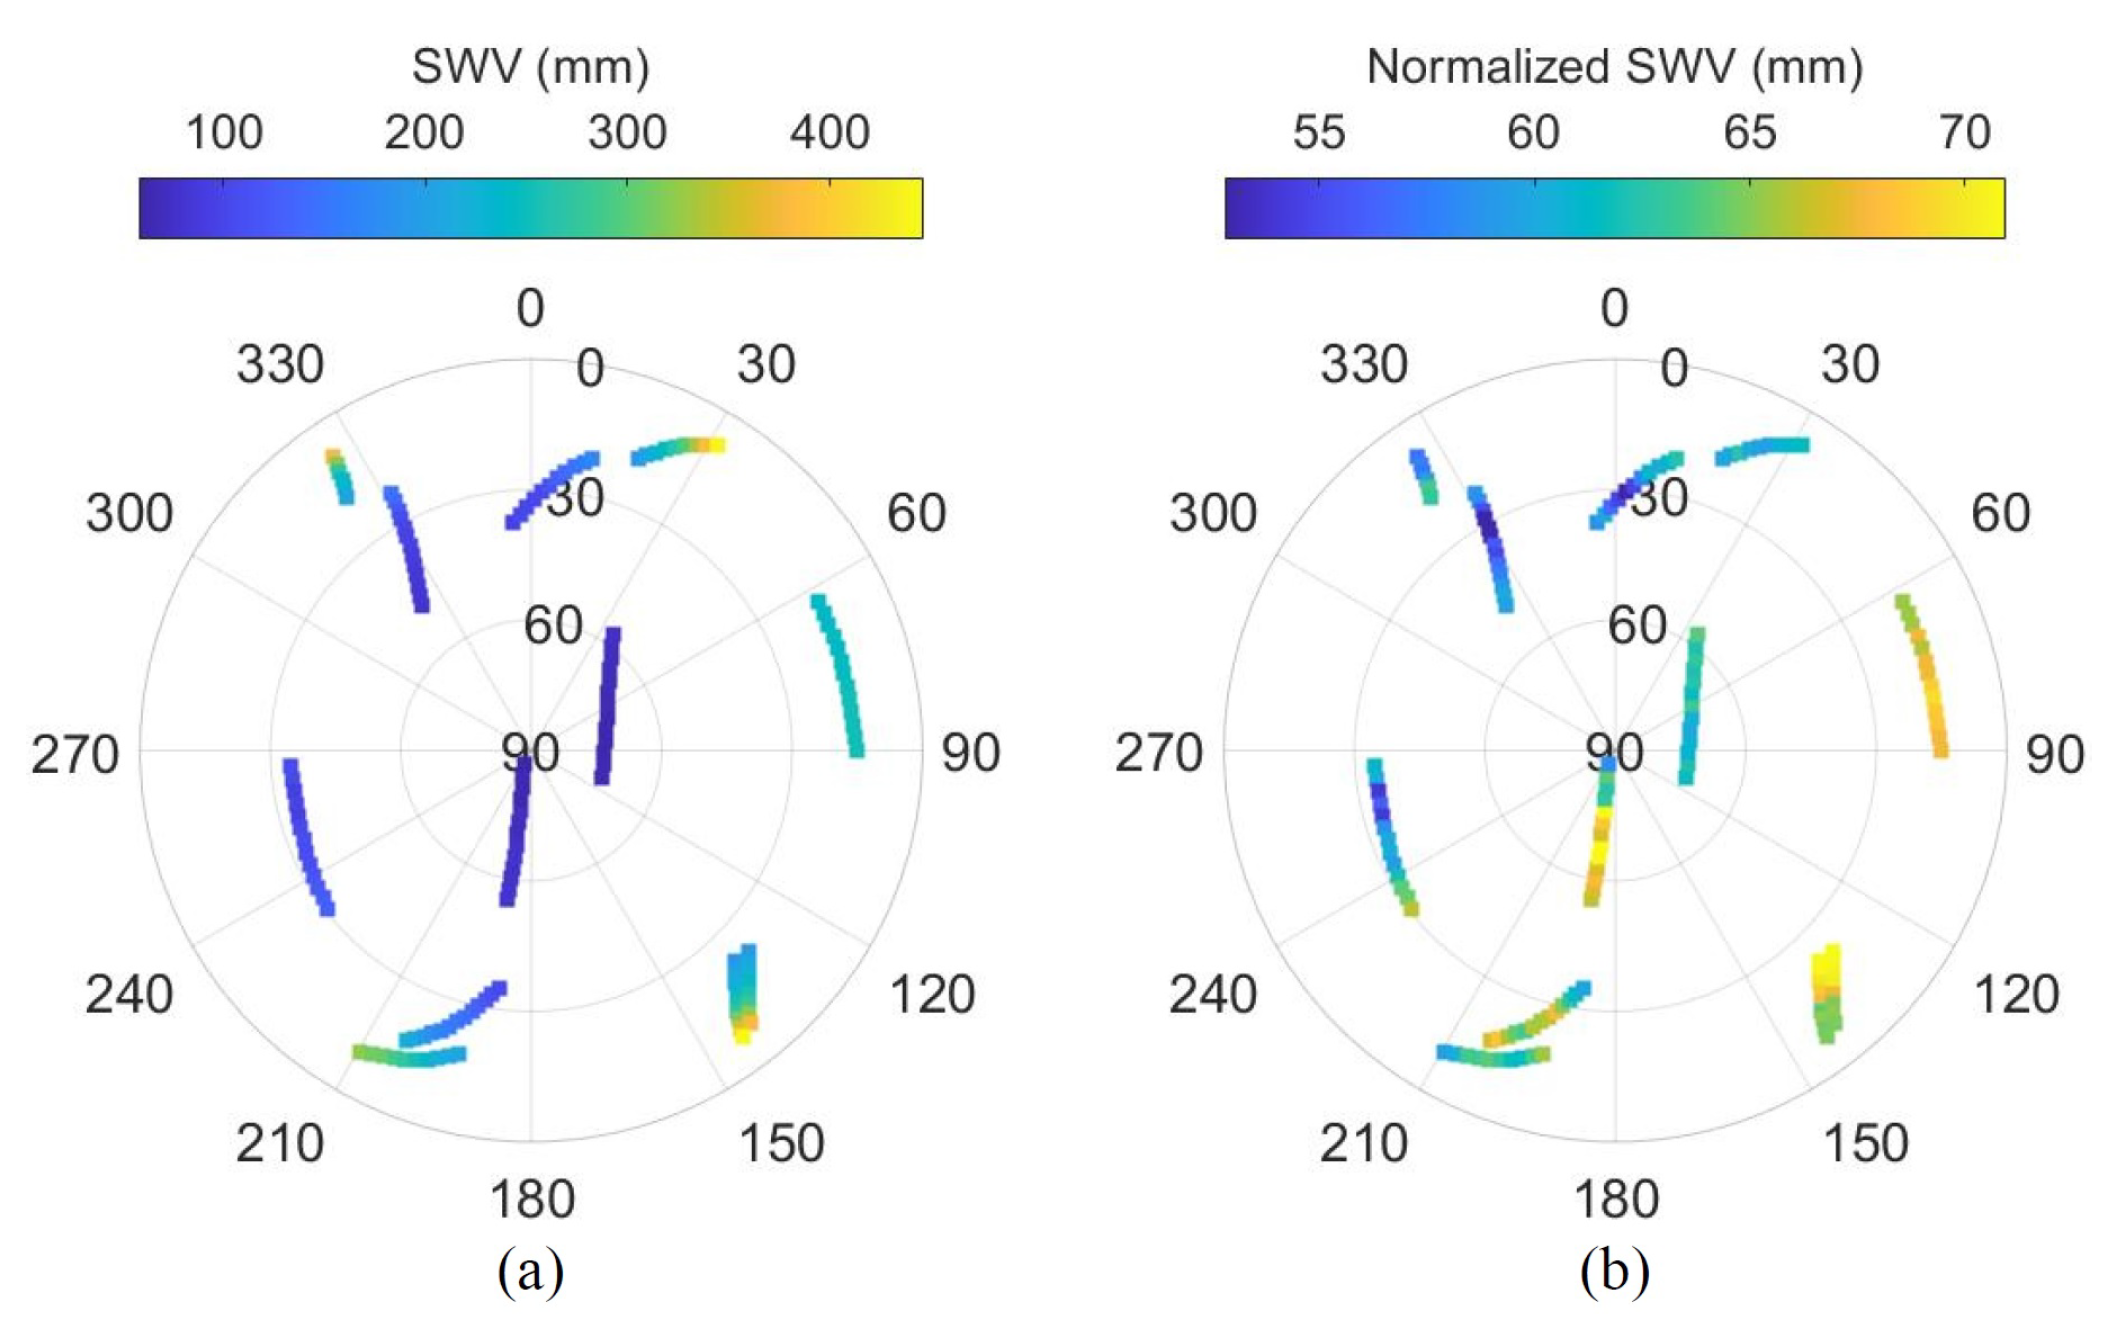
We first demonstrate the limitations of using S W V for cloud monitoring and why the proposed normalized S W V is used instead. In particular, we compare the values of S W V and normalized S W V on a skyplot during a period of relatively clear sky. To that end, Figure 3 shows the skyplots of (a) S W V and (b) normalized S W V on 21 April 2016, 09:00 to 10:00 local time. To be shown later in figure in Section 3.3, the relatively clear sky condition can be ascertained from the sky images. This period of relatively clear sky is chosen such that the S W V and normalized S W V values are unaffected by the clouds or water vapor. In the skyplots, the azimuthal angle is represented along the circumferential and clockwise direction, with 0 (or 360 ), 90 , 180 , and 270 corresponding to the north, east, south, and west directions, respectively. On the other hand, the elevation angle is represented along the radial direction, with 0 and 90 corresponding to the horizon and zenith, respectively. The skyplot shall provide the spatial distribution of the S W V or normalized S W V of different visible GPS satellites within a specific period of time. In this case, a 1 h period from 09:00 to 10:00 local time was chosen, and several satellite tracks are visible along with the corresponding values of S W V and normalized S W V . From Figure 3a, even on a period of relatively clear sky, one can see that the S W V values inherently increase as the elevation angle decreases (from zenith towards horizon). Near the horizon, the S W V could reach as high as 400 mm due to longer delay path. Thus, the S W V before normalization with the mapping function would be unsuitable for cloud monitoring. On the other hand, Figure 3b shows that the normalized S W V are generally low throughout the whole skyplot and are unaffected by the elevation angle. This is consistent with the relatively clear sky period, whereby the water vapor content is low without significant cloud formation. For another case, Figure 4 shows the skyplots of (a) S W V and (b) normalized S W V on 20 April 2016, 14:00 to 15:00 local time. We can see from Figure 4a that the skyplot of S W V always shows an inherently higher value towards lower elevation angle, and thus, any increase in S W V due to the presence of cloud could not be indicated. On the other hand, after the normalization in Figure 4b, one can see that there is an increase in normalized S W V towards the south and east directions, suggesting that there could be a presence of cloud in those directions. Henceforth, the skyplots of normalized S W V shall be validated with the sky images in various cases for cloud monitoring.
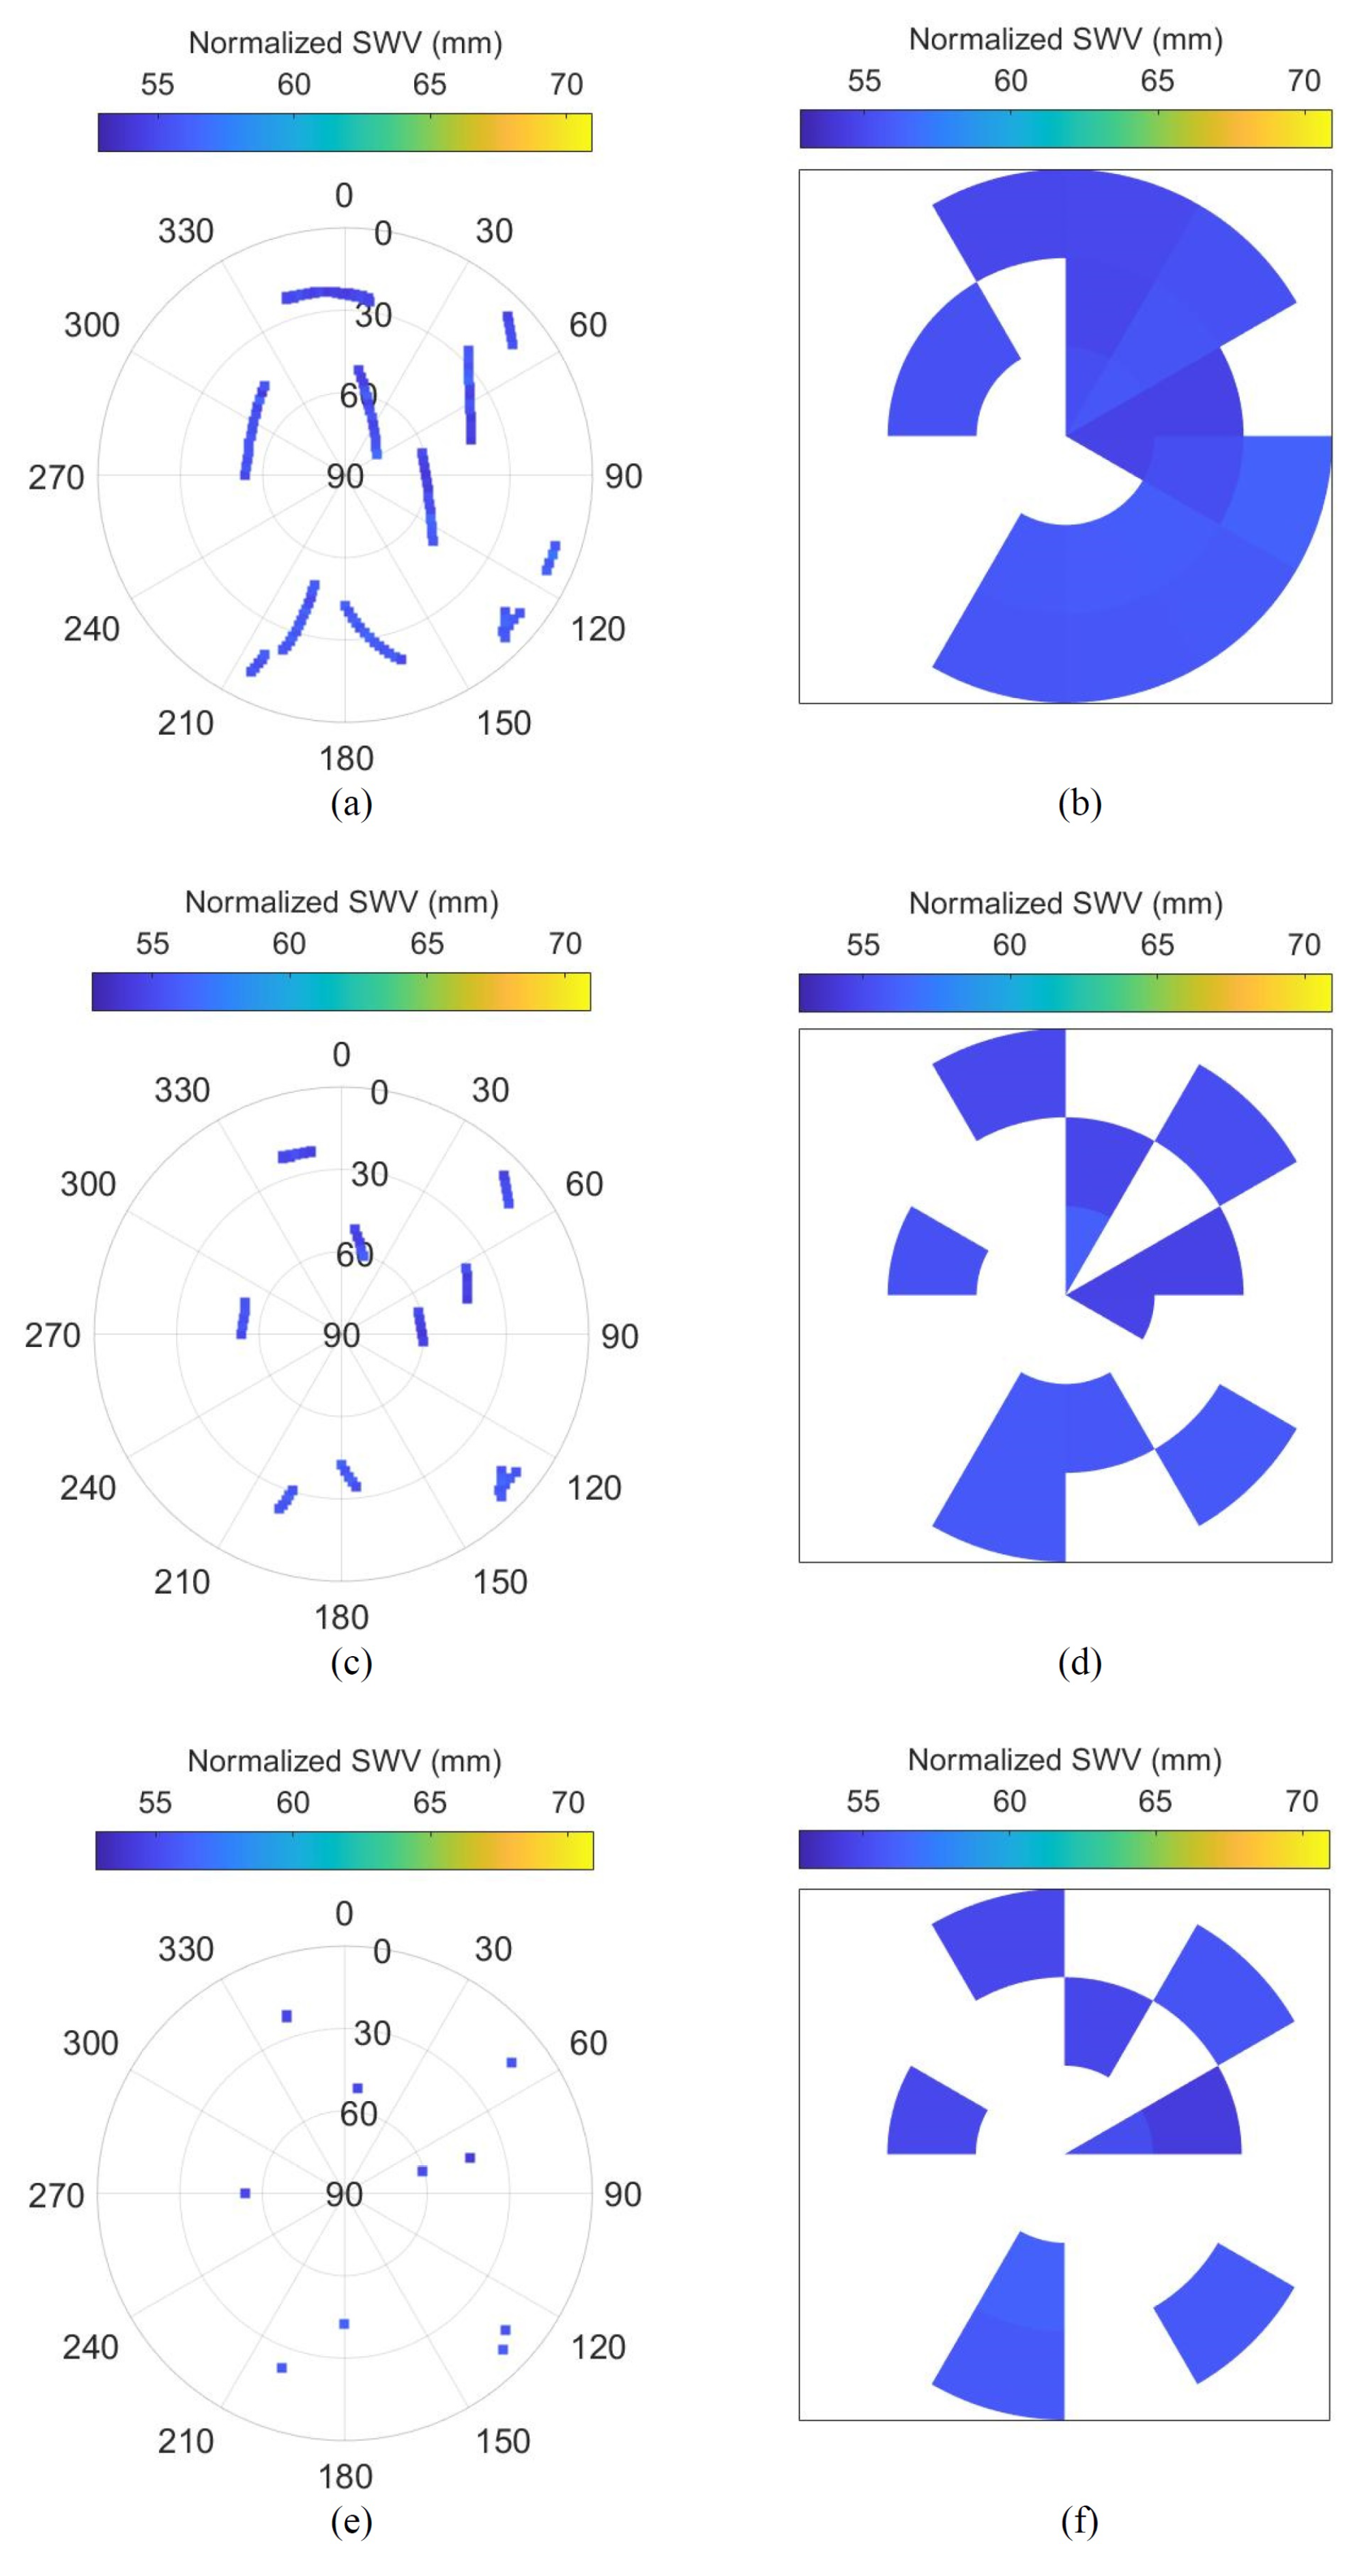
For a better illustration and representation of the spatial distribution of the normalized S W V , we first sectorize its values according to different sections or regions within the skyplot. To that end, the skyplot is discretized into different cells based on the azimuth and elevation angles to produce a spatial plot. If a satellite falls within a cell, the whole cell would assume the normalized S W V value of the satellite. Hence, a smaller spatial step in each cell would result in finer spatial detail but less coverage, and vice versa. Considering the trade-off between spatial detail and coverage, uniform cells are chosen with spatial steps of 30 in both azimuth and elevation directions. Temporally, different durations of the normalized S W V represented on the skyplot are then considered. The normalized S W V of satellites with positions within the same cell are averaged over the duration. Figure 5 left shows the skyplots of normalized S W V on 21 April 2016, 09:00 local time over different durations: (a) 1 h, (c) 20 min, (e) 5 min. The right shows the spatial plots over the corresponding durations. These spatial plots are based on the sectorization with aforementioned uniform cells of 30 in both the azimuth and elevation directions. For Figure 5a, the skyplot is the same as in Figure 3b, on the same day and time over 1 h. On the other hand, the 5 min duration in Figure 5e is the same as the time resolution of the normalized S W V output, with single sample for each satellite position. One can see that for the 1 h duration, the spatial coverage is the best overall as the satellites have traversed across more regions within the skyplot. On the other hand, the 5 min duration has the best temporal relevance, as each sample corresponds to the normalized S W V at that particular time. For a compromise between spatial coverage and temporal relevance, we choose the duration of 20 min shown in Figure 5c,d. For subsequent analysis and cloud monitoring, the spatial plots are over the duration of 20 min.

3.3. Analysis of Normalized S W V Spatial Plots and Sky Images

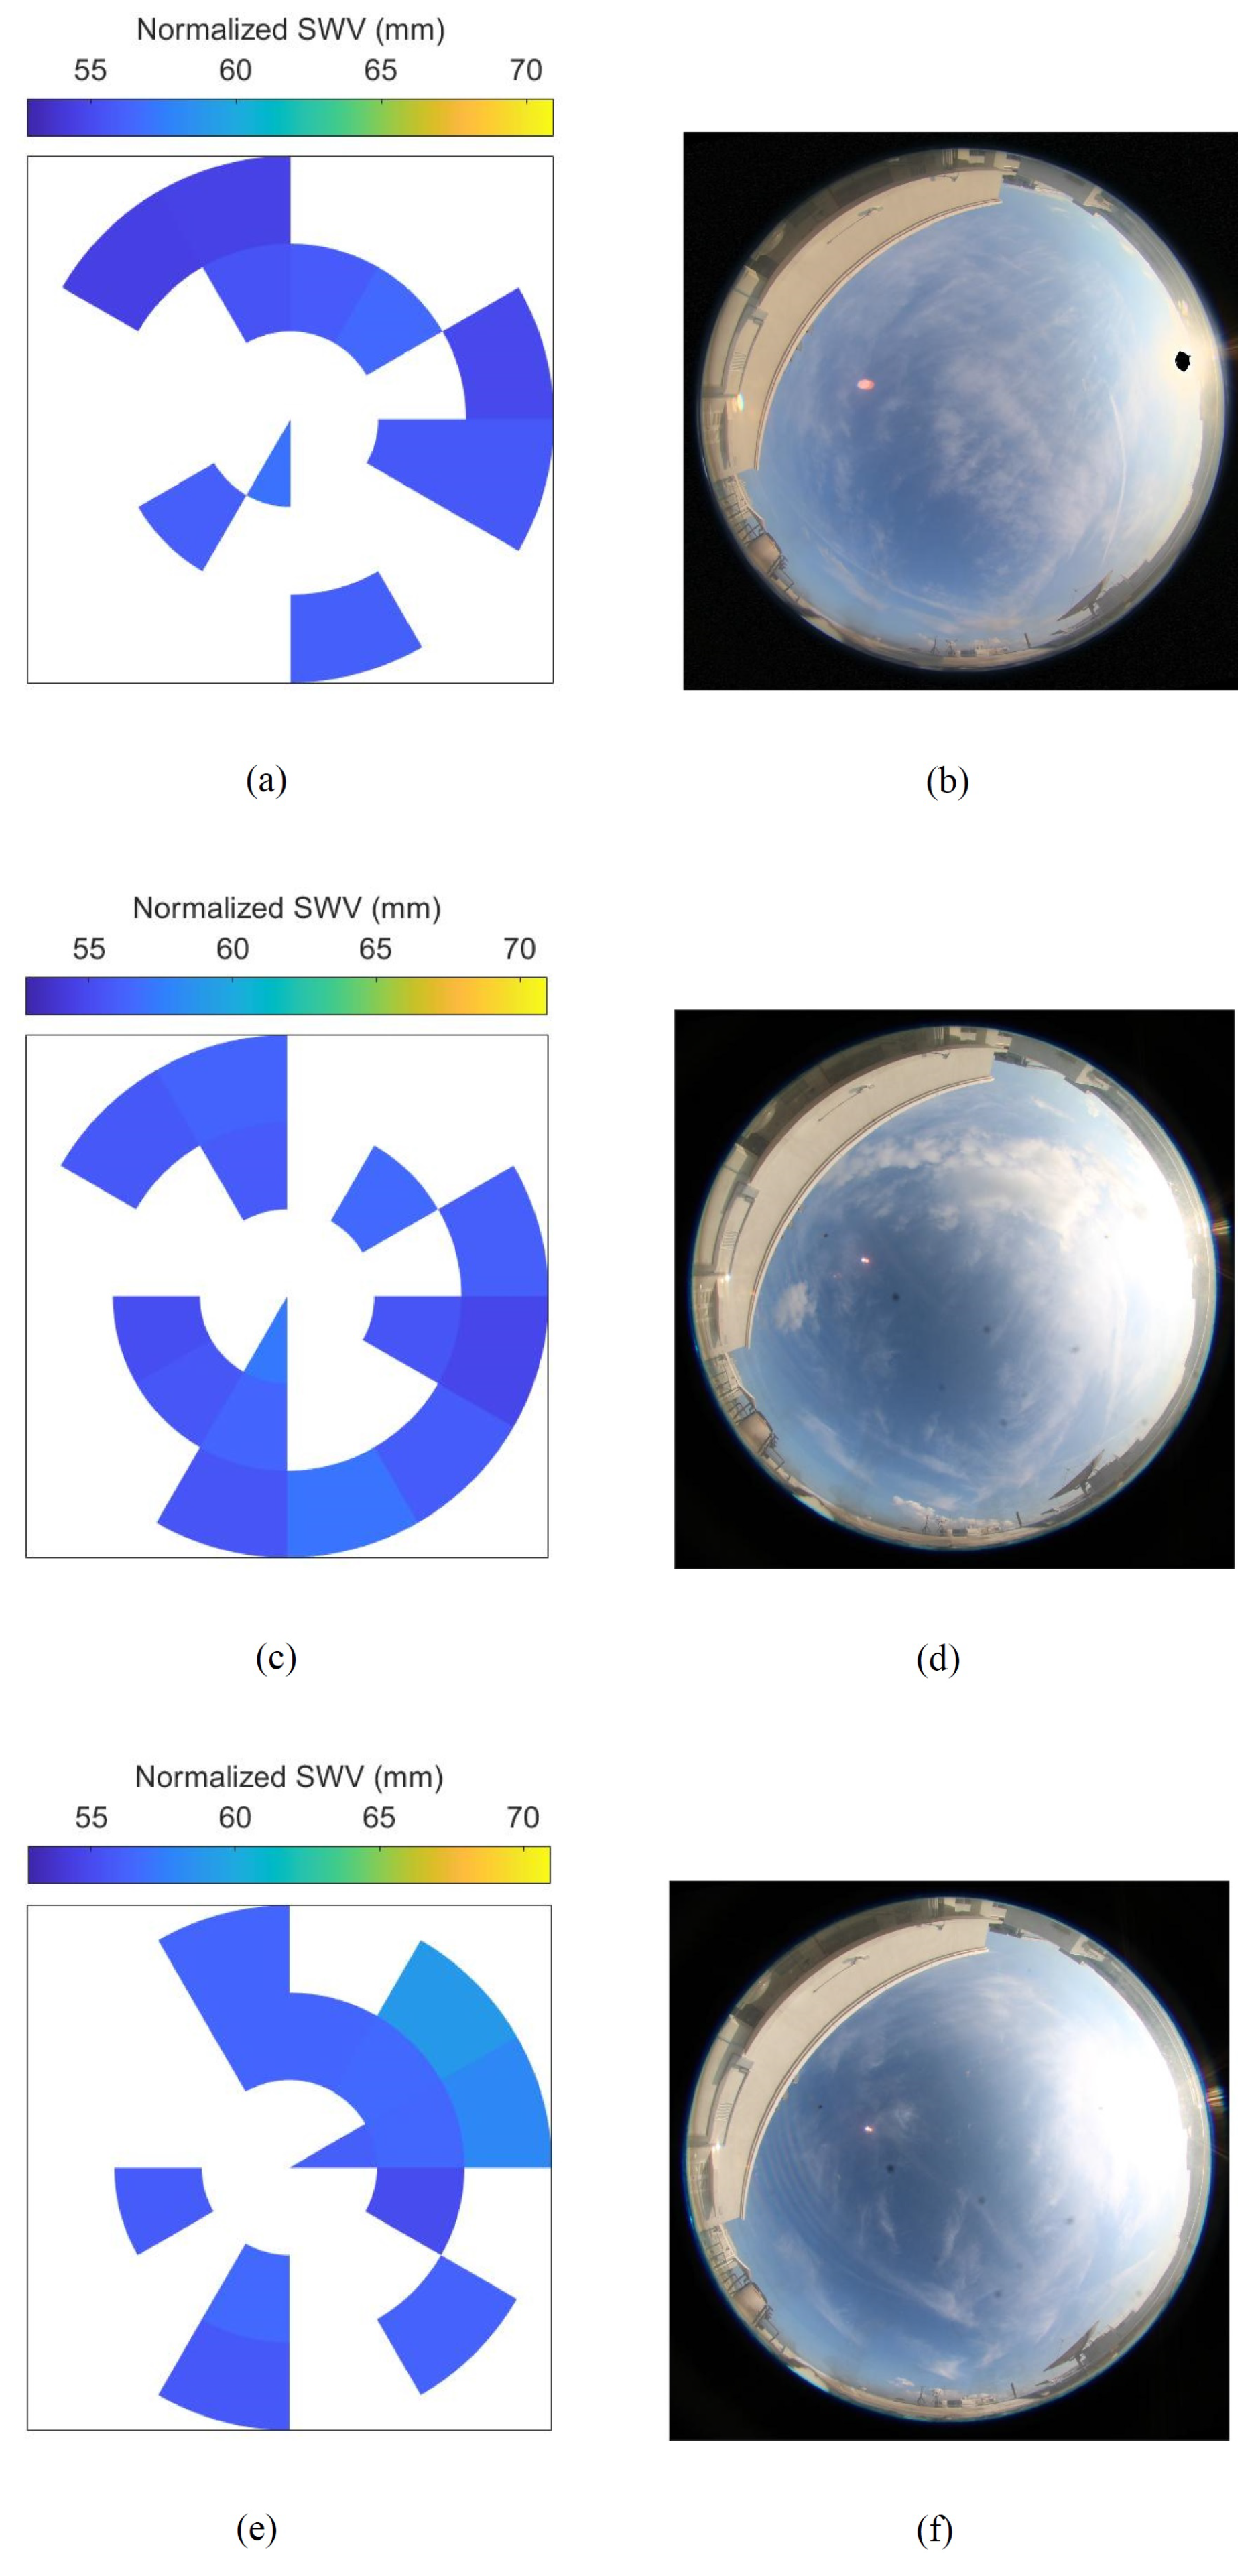
We now analyze the spatial plots of normalized S W V for cloud monitoring and compare them alongside the sky images recorded at the same time. Prior to that, all sky images are flipped about the horizontal (east–west) axis and rotated to align with the north–south axis in order to be consistent with the skyplot orientation. Figure 6 left shows the spatial plots of normalized S W V on 20 April 2016 at (a) 08:00, (c) 08:20, and (e) 08:40 local time. The sky images at the corresponding local time are shown on the right. From the sky images, we can see that they depict relatively clear skies during this period without significant cloud formation. The sun is also visible in the east direction. Evidently, the spatial plots of normalized S W V depict generally low values, at around 57 mm, which are consistent with the clear sky condition in the sky images.
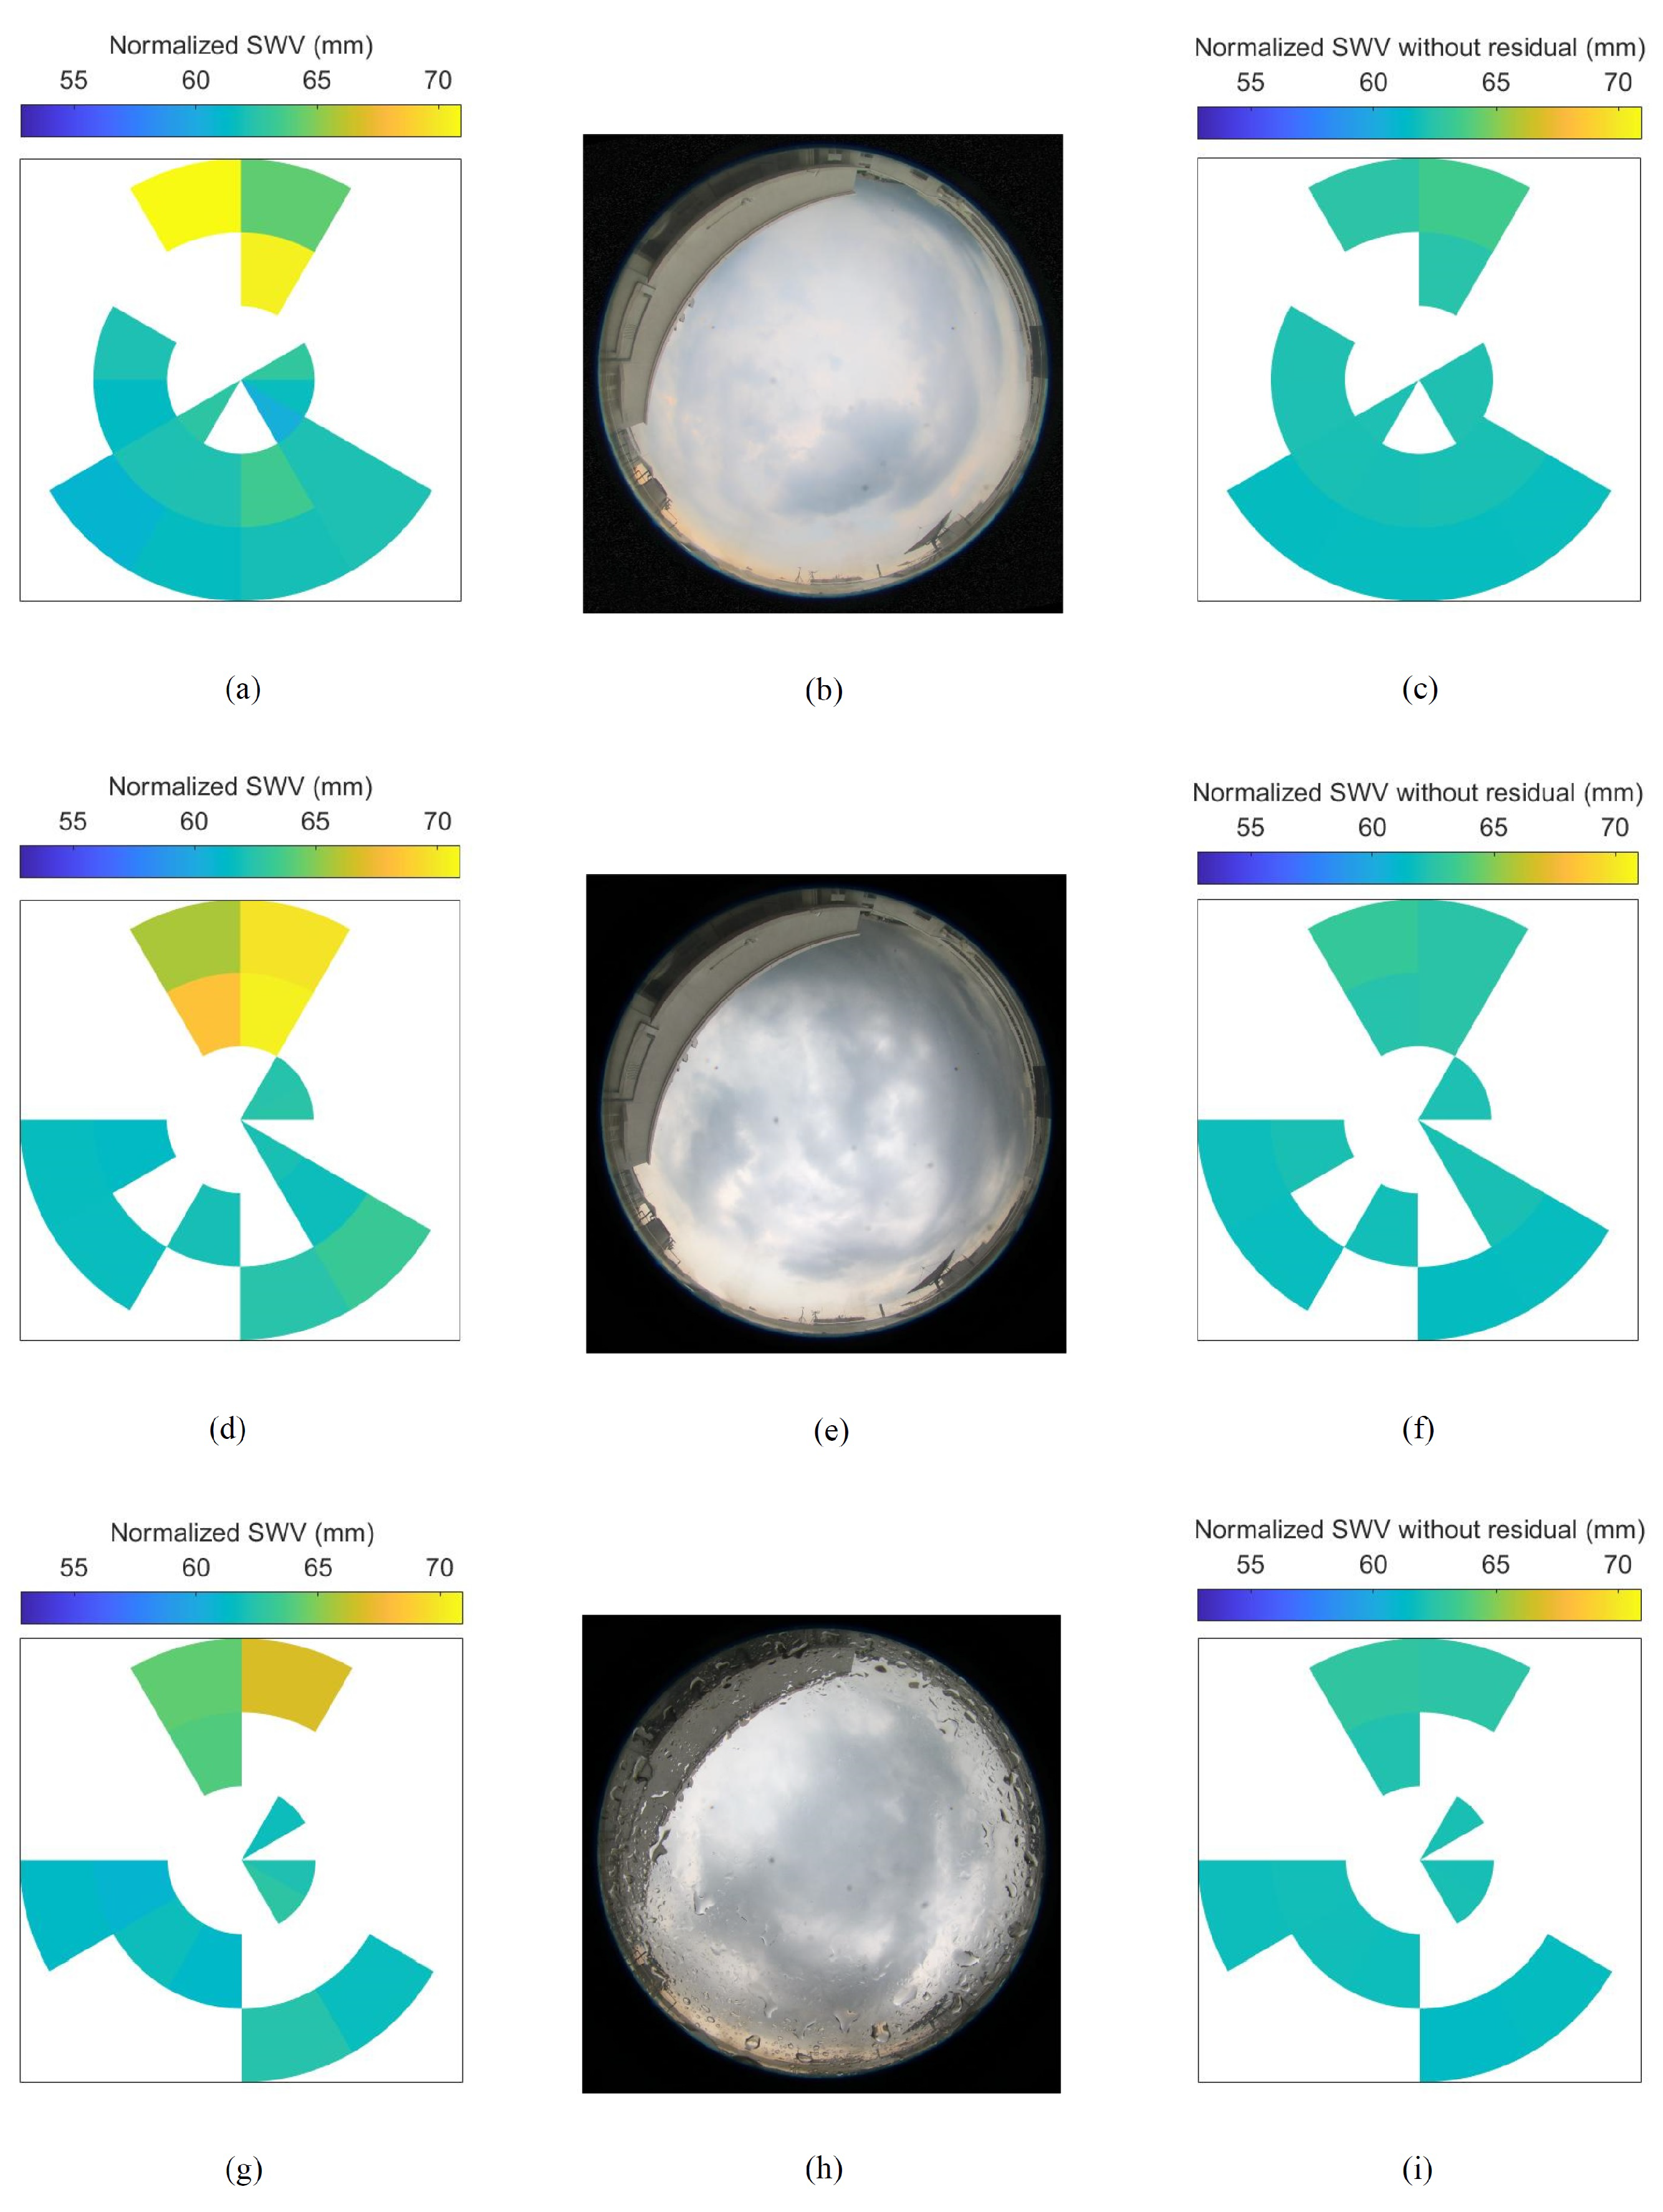
We proceed to look at periods that have more significant cloud formation. Figure 7 left shows the spatial plots of normalized S W V on the same day at (a) 13:00, (c) 13:20, and (e) 13:40 local time, while the right shows the corresponding sky images. As we can observe from the sky images, some cloud formations are seen towards the south and southwest directions at 13:00. At the same time, we also see a slight increase in normalized SWV at around 63 mm towards the same direction. As the time progresses, more clouds are formed towards the southeast direction. At 13:40, dark clouds can be seen forming towards the southeast direction, resulting in a high normalized S W V of more than 70 mm. We again see that the skyplots of the normalized S W V are consistent with the cloud formation depicted in the sky images.
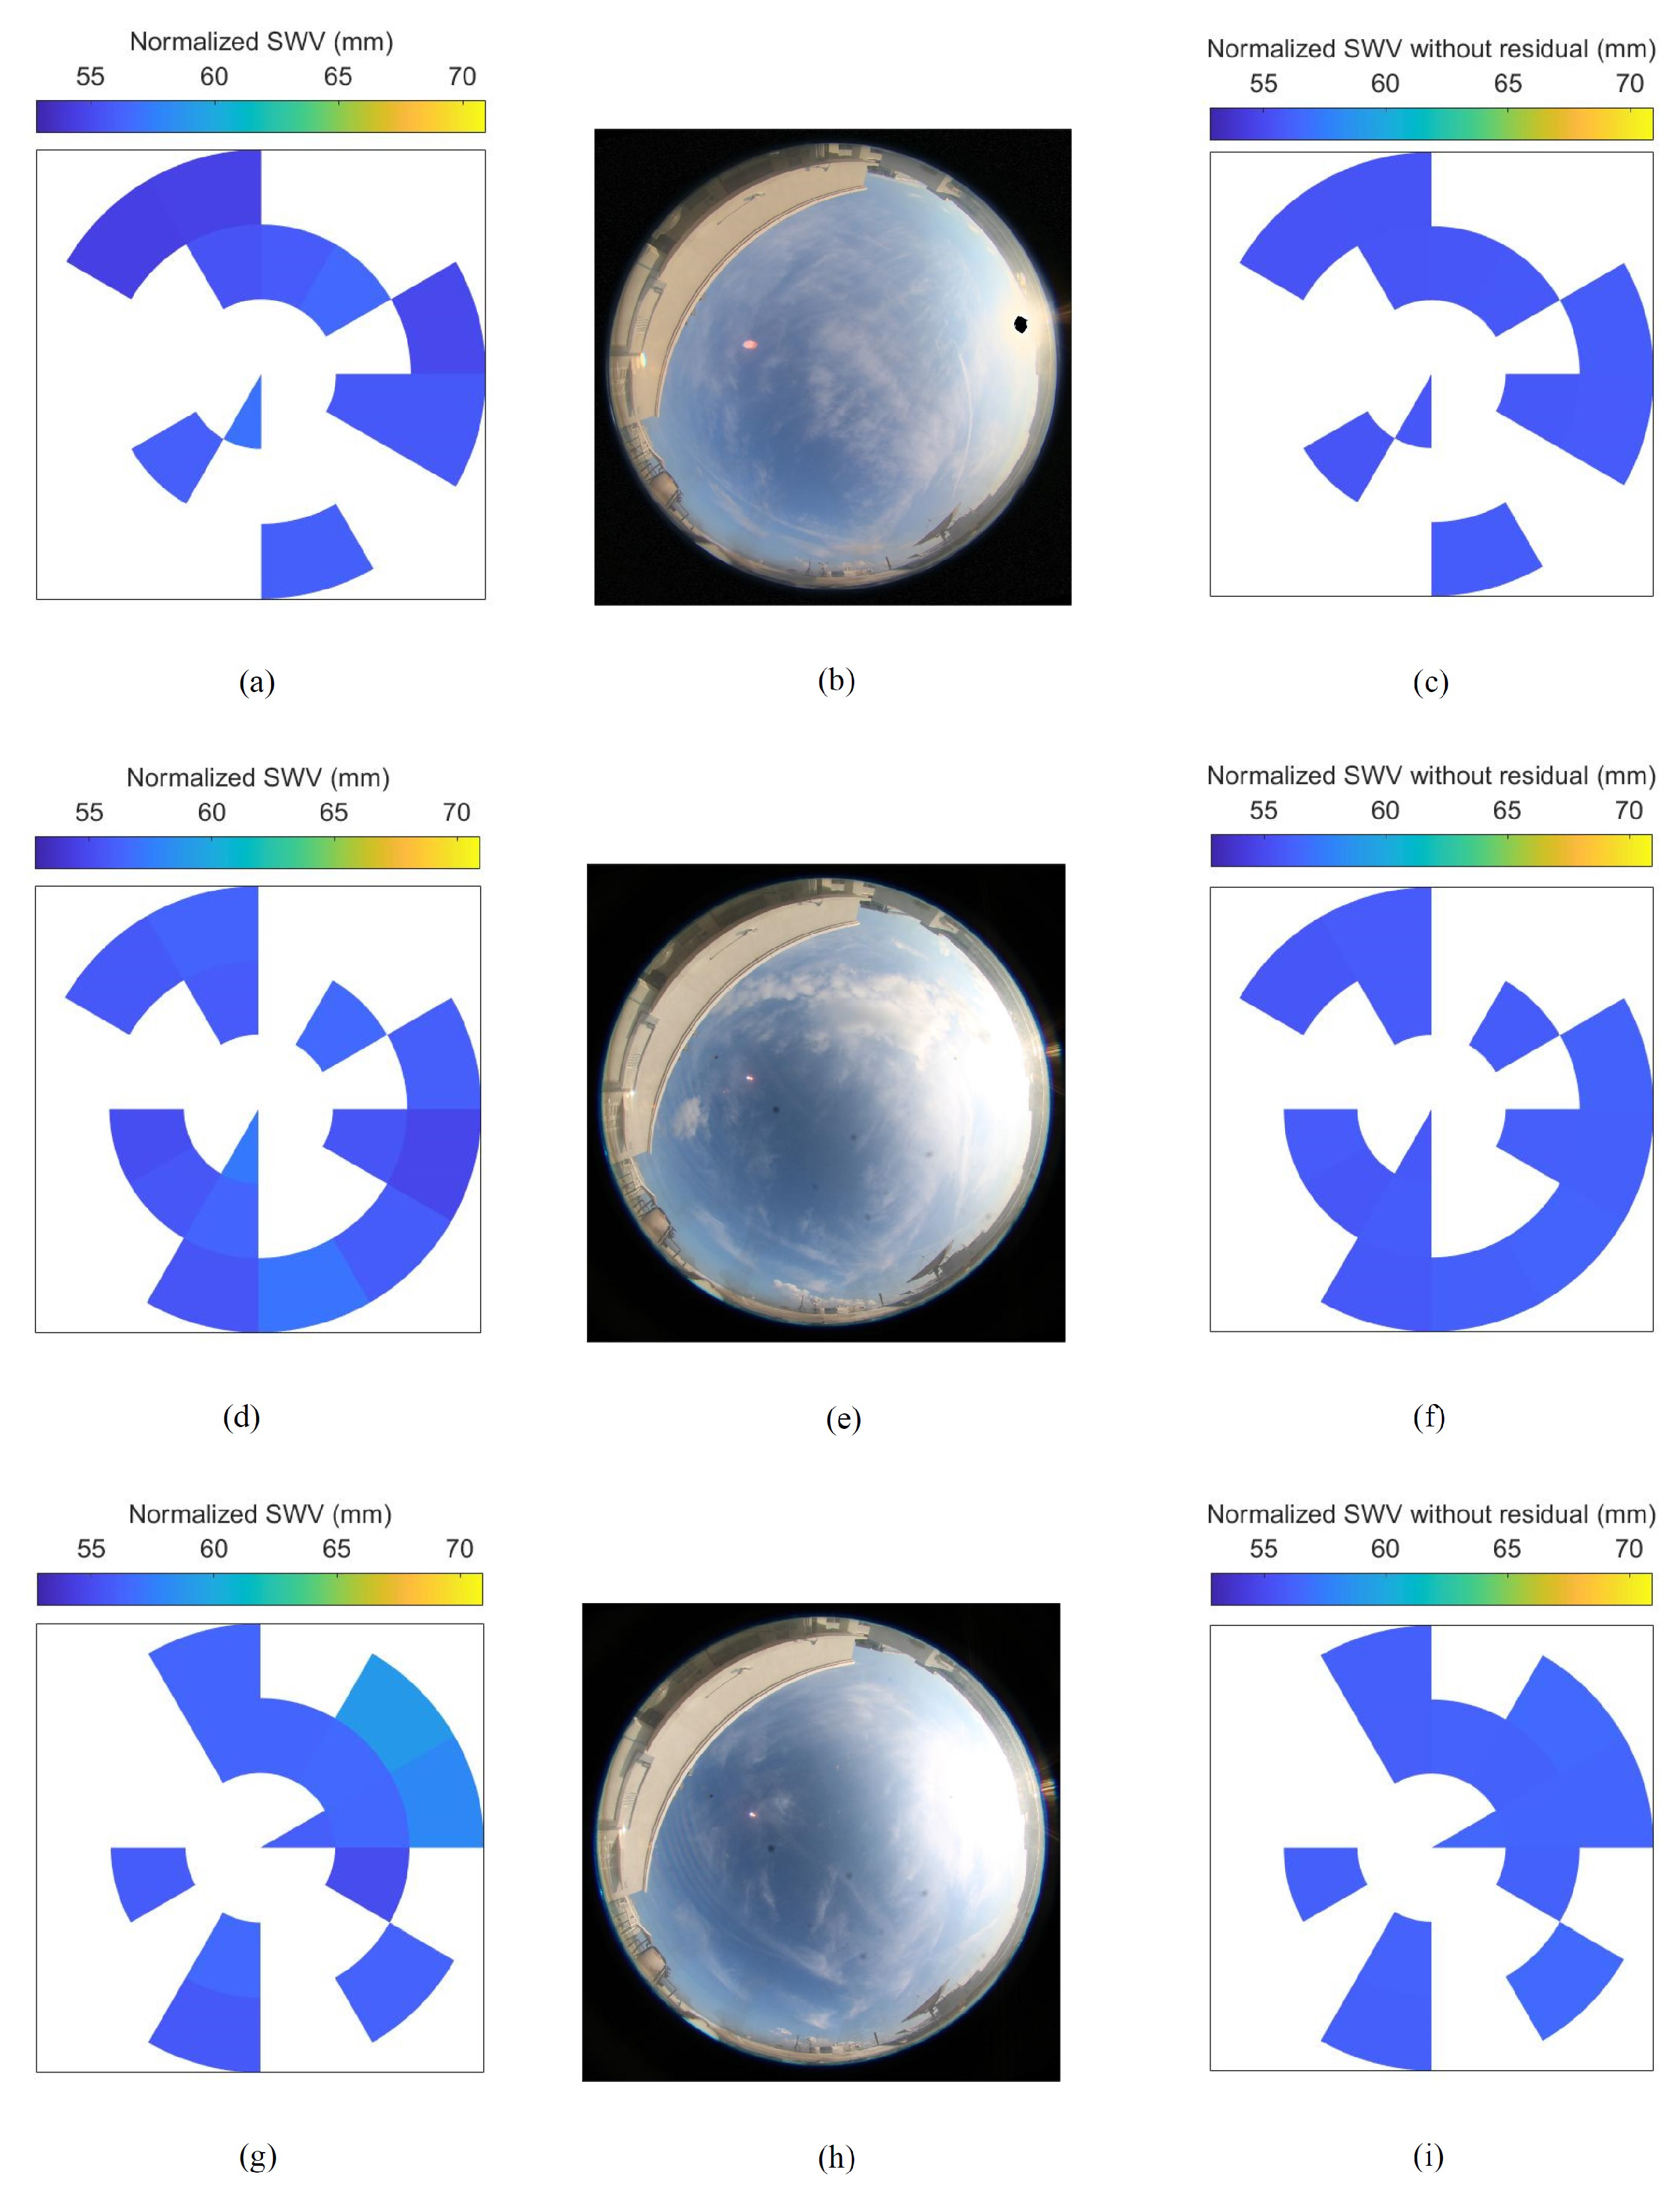
Next, the spatial plots of normalized S W V are analyzed for another day and period. Figure 8 left shows the spatial plots of normalized S W V on 16 April 2016 at (a) 17:00, (d) 17:20, and (g) 17:40 local time, while the center shows the corresponding sky images. In this case, it can be seen from the sky images that clouds are formed towards the north and northeast directions starting at 17:00. Evidently, the spatial plots also show a higher normalized S W V towards the same direction. The normalized S W V value continues to increase towards the north direction, with more dark clouds forming in the same direction seen in the sky image at 17:20. In fact, at 17:40, rain fall can be observed from the sky image, and there is a slight decrease in the normalized S W V towards the north direction. This could be attributed to the fact that the water vapor has transformed into water drops. For comparison, we also include the spatial plots of normalized S W V without added residuals at the corresponding time in Figure 8c,f,i. It can be seen that without the added residual, the normalized S W V still shows a slightly higher value towards the direction of dark cloud formation. This is largely due to the gradients that point to the direction of the water vapor. However, the residual may still contain significant information on the high tropospheric variability [44]. We see that the normalized S W V computed with the added residual shows an even higher value towards the direction of the dark cloud formation depicted in Figure 8a,d,g. Hence, the residual should be included in the computation of normalized S W V to provide a more complete slant path water vapor content. We also show the comparison of the normalized S W V with and without the added residual during the period of clear sky depicted earlier in Figure 6. Figure 9 shows the spatial plots of the normalized S W V during the same period, including the plots without the added residual in (c), (f), (i). As the clear sky does not possess high tropospheric variability, the residual values are relatively lower. Therefore, there is not much difference between the spatial plots of normalized S W V with and without added residual. Overall, from these figures, the spatial plots of normalized S W V are generally consistent with the cloud formation observed in the sky images, hence demonstrating its usefulness for cloud monitoring.

3.4. Probability Distribution of Normalized S W V Values for Clear Sky and Cloudy Conditions

In this subsection, we wish to find out the probability distribution of normalized S W V values for clear sky and cloudy conditions. We shall classify the clear sky and cloudy conditions based on the cloud cover, defined as the ratio of the cloud coverage area to the whole sky area observed from the sky image at a particular time. To obtain the cloud cover, segmentation of the sky images needs to be performed. Each pixel is segmented as cloud or sky based on a combination of color channels. A binary ‘1’ is assigned to a cloud pixel, while ‘0’ is assigned to a sky pixel. Due to its high discriminatory features, we use the ratio of B R B + R , where B and R are the blue and red channels, respectively, to differentiate cloud and sky pixels [22]. Prior to segmentation, a mask with an appropriate radius is applied to the sky images so that objects near the outer radius (horizon), such as buildings that are not part of the sky, are excluded from the segmentation. Figure 10 shows an example of the segmentation of a sky image, whereby (a) is the original image after the mask is applied and (b) is the image after segmentation. For the original image after the mask is applied in (a), one can see that it only contains the sky and that other objects near the horizon are excluded. For the image after segmentation in (b), the cloud pixels are represented by white (binary ‘1’) while the sky pixels are represented by a dark color (binary ‘0’). We can see that a proper segmentation of the image has been achieved. After proper segmentation, we classify the clear sky condition as a sky image with cloud cover of less than 0.3, while the cloudy condition is classified as a sky image with cloud cover of more than 0.7. The time resolution between successive sky images is chosen as 5 min to coincide with the time resolution of the normalized S W V . For the normalized S W V , the duration between successive spatial plots is also set as 5 min (as opposed to 20 min adopted earlier). This is to ensure that both the sky images and normalized S W V are analyzed for the same time instances. Here, we consider the sky images and normalized S W V during the day time period from 08:00 to 17:00. Subsequently, the probability density of normalized S W V values associated with different sky conditions are determined numerically. For each class (clear sky or cloudy conditions), the values of normalized S W V are sorted into specified bins, where the number of bins is set at 100 between the maximum and minimum values of the normalized S W V . The number of samples within each bin is then normalized with the total number of samples and bin width to obtain the probability density.
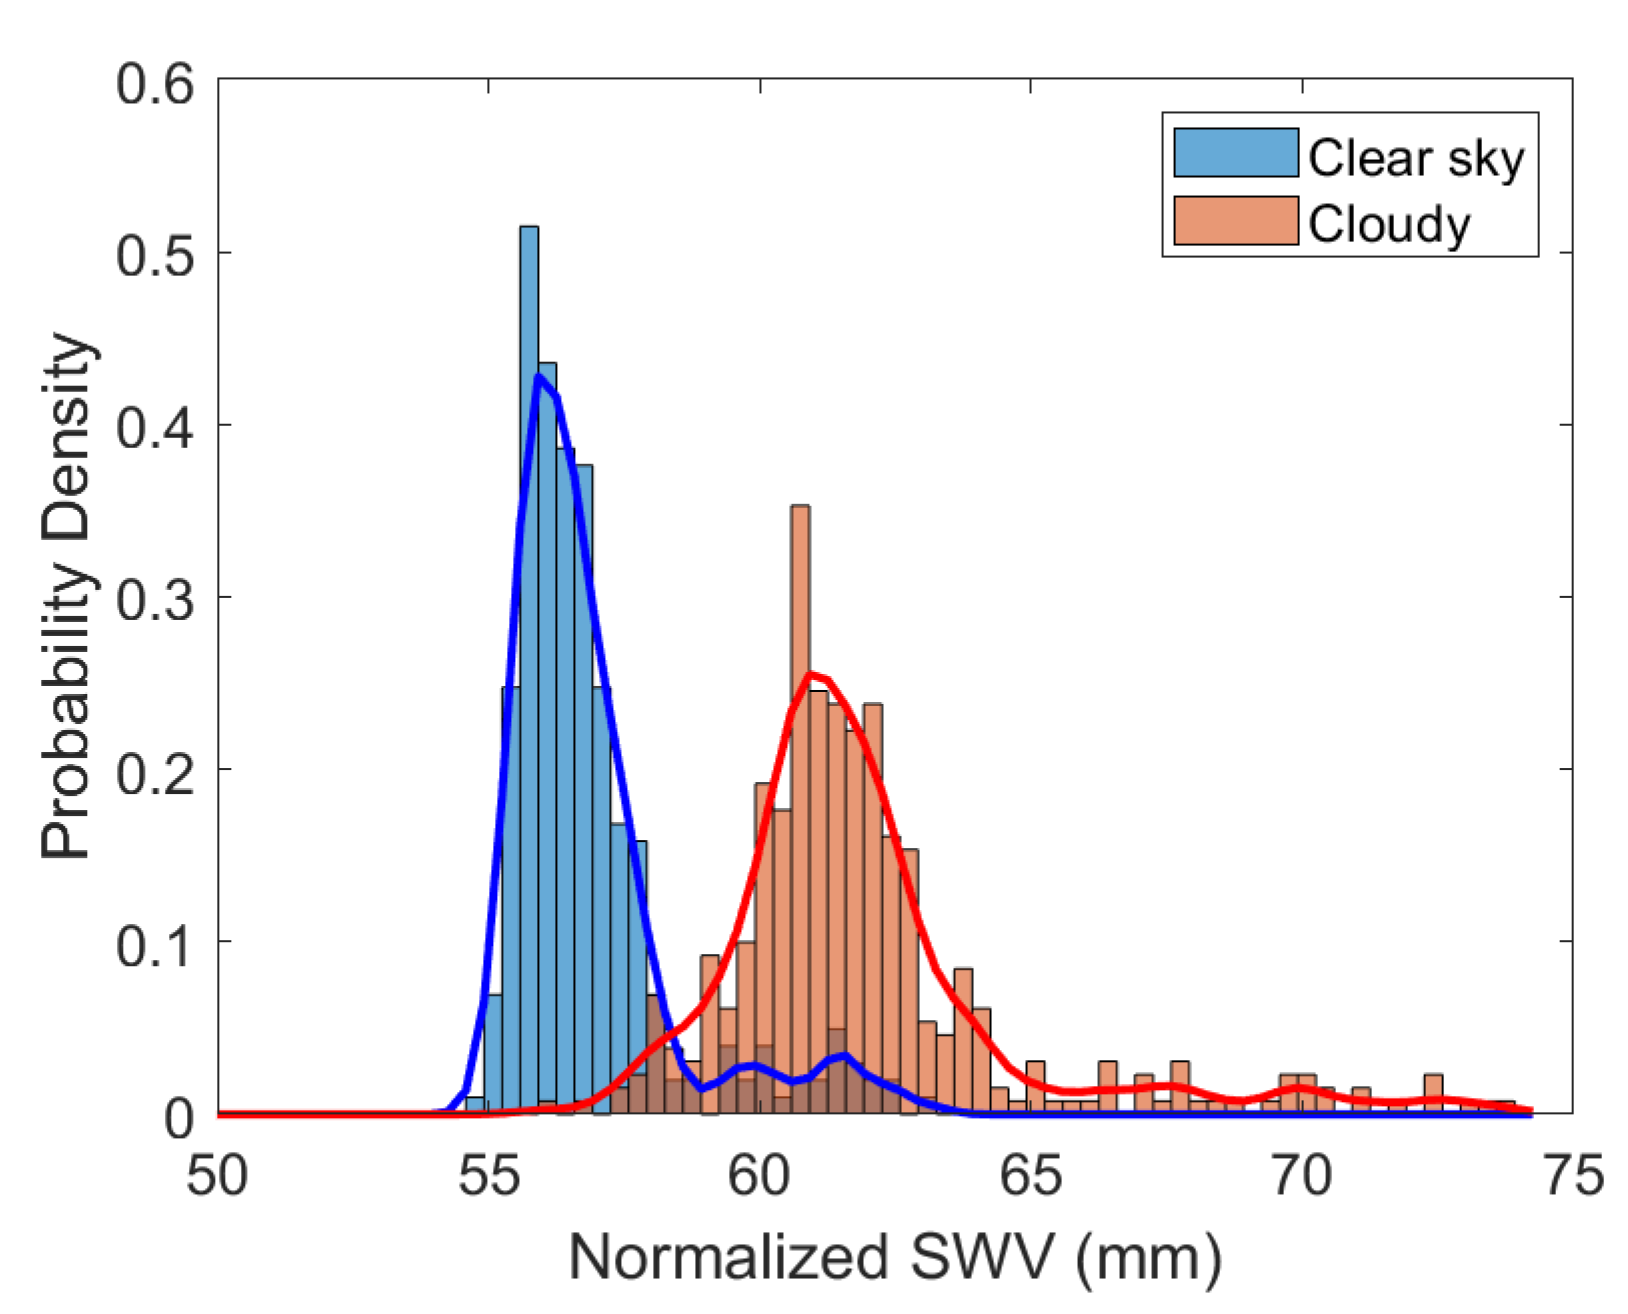
Figure 11 plots the probability density of normalized S W V associated with clear sky and cloudy conditions on 16 April 2016. The histogram shows the actual probability distribution, along with the smoothed probability density curves. The figure shows that there is a notable right shift in the distribution of normalized S W V for cloudy conditions compared to that for clear sky conditions. The mean normalized S W V for cloudy conditions is around 62 mm while for clear sky conditions, it is around 57 mm. To include more samples, Figure 12 further plots the probability density normalized S W V associated with clear sky and cloudy conditions for the months of April and May 2016. With more samples, the distribution of normalized S W V has a wider spread compared to the single-day samples from earlier. In general, the daily mean of the normalized S W V may fluctuate according to the water vapor level within the atmosphere, hence the wider spread and closer peaks between the clear sky and cloudy conditions. Nevertheless, the right shift in the distribution for cloudy condition compared to that for clear sky condition is visible. The mean normalized S W V s for cloudy and clear sky conditions are around 60 mm and 56 mm, respectively. The difference at around 4 mm is rather consistent with the difference in the mean P W V values between rain and no rain conditions at around 2 to 4 mm for the NTUS station in [28]. Overall, the distribution of the normalized S W V shows that its mean values associated with cloudy conditions are higher than those associated with clear skies.

3.5. Time Series of Normalized S W V in Relation to Solar Irradiance

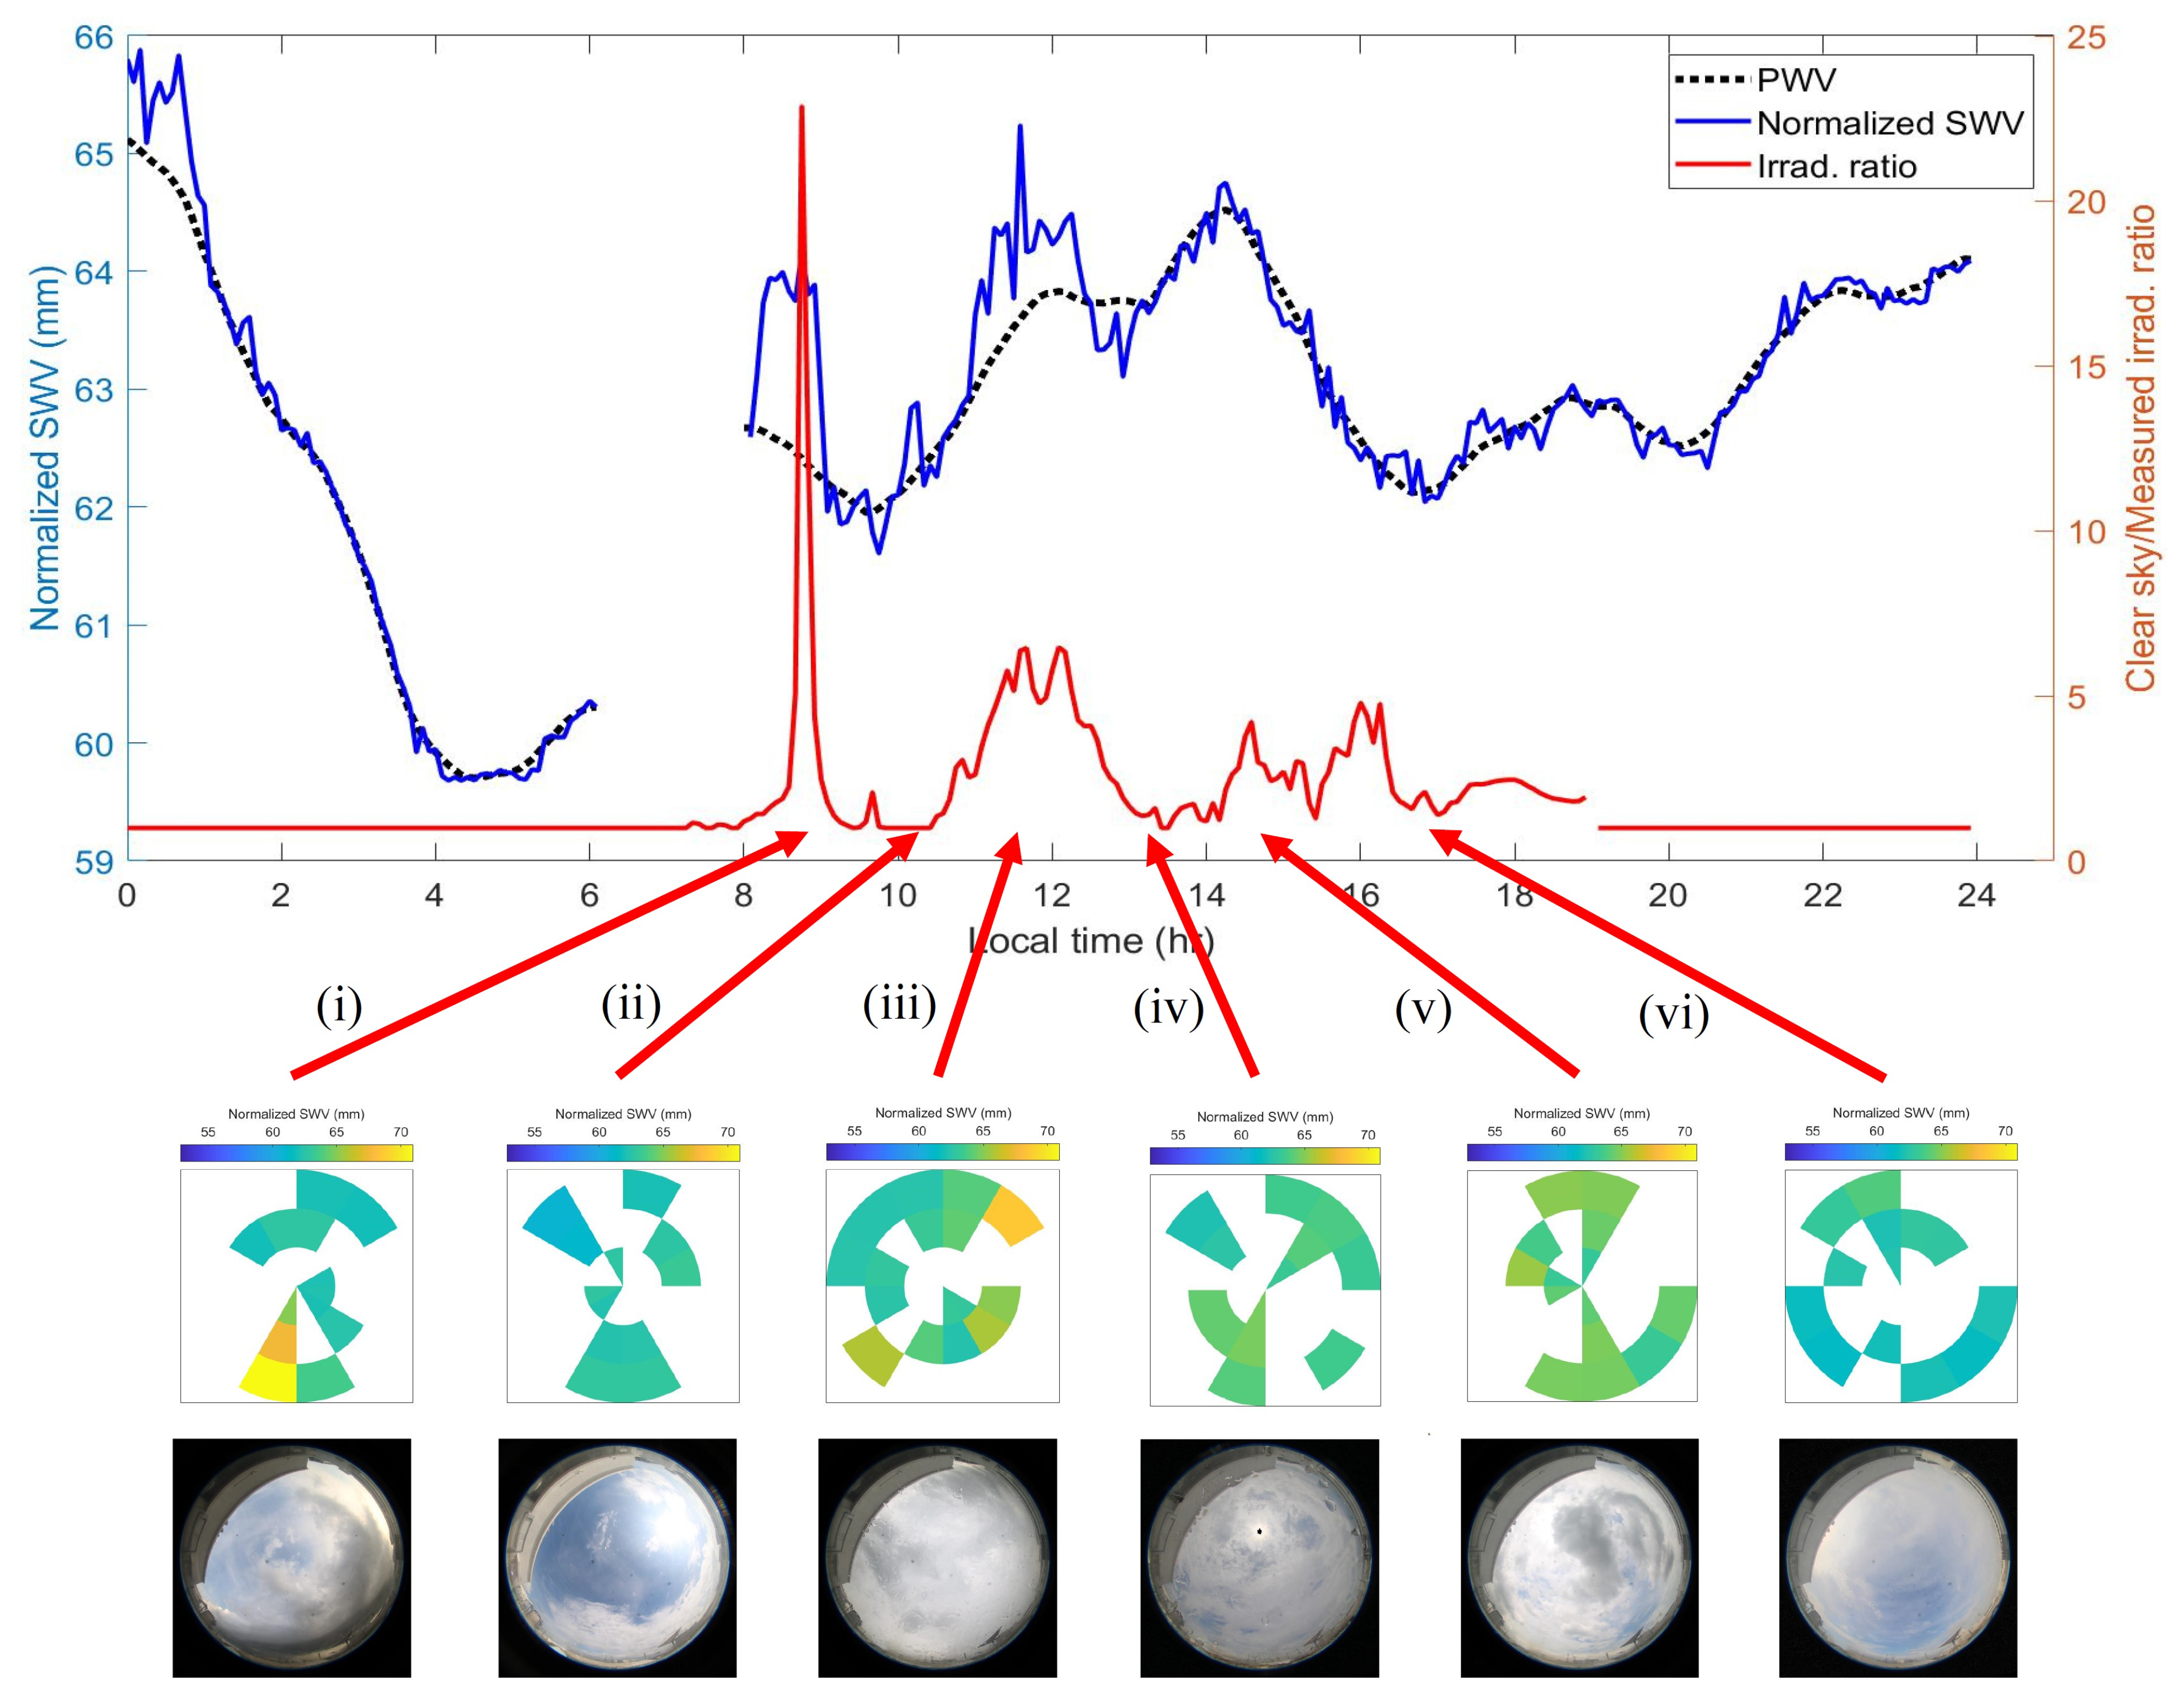
Finally, we look at the time series of normalized S W V in relation to solar irradiance. We have previously shown that the spatial plots of normalized S W V are generally consistent with the cloud formation, while also exhibiting higher mean values associated with cloudy conditions. As cloud formation would obscure the sun, resulting in lower solar irradiance, the normalized S W V would also change temporally with respect to solar irradiance. To obtain the time series of normalized S W V , the normalized S W V is averaged over the visible satellites within the skyplot every 5 min. The solar irradiance (in unit W/m2) is measured via the pyranometer within the Davis Instruments 7440 Weather Vantage Pro II at 1 min intervals. To synchronize with the time interval of the normalized S W V , it is averaged in 5 min intervals. Thereafter, the ratio of clear sky to measured irradiance (henceforth known as the irradiance ratio) is taken to exclude the effect of the solar elevation angle. A higher ratio indicates a larger solar irradiance drop and vice-versa. If there is no solar irradiance drop recorded, the ratio is 1. In this work, the Yang clear sky irradiance model [48] is used. Figure 13 shows the time series of normalized S W V and the clear sky to measured solar irradiance ratio on 13 May 2016. On this day, we observe that there are certain periods where the clear sky to measured irradiance ratio (red line) increases, e.g., around 09:00 and 12:00 local time, etc., indicating a drop in solar irradiance. Evidently, the time series of normalized S W V (blue line) during these periods increases as well due to the presence of clouds, which is generally consistent with the irradiance ratio. For comparison, the time series of P W V (black dashed line) is also included, which can be obtained directly from Z W D via:
P W V = P I · Z W D
It can be seen that the general trend of the time series of P W V is also consistent with the trend of the irradiance ratio, but it is unable to capture the local variation in relation to the irradiance ratio. This is because, unlike the normalized S W V , the P W V is derived only from Z W D , which does not include other components such as gradient parameters G n and G e and residuals, ϵ , c.f. (2). Hence, the normalized S W V possess more spatial and temporal information compared to P W V . Figure 13 also shows the spatial plots of normalized S W V and sky images at various local times. While the irradiance ratio increases (irradiance drop increases) around 09:00 local time (see i), we observe that the spatial plot of the normalized S W V exhibits high values towards the south direction, exceeding 70 mm. The sky image at the same time also shows dark clouds in the same direction. At around 10:00 (see ii), the irradiance ratio is nearly 1 (no irradiance drop) and the spatial plot of normalized S W V indicates generally lower values. At this time, we can see that the sky image shows a generally clear sky, with the sun visible. The irradiance ratio increases again around 12:00 (see iii), with high normalized S W V observed towards the northeast direction. The sky image at this time depicts cloudy conditions, with dark clouds observed towards the same direction as well. As the local time reaches around 13:00 (see iv), the irradiance ratio decreases and the spatial plot of normalized S W V indicates generally low values again. Note that the irradiance ratio does not approach 1 (some irradiance drop is still present), and the normalized S W V values are slightly higher than those at 10:00 in (ii). Indeed, the sky image shows a slightly more cloudy condition, but with the sun still visible. The irradiance ratio exhibits higher and lower values around 15:00 and 17:00, respectively (see v and vi). The normalized S W V again shows the same trend, while the sky images concur with the respective sky conditions, with more cloudy conditions around 15:00 and slightly clearer sky conditions around 17:00. Overall, the time series and spatial plots of normalized S W V are also generally consistent with the irradiance ratio.

4. Conclusions

This paper has presented a GPS-derived slant water vapor technique for cloud monitoring in Singapore. The normalized slant wet delay ( S W D ) and slant water vapor ( S W V ) have been introduced. The suitability of the normalized S W V over S W V for cloud monitoring has been demonstrated, as it is not very sensitive to the satellite elevation angle. For better illustration and representation of the spatial distribution of the normalized S W V , the skyplot has been discretized into different cells based on the azimuth and elevation angles to produce the spatial plot. The spatial plots have been analyzed for cloud monitoring and compared alongside the sky images. Results have shown that the spatial plots of normalized S W V are generally consistent with the cloud formation observed in the sky images, hence demonstrating its usefulness for cloud monitoring. The probability distribution of the normalized S W V associated with cloudy and clear sky conditions has also been analyzed, which show that the mean values of normalized S W V associated with the former are higher. Finally, the time series of the normalized S W V has been explored in relation to the solar irradiance. It has been shown that the time series and spatial plots of normalized S W V are also consistent with the ratio of clear sky to measured irradiance. While we focus on the GPS constellation in this work, the methodology could be extended to include a combination of multiple GNSS constellations to further improve the spatial coverage. The usefulness of the normalized S W V for cloud monitoring in the work herein could also be extended and exploited for solar irradiance and weather forecasts in the future.

Author Contributions

Conceptualization, D.Y.H. and Y.H.L.; methodology, D.Y.H. and Y.H.L.; software, D.Y.H. and A.N.B.; validation, D.Y.H.; formal analysis, D.Y.H.; writing—original draft preparation, D.Y.H.; writing—review and editing, D.Y.H., Y.H.L., A.N.B. and L.M.K.; supervision, Y.H.L. and L.M.K.; project administration, Y.H.L. and L.M.K. All authors have read and agreed to the published version of the manuscript.

Funding

This research is supported by the National Research Foundation, Singapore, and the Energy Market Authority, under its Energy Programme (EMA-EP006-SEETPRGC-001).

Data Availability Statement

The data presented in this study are available on request from the corresponding author.

Conflicts of Interest

The authors declare no conflict of interest.

References

  1. Janiskova, M.; Fielding, M. Operational Assimilation of Space-Borne Radar and Lidar Cloud Profile Observations for Numerical Weather Prediction; ESA Contract Report; European Centre for Medium Range Weather Forecasts: Reading, UK, 2018; WP-6000; pp. 1–22. [Google Scholar]
  2. Tapakis, R.D.; Charalambides, A.G. Monitoring cloud motion in Cyprus for solar irradiance prediction. In Conference Papers in Science; Hindawi: London, UK, 2013; pp. 1–6. [Google Scholar]
  3. Sassen, K. Lidar monitoring of clouds and aerosols at the Facility for Atmospheric Remote Sensing. In Lidar Remote Sensing for Industry and Environment Monitoring; SPIE: Bellingham, WA, USA, 2001; Volume 4153, pp. 114–123. [Google Scholar]
  4. Brocard, E.; Schneebeli, M.; Mätzler, C. Detection of cirrus clouds using infrared radiometry. IEEE Trans. Geosci. Remote Sens. 2011, 49, 595–602. [Google Scholar] [CrossRef]
  5. Mahajan, S.; Fataniya, B. Cloud detection methodologies: Variants and development—A review. Complex Intell. Syst. 2020, 6, 251–261. [Google Scholar] [CrossRef] [Green Version]
  6. Letu, H.; Nagao, T.M.; Nakajima, T.Y.; Riedi, J.; Ishimoto, H.; Baran, A.J.; Shang, H.; Sekiguchi, M.; Kikuchi, M. Ice cloud properties from Himawari-8/AHI next-generation geostationary satellite: Capability of the AHI to monitor the DC cloud generation process. IEEE Trans. Geosci. Remote Sens. 2018, 57, 3229–3239. [Google Scholar] [CrossRef]
  7. Wagner, T.; Beirle, S.; Deutschmann, T.; Eigemeier, E.; Frankenberg, C.; Grzegorski, M.; Liu, C.; Marbach, T.; Platt, U.; De Vries, M.P. Monitoring of atmospheric trace gases, clouds, aerosols and surface properties from UV/vis/NIR satellite instruments. J. Opt. A Pure Appl. Opt. 2008, 10, 104019. [Google Scholar] [CrossRef]
  8. Ghosh, R.R.; Ali, M.S.; Hena, A.; Rahman, H. A simple cloud detection algorithm using NOAA-AVHRR satellite data. Int. J. Sci. Eng. Res. 2012, 3, 595–602. [Google Scholar]
  9. Sun, L.; Wei, J.; Wang, J.; Mi, X.; Guo, Y.; Lv, Y.; Yang, Y.; Gan, P.; Zhou, X.; Jia, C.; et al. A Universal Dynamic Threshold Cloud Detection Algorithm (UDTCDA) supported by a prior surface reflectance database. J. Geophys. Res. Atmos. 2016, 121, 7172–7196. [Google Scholar] [CrossRef]
  10. Murino, L.; Amato, U.; Carfora, M.F.; Antoniadis, A.; Huang, B.; Menzel, W.P.; Serio, C. Cloud detection of modis multispectral images. J. Atmos. Ocean. Technol. 2014, 31, 347–365. [Google Scholar] [CrossRef]
  11. Frey, R.A.; Ackerman, S.A.; Liu, Y.; Strabala, K.I.; Zhang, H.; Key, J.R.; Wang, X. Cloud detection with MODIS. Part I: Improvements in the MODIS cloud mask for collection 5. J. Atmos. Ocean. Technol. 2008, 25, 1057–1072. [Google Scholar] [CrossRef]
  12. Zhu, Z.; Woodcock, C.E. Object-based cloud and cloud shadow detection in Landsat imagery. Remote Sens. Environ. 2012, 18, 83–94. [Google Scholar] [CrossRef]
  13. Zhu, Z.; Wang, S.; Woodcock, C.E. Improvement and expansion of the fmask algorithm: Cloud, cloud shadow, and snow detection for landsats 4–7, 8, and sentinel 2 images. Remote Sens. Environ. 2015, 159, 269–277. [Google Scholar] [CrossRef]
  14. Shields, J.E.; Karr, M.E.; Johnson, R.W.; Burden, A.R. Day/night whole sky imagers for 24-h cloud and sky assessment: History and overview. Appl. Opt. 2013, 52, 1605–1616. [Google Scholar] [CrossRef] [PubMed]
  15. Shields, J.E.; Karr, M.E.; Tooman, T.P.; Sowle, D.H.; Moore, S.T. The whole sky imager—A year of progress. In Proceedings of the 8th Atmospheric Radiation Measurement (ARM) Science Team Meeting, Tucson, Arizona, 23–27 March 1998; pp. 23–27. [Google Scholar]
  16. Chauvin, R.; Nou, J.; Thil, S.; Traore, A.; Grieu, S. Cloud detection methodology based on a sky-imaging system. Energy Procedia 2019, 69, 1970–1980. [Google Scholar] [CrossRef]
  17. Chauvin, R.; Nou, J.; Thil, S.; Grieu, S. Cloud motion estimation using a sky imager. In AIP Conference Proceedings; AIP Publishing LLC: Melville, NY, USA, 2016; Volume 1734, p. 150003. [Google Scholar]
  18. Adam, J.; Buss, J.; Brügge, K.; Nöthe, M.; Rhode, W. Cloud detection and prediction with all sky cameras. In EPJ Web of Conferences; EDP Sciences: Ulis, France, 2017; Volume 144, p. 01004. [Google Scholar]
  19. Azhar, M.A.D.M.; Hamid, N.S.A.; Kamil, W.M.A.W.M.; Mohamad, N.S. Daytime cloud detection method using the all-sky imager over PERMATApintar observatory. Universe 2021, 7, 41. [Google Scholar] [CrossRef]
  20. Alonso-Montesinos, J. Real-time automatic cloud detection using a low-cost sky camera. Remote Sens. 2020, 12, 1382. [Google Scholar] [CrossRef]
  21. Dev, S.; Savoy, F.M.; Lee, Y.H.; Winkler, S. WAHRSIS: A low-cost, high-resolution whole sky imager with near-infrared capabilities. In Infrared Imaging Systems: Design, Analysis, Modeling, and Testing XXV; SPIE: Bellingham, WA, USA, 2014. [Google Scholar]
  22. Dev, S.; Lee, Y.H.; Winkler, S. Color-based segmentation of sky/cloud images from ground-based cameras. IEEE J. Sel. Top. Appl. Earth Obs. Remote Sens. 2016, 10, 231–242. [Google Scholar] [CrossRef] [Green Version]
  23. Bevis, M.; Businger, S.; Herring, T.A.; Rocken, C.; Anthes, R.A.; Ware, R.H. GPS meteorology: Remote sensing of atmospheric water vapor using the global positioning system. J. Geophys. Res. 1992, 97, 15787–15801. [Google Scholar] [CrossRef]
  24. Arief, S.; Kosuke, H. GNSS meteorology for disastrous rainfalls in 2017–2019 summer in SW Japan: A new approach utilizing atmospheric delay gradients. Front. Earth Sci. 2020, 8, 182. [Google Scholar] [CrossRef]
  25. Westwater, E.R.; Han, Y.; Shupe, M.D.; Matrosov, S.Y. Analysis of integrated cloud liquid and precipitable water vapor retrievals from microwave radiometers during the Surface Heat Budget of the Arctic Ocean project. J. Geophys. Res. 2001, 106, 32019–32030. [Google Scholar] [CrossRef] [Green Version]
  26. Solheim, F.S.; Vivekanandan, J.; Ware, R.H.; Rocken, C. Propagation delays induced in GPS signals by dry air, water vapor, hydrometeors, and other particulates. J. Geophys. Res. 1999, 104, 9663–9670. [Google Scholar] [CrossRef]
  27. Brenot, H.; Ducrocq, V.; Walpersdorf, A.; Champollion, C.; Caumont, O. GPS zenith delay sensitivity evaluated from high-resolution numerical weather prediction simulations of the 8–9 September 2002 flash flood over southeastern France. J. Geophys. Res. 2006, 111, D15105. [Google Scholar] [CrossRef] [Green Version]
  28. Manandhar, S.; Lee, Y.H.; Meng, Y.S.; Yuan, F.; Ong, J.T. GPS derived PWV for rainfall nowcasting in tropical region. IEEE Trans. Geosci. Remote Sens. 2018, 56, 4835–4844. [Google Scholar] [CrossRef]
  29. Manandhar, S.; Lee, Y.H.; Meng, Y.S. GPS-PWV based improved long-term rainfall prediction algorithm for tropical regions. Remote Sens. 2019, 11, 2643. [Google Scholar] [CrossRef] [Green Version]
  30. Biswas, A.N.; Lee, Y.H.; Manandhar, S. Rainfall forecasting using GPS derived atmospheric gradient and residual for tropical region. IEEE Trans. Geosci. Remote Sens. 2022, 60, 1–10. [Google Scholar] [CrossRef]
  31. Yuan, F.; Lee, Y.H.; Meng, Y.S.; Manandhar, S.; Ong, J.T. High-resolution ITU-R cloud attenuation model for satellite communications in tropical region. IEEE Trans. Antennas Propag. 2019, 67, 6115–6122. [Google Scholar] [CrossRef]
  32. Kumar, L.S.; Manandhar, S.; Lee, Y.H.; Meng, Y.S. GPS derived PWV for monitoring cloud evolution. In Proceedings of the 2017 Progress in Electromagnetics Research Symposium-Fall (PIERS-FALL), Singapore, 19–22 November 2017. [Google Scholar]
  33. Heh, D.Y.; Lee, Y.H.; Koh, L.M. Cloud monitoring in Singapore using GPS residuals. In Proceedings of the 2021 IEEE International Symposium on Antennas and Propagation and USNC-URSI Radio Science Meeting (APS/URSI), Singapore, 4–10 December 2021. [Google Scholar]
  34. Manandhar, S.; Tan, J.H.; Lee, Y.H.; Meng, Y.S. GPS slant path residuals for rainfall detection. In Proceedings of the 2019 USNC-URSI Radio Science Meeting (Joint with AP-S Symposium), Atlanta, GA, USA, 7–12 July 2019. [Google Scholar]
  35. Zus, F.; Dousa, J.; Kacmarik, M.; Vaclavovic, P.; Dick, G.; Wickert, J. Estimating the impact of global navigation satellite system horizontal delay gradients in variational data assimilation. Remote Sens. 2019, 11, 41. [Google Scholar] [CrossRef] [Green Version]
  36. Shoji, Y. Retrieval of water vapor inhomogeneity using the japanese nationwide GPS array and its potential for prediction of convective precipitation. J. Meteorol. Soc. Jpn. 2013, 91, 43–62. [Google Scholar] [CrossRef] [Green Version]
  37. Elosegui, P.; Davis, J.L.; Gradinarsky, L.P.; Elgered, G.; Johansson, J.M.; Tahmoush, D.A.; Rius, A. Sensing atmospheric structure using small-scale space geodetic networks. Geophys. Res. Lett. 1999, 26, 2445–2448. [Google Scholar] [CrossRef] [Green Version]
  38. Flouzat, M.; Bettinelli, P.; Willis, P.; Avouac, J.P.; Héritier, T.; Gautam, U. Investigating tropospheric effects and seasonal position variations in GPS and DORIS time-series from the Nepal Himalaya. Geophys. J. Int. 2009, 178, 1246–1259. [Google Scholar] [CrossRef]
  39. Masoumi, S.; McClusky, S.; Koulali, A.; Tregoning, P. A directional model of tropospheric horizontal gradients in Global Positioning Systemand its application for particular weather scenarios. J. Geophys. Res. Atmos. 2017, 122, 4401–4425. [Google Scholar] [CrossRef]
  40. Gegout, P.; Biancale, R.; Soudarin, L. Adaptive mapping functions to the azimuthal anisotropy of the neutral atmosphere. J. Geod. 2011, 85, 661–677. [Google Scholar] [CrossRef]
  41. Davis, J.L.; Elgered, G.; Niell, A.E.; Kuehn, C.E. Ground-based measurement of gradients in the “wet” radio refractivity of air. Rad. Sci. 1993, 28, 1003–1018. [Google Scholar] [CrossRef]
  42. Manandhar, S.; Lee, Y.H.; Meng, Y.S.; Ong, J.T. A simplified model for the retrieval of precipitable water vapor from GPS signal. IEEE Trans. Geosci. Remote Sens. 2017, 55, 6245–6253. [Google Scholar] [CrossRef]
  43. Shoji, Y.; Nakamura, H.; Iwabuchi, T.; Aonashi, K.; Seko, H.; Mishima, K.; Itagaki, A.; Ichikawa, R.; Ohtani, R. Tsukuba GPS Dense Net Campaign Observation: Improvement of GPS analysis of slant path delay by stacking one-way postfit phase residuals. J. Meteorol. Soc. Jpn. 2004, 82, 301–314. [Google Scholar] [CrossRef] [Green Version]
  44. Kačmařík, M.; Douša, J.; Dick, G.; Zus, F.; Brenot, H.; Möller, G.; Pottiaux, E.; Kapłon, J.; Hordyniec, P.; Václavovic, P.; et al. Inter-technique validation of tropospheric slant total delays. Atmos. Meas. Tech. 2017, 10, 2183–2208. [Google Scholar] [CrossRef] [Green Version]
  45. Niell, A.E. Global mapping functions for the atmosphere delay at radio wavelengths. J. Geophy. Res. 1996, 101, 3227–3246. [Google Scholar] [CrossRef]
  46. Site Information for Singapore. Available online: http://gnss1.tudelft.nl/dpga/station/Singapore.html (accessed on 1 September 2022).
  47. Dev, S. 2D and 3D Image Analysis and Its Application to Sky/Cloud Imaging. Ph.D. Thesis, Nanyang Technological University, Singapore, 2017. [Google Scholar]
  48. Yang, D.; Jirutitijaroen, P.; Walsh, W.M. The estimation of clear sky global horizontal irradiance at the equator. Energy Procedia 2012, 25, 141–148. [Google Scholar] [CrossRef]
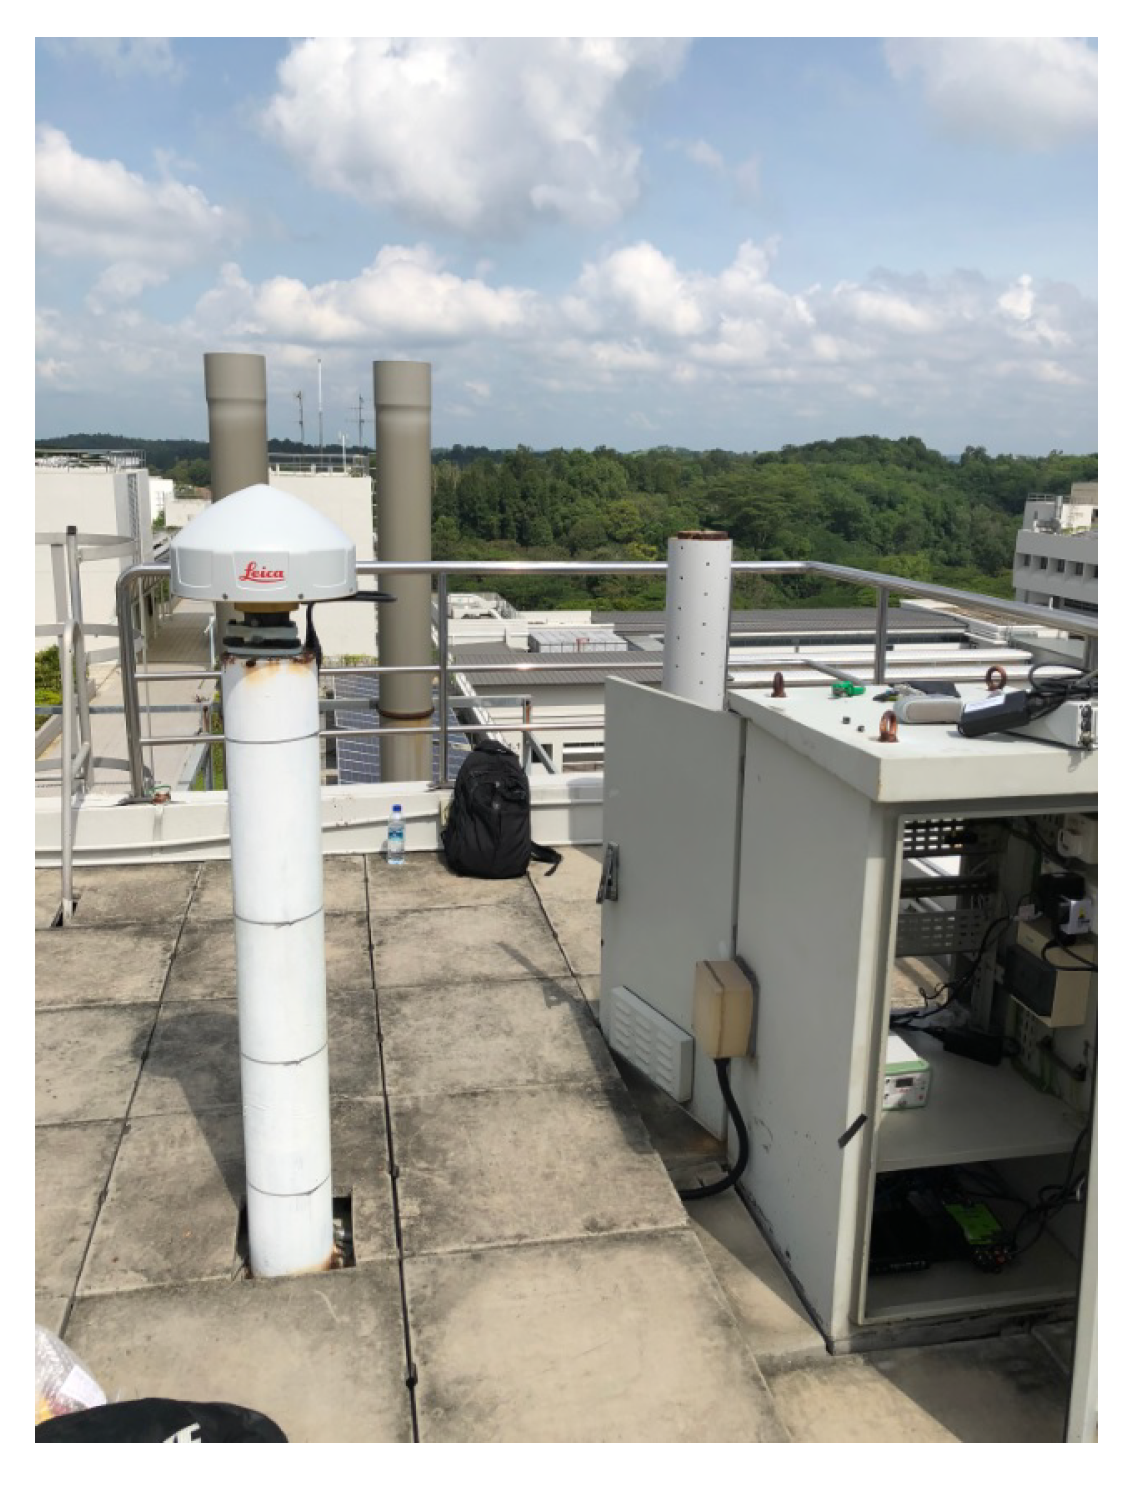
Figure 1. Photo of the IGS station (station ID: NTUS) at Nanyang Technological University, Singapore. Photo adapted from [46].
Remotesensing 14 05459 g001
Figure 2. Photo of the WAHRSIS design: (a) DSLR camera, (b) dome, (c) ODROID board, (d) casing, (e) thermoelectric cooler with fans. Photo adapted from [47].
Remotesensing 14 05459 g002
Figure 3. Skyplots of (a) S W V and (b) normalized S W V on 21 April 2016, 09:00 to 10:00 local time.
Remotesensing 14 05459 g003
Figure 4. Skyplots of (a) S W V and (b) normalized S W V on 20 April 2016, 14:00 to 15:00 local time.
Remotesensing 14 05459 g004
Figure 5. Left: Skyplots of normalized S W V on 21 April 2016, 09:00 local time, over different durations: (a) 1 h, (c) 20 min, (e) 5 min. Right: Spatial plots of normalized S W V over the corresponding durations, (b) 1 h, (d) 20 min, (f) 5 min, based on sectorization with uniform cells of 30 in both azimuth and elevation directions.
Remotesensing 14 05459 g005
Figure 6. Left: Spatial plots of normalized S W V on 20 April 2016 at (a) 08:00, (c) 08:20, and (e) 08:40 local time. Right: Sky images on the same day, at the corresponding (b) 08:00, (d) 08:20, and (f) 08:40 local time.
Remotesensing 14 05459 g006
Figure 7. Left: Spatial plots of normalized S W V on 20 April 2016 at (a) 13:00, (c) 13:20, and (e) 13:40 local time. Right: Sky images on the same day, at (b) 13:00, (d) 13:20, and (f) 13:40 local time.
Remotesensing 14 05459 g007
Figure 8. Left: Spatial plots of normalized S W V on 16 April 2016 at (a) 17:00, (d) 17:20, and (g) 17:40 local time. Center: Sky images on the same day at (b) 17:00, (e) 17:20, and (h) 17:40 local time. Right: Spatial plots of normalized S W V without added residual on the same day at (c) 17:00, (f) 17:20, and (i) 17:40 local time.
Remotesensing 14 05459 g008
Figure 9. Left: Spatial plots of normalized S W V on 20 April 2016 at (a) 08:00, (d) 08:20, and (g) 08:40 local time. Center: Sky images on the same day at (b) 08:00, (e) 08:20, and (h) 08:40 local time. Right: Spatial plots of normalized S W V without added residual on the same day at (c) 08:00, (f) 08:20, and (i) 08:40 local time.
Remotesensing 14 05459 g009
Figure 10. Segmentation of a sky image: (a) original image after mask, (b) image after segmentation.
Remotesensing 14 05459 g010
Figure 11. Probability density of normalized S W V associated with clear sky and cloudy conditions on 16 April 2016.
Remotesensing 14 05459 g011
Figure 12. Probability density of normalized S W V associated with clear sky and cloudy conditions in the months of April and May 2016.
Remotesensing 14 05459 g012
Figure 13. Time series of P W V , normalized S W V , and clear sky to measured solar irradiance ratio on 13 May 2016. Also shown are the spatial plots of normalized S W V and sky images at various local times.
Remotesensing 14 05459 g013
Publisher’s Note: MDPI stays neutral with regard to jurisdictional claims in published maps and institutional affiliations.