Author Contributions
Conceptualization, D.M., J.M. and X.X.; methodology, D.M. and J.M.; software, D.M.; validation, J.M; formal analysis, D.M. and J.M.; investigation, D.M., J.M. and X.X.; resources, D.M., J.M. and X.X.; data curation, D.M. and J.M.; writing—original draft preparation, D.M.; writing—review and editing, J.M. and X.X.; visualization, D.M.; supervision, X.X.; project administration, X.X.; funding acquisition, X.X. All authors have read and agreed to the published version of the manuscript.
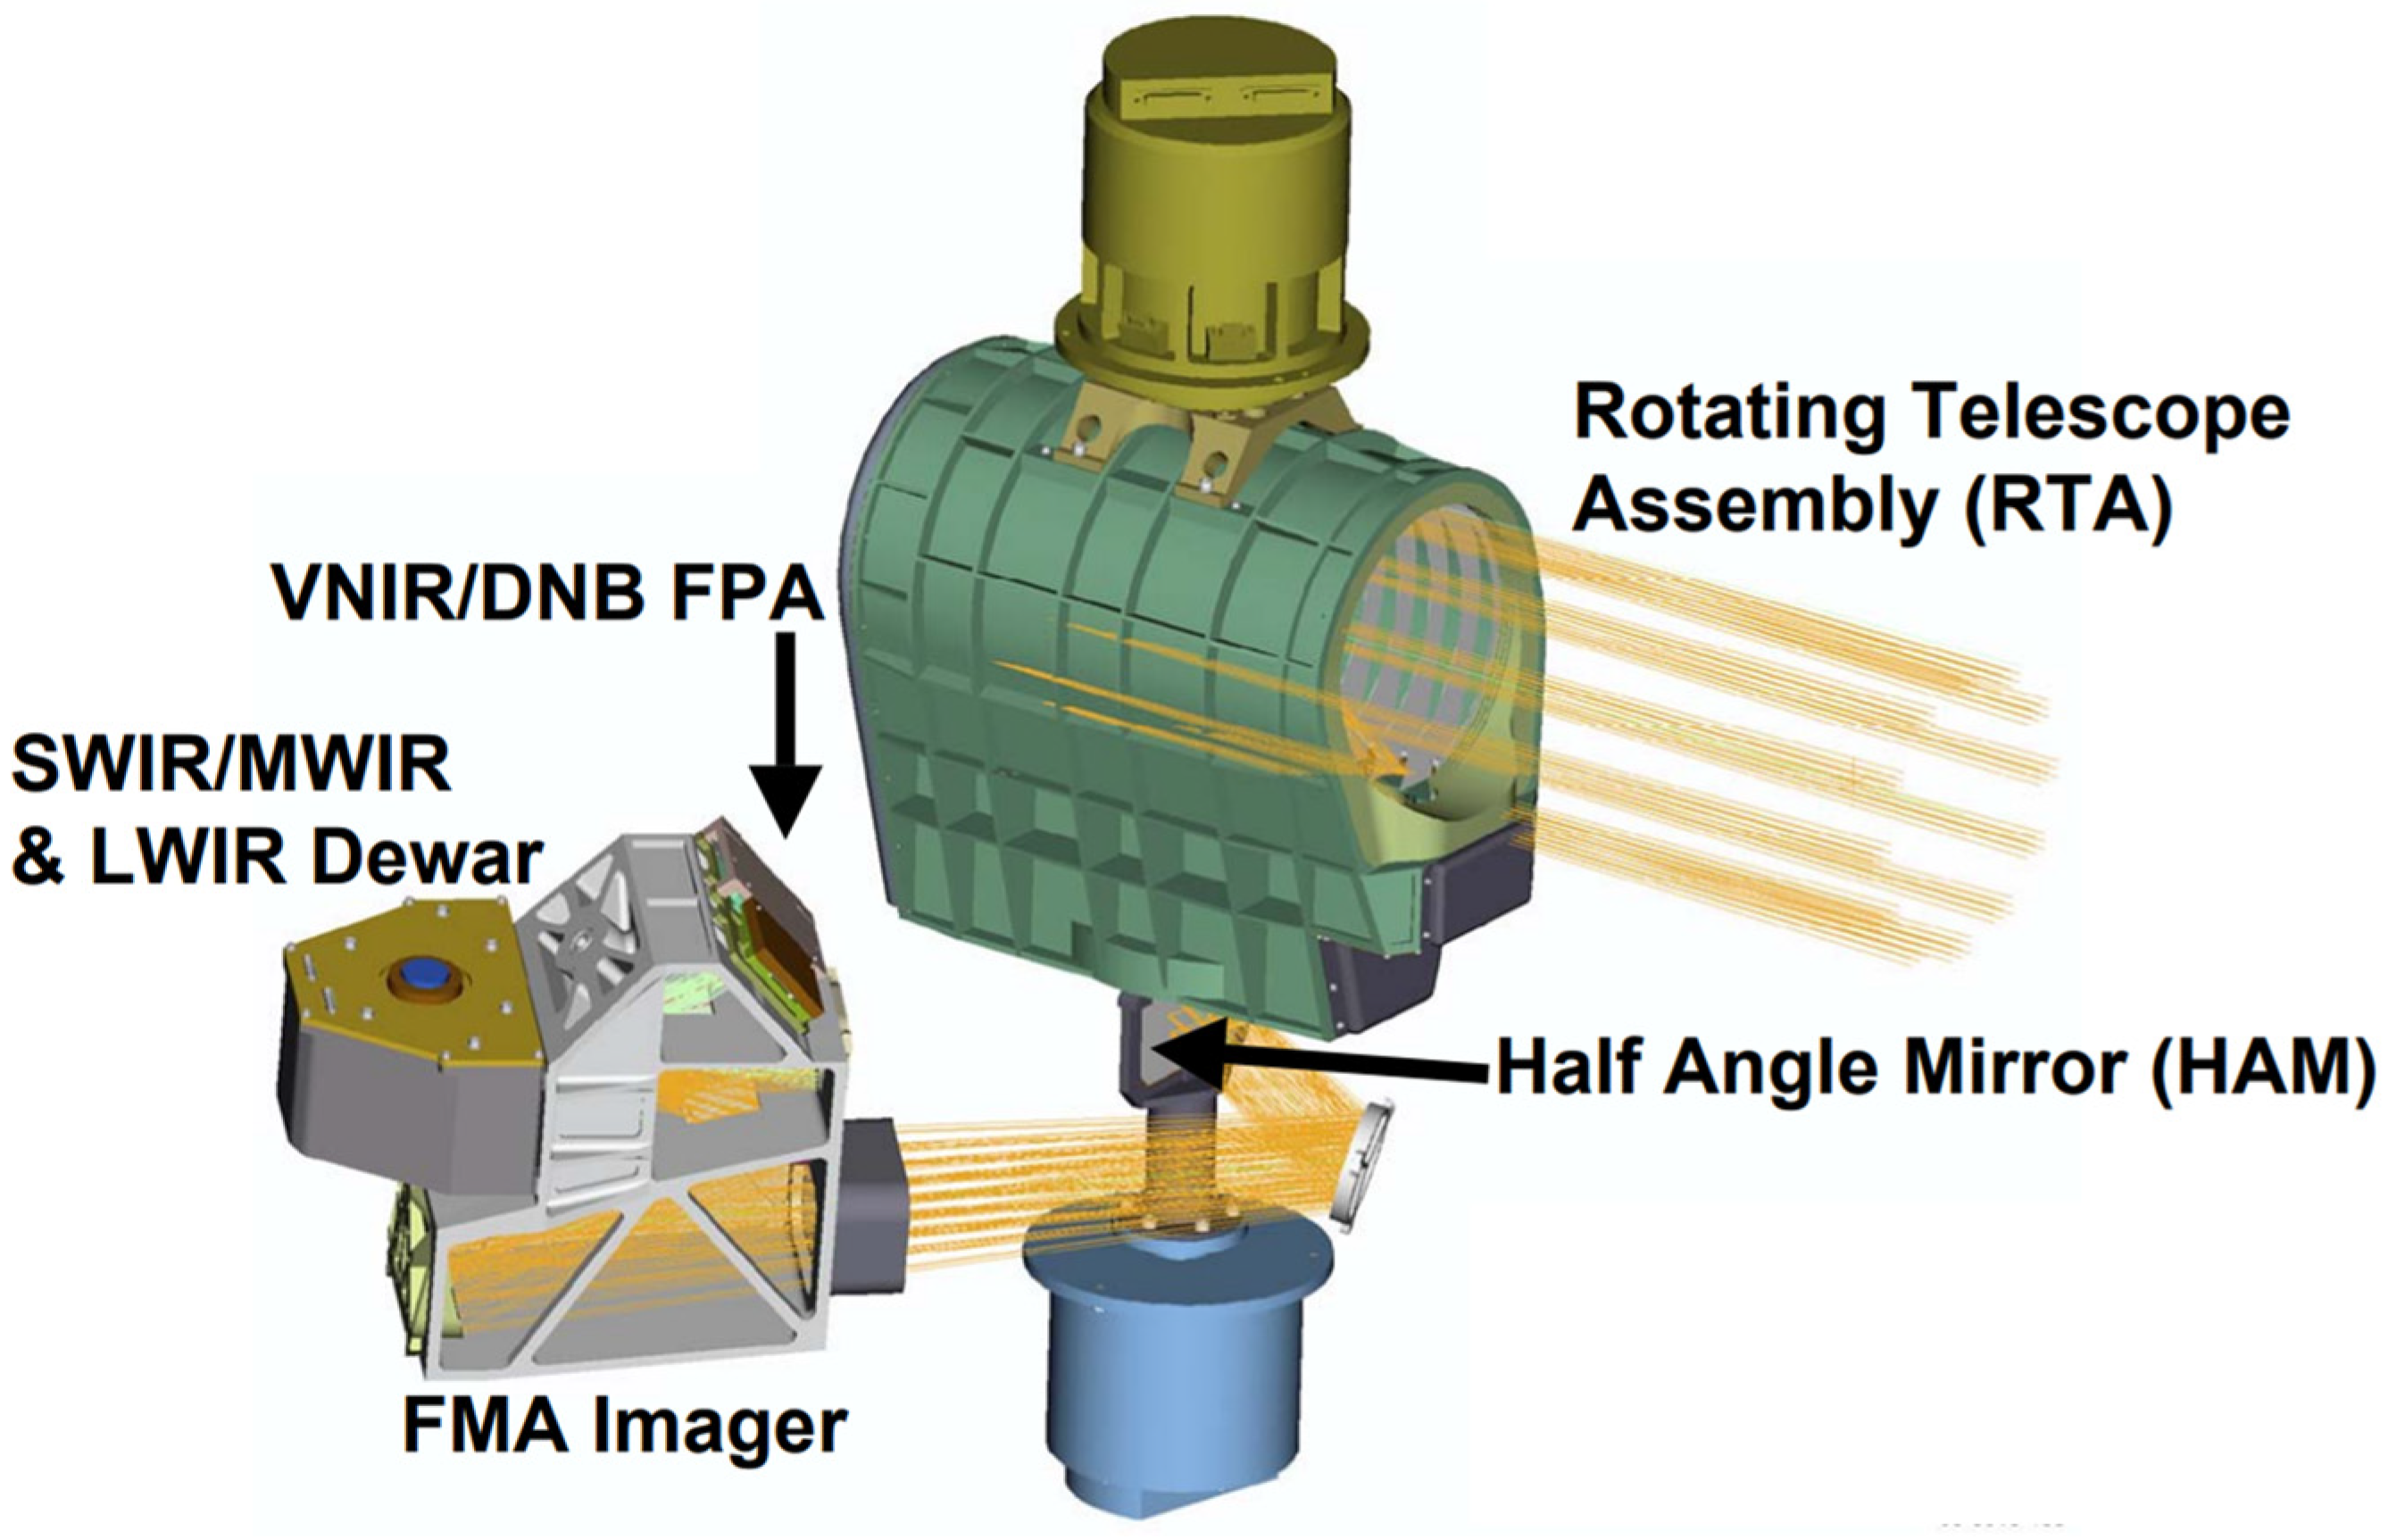
Figure 1.
A cartoon of the VIIRS optical system showing the scanning system and aft-optics design.
Figure 1.
A cartoon of the VIIRS optical system showing the scanning system and aft-optics design.
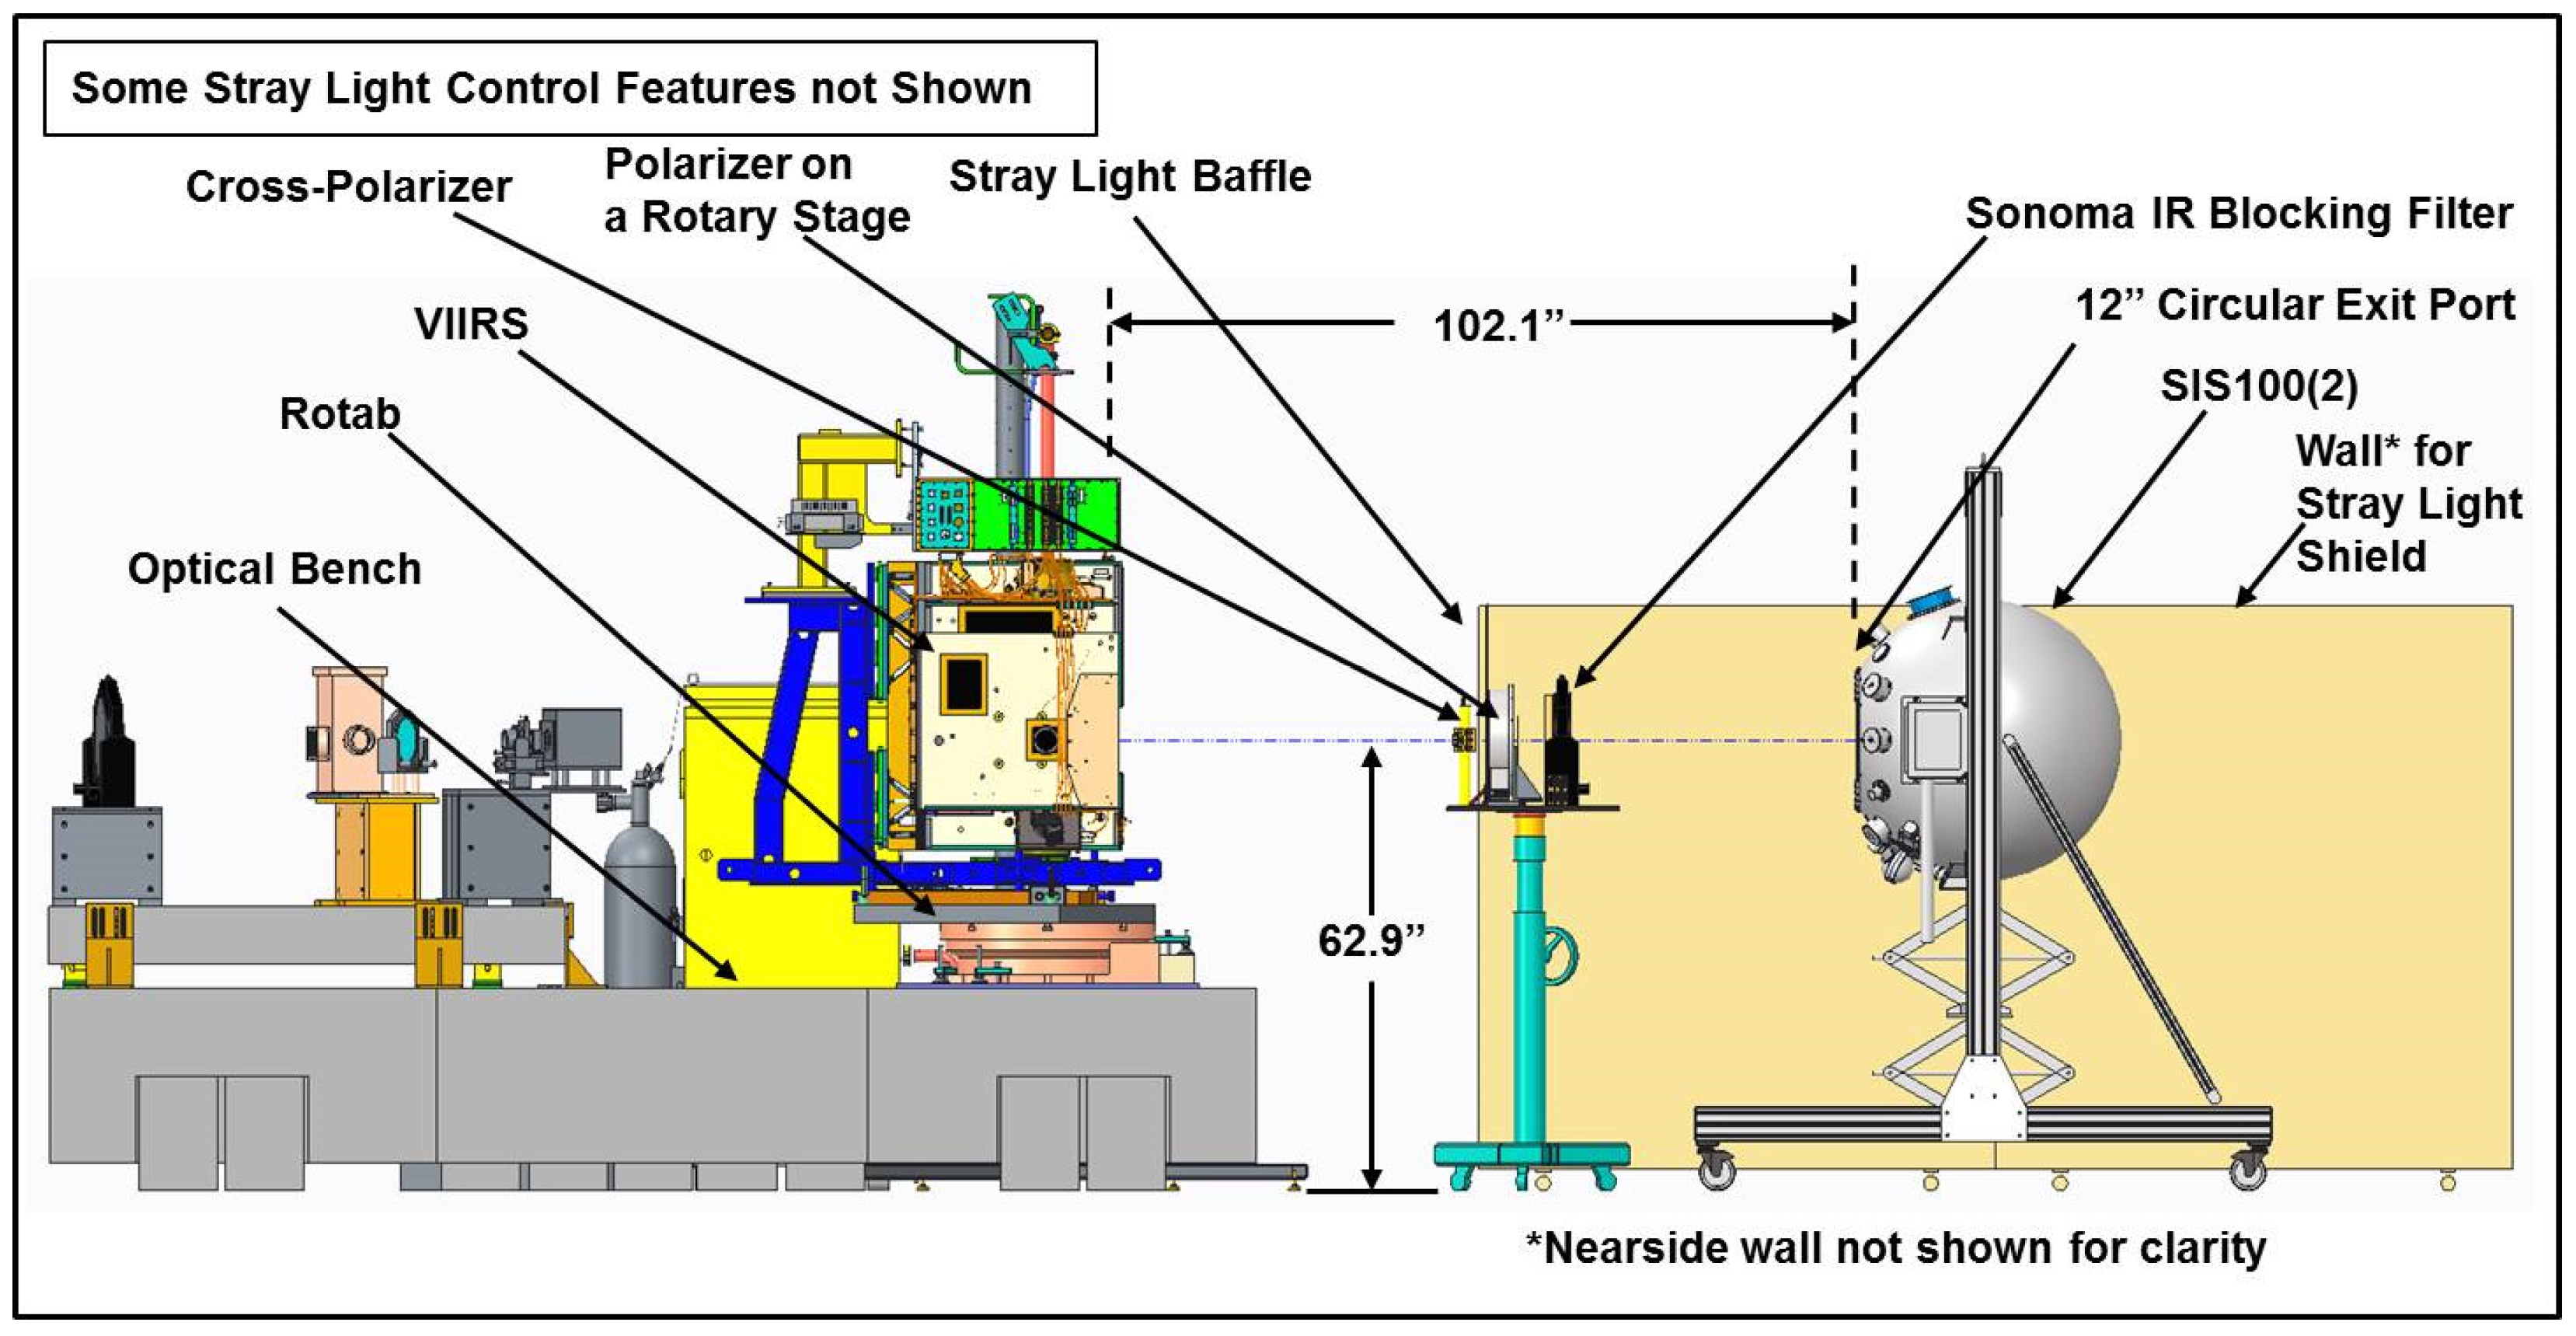
Figure 2.
PTSA setup (right side of the figure) with respect to VIIRS (left side of the figure) during the polarization characterization tests.
Figure 2.
PTSA setup (right side of the figure) with respect to VIIRS (left side of the figure) during the polarization characterization tests.
Figure 3.
PTSA viewed by VIIRS during the JPSS-1 VIIRS polarization sensitivity test illustrating the VIIRS coordinate frame with respect to the rotation geometry of the polarization sheet.
Figure 3.
PTSA viewed by VIIRS during the JPSS-1 VIIRS polarization sensitivity test illustrating the VIIRS coordinate frame with respect to the rotation geometry of the polarization sheet.
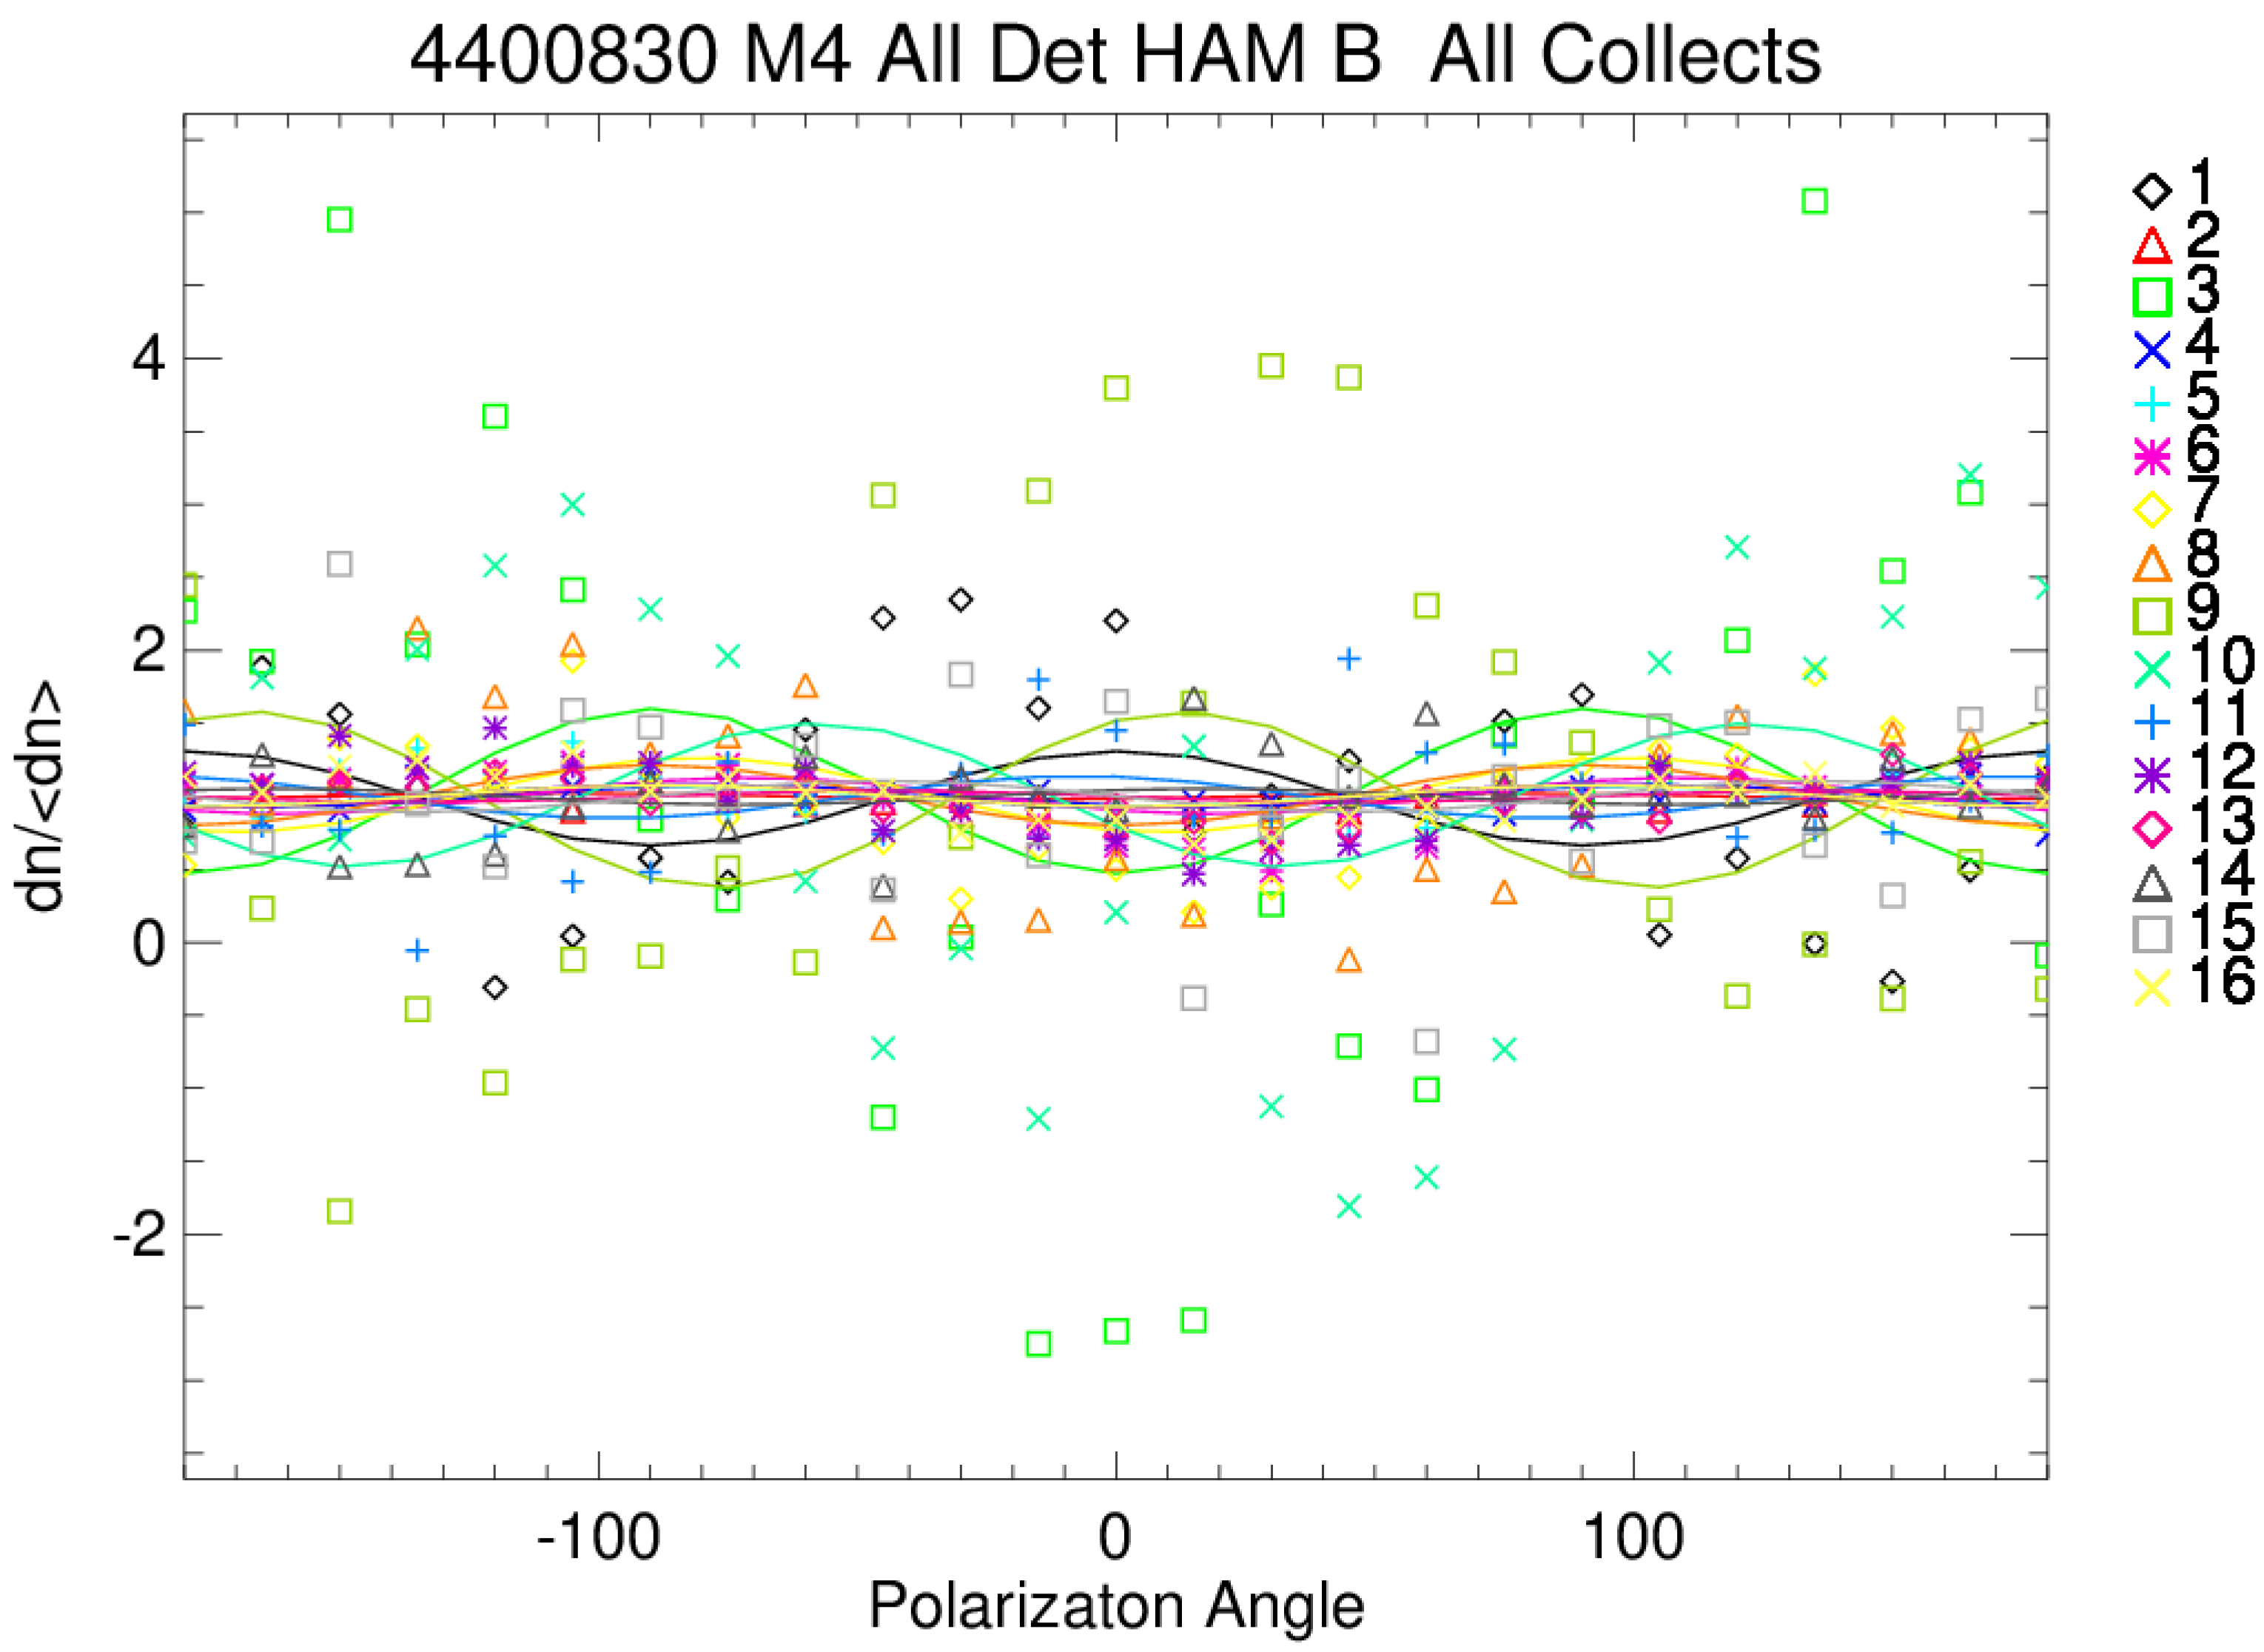
Figure 4.
VIIRS response during dark testing with Fourier fits for Band M4 HAM B all detectors showing that there is very little correlation between the signal (points) and the 2-phipolarization model.
Figure 4.
VIIRS response during dark testing with Fourier fits for Band M4 HAM B all detectors showing that there is very little correlation between the signal (points) and the 2-phipolarization model.
Figure 5.
VIIRS response for Band M1 HAM A all detectors during the cross-polarizer testing phase showing nearly 100% extinction of the signal when the polarization sheet’s transmission axis is orthogonal and nearly 100% transmittance when they are parallel.
Figure 5.
VIIRS response for Band M1 HAM A all detectors during the cross-polarizer testing phase showing nearly 100% extinction of the signal when the polarization sheet’s transmission axis is orthogonal and nearly 100% transmittance when they are parallel.
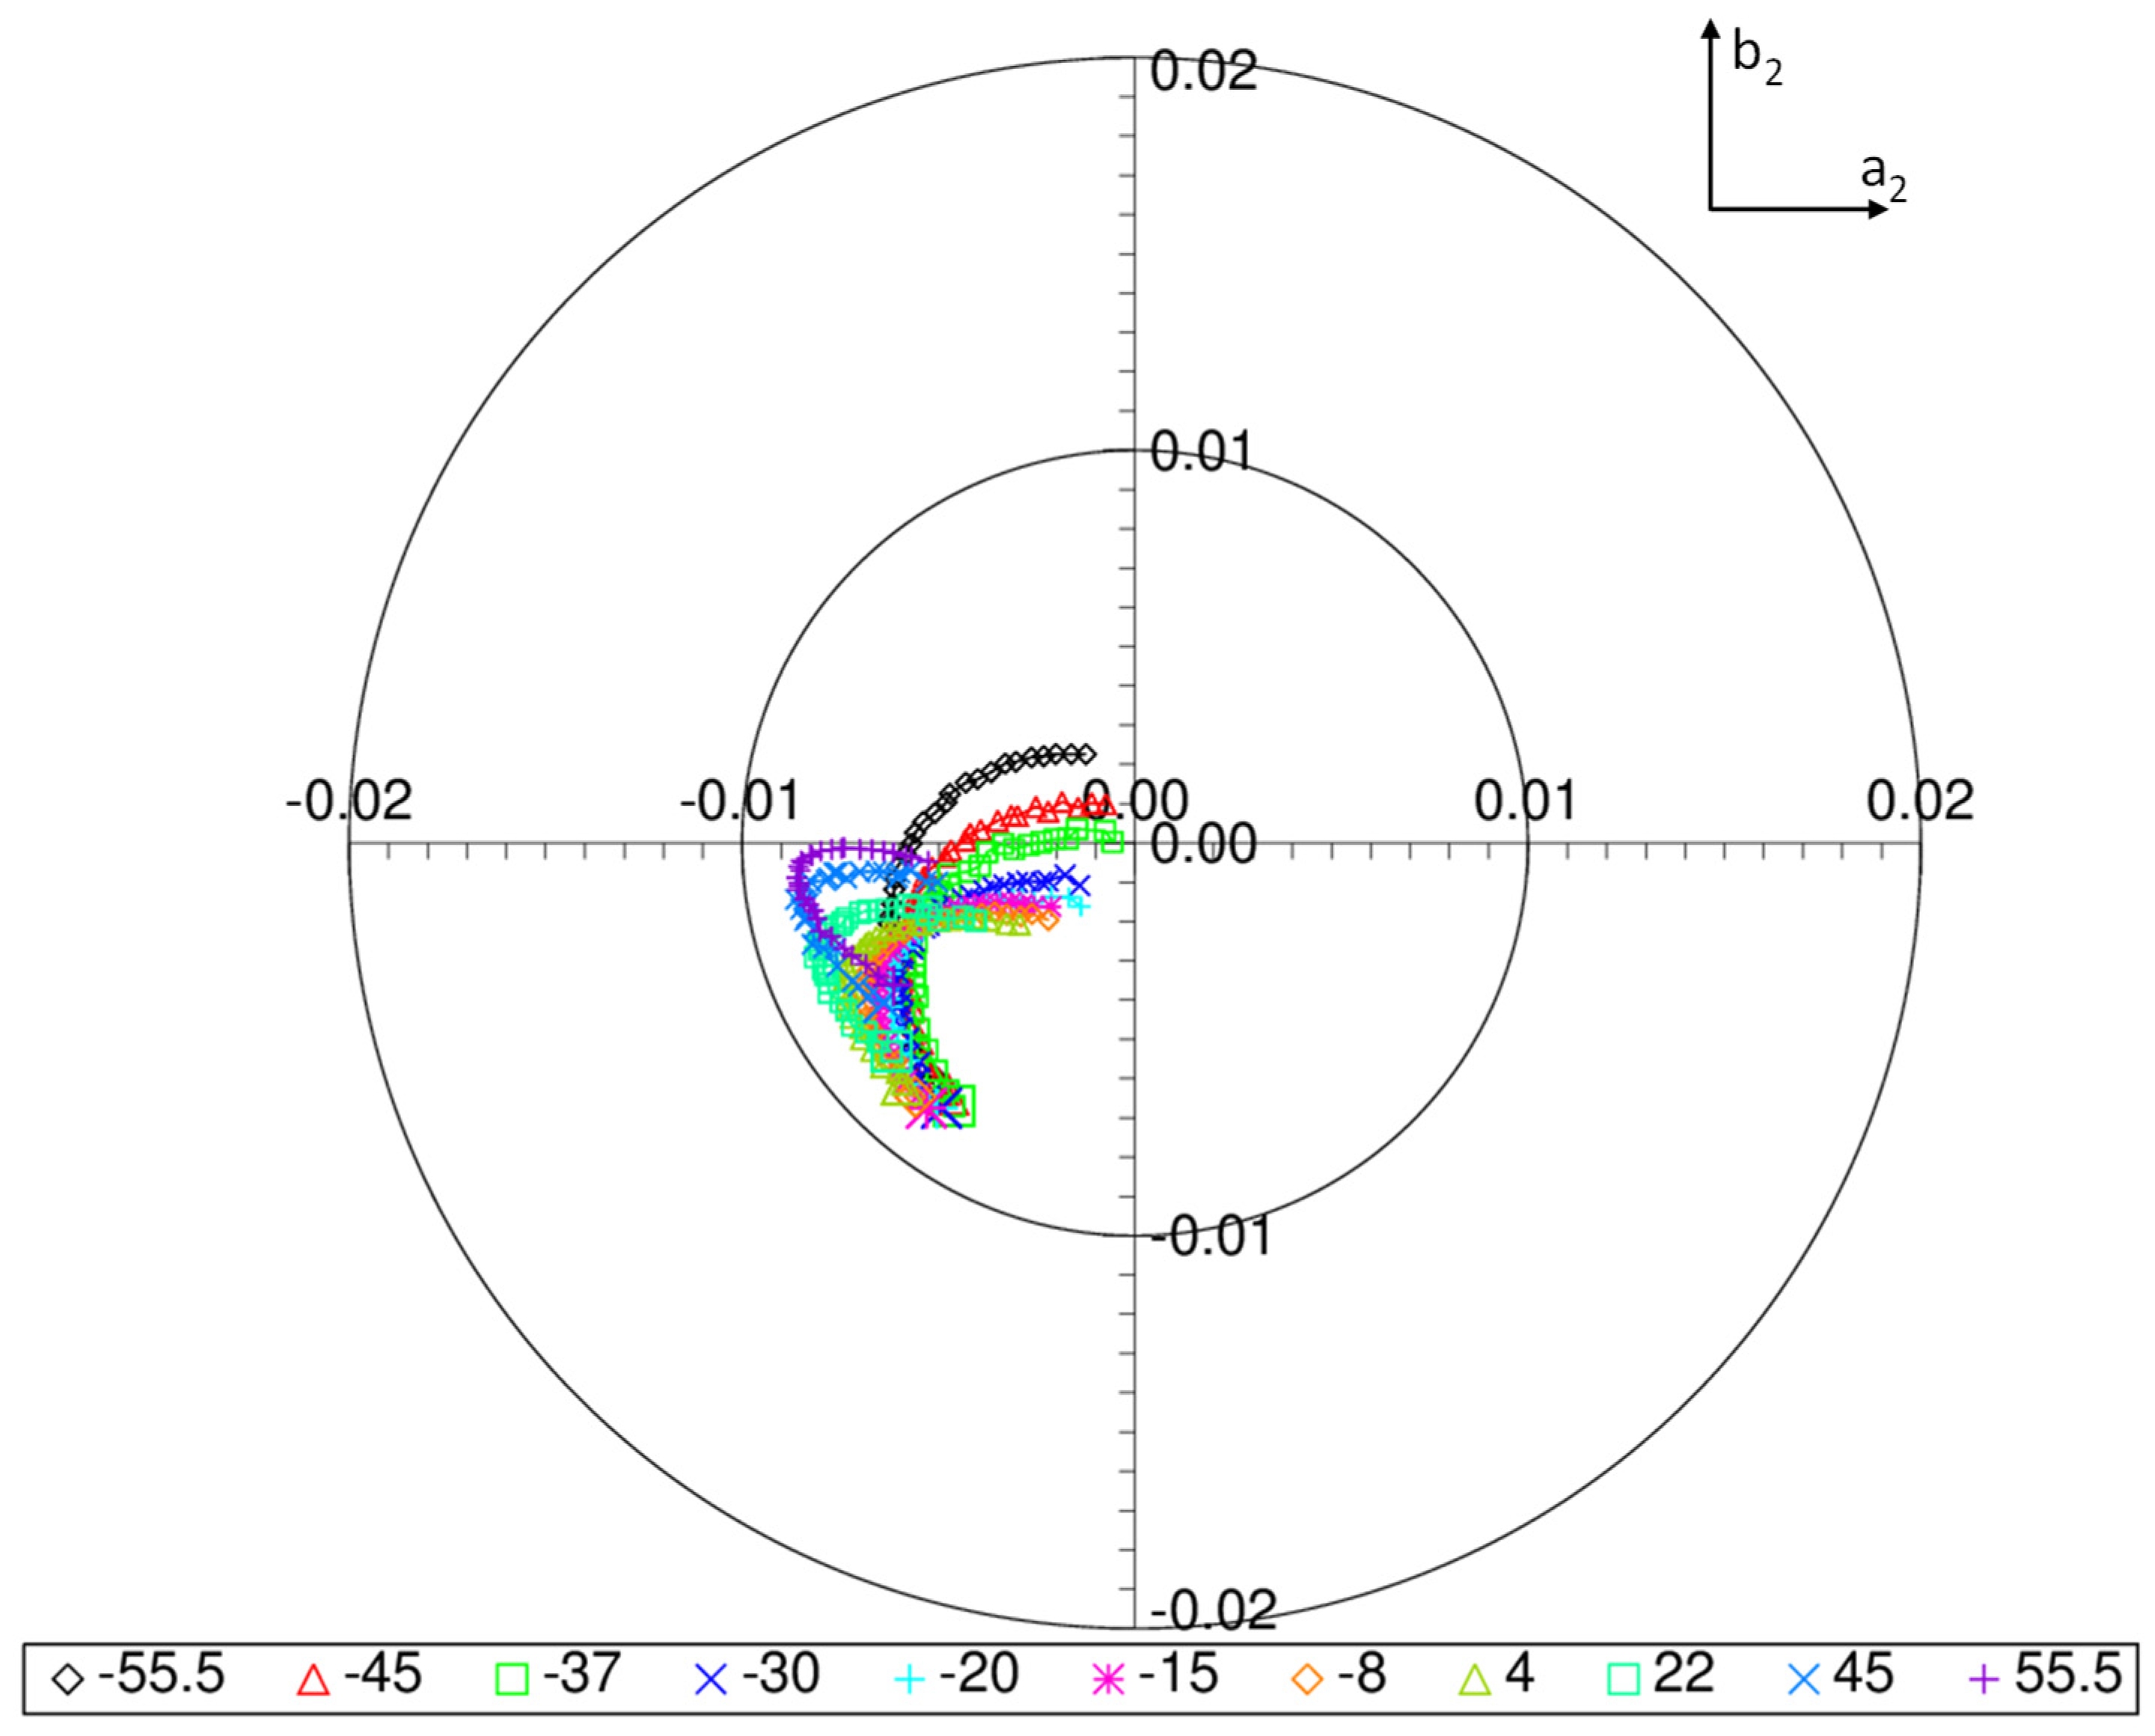
Figure 6.
Band M1 HAM side A polarization sensitivity polar plot for JPSS-2 showing the amplitude and phase of each detector (points) and scan angles (different colors). The larger points correspond to detector 1 with the connected points within a given color monotonically increasing from detector 1 (large symbol) to 16 (farthest from detector 1). The radius from the center of the polar plot to the point corresponds to the magnitude of the polarization amplitude while half the angle from the positive x-axis to the point is the phase.
Figure 7.
Band M1 HAM side B polarization sensitivity polar plot for JPSS-2 showing each detector’s amplitude (radius to the point) and phase (half angle to point from the +x-axis) for all detectors (large symbols are detector 1) for each scan angle (different color points).
Figure 7.
Band M1 HAM side B polarization sensitivity polar plot for JPSS-2 showing each detector’s amplitude (radius to the point) and phase (half angle to point from the +x-axis) for all detectors (large symbols are detector 1) for each scan angle (different color points).
Figure 8.
Band M2 HAM side A polarization sensitivity polar plot JPSS-2 showing each detector’s amplitude (radius to the point) and phase (half angle to point from the +x-axis) for all detectors (large symbols are detector 1) for each scan angle (different color points).
Figure 8.
Band M2 HAM side A polarization sensitivity polar plot JPSS-2 showing each detector’s amplitude (radius to the point) and phase (half angle to point from the +x-axis) for all detectors (large symbols are detector 1) for each scan angle (different color points).
Figure 9.
Band M3 HAM side A polarization sensitivity polar plot for JPSS-2 showing each detector’s amplitude (radius to the point) and phase (half angle to point from the +x-axis) for all detectors (large symbols are detector 1) for each scan angle (different color points).
Figure 9.
Band M3 HAM side A polarization sensitivity polar plot for JPSS-2 showing each detector’s amplitude (radius to the point) and phase (half angle to point from the +x-axis) for all detectors (large symbols are detector 1) for each scan angle (different color points).
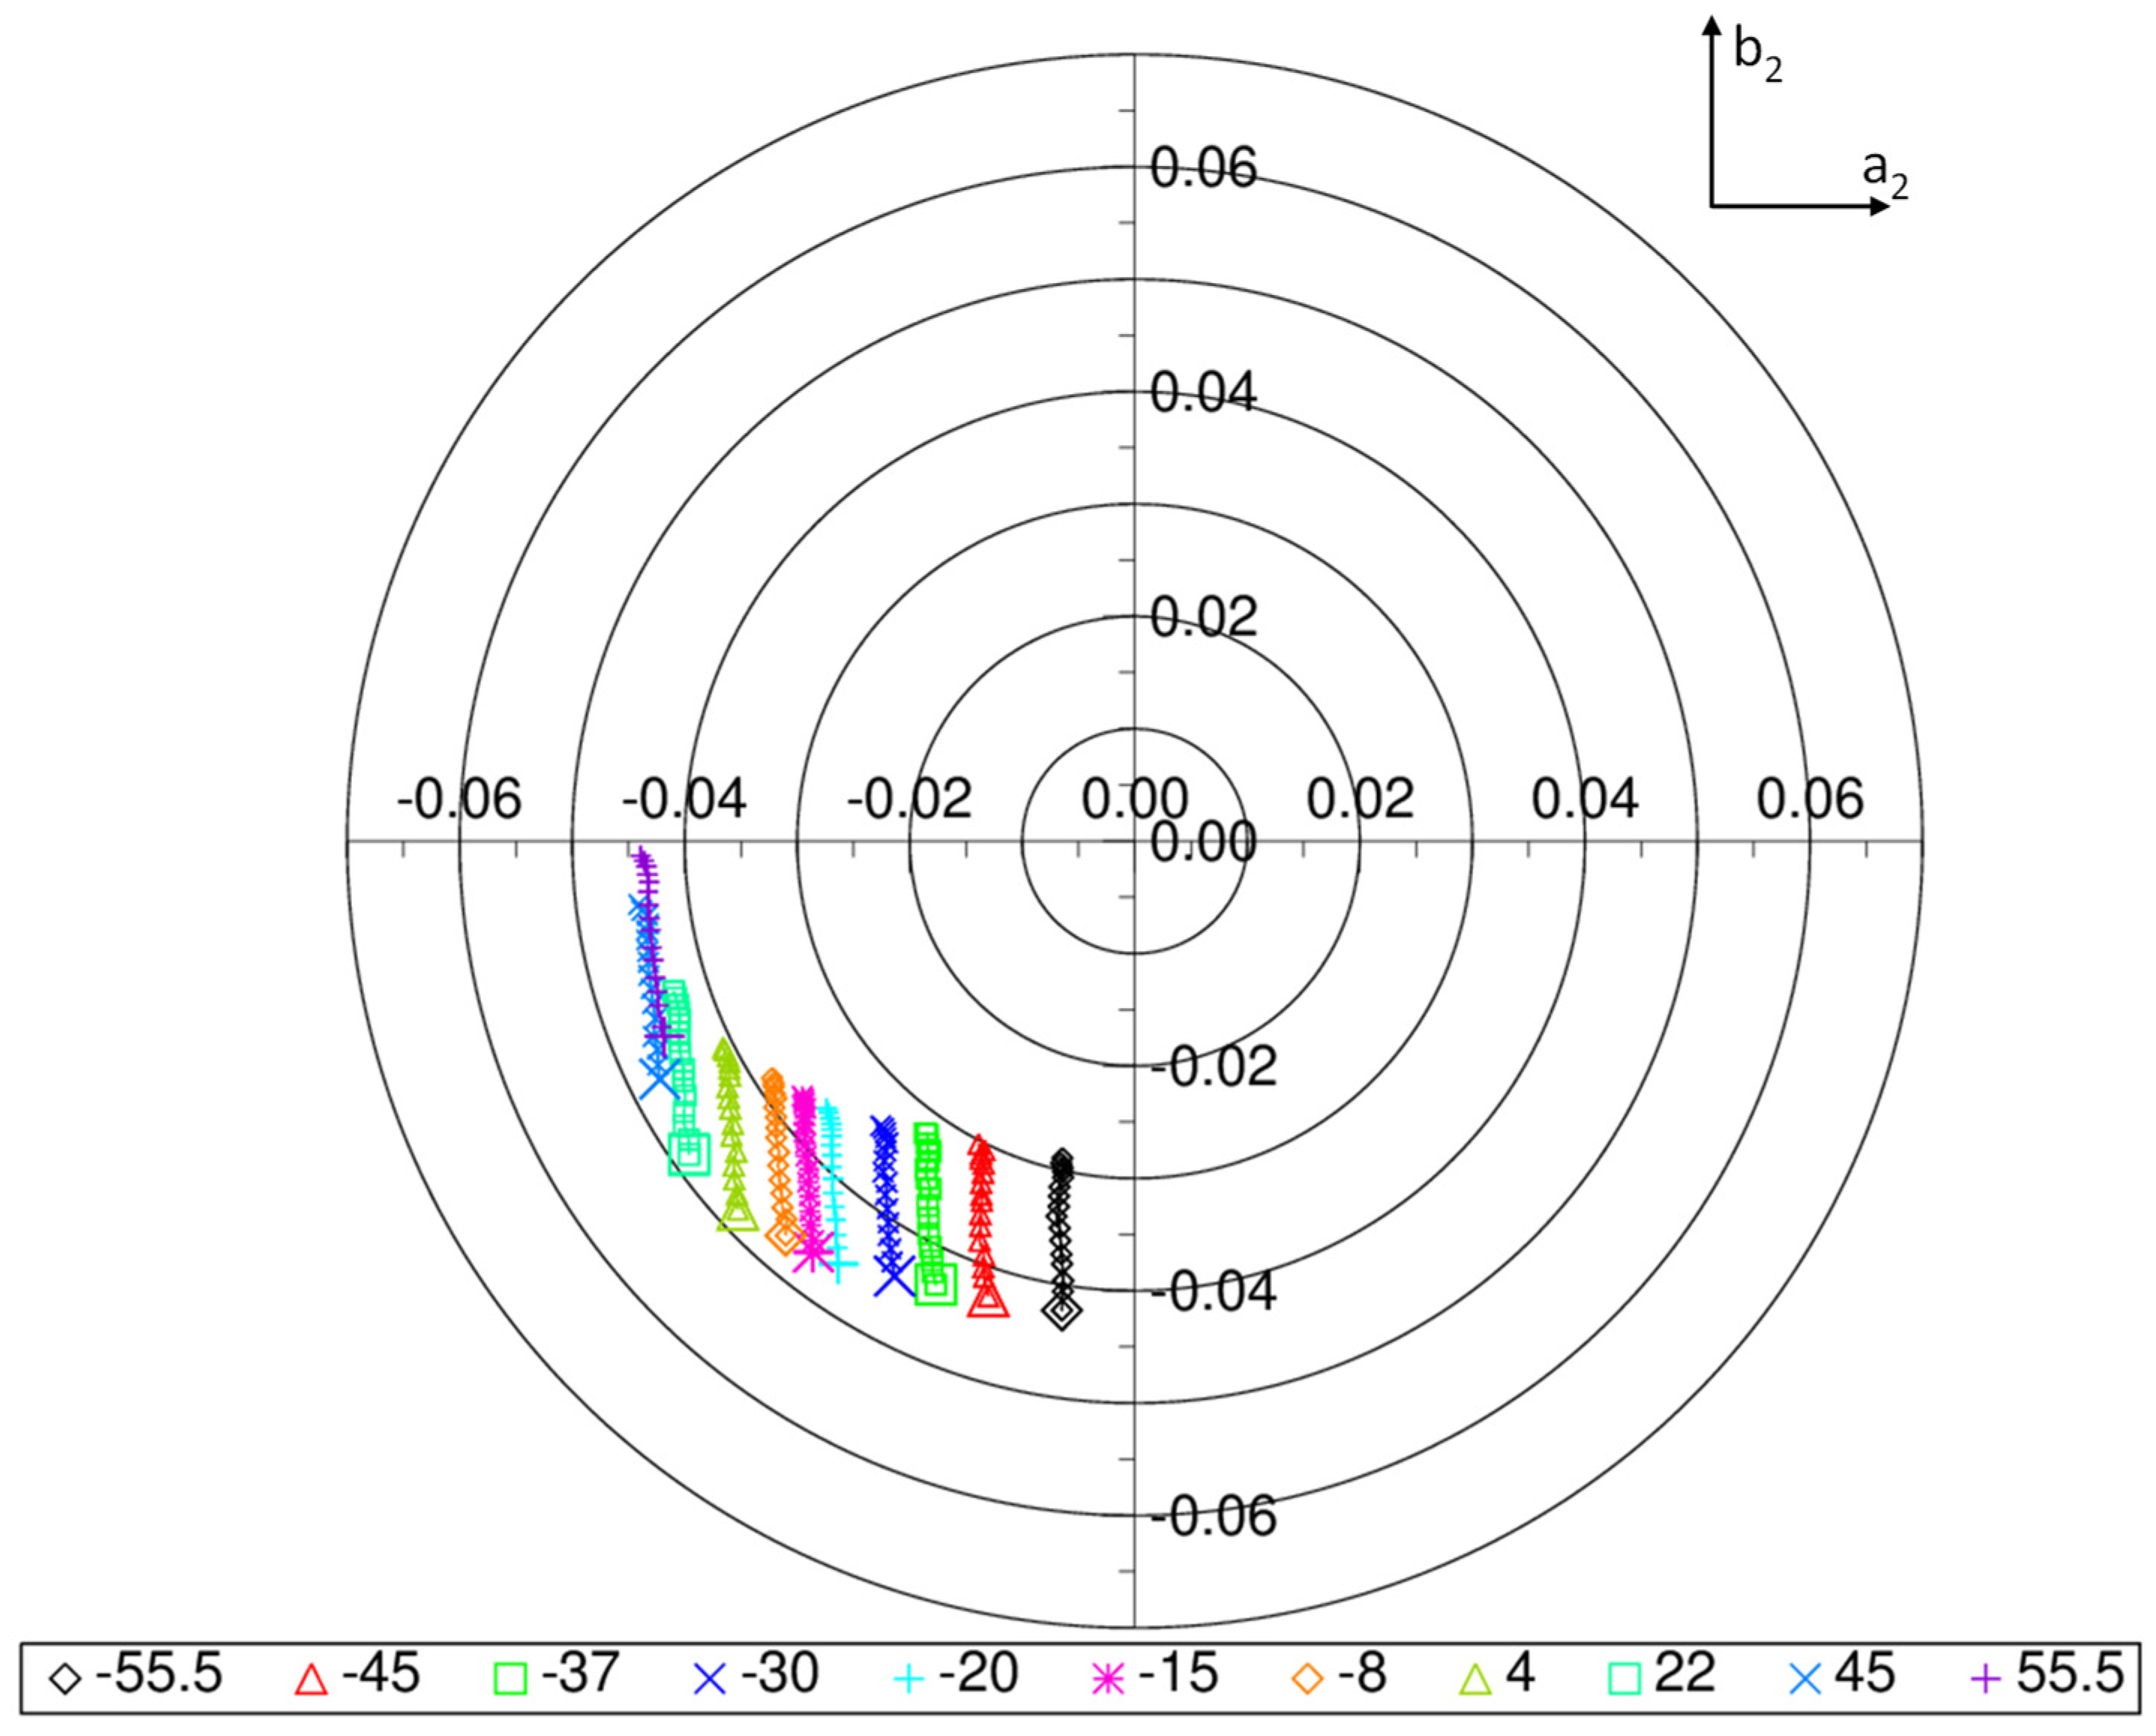
Figure 10.
Band M4 HAM side A polarization sensitivity polar plot for JPSS-2 showing each detector’s amplitude (radius to the point) and phase (half angle to point from the +x-axis) for all detectors (large symbols are detector 1) for each scan angle (different color points).
Figure 10.
Band M4 HAM side A polarization sensitivity polar plot for JPSS-2 showing each detector’s amplitude (radius to the point) and phase (half angle to point from the +x-axis) for all detectors (large symbols are detector 1) for each scan angle (different color points).
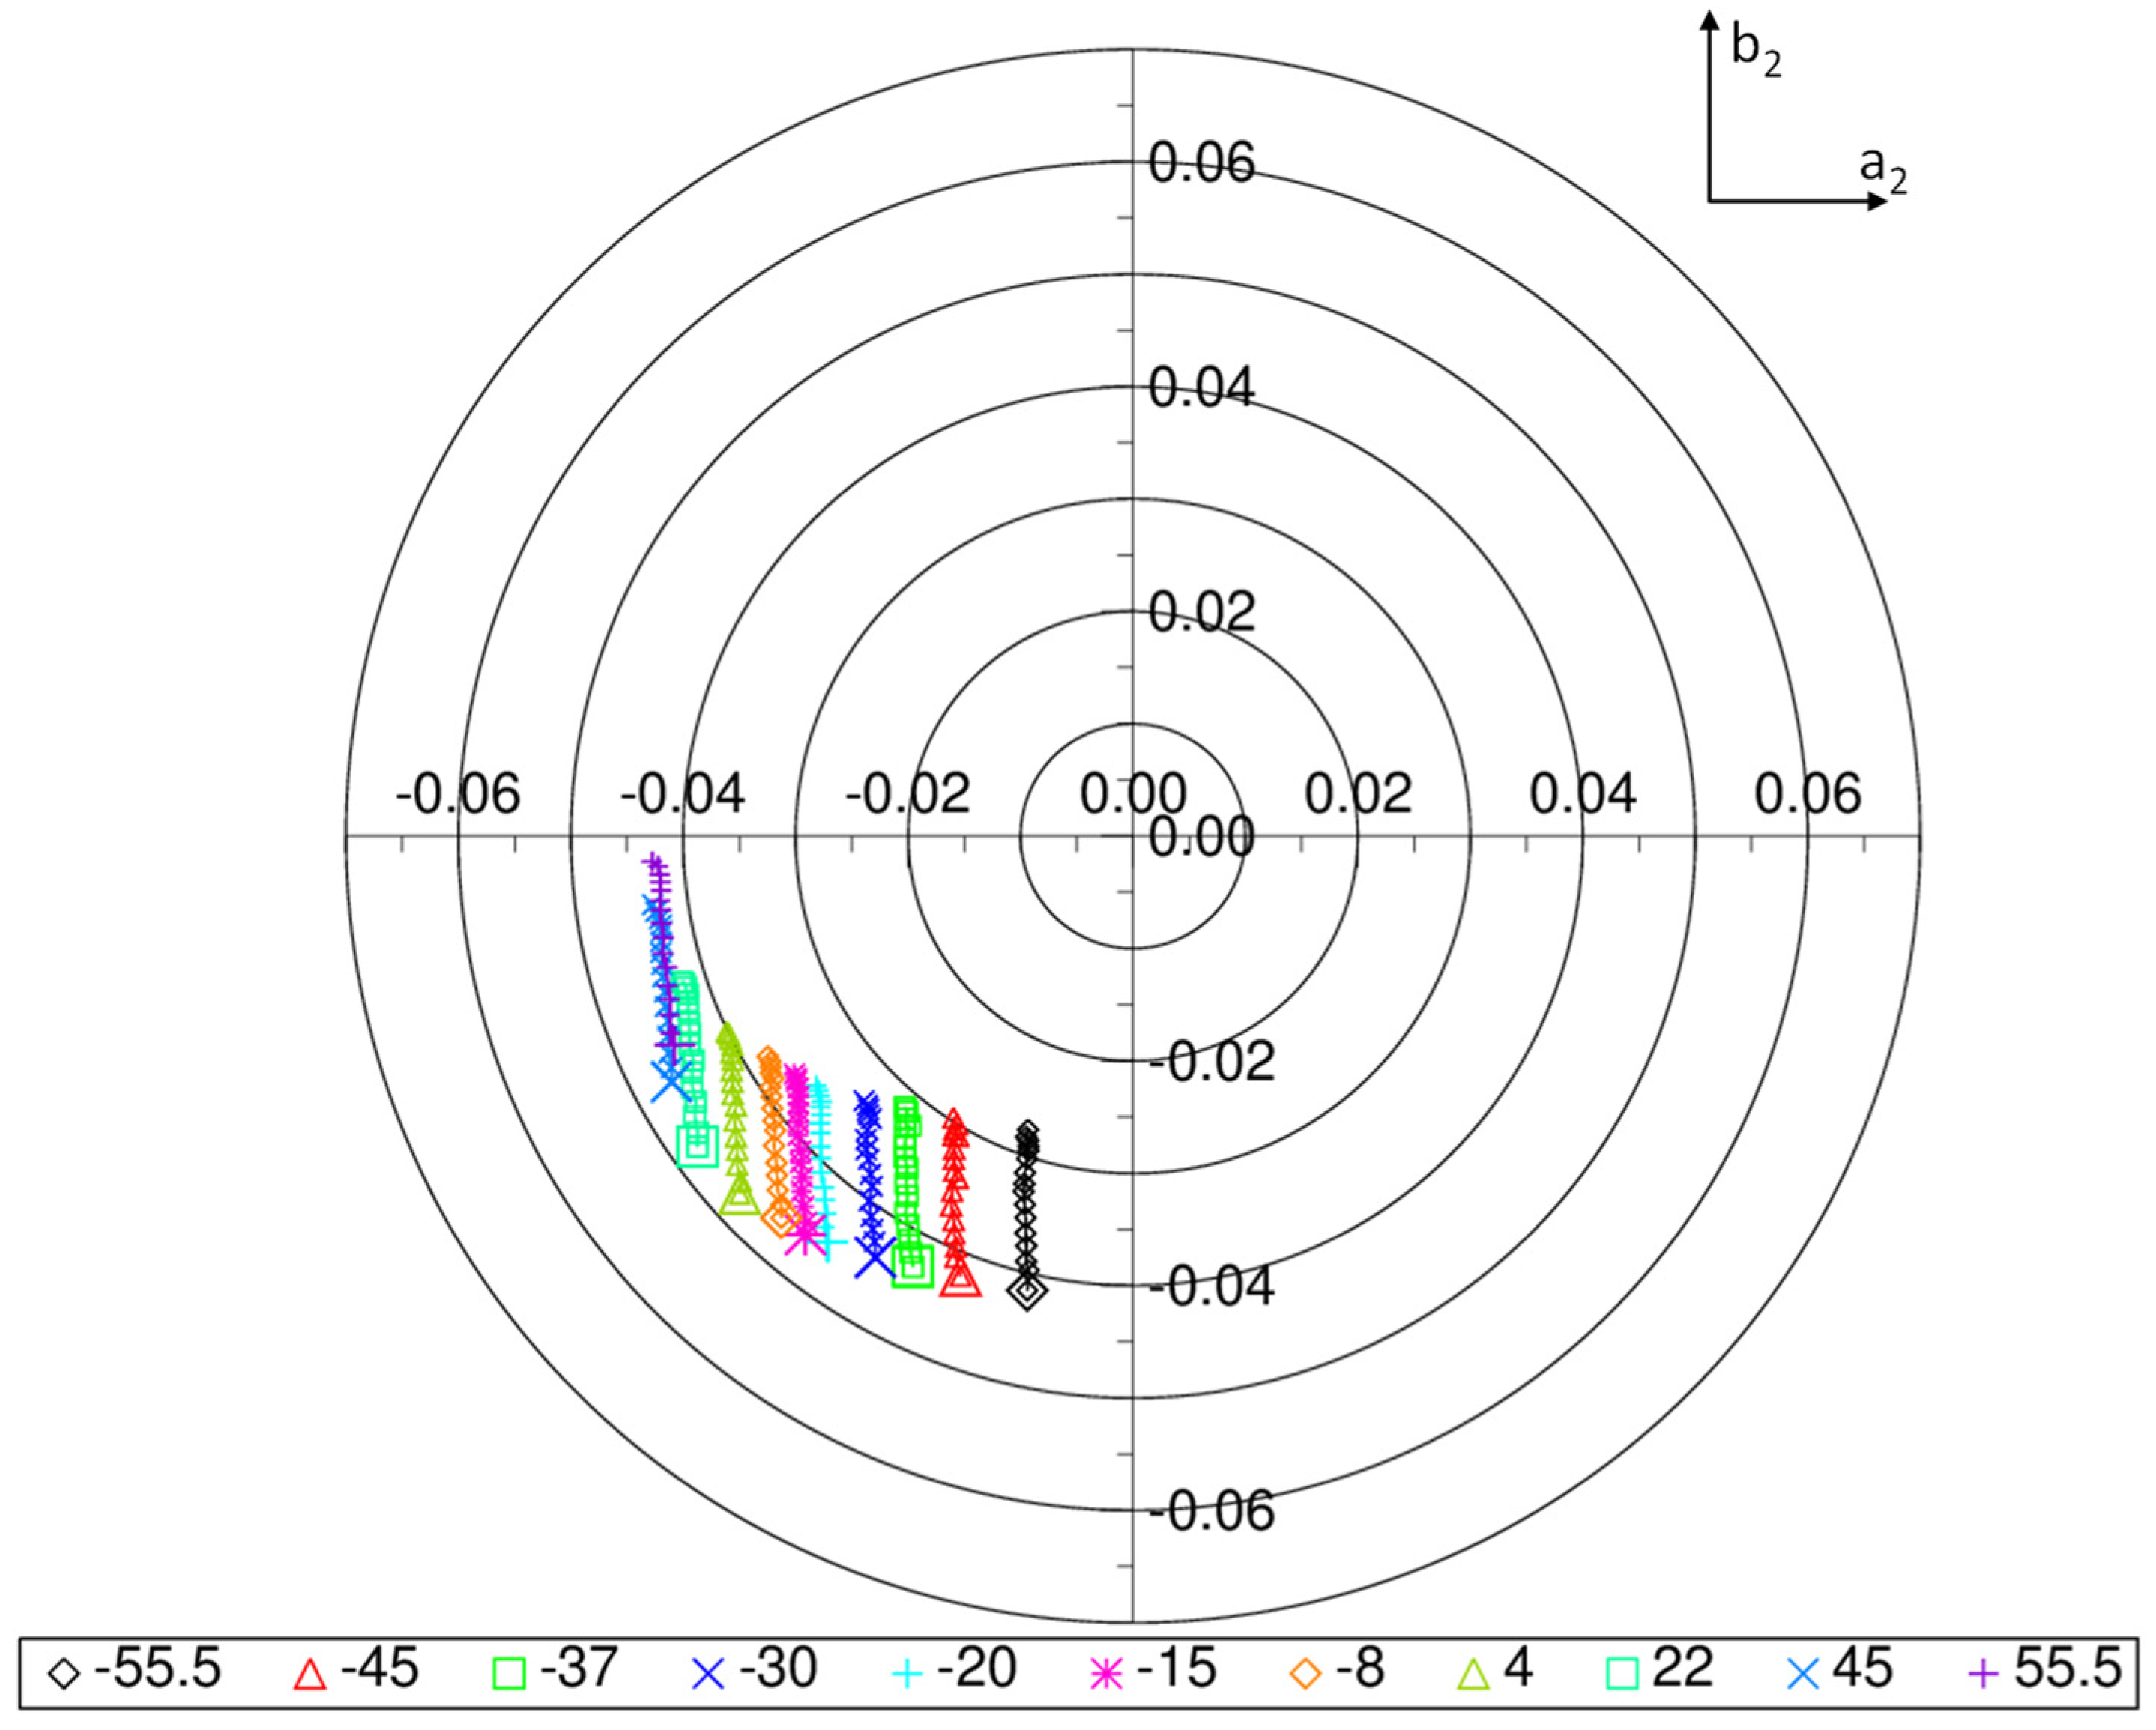
Figure 11.
Band M5 HAM side A polarization sensitivity polar plot for JPSS-2 showing each detector’s amplitude (radius to the point) and phase (half angle to point from the +x-axis) for all detectors (large symbols are detector 1) for each scan angle (different color points).
Figure 11.
Band M5 HAM side A polarization sensitivity polar plot for JPSS-2 showing each detector’s amplitude (radius to the point) and phase (half angle to point from the +x-axis) for all detectors (large symbols are detector 1) for each scan angle (different color points).
Figure 12.
Band M6 HAM side A polarization sensitivity polar plot for JPSS-2 showing each detector’s amplitude (radius to the point) and phase (half angle to point from the +x-axis) for all detectors (large symbols are detector 1) for each scan angle (different color points).
Figure 12.
Band M6 HAM side A polarization sensitivity polar plot for JPSS-2 showing each detector’s amplitude (radius to the point) and phase (half angle to point from the +x-axis) for all detectors (large symbols are detector 1) for each scan angle (different color points).
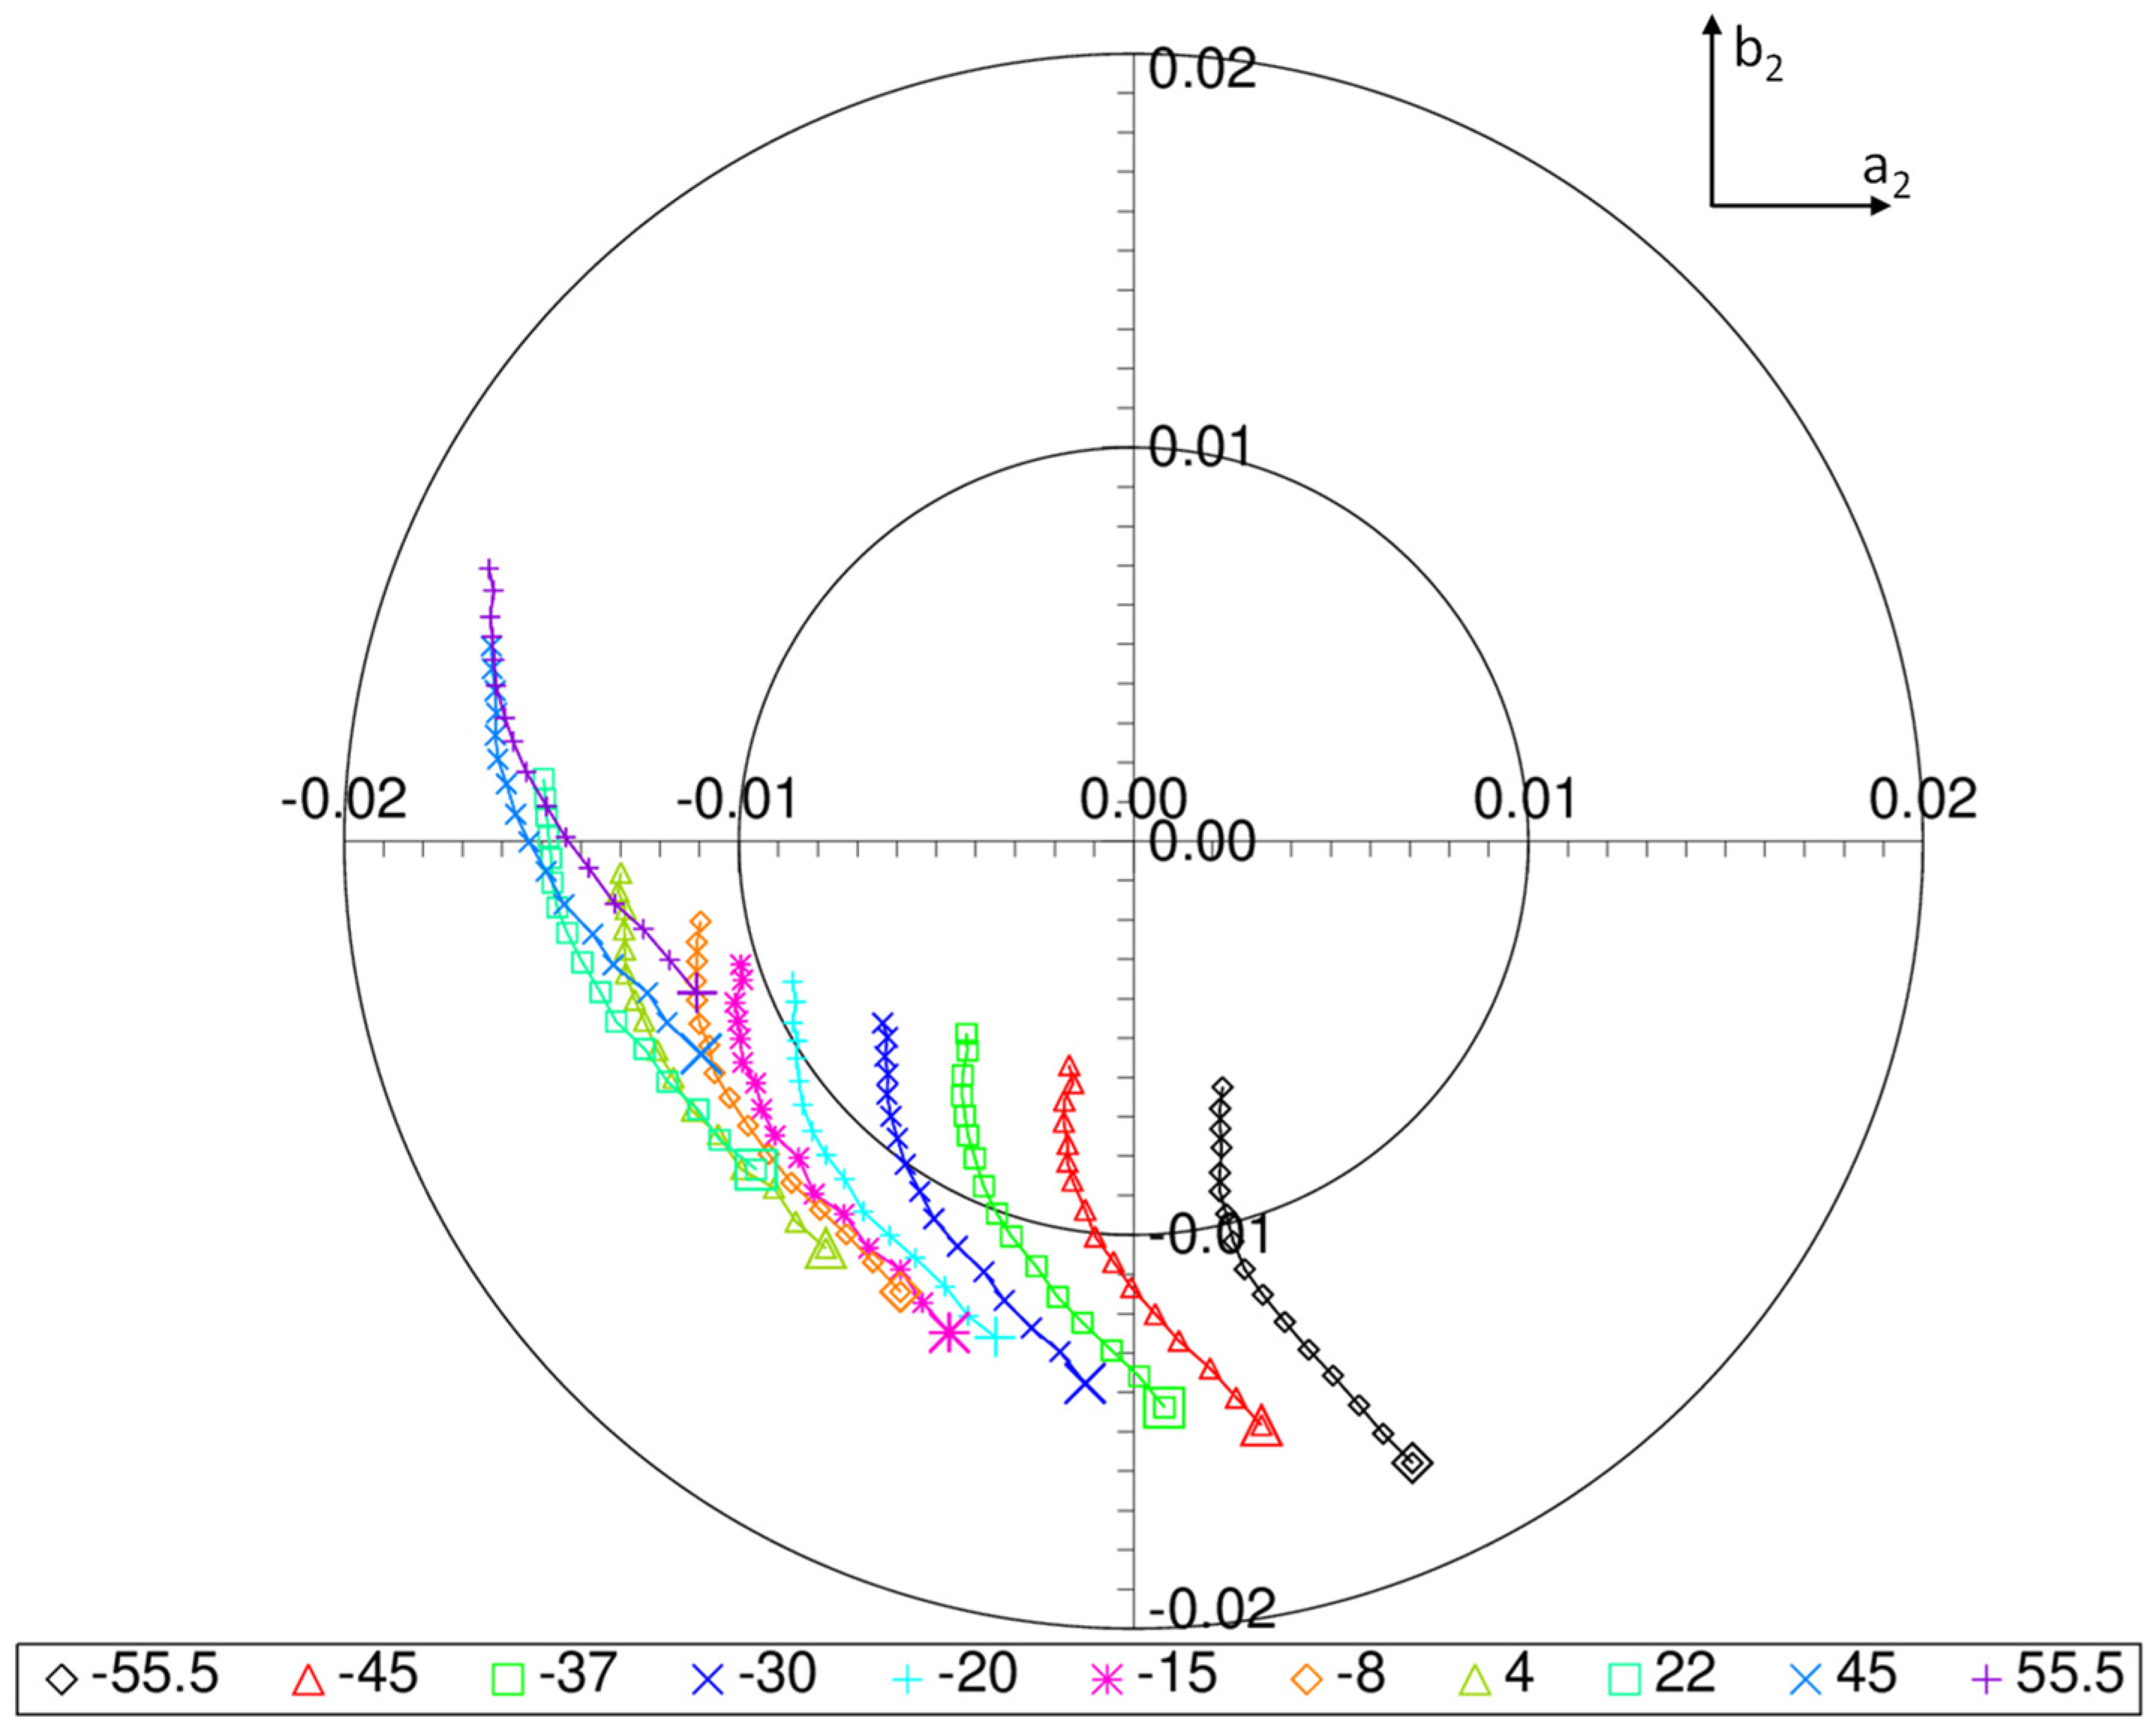
Figure 13.
Band M7 HAM side A polarization sensitivity polar plot for JPSS-2 showing each detector’s amplitude (radius to the point) and phase (half angle to point from the +x-axis) for all detectors (large symbols are detector 1) for each scan angle (different color points).
Figure 13.
Band M7 HAM side A polarization sensitivity polar plot for JPSS-2 showing each detector’s amplitude (radius to the point) and phase (half angle to point from the +x-axis) for all detectors (large symbols are detector 1) for each scan angle (different color points).
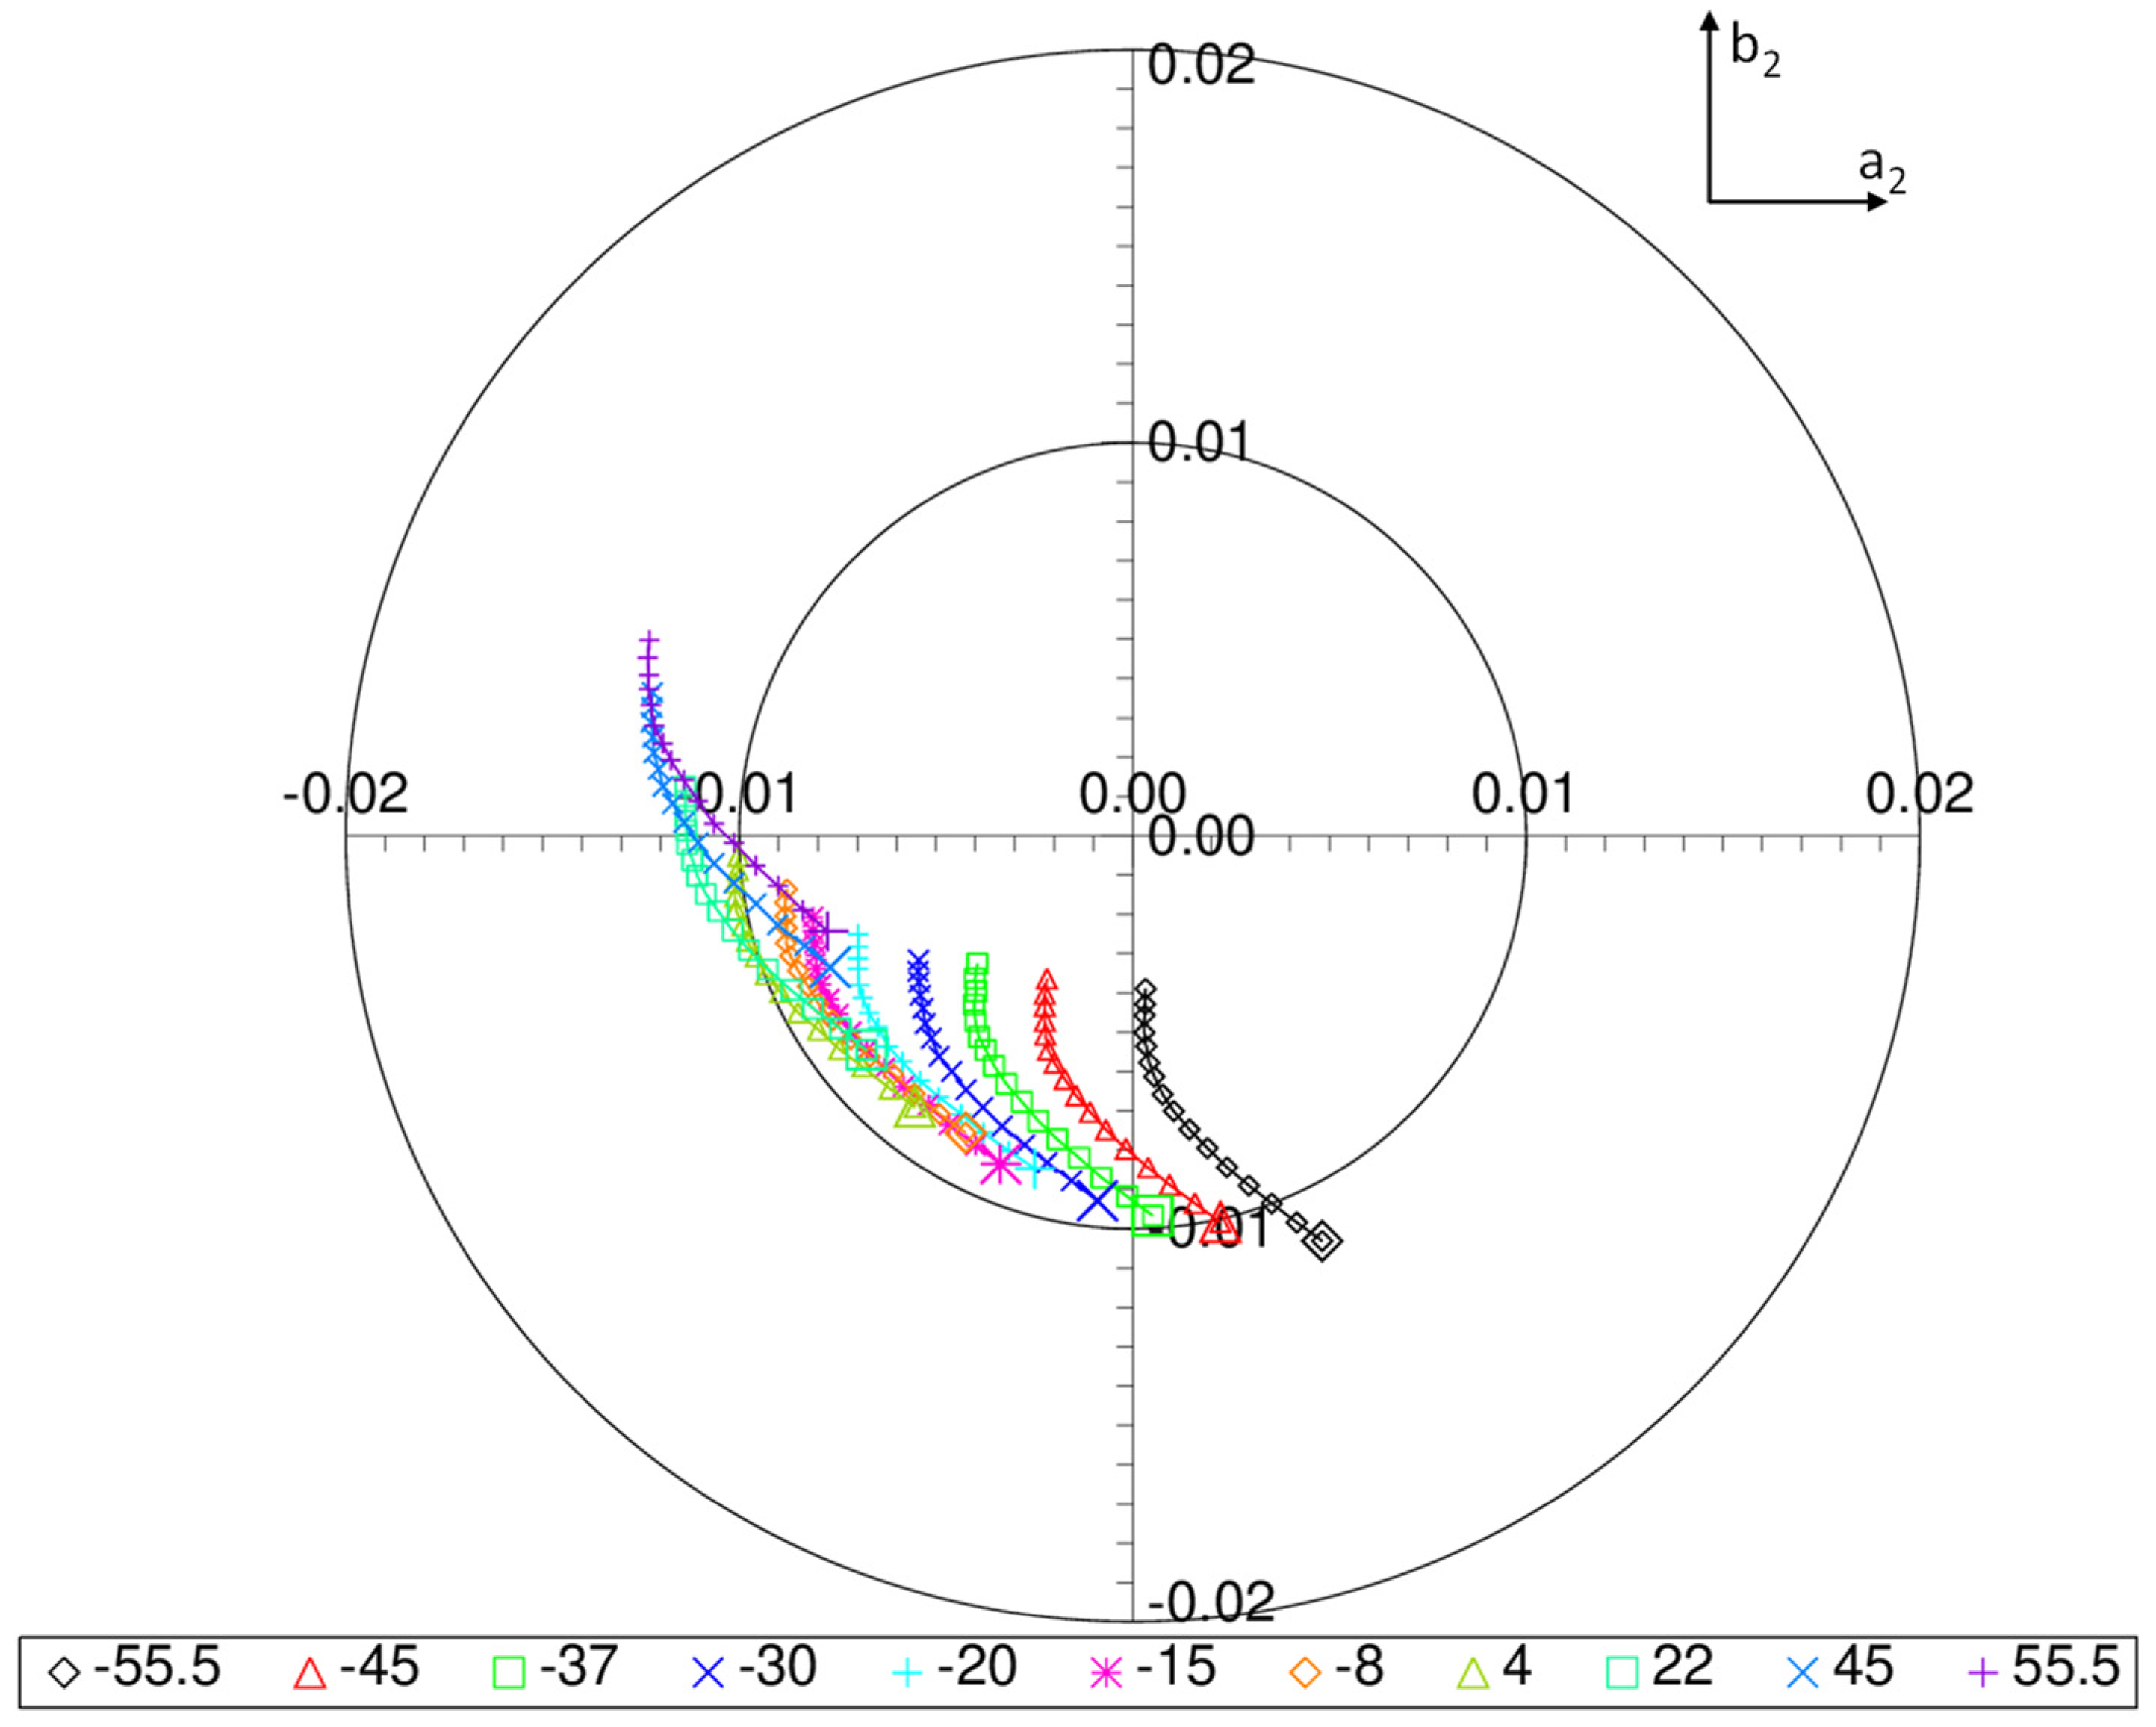
Figure 14.
Band I1 HAM side A polarization sensitivity polar plot for JPSS-2 showing each detector’s amplitude (radius to the point) and phase (half angle to point from the +x-axis) for all detectors (large symbols are detector 1) for each scan angle (different color points).
Figure 14.
Band I1 HAM side A polarization sensitivity polar plot for JPSS-2 showing each detector’s amplitude (radius to the point) and phase (half angle to point from the +x-axis) for all detectors (large symbols are detector 1) for each scan angle (different color points).
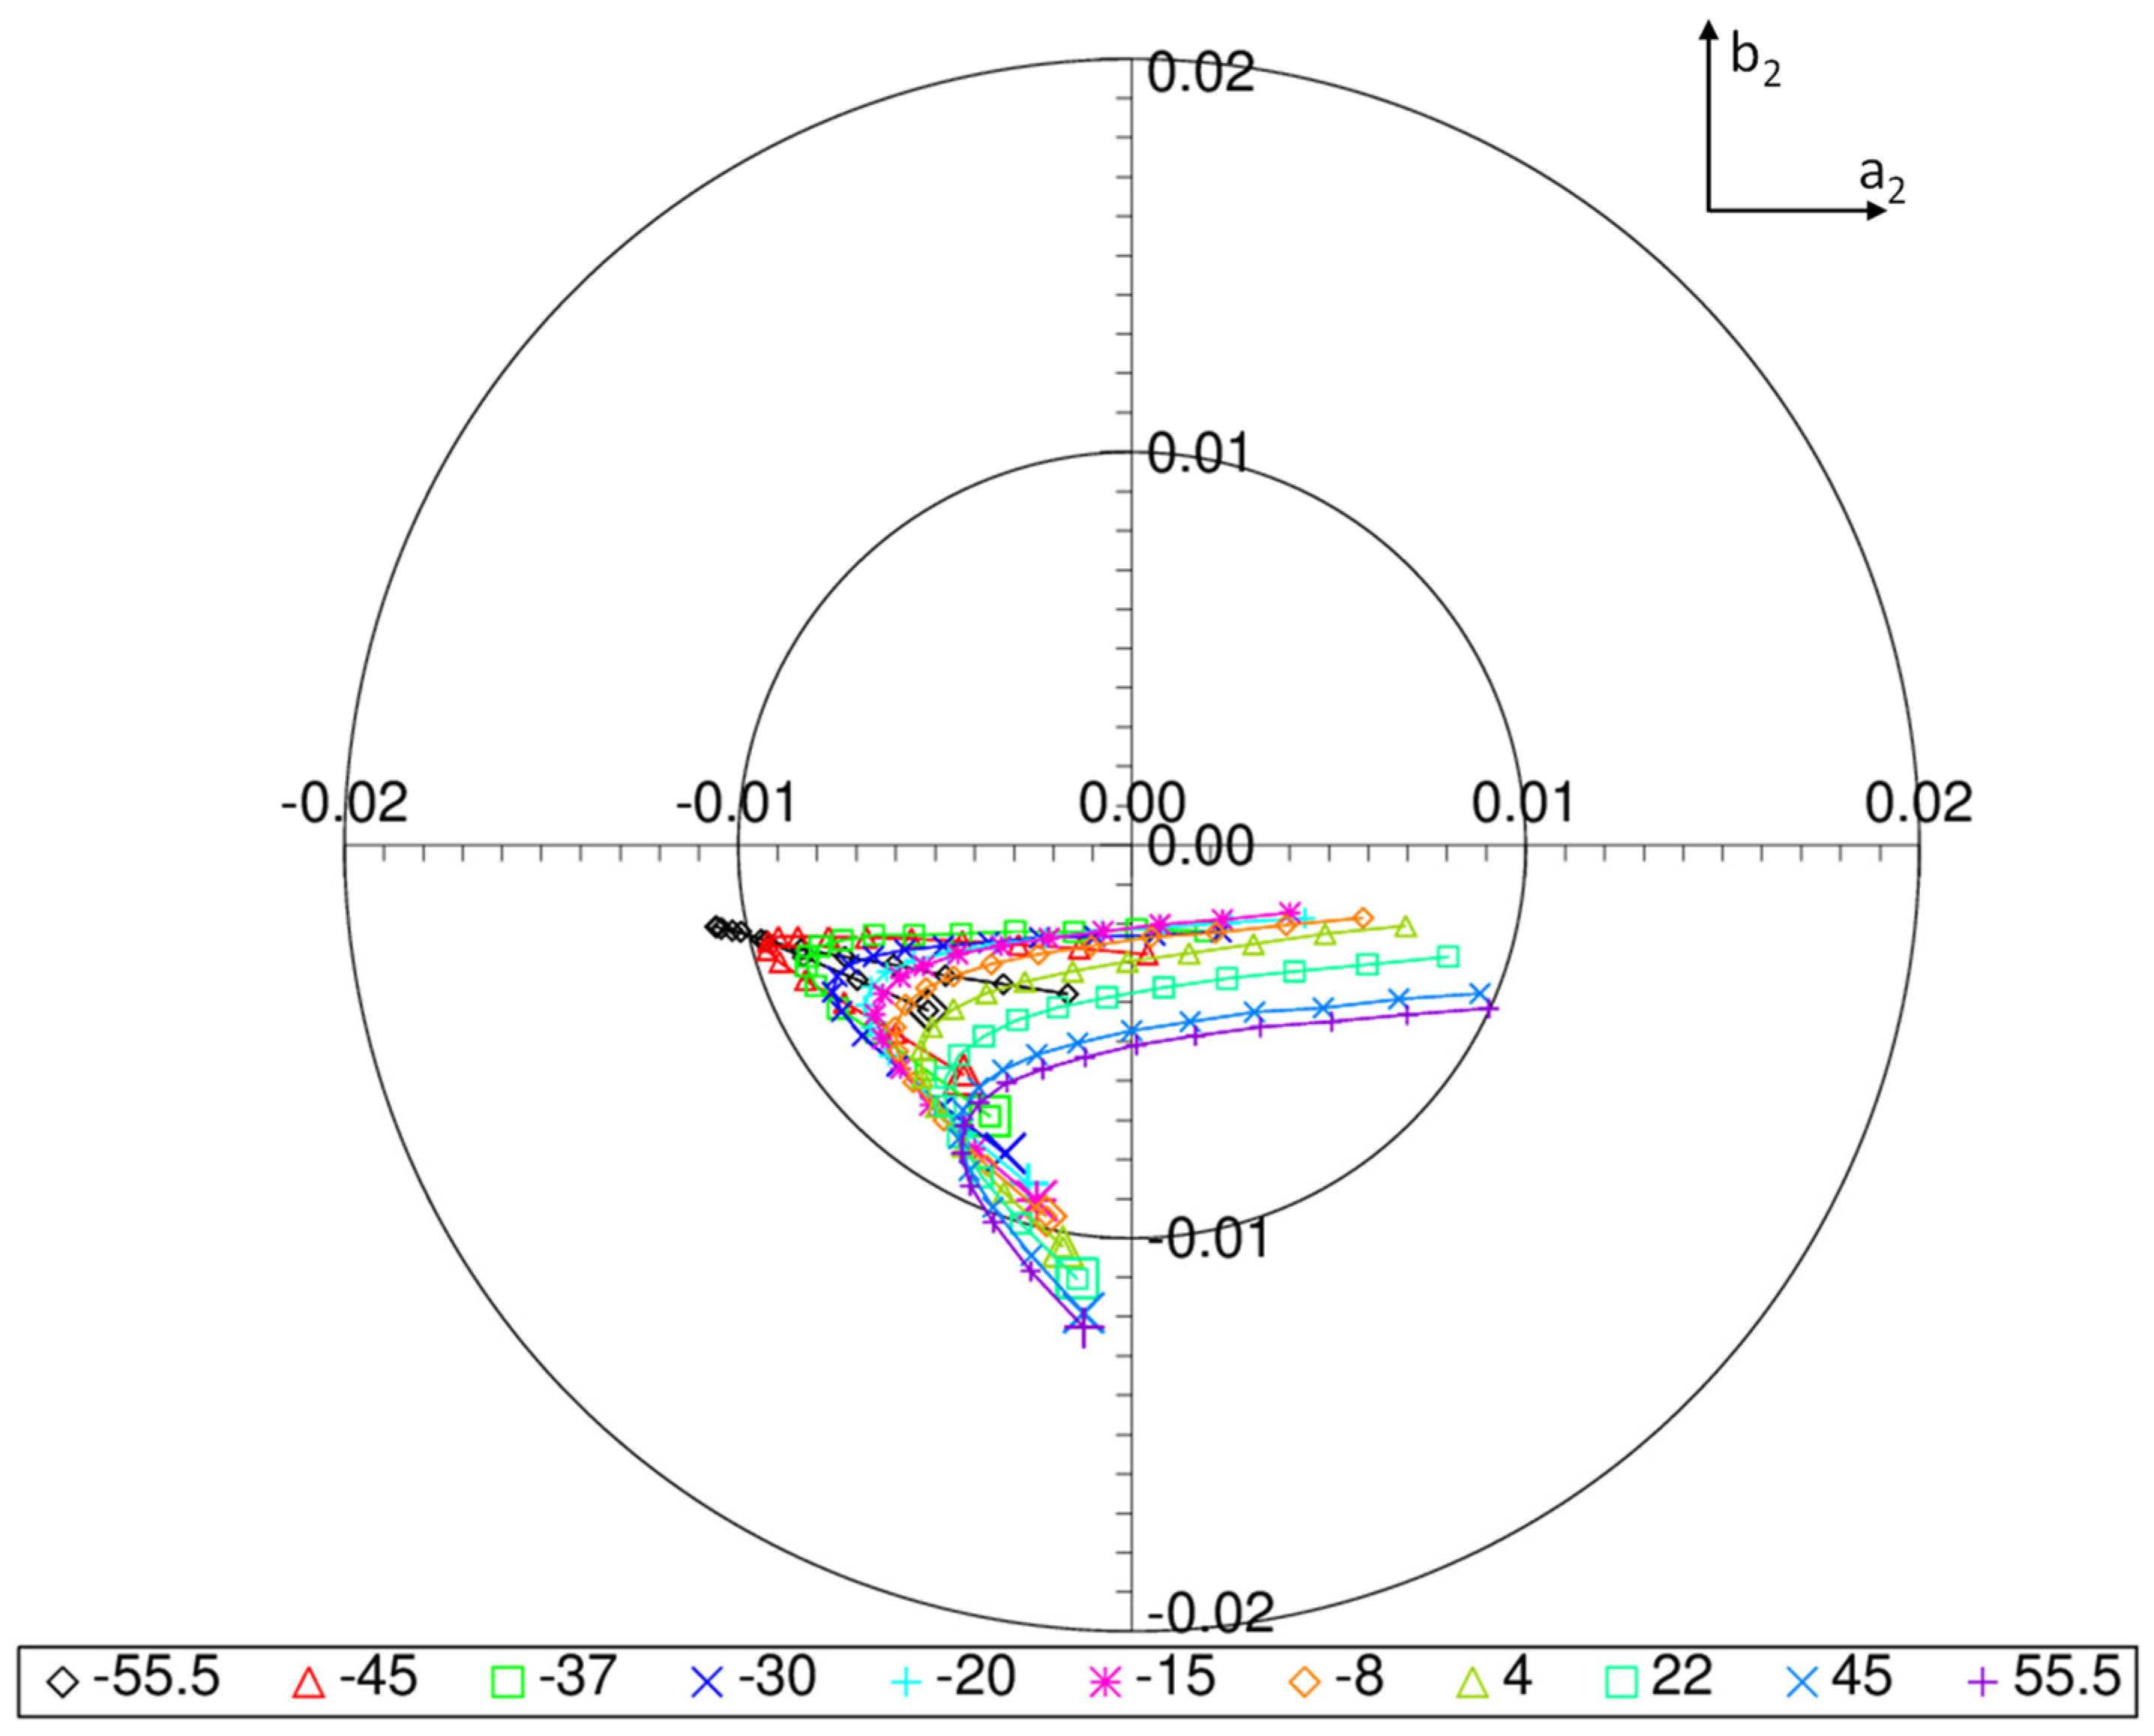
Figure 15.
Band I2 HAM side A polarization sensitivity polar plot for JPSS-2 showing each detector’s amplitude (radius to the point) and phase (half angle to point from the +x-axis) for all detectors (large symbols are detector 1) for each scan angle (different color points).
Figure 15.
Band I2 HAM side A polarization sensitivity polar plot for JPSS-2 showing each detector’s amplitude (radius to the point) and phase (half angle to point from the +x-axis) for all detectors (large symbols are detector 1) for each scan angle (different color points).
Figure 16.
Estimated uncertainty tree for PST polarization sensitivity test that includes error terms from both the sensor and test source used during the characterization.
Figure 16.
Estimated uncertainty tree for PST polarization sensitivity test that includes error terms from both the sensor and test source used during the characterization.
Table 1.
VIIRS polarization sensitivity requirements for each VNIR band with the center wavelength as well as maximum allowable polarization amplitude and characterization uncertainty listed.
Table 1.
VIIRS polarization sensitivity requirements for each VNIR band with the center wavelength as well as maximum allowable polarization amplitude and characterization uncertainty listed.
| Band | Wavelength (nm) | Maximum Amplitude for ±45° Scan Angle | Characterization Uncertainty Requirement in Percent |
|---|
| M1 | 412 | 3.0 | 0.5 |
| M2 | 445 | 2.5 | 0.5 |
| M3 | 488 | 2.5 | 0.5 |
| M4 | 555 | 2.5 | 0.5 |
| M5 | 672 | 2.5 | 0.5 |
| M6 | 746 | 2.5 | 0.5 |
| M7 | 865 | 3.0 | 0.5 |
| I1 | 640 | 2.5 | 0.5 |
| I2 | 865 | 3.0 | 0.5 |
Table 2.
2 Signal and correlation information for the dark and lollipop portions of the test for each VNIR band showing how well the straylight signal correlated with the 2-phi polarization model used in the PST analysis.
Table 2.
2 Signal and correlation information for the dark and lollipop portions of the test for each VNIR band showing how well the straylight signal correlated with the 2-phi polarization model used in the PST analysis.
| Band | Median of Dark dn/SIS dn | Median Fit to Dark dn Correlation | Median of Lollipop dn/SIS dn | Median Fit to Lollipop dn Correlation |
|---|
| M1 | 0.00034 | 0.25875 | 0.00029 | 0.45757 |
| M2 | 0.00010 | 0.24259 | 0.00020 | 0.42333 |
| M3 | 0.00003 | 0.29689 | 0.00005 | 0.40116 |
| M4 | 0.00016 | 0.50772 | 0.00034 | 0.34209 |
| M5 | 0.00010 | 0.43434 | 0.00019 | 0.25904 |
| M6 | 0.00004 | 0.65485 | 0.00007 | 0.32639 |
| M7 | 0.00007 | 0.67648 | 0.00009 | 0.32577 |
| I1 | 0.00007 | 0.67648 | 0.00010 | 0.39667 |
| I2 | 0.00008 | 0.71257 | 0.00009 | 0.34283 |
Table 3.
Cross polarizer results for PST and the resulting PTSA efficiencies for each VNIR band.
Table 3.
Cross polarizer results for PST and the resulting PTSA efficiencies for each VNIR band.
| Band | Band Average Amplitude | Band Sigma Amplitude | Band Average Phase | Band Sigma Phase | NIR Correction Factors |
|---|
| M1 | 0.9655 | 0.0013 | 177.5050 | 0.0080 | 0.9826 |
| M2 | 0.9700 | 0.0006 | 177.5006 | 0.0084 | 0.9849 |
| M3 | 0.9733 | 0.0003 | 177.4875 | 0.0072 | 0.9866 |
| M4 | 0.9738 | 0.0011 | 177.4647 | 0.0146 | 0.9868 |
| M5 | 0.9739 | 0.0005 | 177.4056 | 0.0076 | 0.9868 |
| M6 | 0.9743 | 0.0003 | 177.4166 | 0.0074 | 0.9871 |
| M7 | 0.9651 | 0.0002 | 177.3659 | 0.0076 | 0.9824 |
| I1 | 0.9761 | 0.0005 | 177.4200 | 0.0093 | 0.9880 |
| I2 | 0.9698 | 0.0003 | 177.3575 | 0.0087 | 0.9848 |
Table 4.
JPSS-2 Maximum detector PA (in percentage) for all VNIR bands, scan angles and HAM sides from PST.
Table 4.
JPSS-2 Maximum detector PA (in percentage) for all VNIR bands, scan angles and HAM sides from PST.
| | | Band |
|---|
| HAM A | Scan Angle | M1 | M2 | M3 | M4 | M5 | M6 | M7 | I1 | I2 |
| −55 | 4.224 | 1.730 | 1.138 | 0.886 | 1.601 | 1.447 | 1.077 | 0.801 | 1.140 |
| −45 | 4.252 | 1.518 | 1.008 | 0.943 | 1.596 | 1.201 | 0.964 | 0.798 | 1.032 |
| −37 | 4.325 | 1.440 | 0.968 | 0.950 | 1.578 | 1.053 | 0.882 | 0.813 | 0.967 |
| −30 | 4.419 | 1.383 | 0.933 | 1.030 | 1.598 | 0.961 | 0.850 | 0.835 | 1.022 |
| −20 | 4.591 | 1.307 | 0.883 | 1.083 | 1.565 | 0.898 | 0.900 | 0.842 | 1.101 |
| −15 | 4.640 | 1.333 | 0.900 | 1.114 | 1.576 | 0.879 | 0.936 | 0.858 | 1.140 |
| −8 | 4.728 | 1.304 | 0.911 | 1.134 | 1.529 | 0.847 | 0.974 | 0.855 | 1.178 |
| 4 | 4.815 | 1.329 | 1.026 | 1.149 | 1.525 | 0.845 | 1.036 | 0.862 | 1.255 |
| 22 | 4.845 | 1.503 | 1.144 | 1.149 | 1.542 | 0.855 | 1.112 | 0.868 | 1.332 |
| 45 | 4.723 | 1.701 | 1.274 | 1.123 | 1.520 | 0.860 | 1.196 | 0.875 | 1.408 |
| 55 | 4.530 | 1.774 | 1.326 | 1.068 | 1.493 | 0.856 | 1.233 | 0.866 | 1.445 |
| HAM B | Scan Angle | M1 | M2 | M3 | M4 | M5 | M6 | M7 | I1 | I2 |
| −55 | 4.152 | 1.635 | 1.079 | 0.848 | 1.588 | 1.492 | 0.998 | 0.811 | 1.052 |
| −45 | 4.204 | 1.455 | 0.971 | 0.922 | 1.573 | 1.239 | 0.911 | 0.794 | 0.978 |
| −37 | 4.301 | 1.387 | 0.942 | 0.937 | 1.544 | 1.080 | 0.848 | 0.801 | 0.928 |
| −30 | 4.394 | 1.347 | 0.912 | 1.019 | 1.573 | 0.985 | 0.833 | 0.822 | 1.004 |
| −20 | 4.521 | 1.286 | 0.871 | 1.067 | 1.546 | 0.908 | 0.900 | 0.830 | 1.098 |
| −15 | 4.590 | 1.305 | 0.889 | 1.118 | 1.550 | 0.885 | 0.938 | 0.846 | 1.141 |
| −8 | 4.645 | 1.286 | 0.902 | 1.124 | 1.509 | 0.850 | 0.982 | 0.841 | 1.185 |
| 4 | 4.727 | 1.305 | 1.012 | 1.144 | 1.511 | 0.838 | 1.050 | 0.850 | 1.269 |
| 22 | 4.758 | 1.461 | 1.122 | 1.150 | 1.521 | 0.838 | 1.128 | 0.855 | 1.350 |
| 45 | 4.649 | 1.649 | 1.247 | 1.114 | 1.508 | 0.849 | 1.210 | 0.859 | 1.427 |
| 55 | 4.481 | 1.712 | 1.296 | 1.064 | 1.481 | 0.841 | 1.248 | 0.853 | 1.459 |
Table 5.
JPSS-1 Maximum detector PA (in percentage) for all VNIR bands, scan angles and HAM sides from PST.
Table 5.
JPSS-1 Maximum detector PA (in percentage) for all VNIR bands, scan angles and HAM sides from PST.
| | | Band |
|---|
| HAM A | Scan Angle | M1 | M2 | M3 | M4 | M5 | M6 | M7 | I1 | I2 |
| −55 | 5.125 | 3.719 | 2.885 | 3.613 | 1.905 | 1.621 | 0.732 | 0.814 | 0.736 |
| −45 | 5.275 | 3.804 | 2.863 | 3.909 | 1.864 | 1.321 | 0.624 | 0.741 | 0.626 |
| −37 | 5.351 | 3.847 | 2.825 | 4.073 | 1.894 | 1.130 | 0.542 | 0.758 | 0.542 |
| −30 | 5.486 | 3.944 | 2.840 | 4.162 | 1.863 | 0.998 | 0.466 | 0.740 | 0.472 |
| −20 | 5.548 | 3.906 | 2.729 | 4.170 | 1.821 | 0.867 | 0.367 | 0.733 | 0.367 |
| −15 | 5.570 | 3.914 | 2.706 | 4.229 | 1.850 | 0.855 | 0.369 | 0.799 | 0.375 |
| −8 | 5.633 | 3.924 | 2.672 | 4.180 | 1.795 | 0.790 | 0.320 | 0.755 | 0.366 |
| 4 | 5.715 | 3.954 | 2.631 | 4.179 | 1.836 | 0.754 | 0.387 | 0.810 | 0.432 |
| 22 | 5.654 | 3.888 | 2.620 | 4.042 | 1.816 | 0.737 | 0.442 | 0.826 | 0.503 |
| 45 | 5.512 | 3.981 | 2.806 | 3.889 | 1.799 | 0.749 | 0.549 | 0.851 | 0.613 |
| 55 | 5.369 | 4.047 | 2.842 | 3.799 | 1.801 | 0.761 | 0.601 | 0.857 | 0.658 |
| HAM B | Scan Angle | M1 | M2 | M3 | M4 | M5 | M6 | M7 | I1 | I2 |
| −55 | 5.559 | 4.065 | 2.914 | 4.029 | 2.099 | 1.037 | 1.185 | 0.854 | 1.193 |
| −45 | 5.742 | 4.097 | 2.866 | 4.210 | 2.171 | 0.922 | 0.917 | 0.899 | 0.921 |
| −37 | 5.868 | 4.123 | 2.826 | 4.325 | 2.223 | 0.900 | 0.739 | 0.954 | 0.749 |
| −30 | 6.022 | 4.221 | 2.846 | 4.349 | 2.190 | 0.873 | 0.614 | 0.951 | 0.625 |
| −20 | 6.172 | 4.184 | 2.764 | 4.321 | 2.134 | 0.869 | 0.478 | 0.936 | 0.500 |
| −15 | 6.205 | 4.202 | 2.750 | 4.361 | 2.144 | 0.917 | 0.474 | 0.996 | 0.507 |
| −8 | 6.321 | 4.216 | 2.742 | 4.302 | 2.067 | 0.908 | 0.431 | 0.946 | 0.478 |
| 4 | 6.426 | 4.256 | 2.740 | 4.285 | 2.035 | 0.951 | 0.456 | 0.986 | 0.503 |
| 22 | 6.414 | 4.186 | 2.851 | 4.147 | 2.017 | 0.958 | 0.469 | 1.001 | 0.525 |
| 45 | 6.168 | 4.359 | 3.077 | 3.991 | 1.992 | 0.951 | 0.524 | 1.033 | 0.581 |
| 55 | 5.955 | 4.468 | 3.115 | 3.907 | 1.978 | 0.946 | 0.557 | 1.040 | 0.609 |
Table 6.
Uncertainty contributors and RSS estimated uncertainty from the PST polarization sensitivity test with the values in percentage. The first row of bold values is the RSS of the non-bold items below it. The bold values in row 11 are the RSS uncertainty from the PTSA and the bold values in row 12 are the RSS of the values in rows 1 and 11. The last row is the polarization sensitivity characterization requirement that row 12 should be below. These values are all in percentage.
| | M1 | M2 | M3 | M4 | M5 | M6 | M7 | I1 | I2 |
|---|
| RSS of Measurement Uncertainties Listed Below | 0.76 | 0.26 | 0.13 | 0.22 | 0.13 | 0.09 | 0.08 | 0.21 | 0.34 |
| Sonoma Filter | 0.000 | 0.000 | 0.000 | 0.160 | 0.000 | 0.000 | 0.000 | 0.000 | 0.000 |
| Sheet Efficiency | 0.001 | 0.000 | 0.000 | 0.002 | 0.001 | 0.014 | 0.000 | 0.000 | 0.000 |
| Stray Light | 0.0002 | 0.0007 | 0.0003 | 0.0006 | 0.0002 | 0.0003 | 0.0003 | 0.0002 | 0.0003 |
| Sheet Angle | 0.0008 | 0.0003 | 0.0002 | 0.0002 | 0.0003 | 0.0003 | 0.0002 | 0.0002 | 0.0003 |
| Efficiency | 0.001 | 0.000 | 0.000 | 0.002 | 0.001 | 0.014 | 0.000 | 0.000 | 0.000 |
| Repeatability | 0.03 | 0.02 | 0.03 | 0.02 | 0.02 | 0.01 | 0.01 | 0.01 | 0.01 |
| Scan Angle Interpolation | 0.02 | 0.03 | 0.02 | 0.03 | 0.06 | 0.06 | 0.02 | 0.06 | 0.02 |
| SIS-TOA | 0.76 | 0.06 | 0.08 | 0.08 | 0.09 | 0.01 | 0.03 | 0.20 | 0.03 |
| OOB | 0.06 | 0.25 | 0.09 | 0.13 | 0.07 | 0.06 | 0.07 | 0.04 | 0.34 |
| Test Setup Uncertainty | 0.17 | 0.15 | 0.13 | 0.05 | 0.07 | 0.06 | 0.05 | 0.11 | 0.05 |
| Total RSS of Test Setup and Measurement Errors | 0.78 | 0.30 | 0.18 | 0.23 | 0.15 | 0.11 | 0.09 | 0.24 | 0.35 |
| Specification | 0.50 | 0.50 | 0.50 | 0.50 | 0.50 | 0.50 | 0.50 | 0.50 | 0.50 |


