Article

Assessment of Land Use Land Cover Changes for Predicting Vulnerable Agricultural Lands in River Basins of Bangladesh Using Remote Sensing and a Fuzzy Expert System

1
Graduate School of Science and Technology, University of Tsukuba, Tsukuba 305-8577, Japan
2
Faculty of Life and Environmental Sciences, University of Tsukuba, Tsukuba 305-8577, Japan
*
Author to whom correspondence should be addressed.
Remote Sens. 2022, 14(21), 5582; https://doi.org/10.3390/rs14215582
Submission received: 7 September 2022 / Revised: 29 October 2022 / Accepted: 2 November 2022 / Published: 5 November 2022

Abstract

:
The aim of this study was to assess the LULC changes over 26 years from 1995 to 2021 to find the most changed land use conditions within the 25 km territory of the main river systems of Bangladesh. In addition, the prediction of vulnerable areas for agricultural land use in terms of inundation by river water was also analyzed. The study area includes river networks distributed through eight administrative divisions (Rangpur, Rajshahi, Mymensingh, Sylhet, Dhaka, Khulna, Barishal and Chittagong) of Bangladesh, covering an area of 64,556 km2. The study was conducted by identifying permanent water bodies from NDWI indices and preparing LULC maps that include the five main land use classes (water body, bare land, vegetation, agricultural land, and urban area) in the Google Earth Engine platform using supervised classification. The LULC maps were then analyzed in the ArcGIS® environment. A vulnerability map for agricultural land use was also prepared using a fuzzy expert-based system applying multicriteria analysis. From the land use land cover map of the study area, it was found that among the five land use classes, water bodies, bare land, vegetation, and urban areas increased in size by 3.65%, 2.18%, 3.31% and 2.55%, respectively, whereas agricultural land use significantly decreased by 11.68%. This decrease in agricultural land use was common for the analyzed area of all administrative divisions. According to the vulnerable area map of the eight divisions, more than 50% of the analyzed area of the Khulna and Dhaka divisions and more than 40% of the analyzed area of the Rajshahi, Mymensingh, Sylhet, Barishal and Chittagong divisions were highly vulnerable to agricultural land use due to the possibility of inundation by water. However, approximately 44% of the analyzed area of the Rangpur division was not vulnerable for agricultural land use. The prepared LULC and vulnerability maps can be helpful for the future land use planning of Bangladesh to meet the increasing demand for food production and livelihoods for increasing populations.

Graphical Abstract

1. Introduction

Bangladesh is a riverine country where a large number of small to large rivers flow and merge in the delta toward the Bay of Bengal. Padma, Meghna, Jamuna, and Brahmaputra are the main large rivers of Bangladesh. Rivers flow from the north to the south over the country and contribute to the Bay of Bengal in the south. In addition to these main rivers, there are many tributaries and distributaries of these rivers. These rivers experience severe inundation during the monsoon periods of the year. In the monsoon season, most rainfall occurs, and low-lying areas become flooded with rainwater. The rivers of Bangladesh also become overloaded by rainwater, and water comes from upstream, which causes seasonal floods on both sides of its banks. On the other hand, the land area is continuously changing from one land use to another, such as agricultural to urban land, agricultural land to man-made vegetation, and bare land to natural vegetation. This land use change mostly affects agricultural land [1], which is decreasing to meet the increasing demand of higher populations. LULC assessment is an important process for meaningful planning and management of land resources. The land use changes over the years can be recognized through changing satellite imagery; this is a potential source of high-quality information at the local, regional, and global scales [2,3].
Remote sensing technologies have become the best way to obtain and update information about current conditions with dynamic changes in LULC from the Earth’s surface over long periods of time. Therefore, in LULC classification, information about cultural features, urban areas, natural vegetative surfaces, and agricultural land are described [4]. To achieve environmental security and sustainable development, pattern and change detection assessments of LULC have become a great concern of scientists worldwide [5]. Land use inventories are becoming increasingly important in various sectors, such as urban planning, environmental studies, operational planning, and agricultural planning. LULC data also play an important role as an input for modeling, and they are related to the development of policy as well as to facing the adverse effects of climate change [6].
As a deltaic area, Bangladesh faces climate change risks and outbreaks such as cyclones, riverbank erosion, salinity intrusion, floods, and flash floods. All these natural calamities affect the livelihoods of farmers and related stakeholders through their adverse effects by destroying land and property as well as damaging crops. A large number of low-lying agricultural areas become inundated by floods and flash floods during the rainy season in Bangladesh, which causes an enormous deficit in agricultural production. Several studies have been conducted to understand the adverse effects of cyclones, riverbank erosion, floods, and flash floods covering different portions of Bangladesh [7,8,9,10]. However, vulnerability assessments for agricultural land use in Bangladesh are rarely reported. In the vulnerability assessment, the multiple criteria-based decision-making method has potential uses in land use planning. The multi-criteria decision-making (MCDM) method has become a very effective approach for vulnerability and suitability analysis for different aspects. This approach has a significant advantage when used with GIS, which systematically supports decision-making. According to Ferretti and Pomarico [11], MCDM provides a transparent reflection of decisions using thematic maps. This multidisciplinary approach is a powerful integrated method in complex land use scenarios. In diversified fields, this MCDM approach has been used in spatial analysis for land use analysis [12,13,14].
The application of traditional methods for determining the degree of suitability and vulnerability in any aspect is possible, but they are very difficult and time-consuming [15]. In recent decades, geographic information systems (GIS) and satellite remote sensing (RS) tools have been suggested to be very effective and have attracted considerable attention in the field of suitability and vulnerability assessment [16,17]. MCDM contributes significantly to land suitability assessment in industrial development and the production of different crops, such as cassava, tea, and maize [18,19,20,21]. However, LULC in the large riverine networks was not exclusively projected in any of the studies, particularly agricultural land use change to ensure the sustainability of agricultural lands over time. It is necessary to predict the land use changes for deltaic countries for sustainable planning of agricultural lands, settlements, and livelihoods. Additionally, LULC change detection is important to identify water hazards or lands vulnerable to inundation in riverine-adjacent territories. Thus, the first research question focuses on assessing the LULC in the large river basin for long time periods, especially for agricultural land use change to ensure land use planning for food production. Another important research question is how to predict the inundation vulnerability for agricultural lands in spatial and time scales. In this regard, risk-prone flood inundation mapping for policy implications in agriculture is important for agricultural land use planning. Satellite remote sensing can predict the inundation vulnerability from multi-spectral and multi-temporal perspectives in the distributed river basin. In this regard, multi-criteria considering climate change, land use planning, distance and geographical extent can help to estimate the inundation hazard.
Therefore, the objectives of the present study were to assess the land use land cover changes (LULC) in the river basin of Bangladesh from 1995 to 2021 to find the most changed land use classes and to predict the lands vulnerable to agricultural land use by preparing a vulnerability map using a fuzzy expert system and satellite remote sensing datasets.

2. Materials and Methods
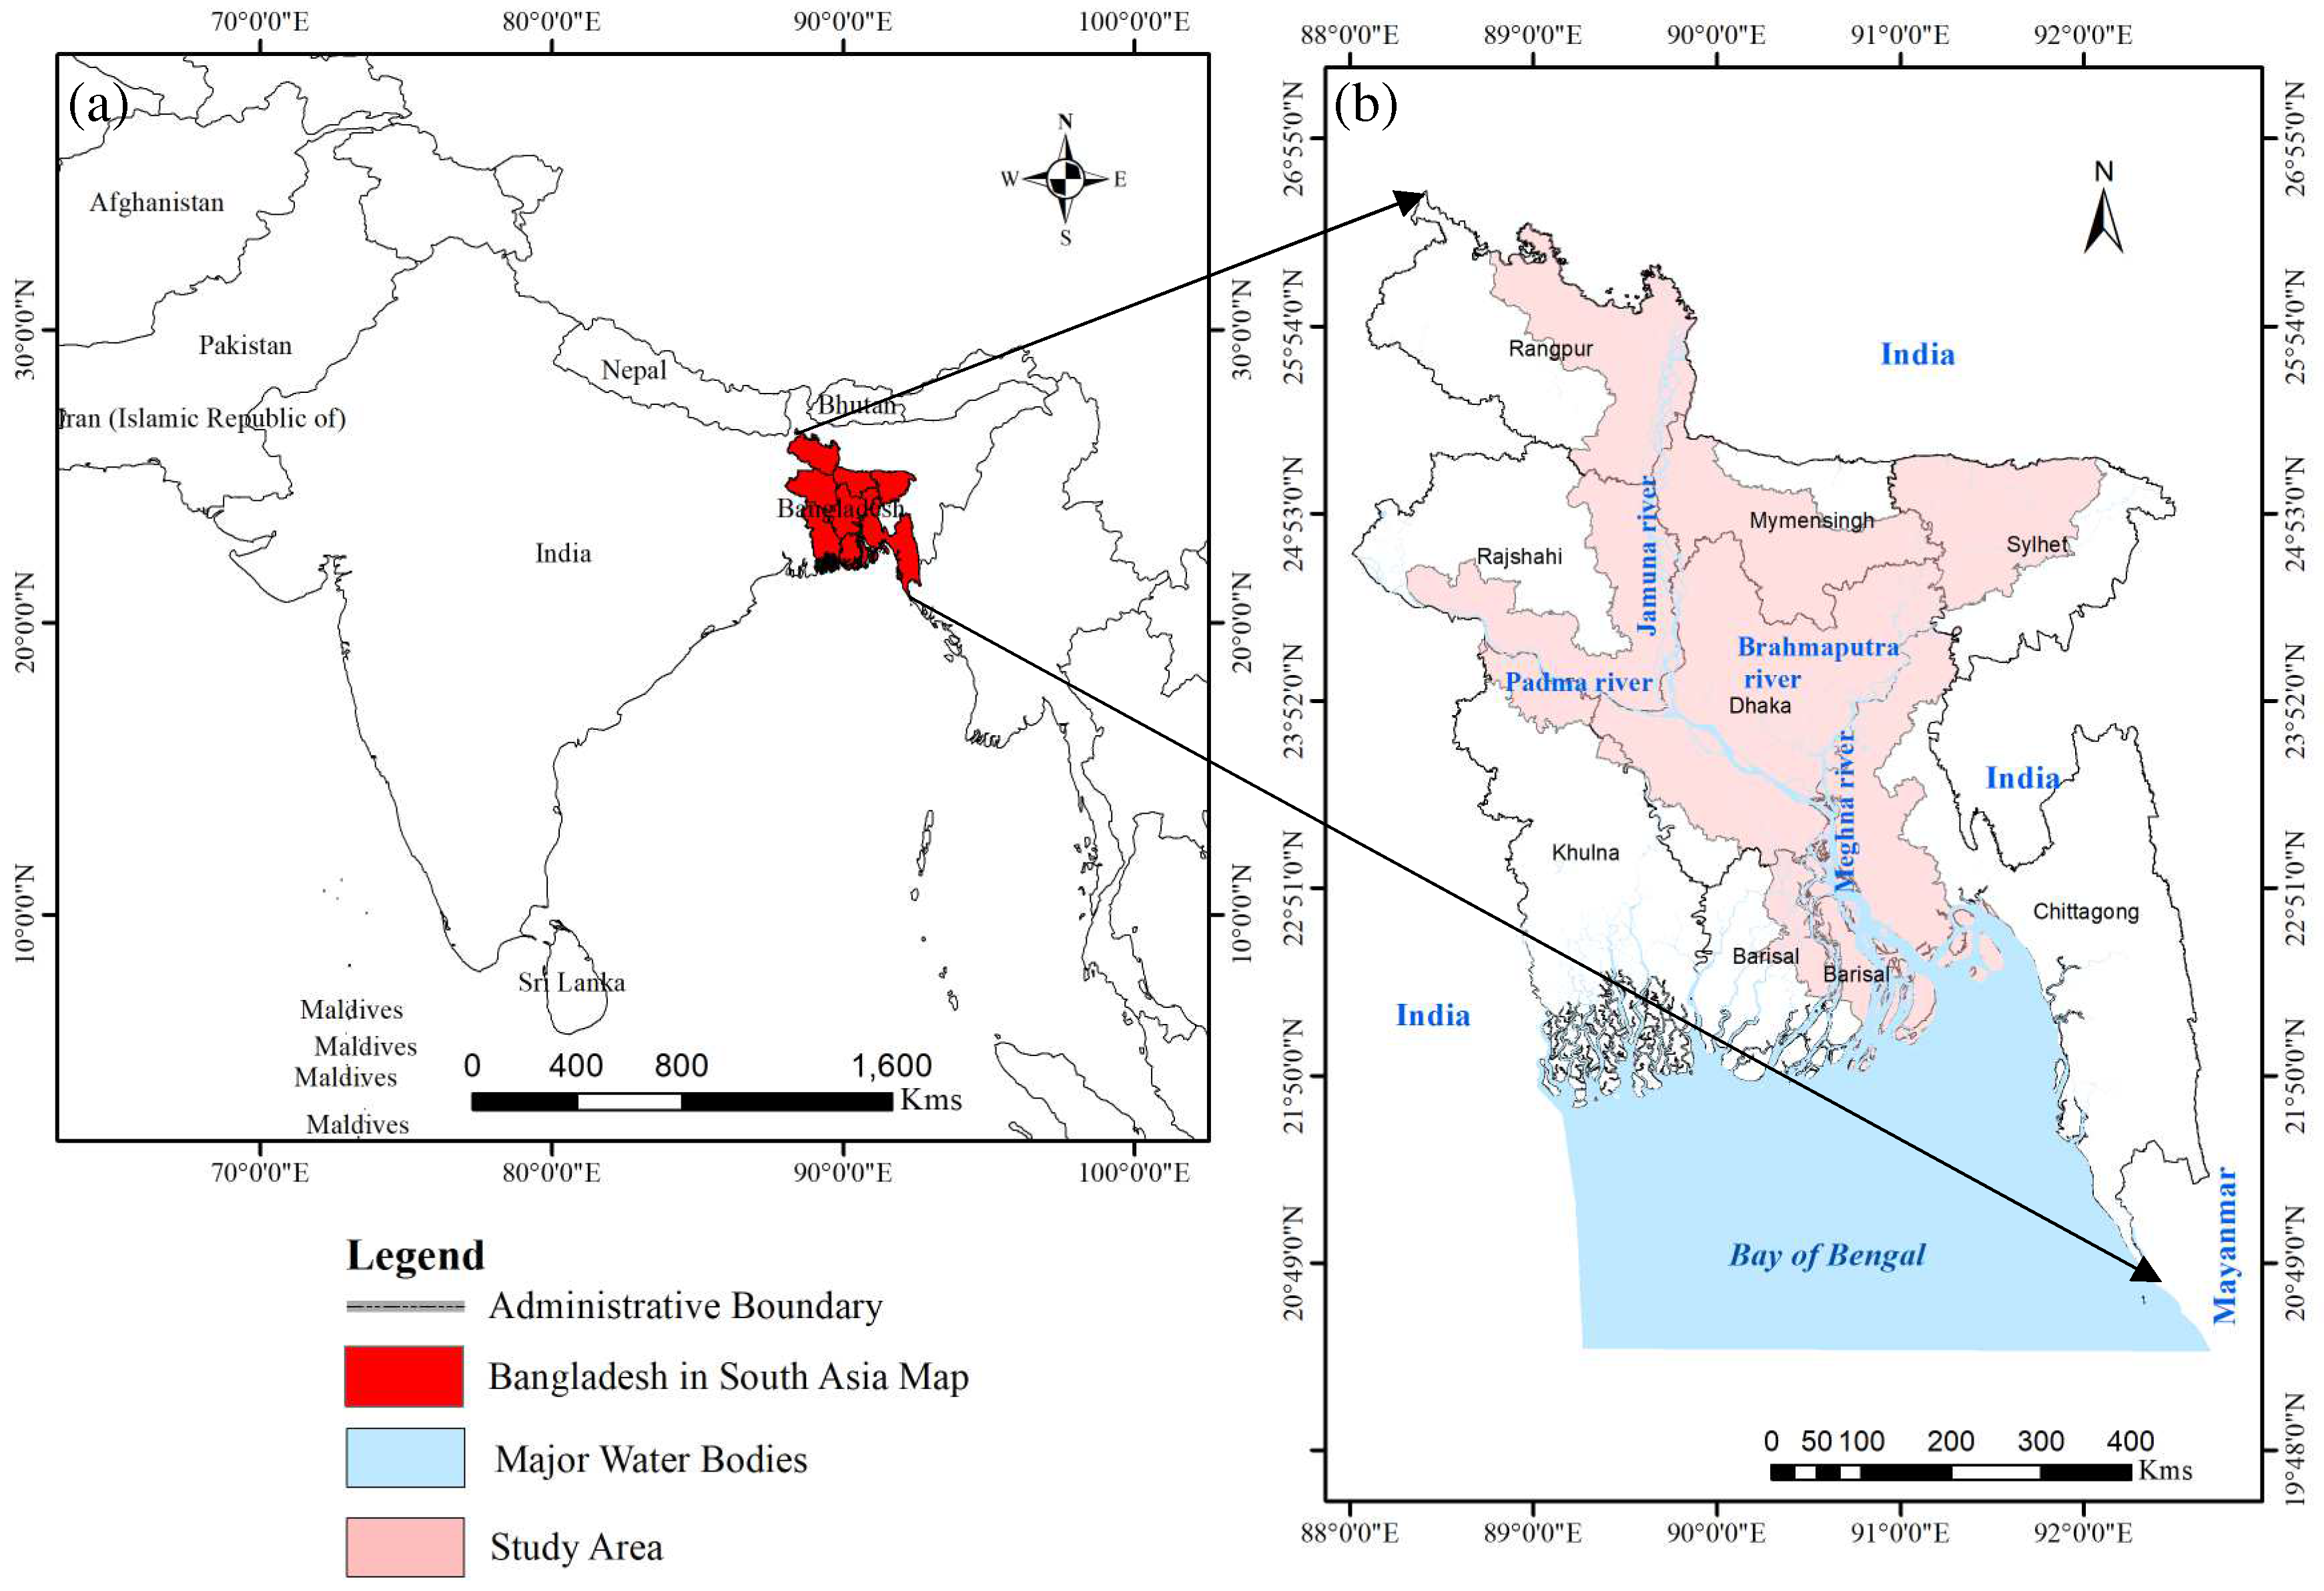
The study was conducted using Landsat 5 and Landsat 8 OLI multispectral images with 30 m spatial resolutions retrieved between 1995 and 1996 and between 2021 and 2022. Satellite images were used to prepare LULC maps and different criteria maps for assessing change detection. SRTM data were used to make the elevation map (Table 1). The distance from the river map was calculated using the Euclidian distance utilizing the river shape file. Annual average precipitation data from 2021 were collected from CHIRPS (1995–2022). A rainfall map of the study area was prepared from the CHIRPS precipitation data. The administrative and river shape files were retrieved from the Bangladesh Bureau of Statistics (BBS), which were updated in 2020 (Table 1). Then, the study area was masked according to riverine networks and adjacent territories. All LULC maps and criteria maps were prepared in the Google Earth Engine platform. Satellite images of less than 1% cloud coverage taken from the Landsat collection were utilized for the analysis. Finally, all other analyses were carried out in the ArcGIS® environment.

2.1. Study Area

Bangladesh is a deltaic area with a large number of small to large rivers flowing through the country. These rivers are directly related to the human lives and livelihoods of farmers. The study area covers eight administrative divisions of Bangladesh (Rangpur, Rajshahi, Mymensingh, Sylhet, Dhaka, Khulna, Barishal, and Chittagong) from north to south. The analysis was conducted within the 25 km territory of both banks of the main rivers to understand the effect of rivers on LULC (Jamuna, Padma, Brahmaputra, and Meghna, including their tributaries and distributaries) covering an area of 64,556 km2. The analyzed areas for the eight administrative divisions were 7368 km2, 8132 km2, 18,112 km2, 1735 km2, 7534 km2, 6444 km2, 4828 km2, and 10,235 km2 for Rangpur, Rajshahi, Dhaka, Khulna, Mymensingh, Sylhet, Barishal, and Chittagong, respectively (Figure 1). The areas vulnerable to agricultural land use were also assessed for riverine network cover in all divisions.
Geologically, two major tectonic units of Bangladesh are (i) In the Northwest, the Stable Precambrian Platform, and (ii) In the Southeast Geosynclinal basin. Another Northeast-Southwest trending narrow unit that separates the above two units is Hinge Zone [22,23]. Among the eight administrative divisions of Bangladesh, Rangpur is the most northern division and geologically falls in the North-Northwestern part of the Bengal basin. The surface area is a recent floodplain deposit [24] composed of clay, silt, and fine to medium-grained sand [25]. This division’s most common land use classes are water bodies, urban areas, agricultural land, and natural vegetation. The coastal part of the Khulna division is highly vulnerable to cyclones [9]. Barishal is in the south of Bangladesh, and the division contains many small to large rivers. The Bay of Bengal is located in the south of the division. The lands are mainly covered by water bodies, agricultural land, natural vegetation, and urban areas. The coastal portions are highly vulnerable to cyclones. Chittagong is the southernmost division of Bangladesh, called the port city. The eastern portion of this division is a hilly region that mostly contains natural vegetation, and the southern part contains the longest coast of the Bay of Bengal. The most common land use classes are water bodies, natural vegetation, urban area, and agricultural land.

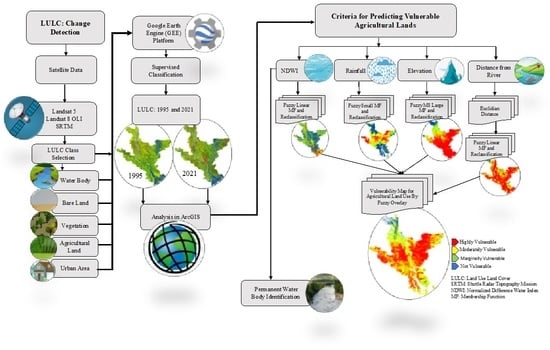
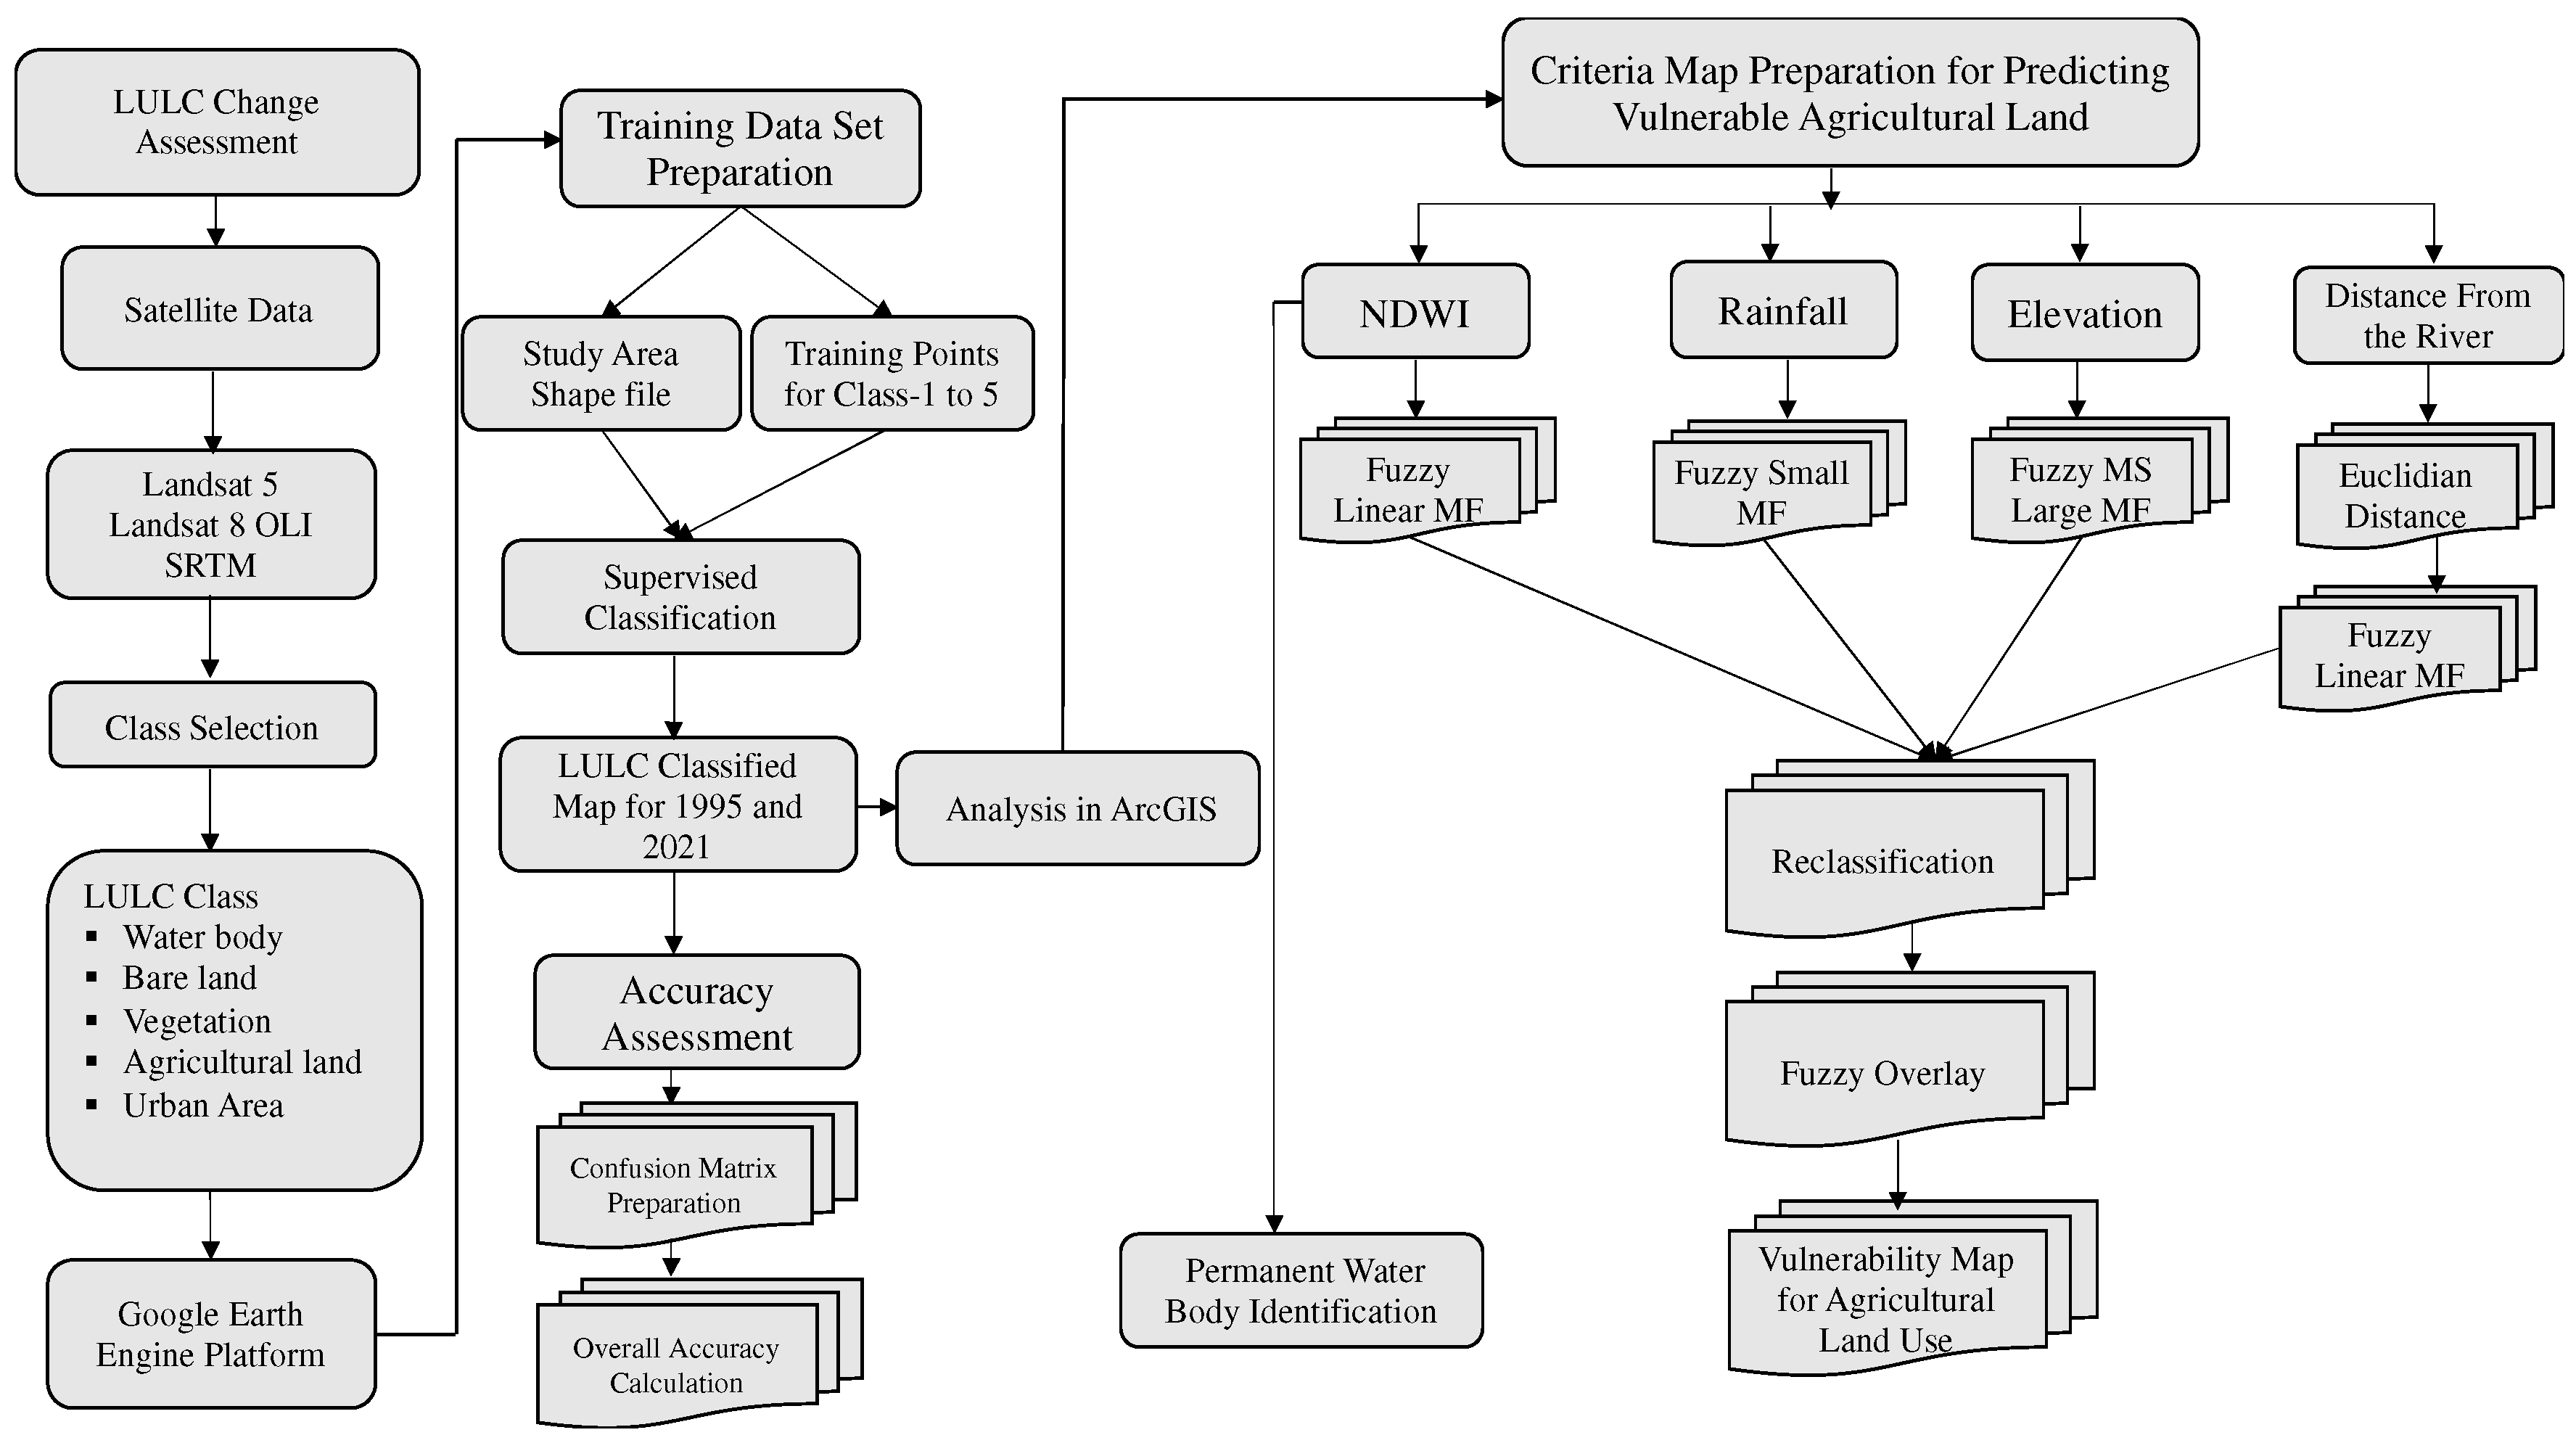
2.2. Research Framework

The study was conducted in two stages. In the first stage, LULC maps for 1995 and 2021 were prepared for the study area to assess the LULC change over 26 years. Then, permanent water bodies between 1995 and 2021 were detected from the NDWI (Normalized Difference Water Index) map to understand the changes in the river basin area. In the second stage, four criteria related to inundation by water were selected to prepare the vulnerability map to predict the areas vulnerable to agricultural land use. A fuzzy expert base multicriteria decision-making (MCDM) method was used for the vulnerability analysis. A stepwise workflow has been described in (Figure 2).

2.2.1. Land Use Land Cover Change Assessment

The LULC maps of the study area for 1995 and 2021 were prepared under five major land use classes: water bodies, bare land, vegetation, agricultural land, and urban areas. Here, water bodies include main rivers as well as other permanent water bodies; bare land includes the sandy land (chor land) near the rivers; vegetation includes both natural forests and other vegetation such as fruit orchards; agricultural land includes land with crops and land with no crops but still used for agricultural activity, and urban areas were lands with built-up features. The maps were prepared in the Google Earth Engine platform, which can easily handle a large study area. Working on this platform can also help to avoid hardware limitations. Several studies have already been conducted on the Google Earth Engine platform [26,27,28,29].
Landsat 5 image collections with less than 1% cloud coverage captured between 1 January 1995 and 30 March 1996 were used for preparing the LULC map for 1995. A total of 2564 reference points were collected for five land use classes, where 713 sample points for water bodies, 148 points for bare land, 302 points for vegetation, 1116 points for agricultural land, and 285 points for urban areas were collected for the training dataset. The reference points of every pixel value were collected and compared with the Google Earth Pro® map. Of the datasets, 70% of the data was used for training, and 30% was used for testing.
To prepare the LULC map for 2021, Landsat 8 OLI images with less than 1% cloud coverage were captured between January 2021 and March 2022. A total of 1755 reference points were collected for five land use classes, where 726 reference points were for water bodies, 130 for bare land, 237 for vegetation, 415 for agricultural land, and 247 points were for urban areas. The reference points of every pixel value were collected and compared with the Google Earth Pro map. Of the datasets, 70% of the data was used for training, and 30% was used for testing.
Eight Landsat image tiles from three paths were analyzed for preparing both LULC maps. They were retrieved from the path-136, row-42,43, 44; path-137, row-43,44; and path-138, row 42,43,44). It is very hard to find a cloud-free image at the same time; therefore, a long-time span was taken for image collection. Most of the agricultural lands in Bangladesh are used for multi-crop cultivation. When few lands have crops, others may have none or may be preparing crops in the same area. To classify the agricultural land, we compared the training data set for both lands with crops and with no crop to the images from Google Earth Pro. We have also taken sample points for different growth stages of crops as their spectral signature also varied in different stages.
The following scripts were used for preparing the LULC map. Three algorithms were used for preparing the LULC maps for 1995 and 2021, Algorithms 1 and 2 were used for LULC map preparation and Algorithm 3 was used for accuracy assessment of the prepared land use land class maps. Original GEE codes are given in Appendix A.1 and Appendix A.2.
Algorithm 1: “Image retrival of Landsat 5 or 8, False color composite image preparation and LULC map preparation for 1995”
Script
1var L5 or L8 = ee.imagecollection(“Collection Snippet for landsat 5 or 8”)
2.filterBounds (ROI)
3.filterDate (“start date”, “end date”)
4.filterMetadata(‘CLOUD_COVER’,’less_than’, 1)
5.mean()
6.clip(ROI)
7Map.addLayer(L5 or 8, {bands:[“B4”, “B3”, “B2”]});
8var training_points =landuse class1.merge(landuse class2).merge(..);
9var training_data = L5.sampleRegions({collection:training_points,properties:[‘LC’],scale:30})
10var classifier = ee.Classifier.smileCart()
11var classifier = classifier.train({features:training_data,classProperty: ‘LC’,inputProperties:[“B1”, “B2”, “B3”, “B4”, “B5”, “B6”, “B7”]});
12var classified_image = L5 or L8.classify(classifier);
13Map.addLayer(classified_image,{min:0, max:4, palette:[ ‘colour1’, ‘colour2’, ‘colour3’, ‘colour4’, ‘colour’]},’classified image’);
Run
Algorithm 2: “Image retrival of Landsat 5 or 8, False color composite image preparation and LULC map preparation for 2021”
Script
1var L5 or L8 = ee.imagecollection(“Collection Snippet for landsat 5 or 8”)
2.filterBounds (ROI)
3.filterDate (“start date”, “end date”)
4. filterMetadata(‘CLOUD_COVER’,’less_than’, 1)
5.mean()
6.clip(ROI)
7Map.addLayer(L5 or 8, {bands:[“B4”, “B3”, “B2”]});
8var training_points =landuse class1.merge(landuse class2).merge(..);
9var training_data = L5.sampleRegions({collection:training_points,properties:[‘LC’],scale:30})
10var classifier = ee.Classifier.smileCart()
11var classifier = classifier.train({features:training_data,classProperty: ‘LC’,inputProperties:[“B1”, “B2”, “B3”, “B4”, “B5”, “B6”, “B7”]});
12var classified_image = L5 or L8.classify(classifier);
13Map.addLayer(classified_image,{min:0, max:4, palette:[ ‘colour1’, ‘colour2’, ‘colour3’, ‘colour4’, ‘colour’]},’classified image’);
Run
Algorithm 3: “Accuracy assessment”
Script
1var trainingData = training_data.randomColumn();
2var trainSet = trainingData.filter(ee.Filter.lessThan(‘random’, 0.7));
3var testSet = trainingData.filter(ee.Filter.greaterThanOrEquals(‘random’, 0.7));
4var confusionMatrix = ee.ConfusionMatrix(testSet.classify(classifier)
5.errorMatrix({
6actual: ‘LC’,
7predicted: ‘classification’
8}))
9print(‘Confusion Matrix’, confusionMatrix);
10print(“Overall Accuracy:”, confusionMatrix.accuracy());
The prepared LULC images were resampled by 30 m × 30 m cell sizes as the GEE platform produces an image in pixels, and final maps were prepared in the ArcGIS® environment using resampling tools for 1995 and 2021 (Figure 3a,b).
NDWI maps were also prepared in the Google Earth Engine platform for 1995 and 2021 to identify permanent water bodies. Landsat 5 and Land 8 OLI image collections were used to prepare the NDWI map. Algorithm 4 was used to calculate the NDWI indices and map preparation. Original GEE codes are given in Appendix A.3.
Algorithm 4: “NDWI map preparation”
Script
Exportvar ROI: Table shapefile
1var L5 or L8 = ee.ImageCollection(“Collection Snippet for Landsat 5 or 8”)
2.filterBounds(ROI)
3.filterDate(“start date”, “end date”)
4.filterMetadata(‘CLOUD_COVER’,’less_than’, 1)
5.mean()
6.clip(ROI);
7var green = L5.select(‘B2’); or = L8.select(‘B3’);
8var nir = L5.select(‘B4’); or = L8.select(‘B5’);
9var ndwi = green.subtract(nir).divide(green.add(nir)).rename(‘NDWI’);
10var ndwiParams = {min: −1, max: 1, palette: [‘black’, ‘white’, ‘blue’]};
11Map.addLayer(ndwi, ndwiParams, ‘NDWI image’);
The prepared NDWI images were downloaded from the Google Earth Engine cloud server to Google Drive and analyzed in the ArcGIS® environment (ESRI, Redlands, California, USA) after resampling 30 m × 30 m cells using resampling tools. Both NDWI images were classified into two classes (water body and non-water body) using the index value for water 0 [30]. Finally, maps representing only permanent water bodies were prepared (Figure 3c,d).
To represent the LULC changes, maps of individual land use classes against water bodies were prepared (Figure 4 and Figure 5).
At the end, both LULC maps (1995 and 2021) were masked according to the administrative divisions (Figure 6 and Figure 7) and analyzed to determine the division of land use changes.

2.2.2. Vulnerability Analysis for Agricultural Land Use

Considering the inundation risk of agricultural land, the vulnerability analysis for agricultural land use in terms of inundation by water was performed on the same area taken for land use/land cover change analysis. In this regard, the second stage of this research was conducted to prepare a vulnerability map of the area for agricultural land use. Vulnerability analysis was performed using reclassification of multicriteria analysis based on the fuzzy membership functions.

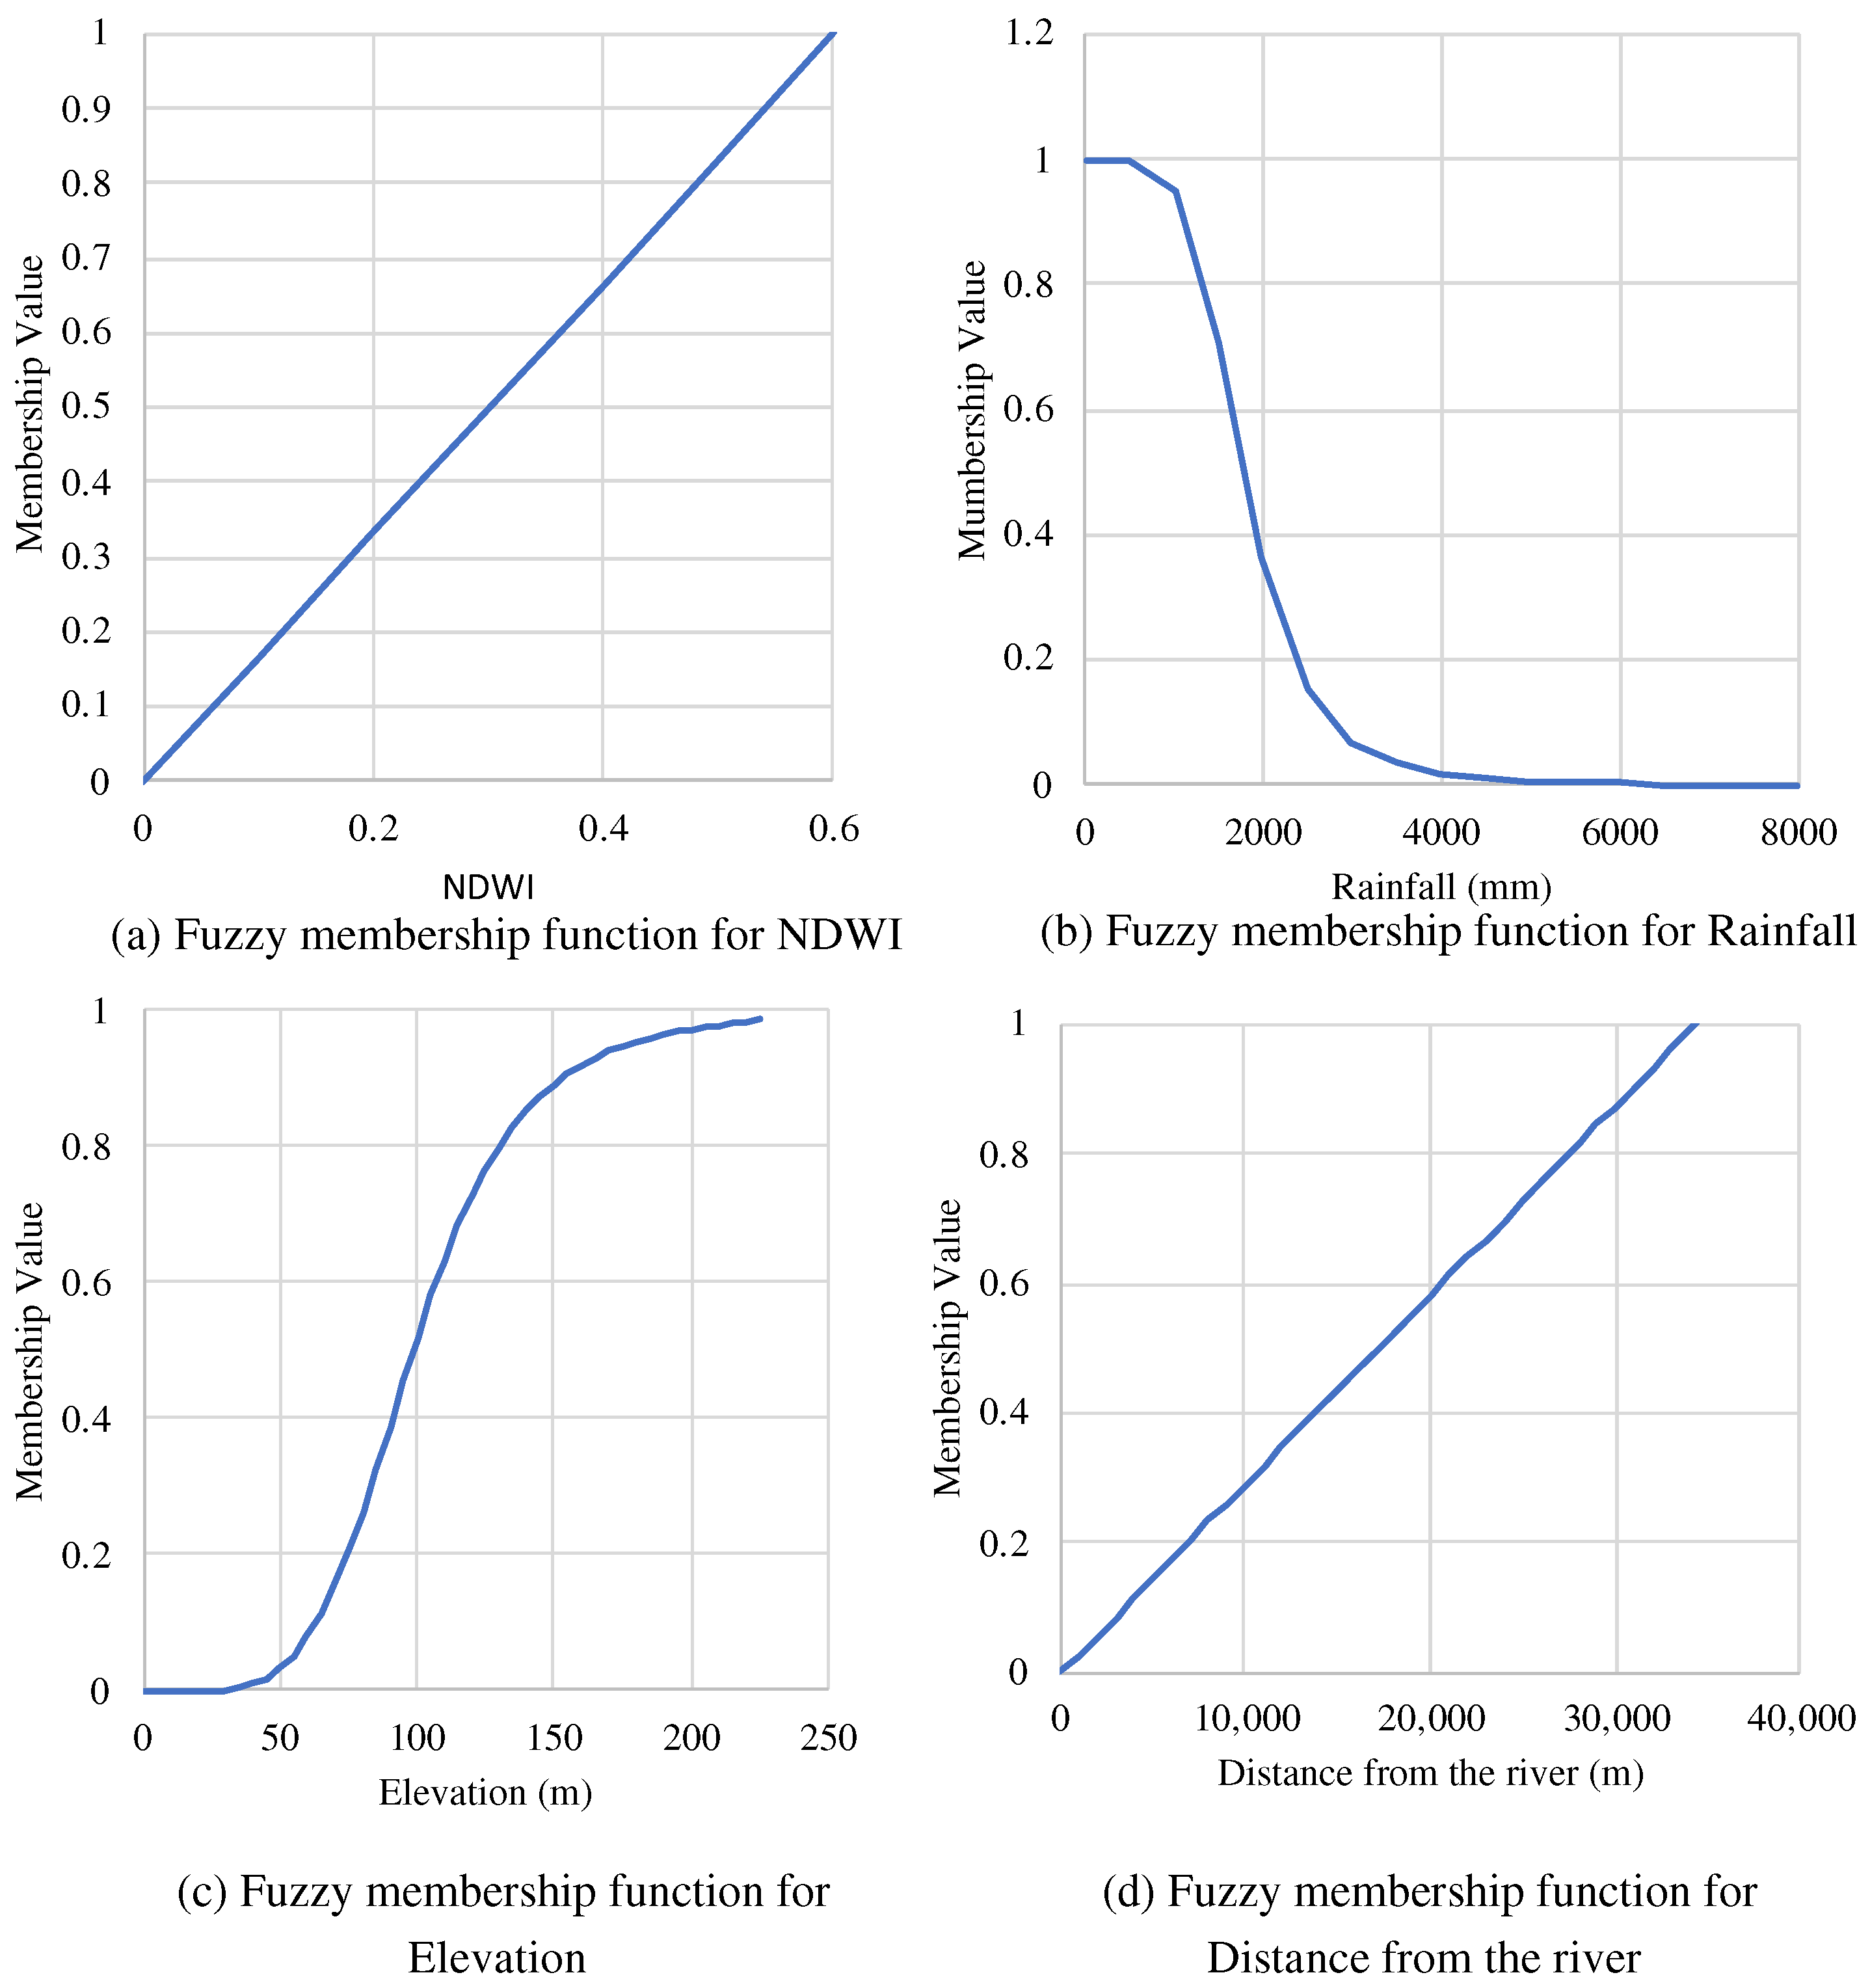
Reclassification by Fuzzy Membership Function

Fuzzy set theories allow the modeling of both suitability and vulnerability assessment within a GIS of a specific domain. In the fuzzy standard approach, it is clearly and crisply defined within a membership class or set, and they are either in the class or not [31]. In this study, to assign vulnerability classes for agricultural land use, fuzzy membership classification was used to accommodate the high uncertainty scoring method. For standardization, fuzzy membership functions were used. According to the literature review and based on references, several membership functions were selected. Seven fuzzy membership functions were built, and three were selected based on ecological, climatic, geological, and geographical criteria. The membership functions are Linear, Small, and MS Large, which produce continuous fuzzy classifications of standardized criteria (Equations (1)–(3)). A fuzzy small membership function was used when smaller input values were more likely to be a member of the set, a fuzzy MS large membership function was used when most of the input values were large members of the set, and a fuzzy linear membership function applied a linear function between the minimum and maximum values. The same equation was used for MS large membership and large membership functions, according to the ArcGIS® environment provided by ESRI. For reclassification, the natural breaks (Jenks) method was used, as there were limited references regarding the vulnerability assessment for agricultural land use in terms of water inundation in the river basin area.
μ = f x = 1 0 x a b a a < x < b x b x a
μ x = 1 1 + ( x f 2 ) f 1    
μ x = 1 1 + ( x f 2 ) f 1
In Equation (1), a and b represent the value for the x coordinate, where x represents the real value (Crisp value). In Equations (2) and (3), x is the crisp value, f1 is the spread, and f2 is the midpoint for the fuzzy large and MS large membership functions, which vary for different criteria.

Criteria Selection for Vulnerability Assessment for Agricultural Land Use

For this study, four main criteria related to inundation by the water were selected. These criteria were NDWI, rainfall, elevation, and distance from the river, which are geological and geographical criteria. All the criteria were directly related to water inundation in the river basin area of Bangladesh. After calculating all the criteria, the vulnerability maps were reclassified into four classes: V1 (highly vulnerable area for agricultural land use), V2 (moderately vulnerable area for agricultural land use), V3 (marginally vulnerable area for agricultural land use), and N (nonvulnerable area for agricultural land use).

Normalized Difference Water Index (NDWI)

The NDWI was taken as the criterion for the vulnerability analysis and was used to predict vulnerable areas for agricultural land use in terms of water inundation. Furthermore, NDWI was used to identify permanent water bodies, such as rivers and permanently waterlogged areas were very important for vulnerability assessment. The areas near the water source were much more suitable for agriculture, but those areas were also vulnerable to inundation during the rainy season by flood water. As our study area was within the 25 km territory of the main river systems of Bangladesh, NDWI could be an important criterion for the prediction of vulnerable agricultural lands. In this study, Landsat-8 OLI and Landsat-5 images were used to calculate the NDWI, and two spectral bands, green and NIR, were utilized for the calculation. The following equation was used to calculate the NDWI [32]:
N D W I = G r e e n N I R G r e e n + N I R
Finally, the NDWI was standardized with the fuzzy linear membership function (Figure 8a), and the study area was reclassified into four vulnerability classes for agricultural land use (Figure 9a).

Rainfall

In this study, the average rainfall map for 2021 was used from the CHRS Data Portal. According to the rainfall map for 2021 in Bangladesh, the highest and lowest rainfall was recorded as 2455 mm and 1117 mm, respectively. The rainfall map was resampled with a 30 m × 30 m cell size using the resampling tool and then standardized by applying the fuzzy small membership function in ArcGIS (Figure 8b). Finally, the rainfall map was reclassified according to four vulnerability classes (Figure 9d).

Elevation

There is a direct relationship between the elevation of land and inundation by water. Lands of higher elevation are less likely to be affected by water than lands of low elevation. Our analyzed area in this study was the 25 km territory of the main river systems of Bangladesh. Landsat SRTM elevation data were analyzed for this study to prepare the elevation map. From the analysis, the highest and lowest elevations were 225 m and −25 m, respectively. As most areas of Bangladesh are plain lands and are suitable for agriculture, they are at the same time vulnerable to inundation by flood water due to lower elevations relative to the mean sea level. During floods and monsoons, most areas near the river go underwater, which causes major damage to crops. The prepared elevation map from Landsat SRTM data was standardized using the fuzzy MsLarge membership function (Figure 8b), and the area was reclassified into the four vulnerability classes (Figure 9c).

Distance from the River

In this study, distance from the river was considered the most important criterion, as the areas nearest the river have the highest inundation risk. To calculate the distance from the river, a river shape file was collected from the Bangladesh Bureau of Statistics (BBS), and the Euclidean distance tool was used to calculate the distance in the ArcGIS spatial environment. Finally, a fuzzy linear membership function was used to standardize the value (Figure 8d), and then the map was classified based on the four vulnerability classes (Figure 9b).

Fuzzy Overlay for Vulnerability Analysis of Agricultural Land Use

In a multicriteria overlay analysis, the possibility of a phenomenon belonging to multiple sets can be analyzed using fuzzy overlay tools. Fuzzy overlays analyze the relationships between the membership of the multiple sets and determine in which sets the phenomenon is possibly present. Five overlay methods are available to combine the data based on set theory analysis. They are Fuzzy and, Fuzzy or, Fuzzy product, Fuzzy sum, and Fuzzy gamma. In this study, a fuzzy gamma overlay was conducted to prepare a vulnerability map from the criteria map produced from the fuzzy linear, fuzzy small, and fuzzy MSlarge membership functions (Figure 9e). Fuzzy gamma is an algebraic product of the fuzzy sum and fuzzy product, which can be expressed by the following expression [33]:
µ(x) = (FuzzySum)y × (FuzzyProduct)1 − y
The default gamma value of 0.9 was used to generalize the fuzzy gamma overlay function. Then, the prepared vulnerability map was reclassified into four classes using the Jenks Natural Breaks algorithm [34]. In this classification, the classes were based on inherent natural groupings in the database [35]. Finally, the prepared vulnerability map was masked by the eight administrative division shape files of Bangladesh for further analysis (Figure 10).

2.3. Accuracy Assessment

A total of 2564 sample points were taken for the training dataset as feature collections of five land use classes for preparing the LULC map of 1995. Of the sample points, 713 were selected for water bodies, 148 points for bare land, 302 points for vegetation, 1116 points for agricultural land, and 285 points for urban areas. To prepare the LULC map for 2021, a total of 1755 sample points were taken as feature collections of five land use classes, where 726 sample points were for water bodies, 130 points were for bare land, 237 points were for vegetation, 415 points were for agricultural land, and 247 points were for urban areas. In the accuracy assessment, the training datasets consisted of 70% of the total samples, and 30% were used for testing in both 1995 and 2021. A confusion matrix was generated from 30% of the training dataset points to identify the degree of misclassification in this classification. Higher accuracy was observed in the Google Earth Engine platform, and the script has been illustrated in the Materials and Methods section in Algorithm 4 (Appendix A.1 and Appendix A.2).

3. Results and Discussion

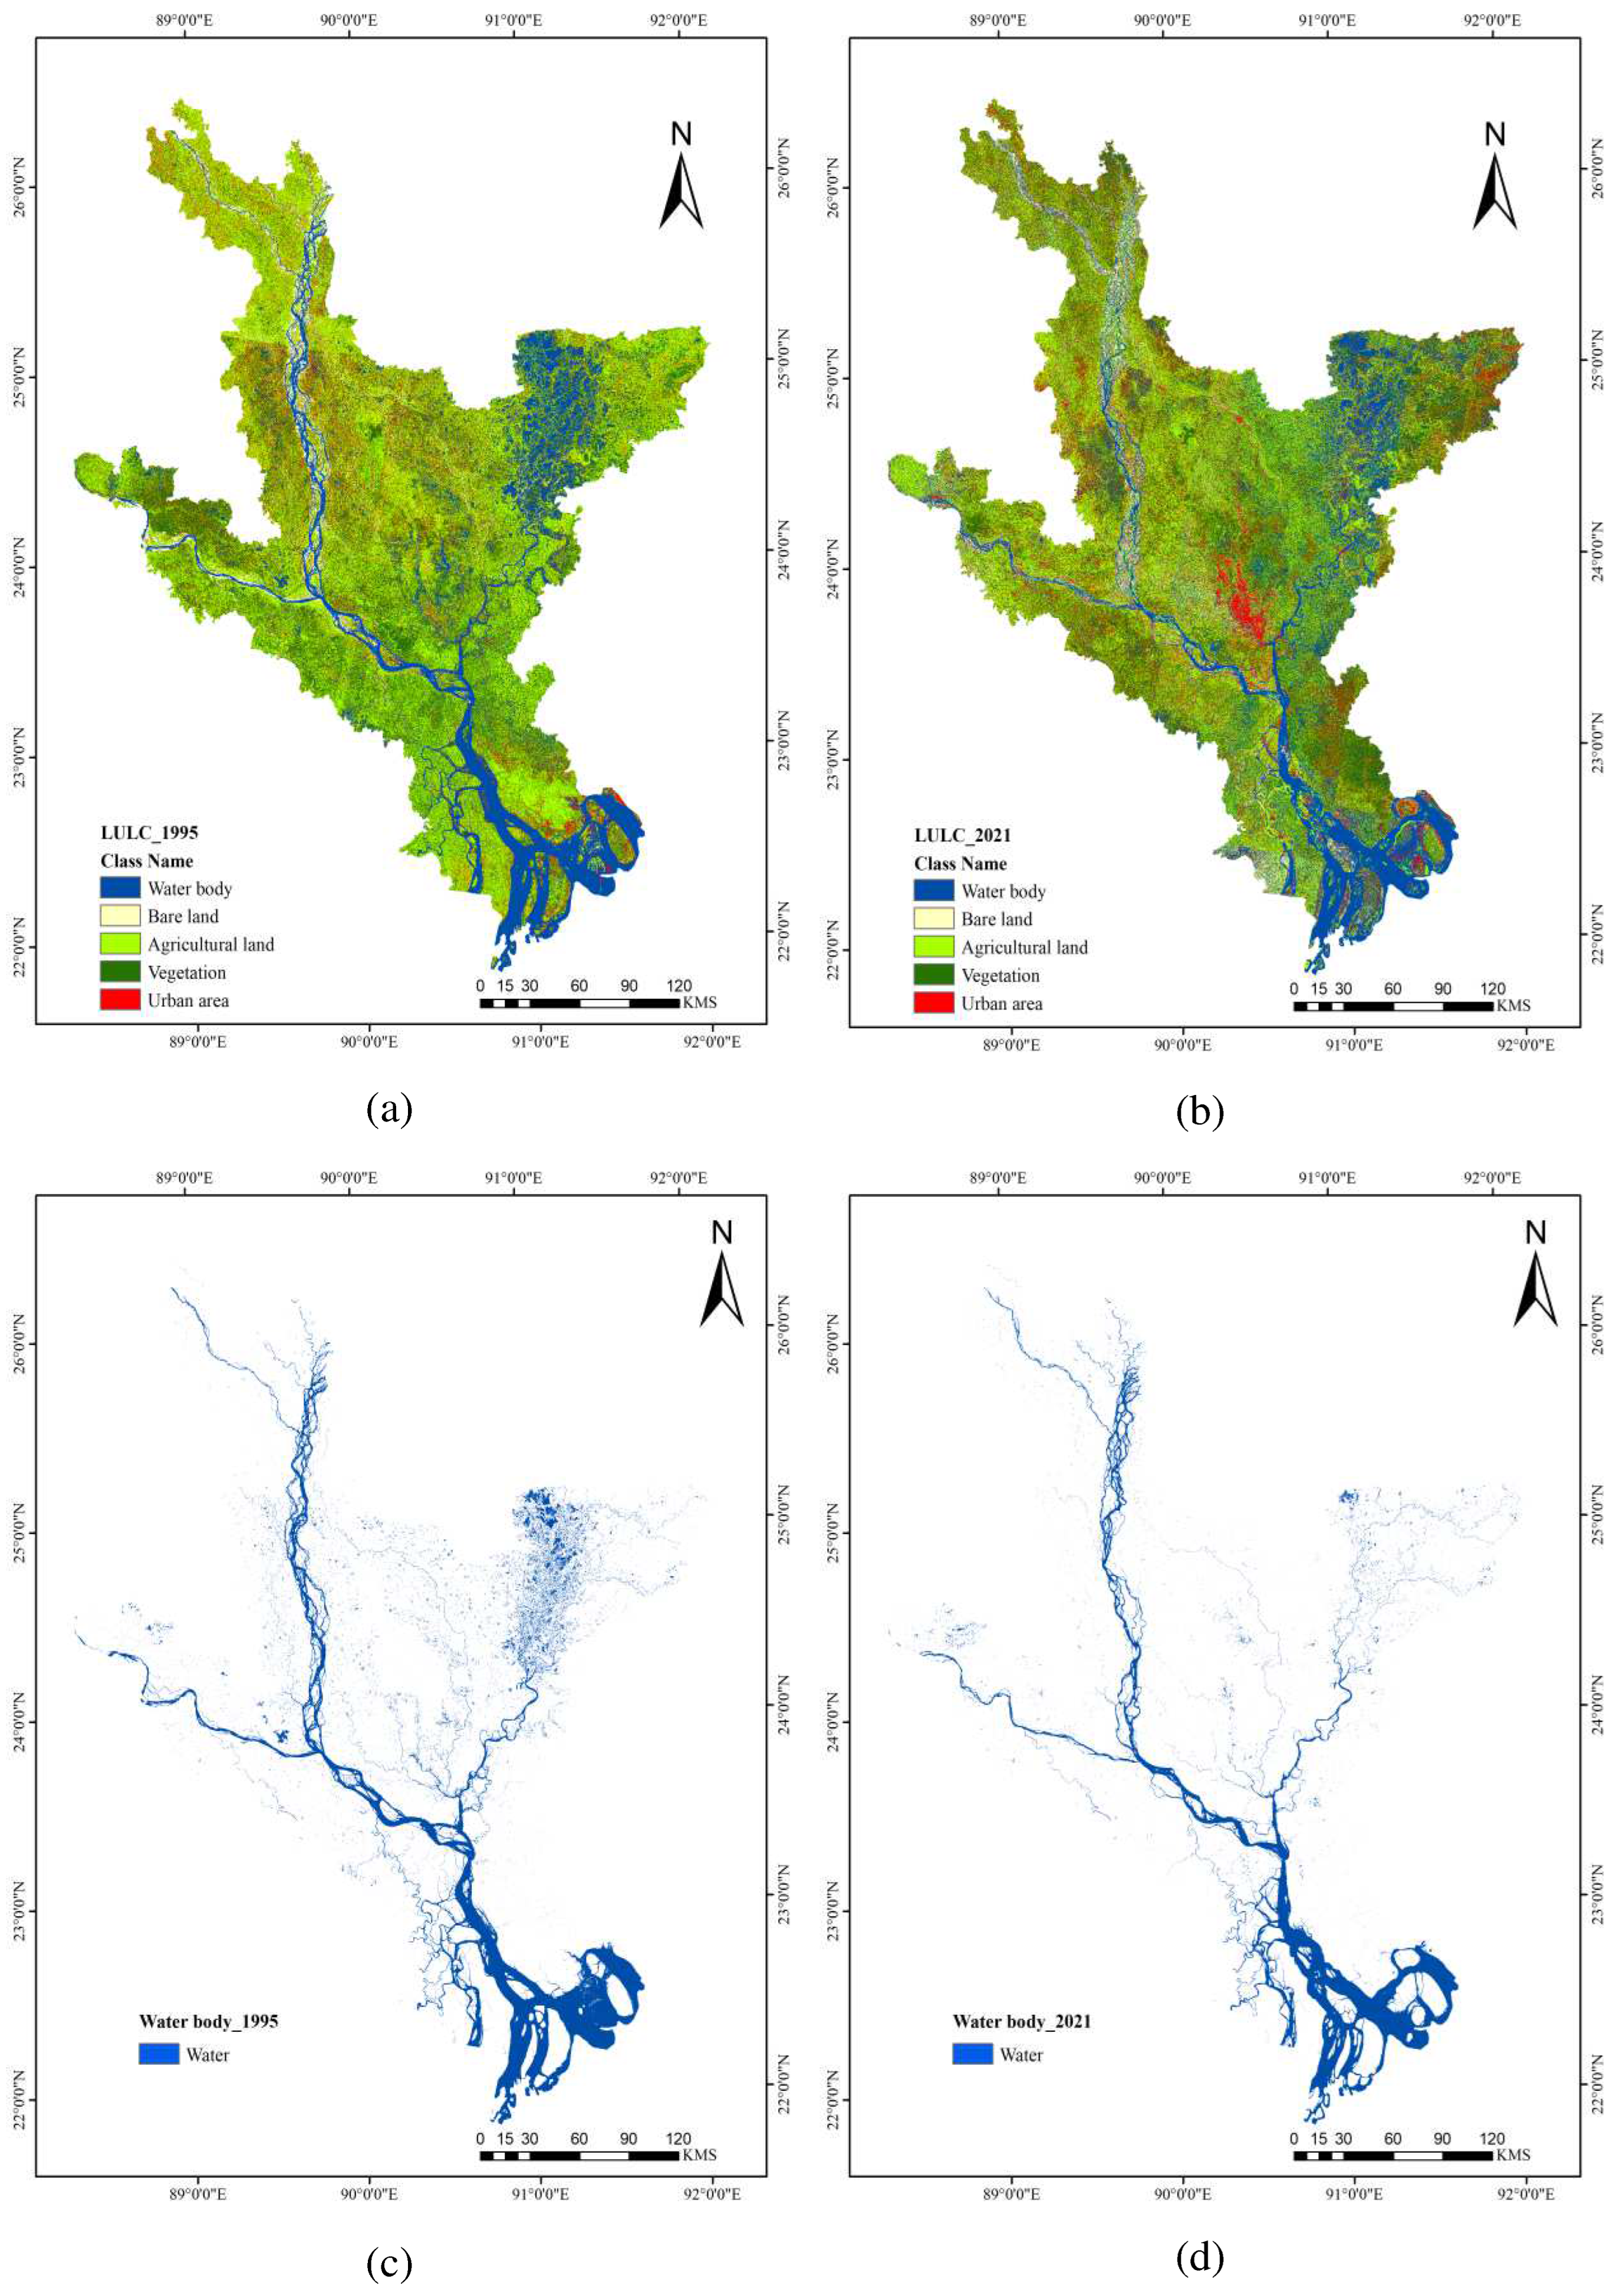
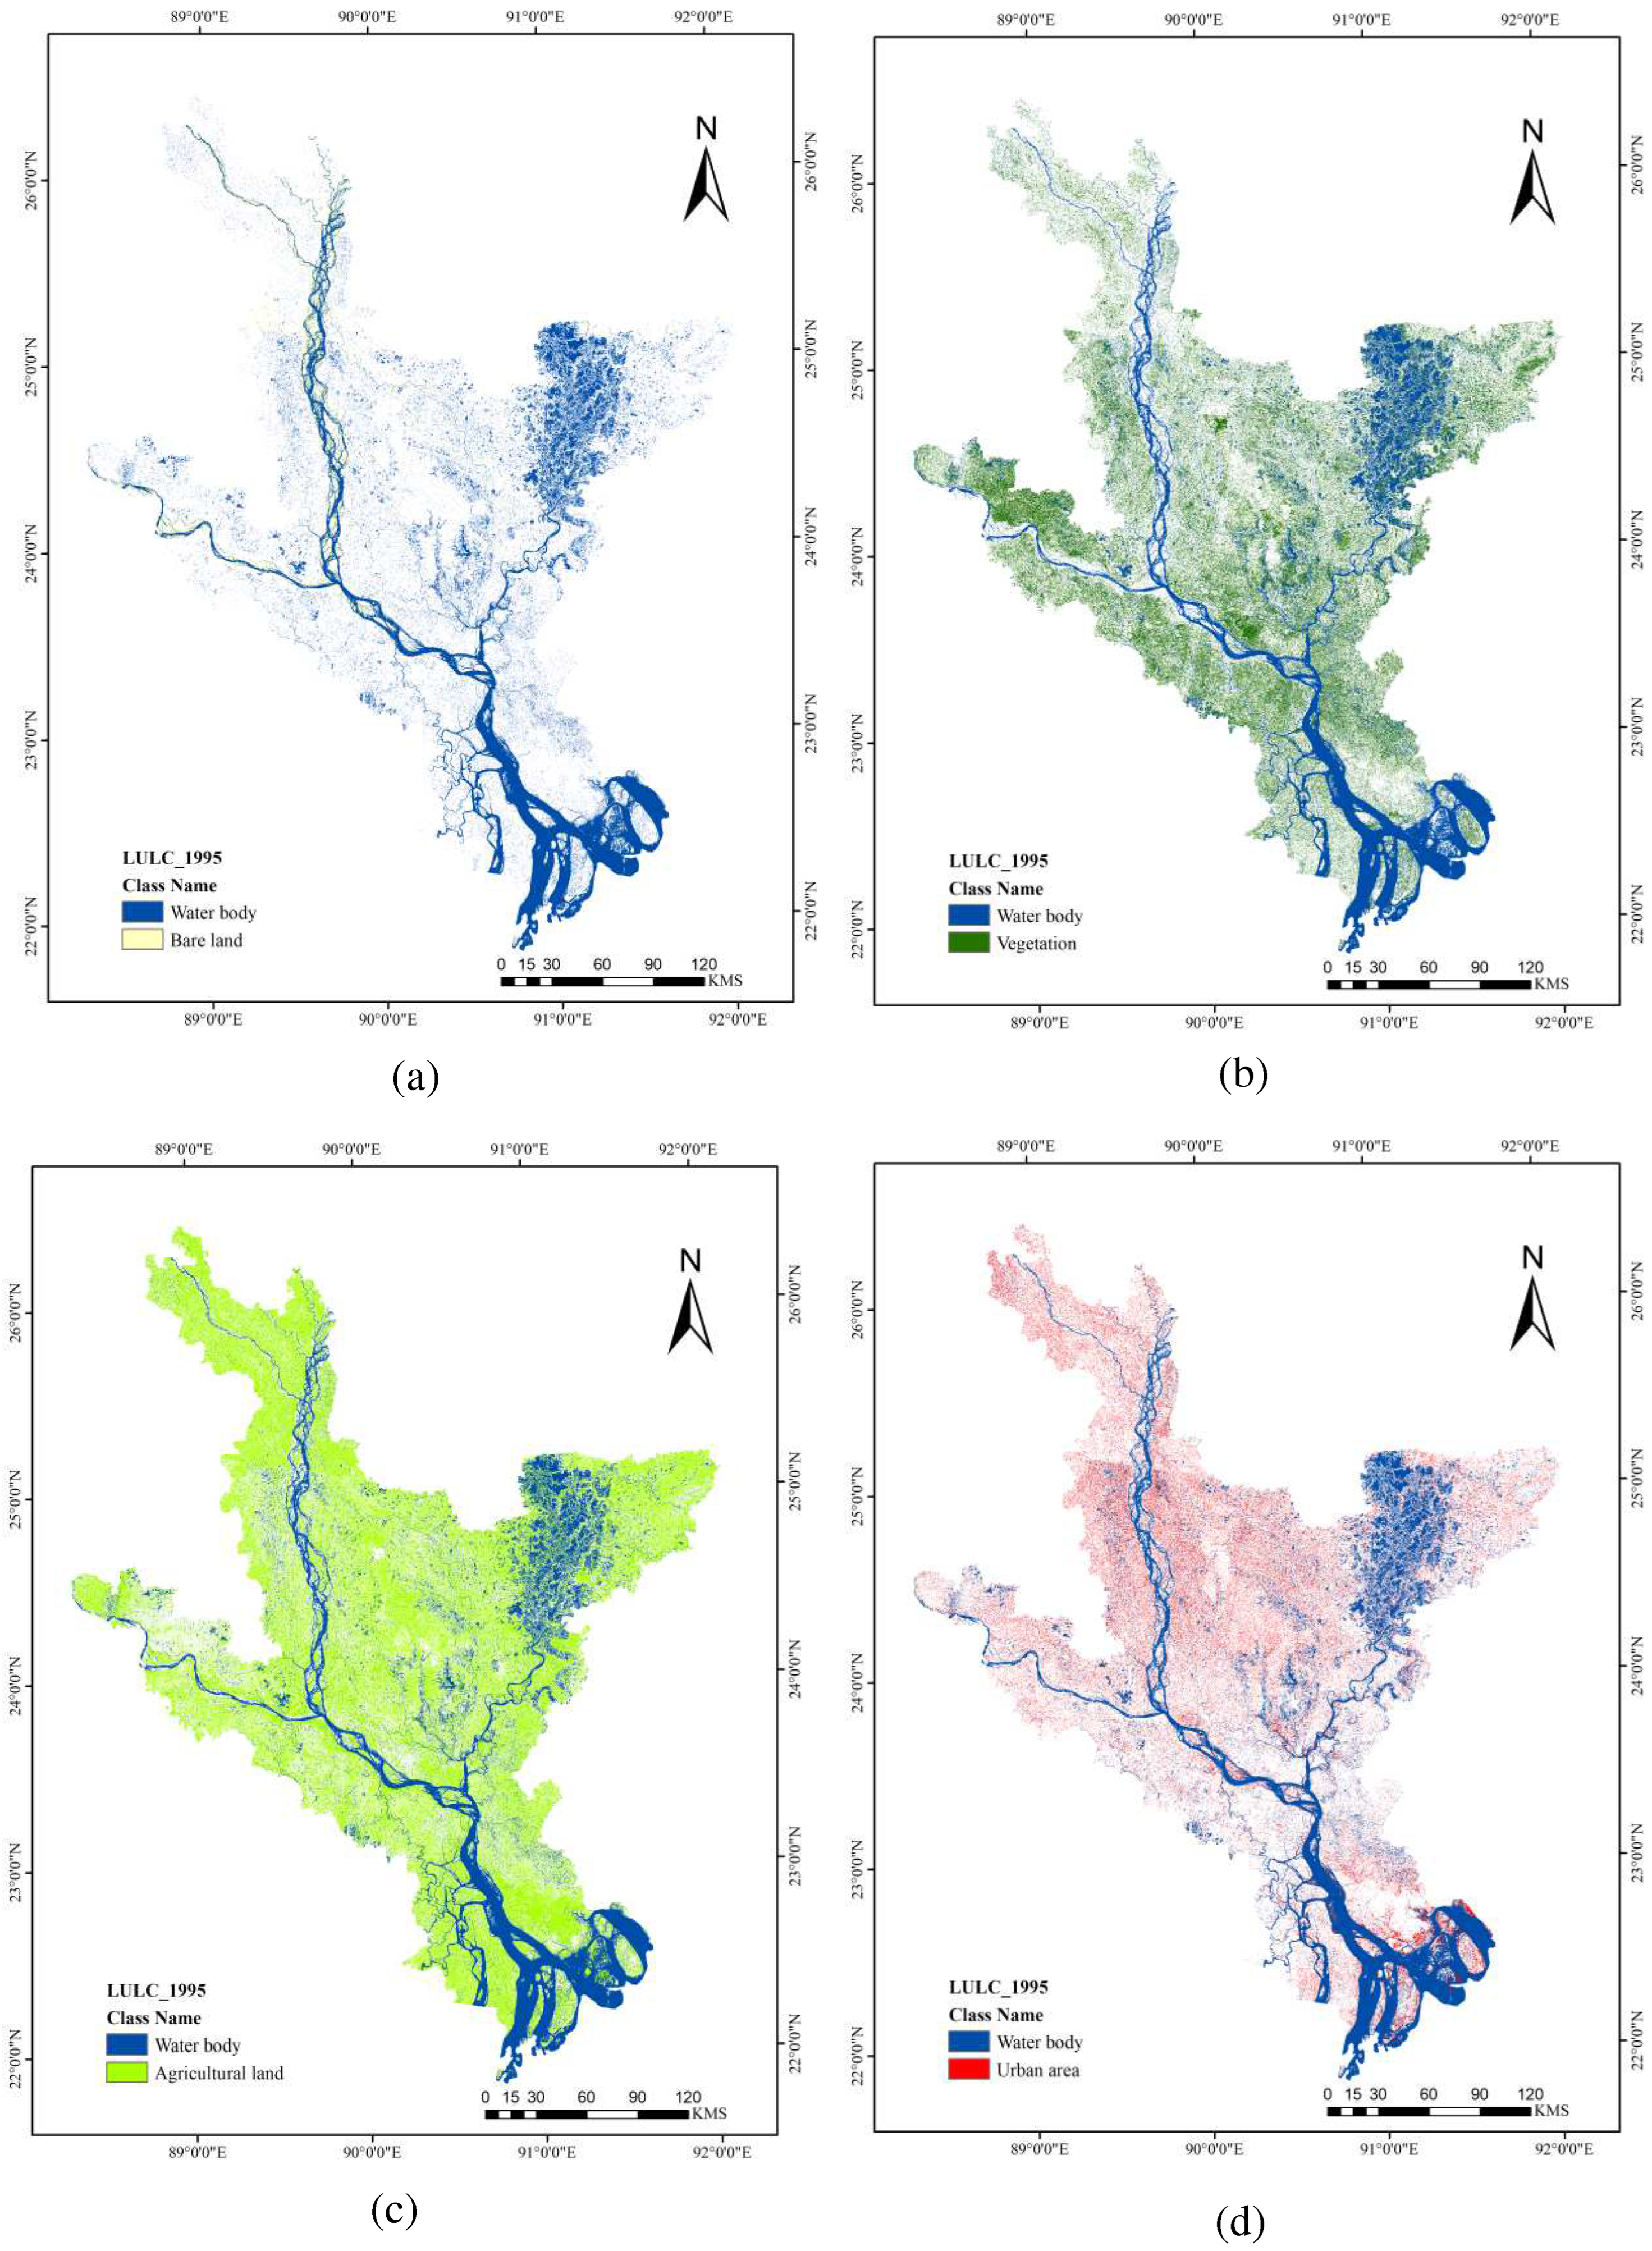
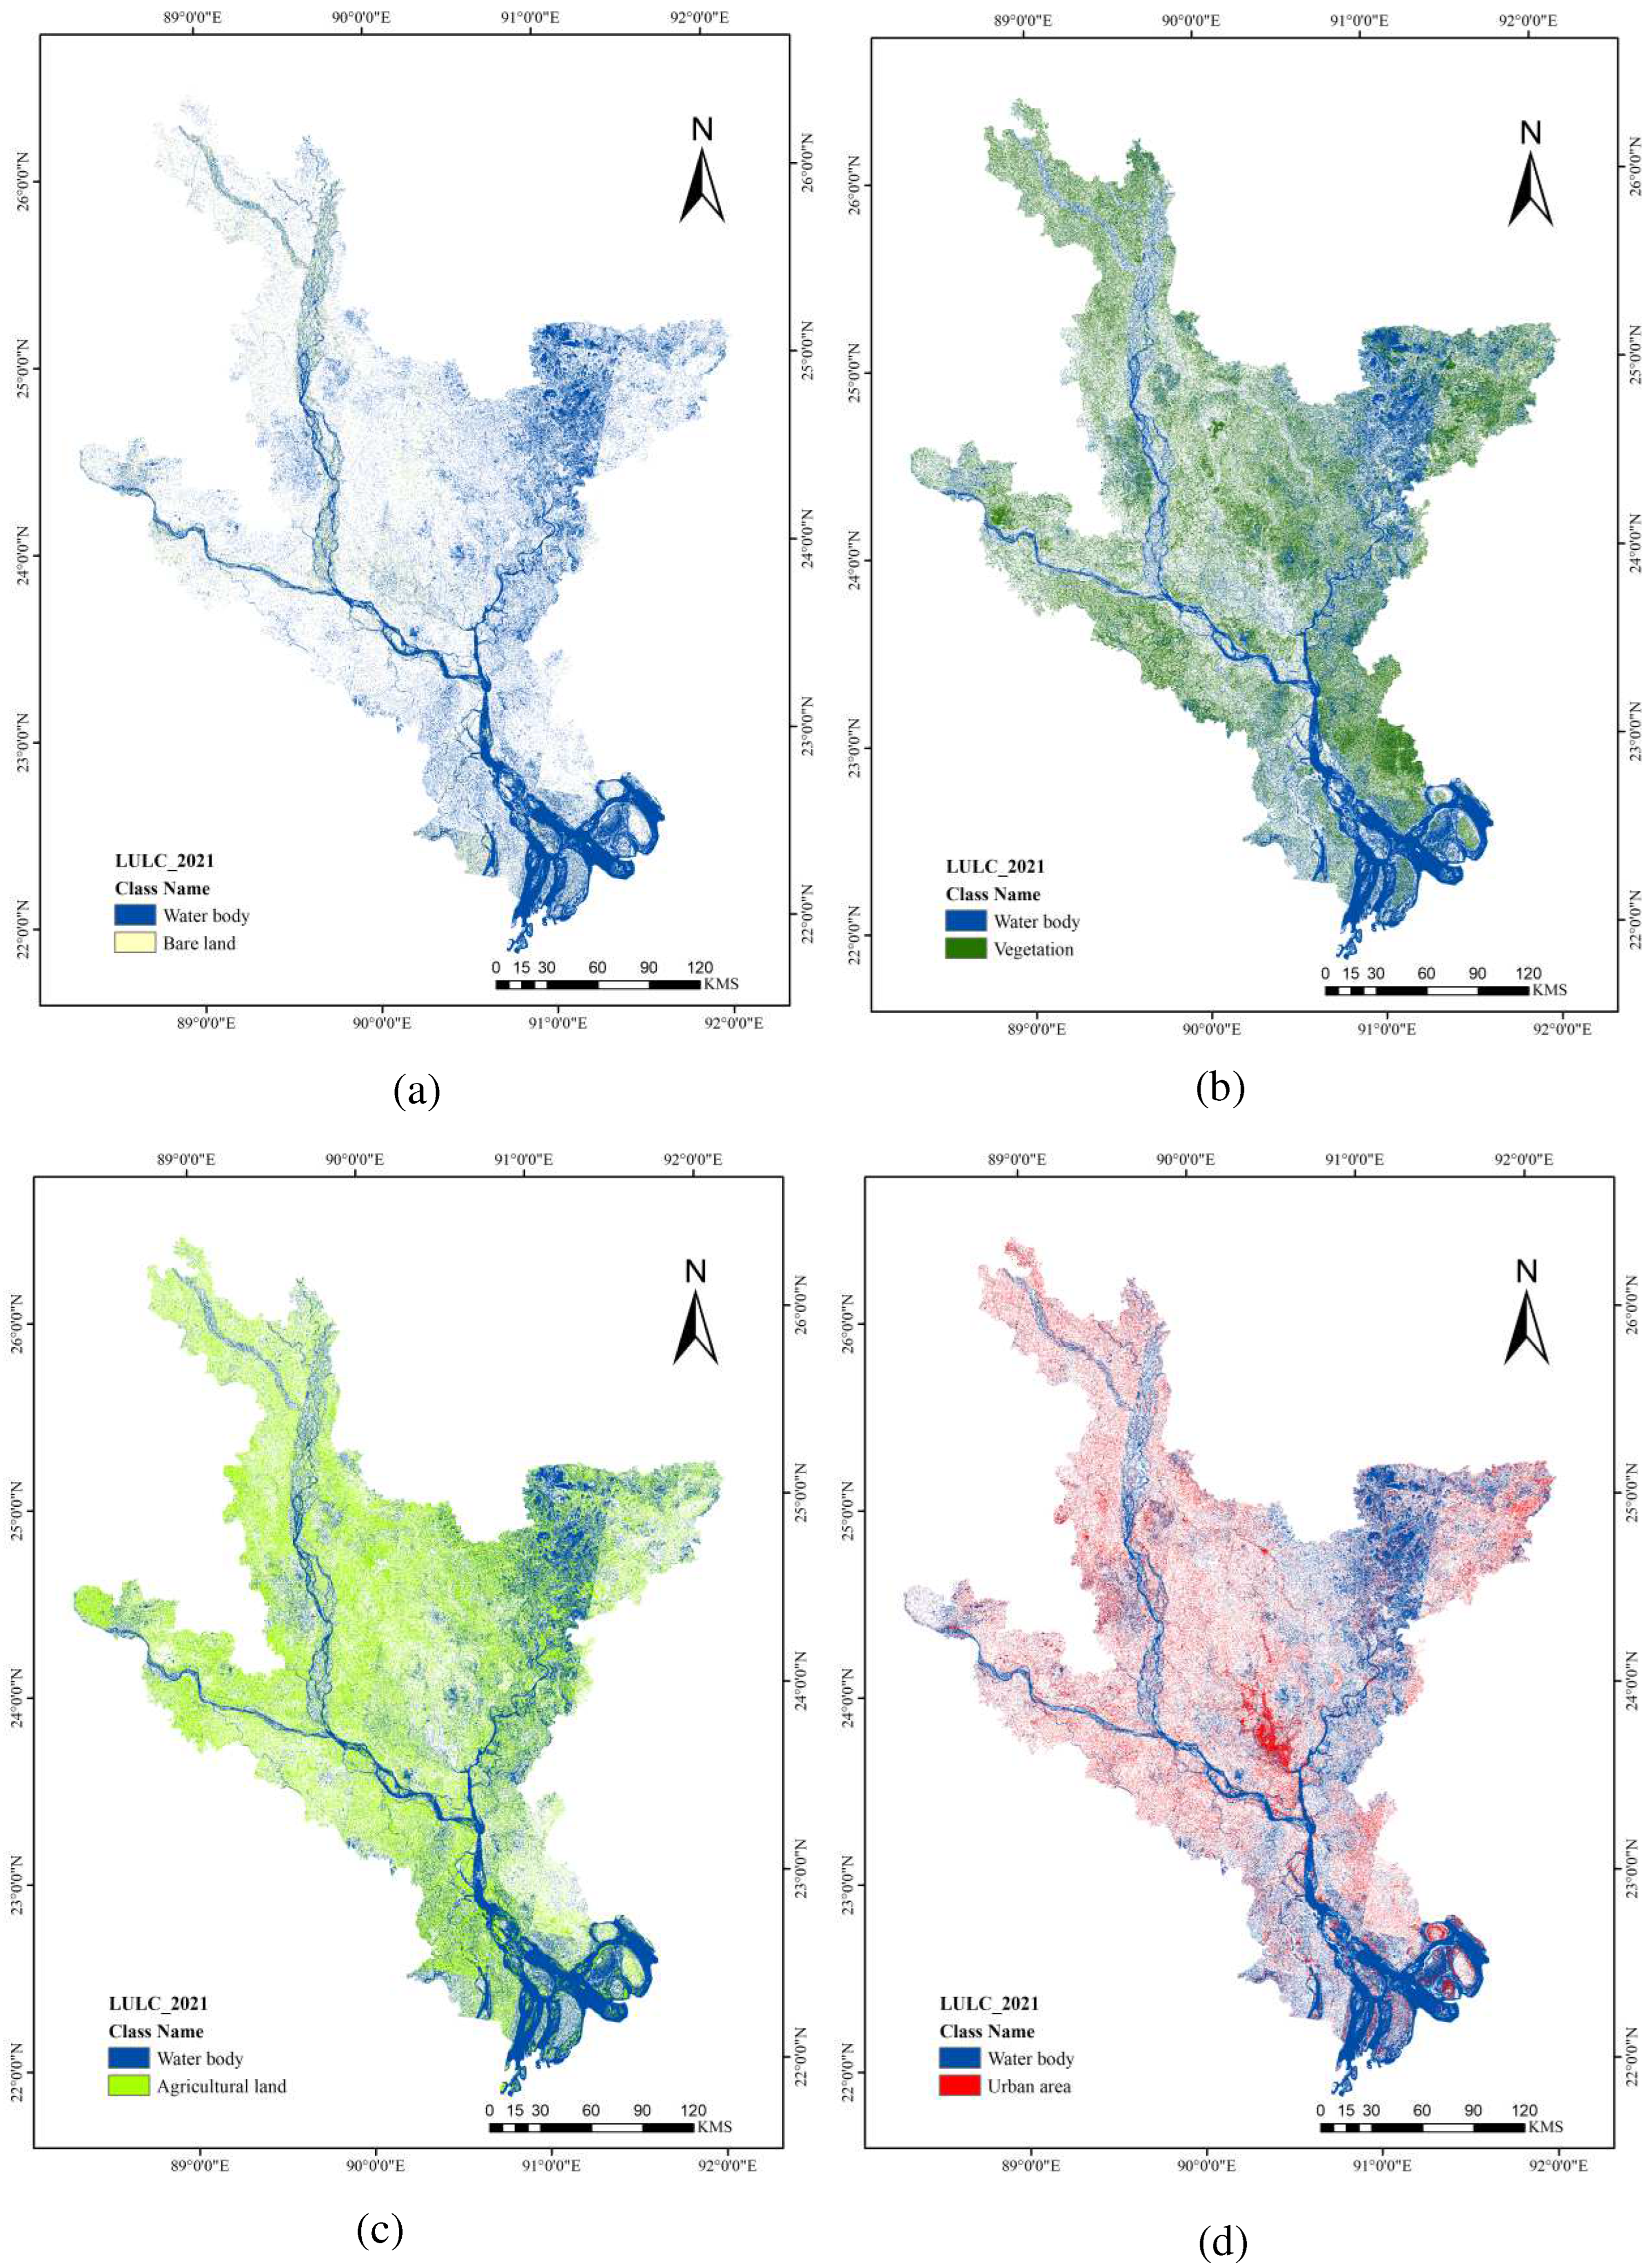
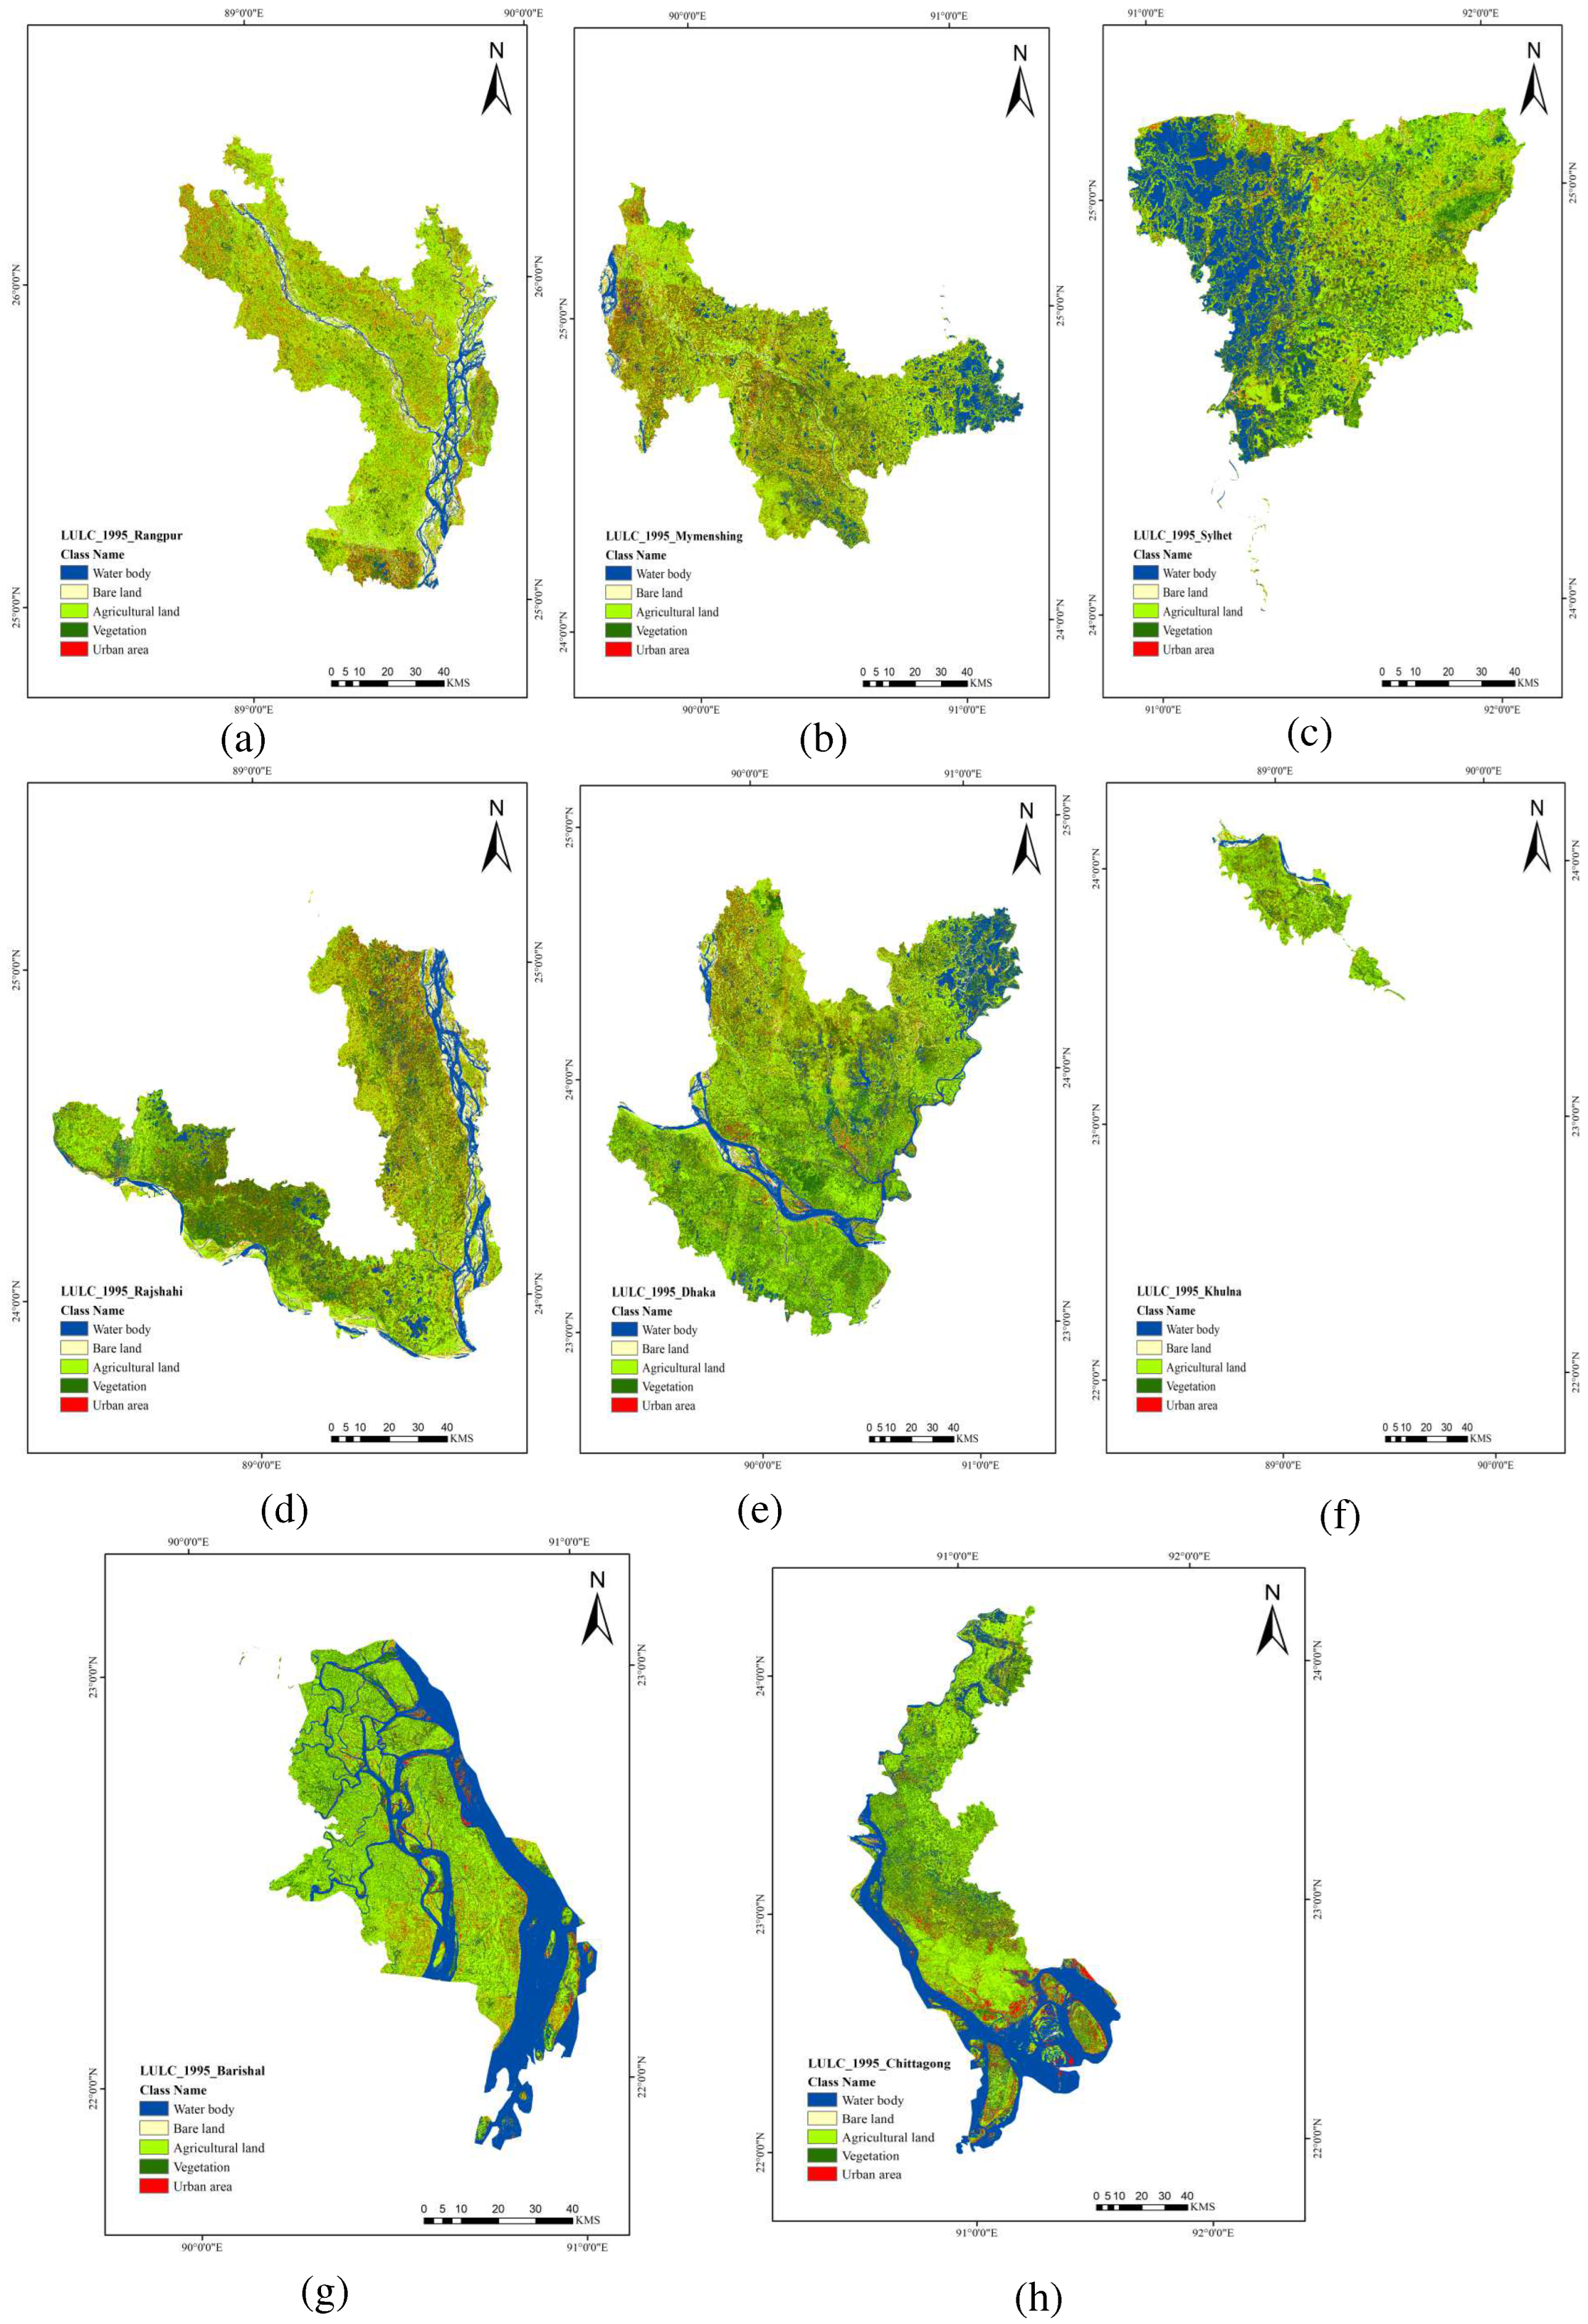
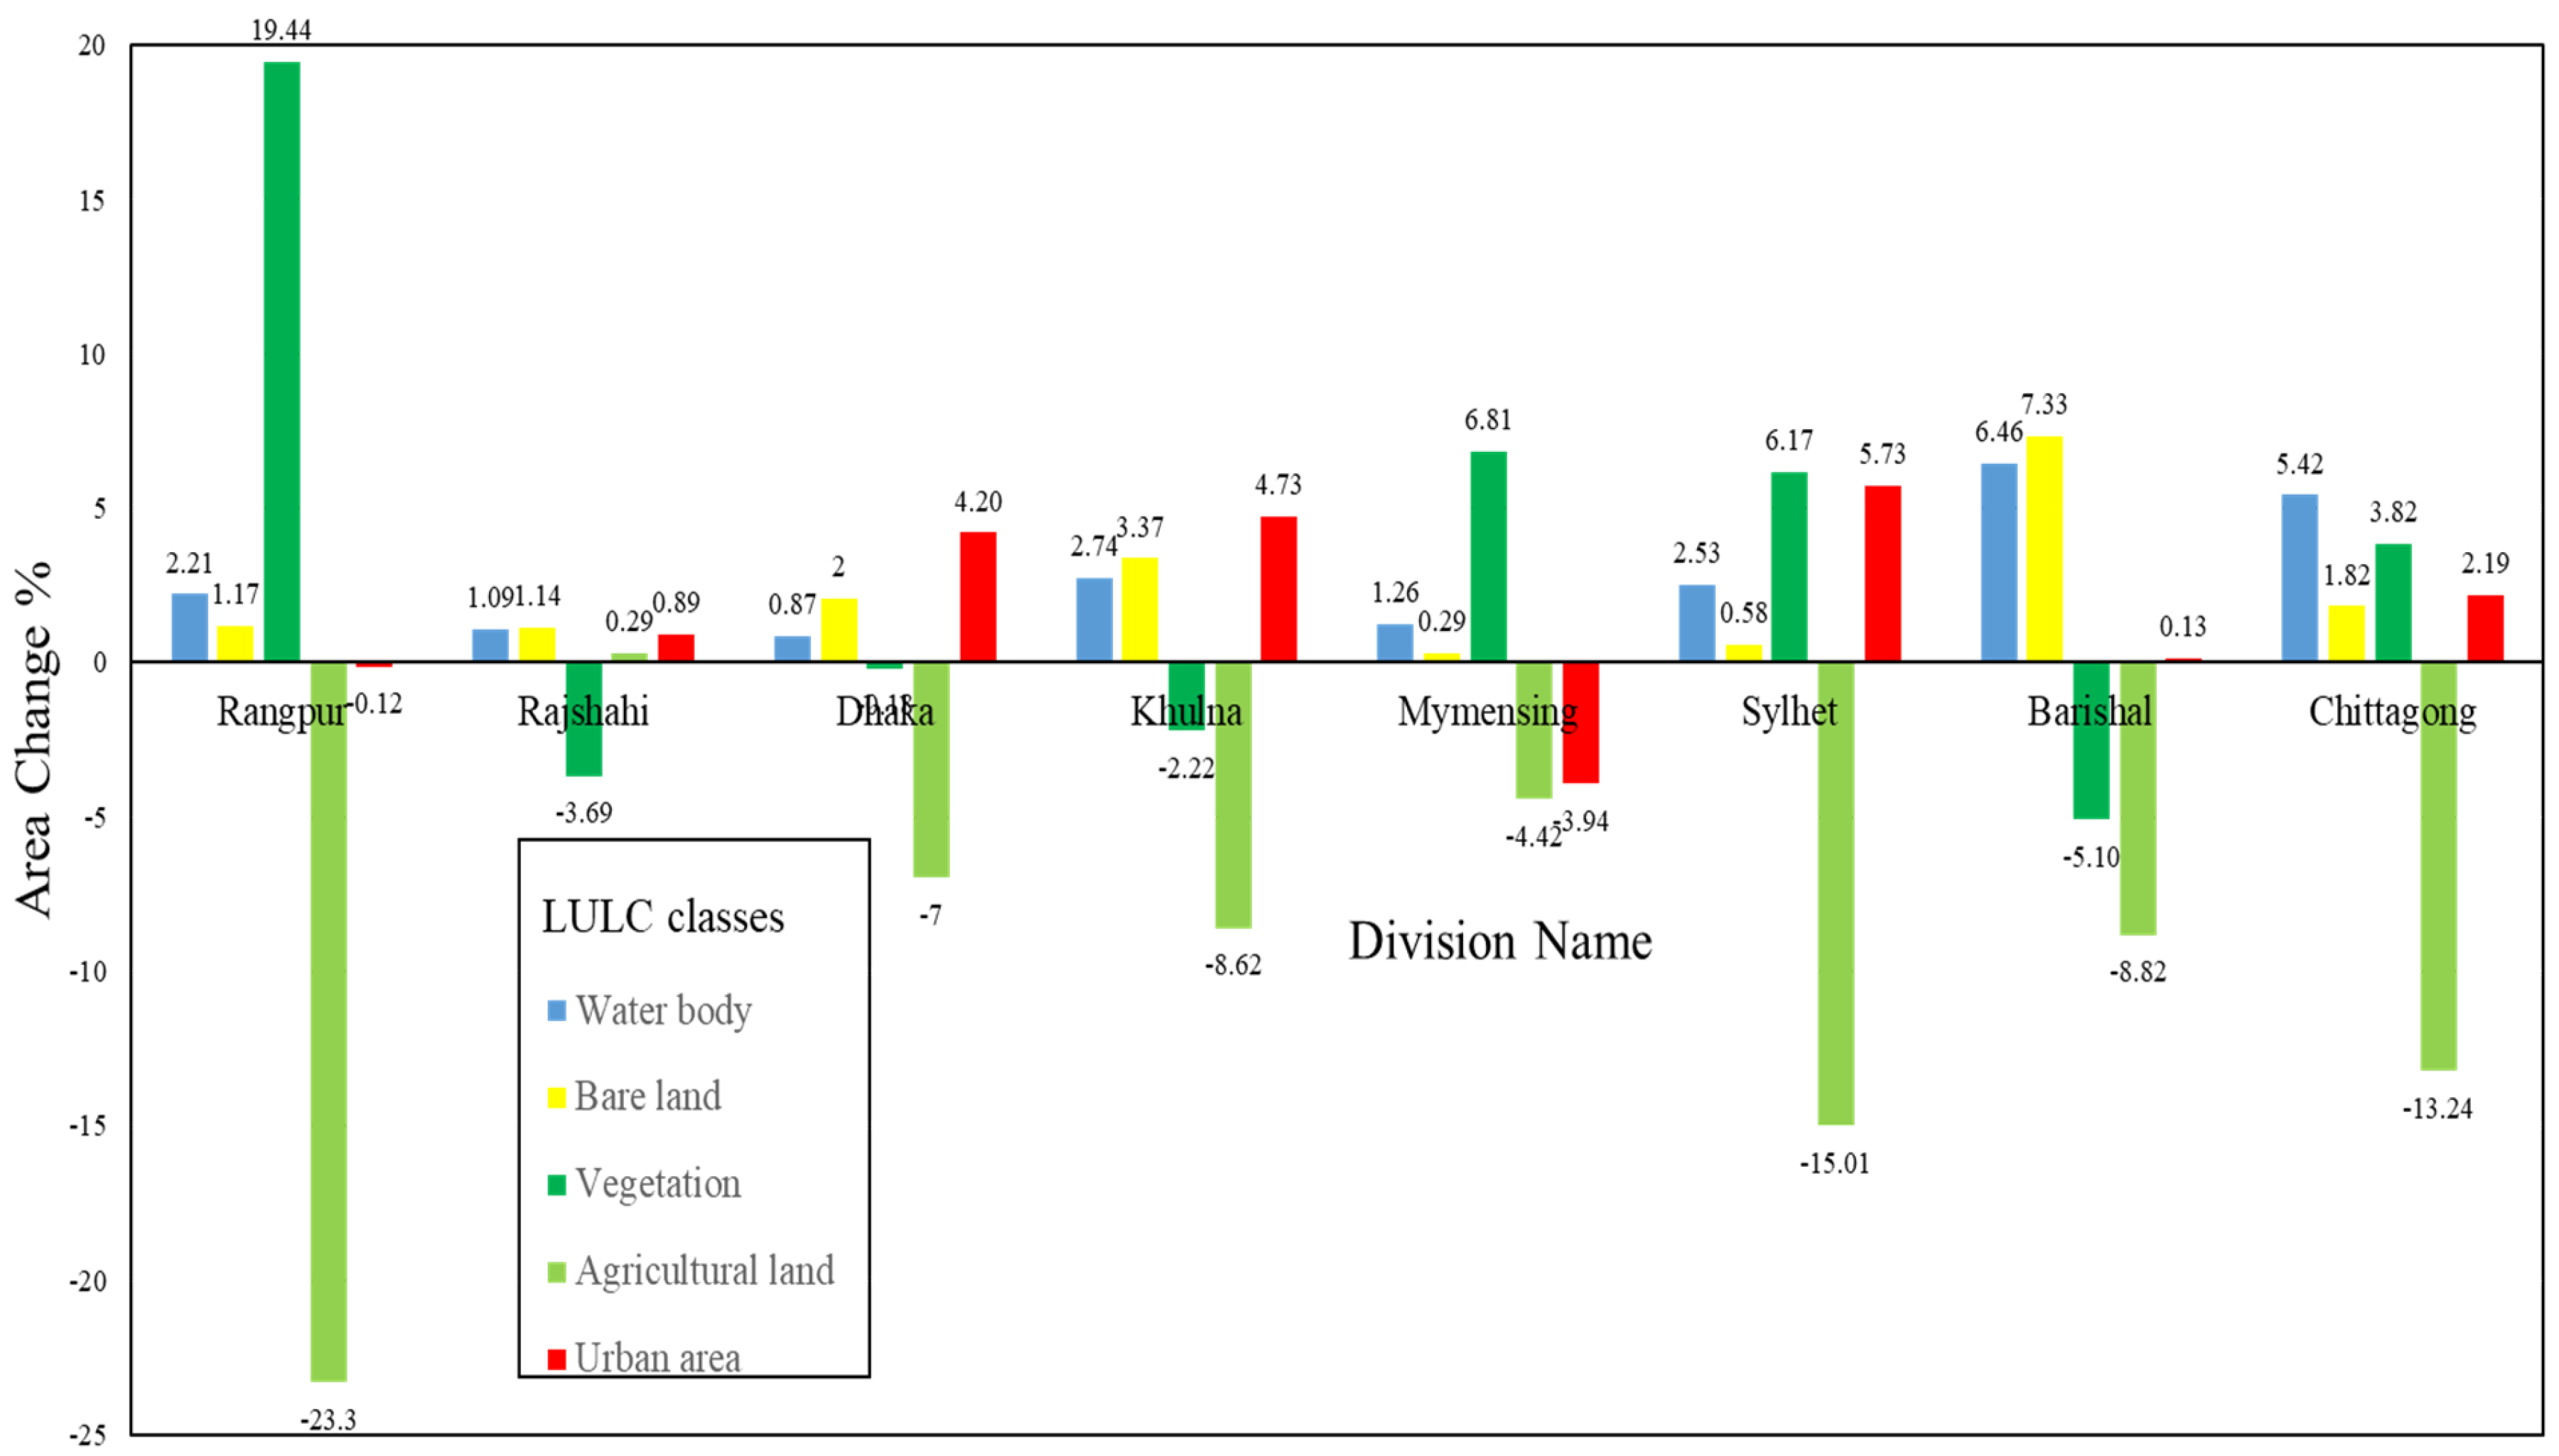
3.1. Land Use/Land Cover Assessment

The land use land cover (LULC) maps for 1995 and 2021 were prepared using Landsat 5 and Landsat 8 (OLI) images, respectively, for a total area of 64,555 km2. The analysis area was distributed within a 25-km territory of the main river systems of Bangladesh. From the LULC analysis for 1995, it was found that among the five land use classes, agricultural land (44.41%) and bare land (2.96%) occupied the highest and the lowest amount of analyzed area.
From the LULC map for 2021, it was also found that both agricultural land (32.73%) and bare land (5.13%) possessed the highest and the lowest amount of studied area. According to our analysis, water bodies, bare land, vegetation, and urban areas increased in 26 years span from 1995 to 2021, whereas a significant reduction of 11.68% was observed in agricultural land. The above results suggested that all other LULC classes occupied the former agricultural land (Figure 11; Table 2). Agricultural lands were reduced to meet the accommodation places, infrastructure as well as industrial facilities development for the increasing population of Bangladesh. They have also been converted into orchards for fruit production as fruit cultivations are less vulnerable to water inundation.
After analyzing the LULC map of eight administrative divisions, varied changes in land use classes were observed. Between the five LULC classes, water bodies, bare land, and urban areas increased in all the administrative divisions except Rangpur and Mymensingh. The areas of vegetation increased significantly in the Rangpur, Mymensingh, Sylhet, and Chittagong divisions. In the Rangpur division, vegetation increased by 19.44%, whereas agricultural land decreased by 23.3%, which suggested that the major agricultural land in this division was converted into areas of vegetation. Most of the areas of vegetation were used for fruit cultivation. In the Dhaka, Khulna, Sylhet, and Chittagong divisions, agricultural land decreased significantly from 1995 to 2021. In the Dhaka division, the urban area increased by 4.2%, whereas agricultural land decreased by 7%, and this agricultural land was converted into urban areas. The same scenario was observed for the Khulna, Sylhet, and Chittagong divisions; however, vegetation also increased. The one change that was common for all the divisions was a reduction in agricultural land area, which is alarming for the food security of Bangladesh (Table 3; Figure 12).

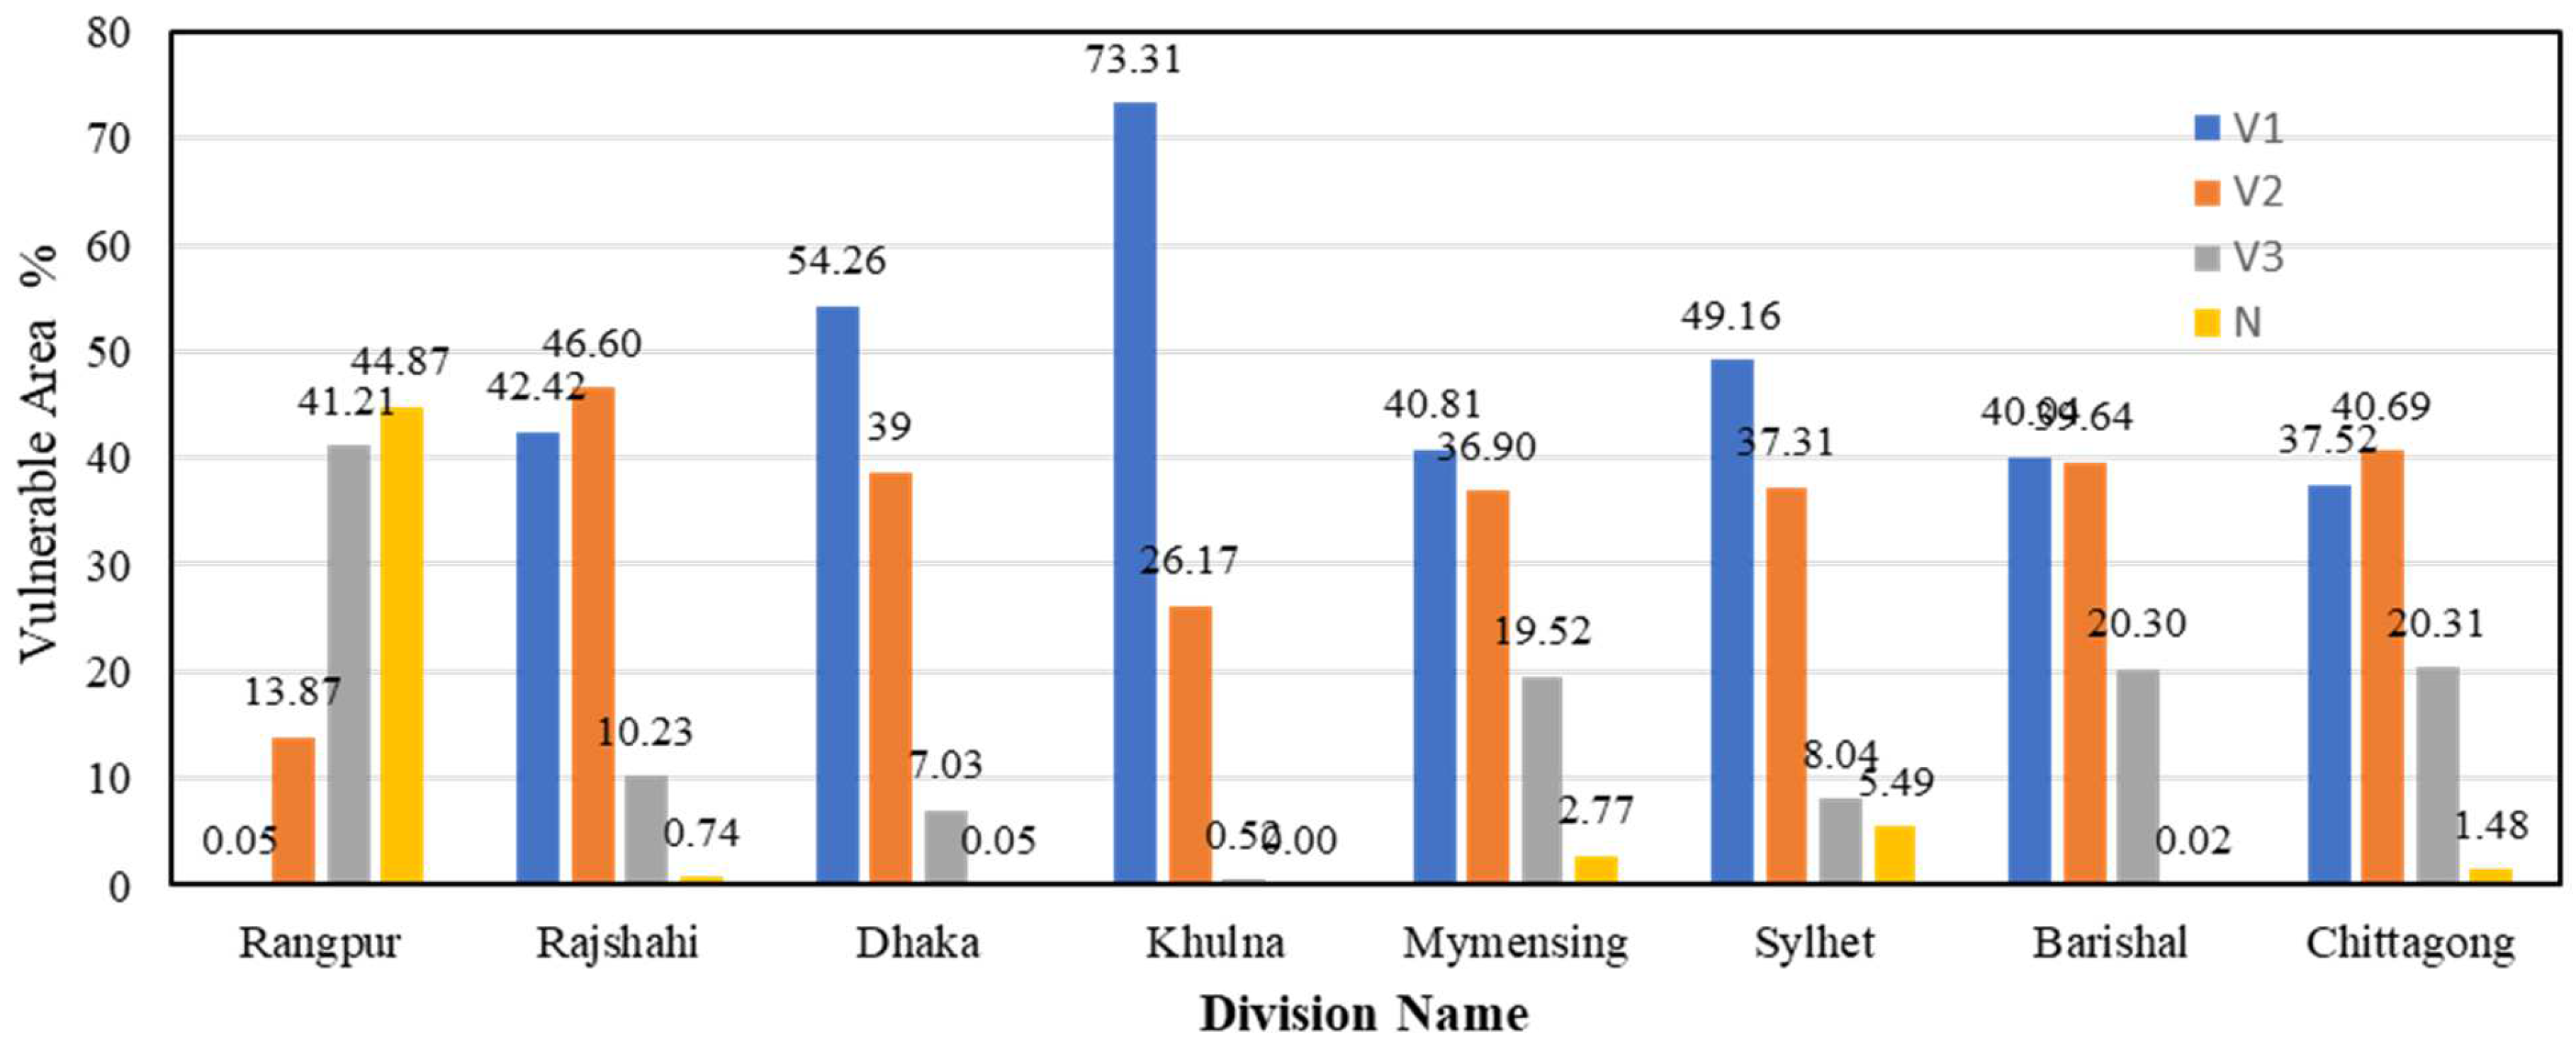
3.2. Vulnerability Analysis for Agricultural Land Use

According to our analysis of the 53,037 km2 area (total land area), 44.34% was found to be highly vulnerable for agricultural land use, 37.75% was moderately vulnerable, 13.92% was marginally vulnerable, and 3.98% was not vulnerable for agricultural use in terms of inundation by water (Table 4). Similar research was also reported for the northeastern region of Bangladesh, where every year, thousands of hectares of crops become damaged in the haor area by flash floods [10].
The vulnerability map was finally divided into the eight administrative divisions of Bangladesh according to their coverage in the analyzed area. Of all the divisions, Dhaka, Khulna, Mymensingh, and Barishal have the highest coverage of lands vulnerable for agricultural land use, whereas Rangpur, Rajshahi, and Chittagong have less vulnerable areas, and those divisions are relatively higher in elevation than the mean sea level. According to the land use land cover change assessment, it was found that water bodies and urban areas were increased in all administrative divisions, which made the agricultural land more vulnerable in these divisions. Rangpur had the largest amount of nonvulnerable areas for agricultural land use. However, most of the agricultural lands were transformed into fruit cultivation which was reflected by the increment of vegetated land in the LULC change assessment. In contrast, Khulna had the largest amount of vulnerable area for agricultural land use. However, nonvulnerable agricultural land was found within the analyzed zone of the Khulna division, as only a small area was analyzed for this study. Overall, most of the areas of the eight divisions were in high to moderately vulnerable classes for inundation by floods, but those areas were also reported as suitable for agricultural land use (Table 5; Figure 13).
Land use conversion is a dynamic process in the river basin of the study area, and it makes agricultural land vulnerable through erosion, flash flooding, and flooding during the rainy season [10]. There were some limitations in obtaining permanent bench points and a lack of yearly observations in the large deltaic region to compare the study results with ground truth data. The vulnerability map for agricultural land use was compared with the flood inundation map of Bangladesh developed from the 120-h forecast dataset by the Bangladesh Water Development Board (BWDB) on 16 August 2017 [36]. The vulnerability map of agricultural land use looks similar to the flood inundation map of 2017.

4. Conclusions

The present study was conducted to assess the LULC changes from 1995 to 2021 over 26 years within the 25 km territory of the main river systems in Bangladesh. Furthermore, the prediction of vulnerable areas for agricultural land use in terms of inundation by river water was also addressed. All the river and administrative shape files were collected from the Bangladesh Bureau of Statistics. The study was performed in the Google Earth Engine platform and analyzed in the ArcGIS® environment. According to our LULC maps for 1995 and 2021, of the five land use classes, water bodies, bare land, vegetation, and urban areas increased by 3.65%, 2.18%, 3.31%, and 2.55%, respectively, from 1995 to 2021 in the analyzed area, whereas a significant reduction of 11.68% was observed in agricultural land. The total reduction in agricultural land was approximately equal to the sum of the increases of the other land use classes. The main causes of the reduction of agricultural lands are conversion to urban and industrial settlements and the risk of crop loss due to water inundation threatening the livelihoods of the inhabitants of the large river tracks. That is why long-term land use planning, especially vulnerable lands in the river course, is very much required throughout the country. This research is one of the first attempts to identify the vulnerable land uses in the country’s river basins for assessments. According to our vulnerability map of the study area for agricultural land use, which was prepared by multicriteria analysis using a fuzzy expert system, the highly vulnerable area coverage was 44.34%, the moderately vulnerable area was 37.75%, the marginally vulnerable area was 13.98%, and the nonvulnerable area was 3.98% for agricultural land use. From the analysis, it was observed that the most changed land use class was agricultural land, and approximately 50% of the studied area was highly vulnerable to agricultural land use in terms of water inundation.
The developed method for land use and land cover based on the google earth engine had higher accuracy in interpreting changes in the country scale from the Ganges Brahmaputra (GBM) track to the deltaic transformation. Therefore, the presented LULC and vulnerability maps can be helpful for the future land use planning of Bangladesh to meet the increasing demand for agricultural land use for food production. Furthermore, the methodological process and outcomes of this research can be used for making an effective agricultural policy mitigating the damage of agricultural lands during a specific time of the year.

Author Contributions

Research Investigation, Methodology, Data Curation, Analysis, Interpretation of Results, and Writing of Original Draft K.F.A.; Research Conceptualization, Editing and Supervision T.A.; All authors have read and agreed to the published version of the manuscript.

Funding

This research received no external funding.

Acknowledgments

The author would like to acknowledge the University of Tsukuba for its support by providing software and laboratory facilities. We also express our sincere gratitude to the Bangladesh Bureau of Statistics (BBS) for providing the administrative and river shape files and the United States Geological Survey (USGS) for allowing free access to the Landsat satellite images and DEM data. We are also grateful to the Google Earth Engine Platform for free access for students and researchers for their studies. The author is grateful to the Rotary Yoneyama Foundation for financial support through a monthly scholarship.

Conflicts of Interest

The authors declare no conflict of interest.

Appendix A

Appendix A.1. LULC-1995

var L5 = ee.ImageCollection(“LANDSAT/LT05/C01/T1_TOA”)//Image retrieval of Landsat 5
  •  .filterBounds(ROI)
     .filterDate(“1995-01-01”, “1996-3-30”)
     .filterMetadata(‘CLOUD_COVER’,’less_than’, 1)
     .mean()
     .clip(ROI);
Map.addLayer(L5, {bands:[“B4”, “B3”, “B2”]}); // False color Composite image preparation
var training_points = Water.merge(Chorland).merge(Vegetation).merge(Agriculture).merge(Urban);
var training_data = L5.sampleRegions({collection:training_points,properties:[‘LC’],scale:30})
var classifier = ee.Classifier.smileCart()
var classifier = classifier.train({features:training_data,classProperty: ‘LC’,inputProperties:[“B1”, “B2”,
“B3”, “B4”, “B5”, “B6”, “B7”]});
var classified_image = L5.classify(classifier);
var trainingData = training_data.randomColumn();
var trainSet = trainingData.filter(ee.Filter.lessThan(‘random’, 0.7));
var testSet = trainingData.filter(ee.Filter.greaterThanOrEquals(‘random’, 0.7));
Map.addLayer(classified_image,{min:0, max:4, palette:[ ‘pink’, ‘yellow’, ‘green’, ‘blue’, ‘red’]},’classified image’);
//Accuracy Assessment
//Classify the dataSet and get confusion matrix
var confusionMatrix = ee.ConfusionMatrix(testSet.classify(classifier)
  .errorMatrix({
 actual: ‘LC’,
 predicted: ‘classification’
  }))
  print(‘Confusion Matrix’, confusionMatrix);
  print(“Overall Accuracy:”, confusionMatrix.accuracy());
//Map export to google drive
Export.image.toDrive({
  •  image: classified_image,
     description:’ExportedData’,
     folder:”GEE”,
     region: ROI,
     scale: 30,
     maxPixels: 1e13,
     });

Appendix A.2. LULC-2021

//LULC-2021
var L8 = ee.ImageCollection(“LANDSAT/LC08/C01/T1_TOA”)//Image retrieval of Landsat 8(OLI)
  •  .filterBounds(ROI)
     .filterDate(“2021-01-01”, “2022-3-30”)
     .filterMetadata(‘CLOUD_COVER’,’less_than’, 1)
     .mean()
     .clip(ROI);
Map.addLayer(L8, {bands:[“B5”, “B4”, “B3”]});//False color Composite image preparation
var training_points = Water.merge(Chorland).merge(Vegetation).merge(Agriculture).merge(Urban);
var training_data = L8.sampleRegions({collection:training_points,properties:[‘LC’],scale:30})
var classifier = ee.Classifier.smileCart()
var classifier = classifier.train({features:training_data,classProperty: ‘LC’,inputProperties:[“B1”, “B2”, “B3”, “B4”, “B5”, “B6”, “B7”]});
var classified_image = L8.classify(classifier);
var trainingData = training_data.randomColumn();
var trainSet = trainingData.filter(ee.Filter.lessThan(‘random’, 0.8));
var testSet = trainingData.filter(ee.Filter.greaterThanOrEquals(‘random’, 0.8));
Map.addLayer(classified_image,{min:0, max:4, palette:[ ‘pink’, ‘yellow’, ‘green’, ‘blue’, ‘red’]},’classified image’);
//Accuracy Assessment
//Classify the testSet and get a confusion matrix
var confusionMatrix = ee.ConfusionMatrix(testSet.classify(classifier)
  •  .errorMatrix({
     actual: ‘LC’,
     predicted: ‘classification’
     }));
     print(‘Confusion Matrix’, confusionMatrix);
     print(“Overall Accuracy:”, confusionMatrix.accuracy());
//Map export to google drive
Export.image.toDrive({
  •  image: classified_image,
     description:’ExportedData’,
     folder:”GEE”,
     region: ROI,
     scale: 30,
     maxPixels: 1e13,
     });

Appendix A.3. NDWI map for 1995 and 2021

//NDWI-1995
var L5 = ee.ImageCollection(“LANDSAT/LT05/C01/T1_TOA”)//Image retrieval of Landsat 5
  •  .filterBounds(ROI)
     .filterDate(“1995-01-01”, “1996-3-30”)
     .filterMetadata(‘CLOUD_COVER’,’less_than’, 1)
     .mean()
     .clip(ROI);
     var green = L5.select(‘B2’);
     var nir = L5.select(‘B4’);
var ndwi = green.subtract(nir).divide(green.add(nir)).rename(‘NDWI’);
var ndwiParams = {min: -1, max: 1, palette: [‘black’, ‘white’, ‘blue’]};
 Map.addLayer(ndwi, ndwiParams, ‘NDWI image’);
//Map export to google drive
Export.image.toDrive({
  •  image: ndwi,
     description:’ExportedData’,
     folder:”GEE”,
     region: ROI,
     scale: 30,
     maxPixels: 1e13,
     });
NDWI-2021
var L8 = ee.ImageCollection(“LANDSAT/LC08/C01/T1_TOA”) //Image retrieval of Landsat 8(OLI)
  •  .filterBounds(ROI)
     .filterDate(“2021-01-01”, “2022-3-30”)
     .filterMetadata(‘CLOUD_COVER’,’less_than’, 1)
     .mean()
     .clip(ROI);
var green = L8.select(‘B3’);
var nir = L8.select(‘B5’);
var ndwi = green.subtract(nir).divide(green.add(nir)).rename(‘NDWI’);
var ndwiParams = {min: -1, max: 1, palette: [‘black’, ‘white’, ‘blue’]};
Map.addLayer(ndwi, ndwiParams, ‘NDWI image’);
//Map export to google drive
Export.image.toDrive({
  •  image: ndwi,
     description:’ExportedData’,
     folder:”GEE”,
     region: ROI,
     scale: 30,
     maxPixels: 1e13,
     });

References

  1. Hossain, M.S.; Arshad, M.; Qian, L.; Kächele, H.; Khan, I.; Islam, M.D.I.; Mahboob, M.G. Climate change impacts on farmland value in Bangladesh. Ecol. Indic. 2020, 112, 106181. [Google Scholar] [CrossRef]
  2. Csaplovics, E. High-resolution space imagery for regional environmental monitoring-status quo and future trends. Int. Arch. Photogramm. Remote Sens. 1998, 32, 211–216. [Google Scholar]
  3. Foody, G.M. Status of land cover classification accuracy assessment. Remote Sens. Environ. 2002, 80, 185–201. [Google Scholar] [CrossRef]
  4. Akıncı, H.; Özalp, A.Y.; Turgut, B. Agricultural land use suitability analysis using GIS and AHP technique. Comput. Electron. Agric. 2013, 97, 71–82. [Google Scholar] [CrossRef]
  5. Li, X. A review of the international researches on land use/land cover change. Acta Geogr. Sin.-Chin. Ed. 1996, 51, 558–565. [Google Scholar]
  6. Disperati, L.; Virdis, S.G.P. Assessment of land-use and land-cover changes from 1965 to 2014 in Tam Giang-Cau Hai Lagoon, central Vietnam. Appl. Geogr. 2015, 58, 48–64. [Google Scholar] [CrossRef]
  7. Khan, L.R. Impacts of recent floods on the rural environment of Bangladesh: A case study. Int. J. Water Resour. Dev. 1991, 7, 45–52. [Google Scholar] [CrossRef]
  8. Khan, I.; Ahammad, M.; Sarker, S. A study on River Bank Erosion of Jamuna River Using GIS and Remote Sensing Technology. Int. J. Eng. Dev. Res. 2014, 2, 3365–3371. [Google Scholar]
  9. Shamsuzzoha, M.; Noguchi, R.; Ahamed, T. Damaged area assessment of cultivated agricultural lands affected by cyclone bulbul in coastal region of Bangladesh using Landsat 8 OLI and TIRS datasets. Remote Sens. Appl. Soc. Environ. 2021, 23, 100523. [Google Scholar] [CrossRef]
  10. Islam, M.M.; Ujiie, K.; Noguchi, R.; Ahamed, T. Flash flood-induced vulnerability and need assessment of wetlands using remote sensing, GIS, and econometric models. Remote Sens. Appl. Soc. Environ. 2022, 25, 100692. [Google Scholar] [CrossRef]
  11. Ferretti, V.; Pomarico, S. An integrated approach for studying the land suitability for ecological corridors through spatial multicriteria evaluations. Environ. Dev. Sustain. 2013, 15, 859–885. [Google Scholar] [CrossRef]
  12. Hossain, M.S.; Chowdhury, S.R.; Das, N.G.; Sharifuzzaman, S.M.; Sultana, A. Integration of GIS and multicriteria decision analysis for urban aquaculture development in Bangladesh. Landsc. Urban Plan. 2009, 90, 119–133. [Google Scholar] [CrossRef]
  13. Ferretti, V.; Pomarico, S. Integrated sustainability assessments: A spatial multicriteria evaluation for siting a waste incinerator plant in the Province of Torino (Italy). Environ. Dev. Sustain. 2012, 14, 843–867. [Google Scholar] [CrossRef]
  14. Hassan, M.M.; Nazem, M.N.I. Examination of land use/land cover changes, urban growth dynamics, and environmental sustainability in Chittagong city, Bangladesh. Environ. Dev. Sustain. 2016, 18, 697–716. [Google Scholar] [CrossRef]
  15. Frazier, P.S.; Page, K.J. Water body detection and delineation with Landsat TM data. Photogramm. Eng. Remote Sens. 2000, 66, 1461–1468. [Google Scholar]
  16. Tehrany, M.S.; Lee, M.J.; Pradhan, B.; Jebur, M.N.; Lee, S. Flood susceptibility mapping using integrated bivariate and multivariate statistical models. Environ. Earth Sci. 2014, 72, 4001–4015. [Google Scholar] [CrossRef]
  17. Khosravi, K.; Nohani, E.; Maroufinia, E.; Pourghasemi, H.R. A GIS-based flood susceptibility assessment and its mapping in Iran: A comparison between frequency ratio and weights-of-evidence bivariate statistical models with multi-criteria decision-making technique. Nat. Hazards 2016, 83, 947–987. [Google Scholar] [CrossRef]
  18. Muhsin, N.; Ahamed, T.; Noguchi, R. GIS-based multi-criteria analysis modeling used to locate suitable sites for industries in suburban areas in Bangladesh to ensure the sustainability of agricultural lands. Asia-Pac. J. Reg. Sci. 2018, 2, 35–64. [Google Scholar] [CrossRef]
  19. Purnamasari, R.A.; Noguchi, R.; Ahamed, T. Land suitability assessments for yield prediction of cassava using geospatial fuzzy expert systems and remote sensing. Comput. Electron. Agric. 2019, 166, 105018. [Google Scholar] [CrossRef]
  20. Das, A.C.; Noguchi, R.; Ahamed, T. Integrating an expert system, gis, and satellite remote sensing to evaluate land suitability for sustainable tea production in bangladesh. Remote Sens. 2020, 12, 4136. [Google Scholar] [CrossRef]
  21. Habibie, M.I.; Noguchi, R.; Shusuke, M.; Ahamed, T. Land suitability analysis for maize production in Indonesia using satellite remote sensing and GIS-based multicriteria decision support system. Geo J. 2021, 86, 777–807. [Google Scholar] [CrossRef]
  22. Johnson, S.Y.; Nuralam, A. Sedimentation and tectonics of the Sylhet trough, Bangladesh. Geol. Soc. Am. Bull. 1991, 103, 1513–1527. [Google Scholar]
  23. Uddin, A.; Lundberg, N. A paleo-Brahmaputra? Subsurface lithofacies analysis of Miocene deltaic sediments in the Himalayan–Bengal system, Bangladesh. Sediment. Geol. 1999, 123, 239–254. [Google Scholar]
  24. Khan, F.H. Geology of Bangladesh; University Press Limited: Dhaka, Bangladesh, 1991; p. 207. [Google Scholar]
  25. Bangladesh Water Development Board (BWDB). Land Reclamation Project Report; Goverment of Bangladesh: Dhaka, Bangladesh, 1974. [Google Scholar]
  26. Kumar, L.; Mutanga, O. Google Earth Engine applications since inception: Usage, trends, and potential. Remote Sens. 2018, 10, 1509. [Google Scholar] [CrossRef] [Green Version]
  27. Mugiraneza, T.; Nascetti, A.; Ban, Y. Continuous monitoring of urban land cover change trajectories with landsat time series and landtrendr-google earth engine cloud computing. Remote Sens. 2020, 12, 2883. [Google Scholar] [CrossRef]
  28. Zhao, Q.; Yu, L.; Li, X.; Peng, D.; Zhang, Y.; Gong, P. Progress and trends in the application of Google Earth and Google Earth Engine. Remote Sens. 2021, 13, 3778. [Google Scholar] [CrossRef]
  29. Hafizadeh-Moghadam, H.; Khazaei, M.; Alavipanah, S.K.; Weng, Q. Google Earth Engine for large-scale land use and land cover mapping: An object-based classification approach using spectral, textural and topographical factors. GIScience Remote Sens. 2021, 58, 914–928. [Google Scholar] [CrossRef]
  30. Özelkan, E. Water body detection analysis using NDWI indices derived from landsat-8 OLI. Pol. J. Environ. Stud. 2020, 29, 1759–1769. [Google Scholar] [CrossRef]
  31. Bellman, R.E.; Zadeh, L.A. Decision-making in a fuzzy environment. Manag. Sci. 1970, 17, B-141. [Google Scholar] [CrossRef]
  32. McFeeters, S.K. The use of the Normalized Difference Water Index (NDWI) in the delineation of open water features. Int. J. Remote Sens. 1996, 17, 1425–1432. [Google Scholar] [CrossRef]
  33. ESRI. Arithmetic Function. 2016. Available online: https://desktop.arcgis.com/en/arcmap/10.3/manage-data/raster-and-images/arithmetic-function.htm (accessed on 10 February 2021).
  34. Jenks, G.F. The data model concept in statistical mapping. Int. Yearb. Cartogr. 1967, 7, 186–190. [Google Scholar]
  35. Jenks, G.F.; Caspall, F.C. Error on choroplethic maps: Definition, measurement, reduction. Ann. Assoc. Am. Geogr. 1971, 61, 217–244. [Google Scholar] [CrossRef]
  36. Importance of Making More Water Dams and Construction of Concretes River Embankment in Bangladesh to Protect Flood. Scientific Figure on ResearchGate. Available online: https://www.researchgate.net/figure/Flood-Inundation-Map-of-Bangladesh-120hr-Forecast-Based-on-16-August-2017-BWDB_fig4_346082375 (accessed on 18 July 2022).
Figure 1. Geographical extent of the study area in Bangladesh. (a) Location of the Bengal delta on the South Asia map. (b) River distribution flow from north to south toward the Bay of Bengal.
Remotesensing 14 05582 g001
Figure 2. Research framework for LULC change assessment for predicting vulnerable agricultural lands.
Remotesensing 14 05582 g002
Figure 3. LULC and river distribution as permanent water bodies (a) LULC map of 1995; (b) LULC map of 2021; (c) Permanent water bodies in 1995 and (d) Permanent water bodies in 2021.
Remotesensing 14 05582 g003
Figure 4. LULC map for different classes with permanent water bodies; (a) bare land; (b) vegetation; (c) agricultural land and (d) urban area in 1995.
Remotesensing 14 05582 g004
Figure 5. LULC map for different classes with permanent water bodies; (a) bare land; (b) vegetation; (c) agricultural land and (d) urban area of 2021.
Remotesensing 14 05582 g005
Figure 6. LULC maps for all administrative divisions of Bangladesh for 1995; (a) Rangpur; (b) Mymensingh; (c) Sylhet; (d) Rajshahi; (e) Dhaka; (f) Khulna; (g) Barishal and (h) Chittagong.
Remotesensing 14 05582 g006
Figure 7. LULC map for all administrative divisions of Bangladesh for 2021; (a) Rangpur; (b) Mymensingh; (c) Sylhet; (d) Rajshahi; (e) Dhaka; (f) Khulna; (g) Barishal and (h) Chittagong.
Remotesensing 14 05582 g007
Figure 8. Fuzzy membership functions used for vulnerability analysis of agricultural land use; (a) fuzzy linear; (b) fuzzy small; (c) fuzzy MSlarge and (d) fuzzy linear.
Remotesensing 14 05582 g008
Figure 9. Reclassified vulnerability map of different indices for agricultural land use; (a) NDWI; (b) Distance from the river; (c) Elevation; (d) Rainfall, and (e) Fuzzy gamma overlay, where V1, V2, V3, and N refer to high, moderate, marginal, and nonvulnerable areas, respectively.
Remotesensing 14 05582 g009
Figure 10. Reclassified fuzzy overlay vulnerability map V1, V2 V3 and N refer to high, moderate, marginal, and nonvulnerable areas, respectively, of different administrative divisions of Bangladesh: (a) Rangpur; (b) Mymensingh; (c) Sylhet; (d) Rajshahi; (e) Dhaka; (f) Khulna; (g) Barishal and (h) Chittagong.
Remotesensing 14 05582 g010
Figure 11. LULC of five classes by area and changes from 1995 to 2021.
Remotesensing 14 05582 g011
Figure 12. Administrative division wise comparison between changes of five land use land cover classes from 1995 to 2021 in the river basin of Bangladesh.
Remotesensing 14 05582 g012
Figure 13. Vulnerable areas for agricultural land use by division according to the vulnerability classes in Bangladesh (V1: highly vulnerable area, V2: moderately vulnerable area, V3: marginally vulnerable area, and N: nonvulnerable area).
Remotesensing 14 05582 g013
Table 1. Data used for LULC classification and predicting lands vulnerable for agricultural activities.
SourceType of Data
Bangladesh Bureau of Statistics (BBS)Administrative area and river shape files.
USGSLandsat-8 OLI satellite images with bands (1 to 7) of 2021, 30 m spatial resolution.
USGSLandsat-5 satellite images of 1990, including all bands (b1 to b7) with 30 m spatial resolution.
SRTM (USGS)Digital Elevation Model (DEM) data
www.chrsdata.eng.uci.edu (accessed on 31 July 2022)Precipitation data for the year of 2021.
Table 2. LULC area of 1995 and 2021 for the study area.
LULC ClassesFor the Year 1995For the Year 2021Changes
Area (km2)Area (%)Area (km2)Area (%)Area (%)
Water body12,27719.021463022.663.65
Bare land19082.9633145.132.18
Vegetation14,84823.0016,98326.313.31
Agricultural land28,66744.4121,12932.73−11.68
Urban area685510.62849913.172.55
Table 3. LULC changes from 1995 to 2021 in eight administrative divisions in Bangladesh.
LULC ClassesAdministrative DivisionFor the Year 1995For the Year 2021Changes
Area (%)Area (km2)Area (%)Area (km2)Area (%)
Water bodyRangpur9.0766811.288312.21
Rajshahi13.52109914.6111881.09
Dhaka15.03272315.9128810.87
Khulna7.4512910.191772.74
Mymensingh13.1599114.4110861.26
Sylhet25.20162427.7217862.53
Barishal35.37170841.8320206.46
Chittagong32.62336838.0438935.42
Bare landRangpur8.216059.987361.77
Rajshahi5.804717.215861.41
Dhaka2.284134.357882.07
Khulna4.62807.991393.37
Mymensingh3.322503.612720.29
Sylhet0.40260.98630.58
Barishal0.1687.503627.33
Chittagong0.38392.202251.82
VegetationRangpur11.9688131.39231319.44
Rajshahi27.56224123.871941−3.69
Dhaka28.82521928.645188−0.18
Khulna29.6551427.43476−2.22
Mymensingh19.80149226.6120056.81
Sylhet23.18149329.3418916.17
Barishal16.4279311.33547−5.10
Chittagong21.35220525.1725763.82
Agricultural landRangpur56.99419933.692483−23.30
Rajshahi39.62322239.9132460.29
Dhaka44.13799337.166731−6.97
Khulna50.3987441.77724−8.62
Mymensingh48.24363543.823302−4.42
Sylhet42.76275627.761789−15.01
Barishal42.18203733.361611−8.82
Chittagong37.65388824.412499−13.24
Urban areaRangpur13.77101513.651006−0.12
Rajshahi13.51109914.4011710.89
Dhaka9.73176313.9425244.20
Khulna7.8913712.622194.73
Mymensingh15.48116711.55870−3.94
Sylhet8.4754614.209155.73
Barishal5.862835.992890.13
Chittagong8.0082610.1910432.19
Table 4. Vulnerable area for agricultural land use according to their vulnerability classes.
Vulnerability ClassesArea (km2)Area (%)
V1 (highly vulnerable area for agricultural land use)23,51844.34
V2 (moderately vulnerable area for agricultural land use)20,02337.75
V3 (Marginally vulnerable area for agricultural land use)738513.92
N (non-vulnerable area for agricultural land use)21113.98
Table 5. Vulnerable areas for agricultural land use according to the vulnerability classes in eight administrative divisions in Bangladesh. (V1: highly vulnerable area, V2: moderately vulnerable area, V3: marginally vulnerable area, and N: nonvulnerable area for agricultural land use).
Vulnerability ClassesAdministrative DivisionsArea (%)Area (km2)
V1Rangpur0.052
Rajshahi42.423190
Dhaka54.269497
Khulna73.311217
Mymensingh40.812673
Sylhet49.163144
Barishal40.041149
Chittagong37.522649
V2Rangpur13.87533
Rajshahi46.603504
Dhaka38.666766
Khulna26.17434
Mymensingh36.902418
Sylhet37.312385
Barishal39.641137
Chittagong40.692873
V3Rangpur41.211584
Rajshahi10.23769
Dhaka7.031231
Khulna0.529
Mymensingh19.521279
Sylhet8.045134
Barishal20.30582
Chittagong20.311434
NRangpur44.871724
Rajshahi0.7456
Dhaka0.058
Khulna0.000
Mymensingh2.77181
Sylhet5.49351
Barishal0.021
Chittagong1.48104
Publisher’s Note: MDPI stays neutral with regard to jurisdictional claims in published maps and institutional affiliations.

