Abstract
Deep learning (DL)-based change detection (CD) methods for high-resolution (HR) remote sensing images can still be improved by effective acquisition of multi-scale feature and accurate detection of the edge of change regions. We propose a new end-to-end CD network, named the Multi-Scale Residual Siamese Network fusing Integrated Residual Attention (IRA-MRSNet), which adopts an encoder-decoder structure, introduces the Multi-Res block to extract multi-scale features and deep semantic information, and uses the Attention Gates module before the skip connection to highlight the change region features. Considering that the residual connection and attention module benefits the edge feature extraction, we proposed an IRA unit, consisting of the Res2net+ module, the Split and Concat (SPC) module, and the Channel Attention Module (CAM), which can make the CD results better through finer-grained multi-scale feature extraction and adaptive feature refinement of the feature map channel dimension. The experimental results show that the F1 and OA values of our network model outperform other state-of-the-art (SOTA) CD methods on the Seasonal Change Detection Dataset (CDD) and the Sun Yat-Sen University Change Detection Dataset (SYSU-CD), and the number of parameters and the calculated amount are reduced significantly.
1. Introduction
Remote sensing image CD is one of critical technologies of remote sensing technology research, which is adopted to detect change information between multi-temporal images within the same area [1,2]. Remote sensing image CD research is crucial in disaster assessment, land use analysis, forest and vegetation change monitoring, ecosystem monitoring, and urban expansion [3,4,5,6,7,8,9,10]. With the development of Earth observation technology, the higher spatial resolution of satellite remote sensing images is obtained, the richer image information is contained in these images. [11]. Remote sensing image CD methods not only need to extract rich feature information effectively but also be robust to pseudo-change information, so as to improve the detection accuracy of changed regions.
The pixel-based change detection (PBCD) methods and object-based change detection (OBCD) methods are the main two categories of traditional CD methods [12,13]. The PBCD methods compare pixel to pixel to obtain difference maps, followed by threshold segmentation or cluster analysis [14] to generate change map (CM). Many PBCD methods have been proposed in previous research, for example, image algebraic algorithms (change vector analysis (CVA) [15]), image transformation algorithms (principal component analysis (PCA) [16,17]), image classification algorithms [18], and machine learning algorithms [19,20,21]. The PBCD methods, although simple and easy to achieve, focus only on the change of individual pixel spectral information without giving consideration to the spatial context information, which can result in a great deal of salt-and-pepper noise in experiments. Furthermore, the PBCD methods are suitable for low- and medium-resolution images, which cannot be widely used in the form that almost all CD datasets nowadays are, HR remote sensing images [22]. The OBCD methods segment the images into incoherent objects and obtain change maps (CMs) by the comparison of spectral and texture information differences between the objects. Although the OBCD methods combine the spatial context information and spectral information of the images, the traditional manual feature extraction methods are complicated for HR remote sensing images, which limits the CD accuracy.
In recent years, DL has shown great performance in computer vision tasks, which are widely applied to image classification [23,24], image segmentation [25,26], image super-resolution reconstruction [27,28], and remote sensing image CD [29,30,31]. The DL-based CD method eliminates the image pre-processing step, in comparison to the PBCD and OBCD methods, which can reduce the workload and avoid noise interference during pre-processing. In particular, the powerful feature learning capability of convolutional neural networks (CNN) can obtain the feature information in remote sensing images [32] and shows strong performance in remote sensing image CD tasks. Therefore, researchers have proposed many CD methods based on CNN. Daudt et al. [33] proposed three CD networks of fully convolutional architectures, including the construction of a UNet-based [34] FC-EF network, and its Siamese extension networks FC-Siam-conc and FC-Siam-diff. In [35], Zhang et al. proposed IFN, a deeply supervised based CD network that extracts feature information by using a dual-stream structure and then inputs it into the difference discrimination network (DDN) to obtain CMs. Recently, it has been shown that the dense connected structure of the Unet++ network [36] benefits multi-scale feature fusion, and many methods are based on the Unet++ network in remote sensing images for CD. Peng et al. [37] proposed a Unet++_MSOF method that uses a multiple side output fusion strategy to combine different semantic levels of CMs. Furthermore, attention mechanisms perform well in the field of natural image analysis, which can highlight features that are critical to the task and suppress other irrelevant information [38,39,40]. Therefore, the attention mechanisms are also introduced into the remote sensing image CD task. In [41], Wang et al. proposed a dual-attention based CD network, which introduces a spatial attention mechanism and a channel attention mechanism to obtain more discriminative feature representation. Fang et al. [42] proposed a densely connected CD method, SNUNet-CD, which can obtain better detection accuracy by using the ensemble channel attention module (ECAM) and dense skip connections structure.
The above-mentioned CNN-based methods adopt ordinary convolutional blocks for the extraction of image features. Compared with Multi-Res blocks, the features of HR remote sensing images extracted by ordinary convolutional blocks are not rich enough, because several pieces of research have indicated that feature maps at different scales perform different roles and are complemented among the scales [43]. Therefore, we introduce the Multi-Res block [44] to replace the ordinary convolutional block in our CD network. To generate better difference maps, we use a Siamese network structure based on the encoder-decoder network architecture and introduce the Attention Gates module [45] before the skip connection to highlight important features and suppress irrelevant change information. In addition, in order to further adapt to the target object at different scales in complex scenes, this article proposes an IRA unit, which can obtain multi-scale feature information at a finer granularity to achieve accurate detection at the edge part of the change regions and improve change region detection accuracy.
The contributions of this article are concluded as follows:
- An effective CD network was proposed for HR remote sensing images’ CD, named IRA-MRSNet, which can improve CD accuracy with its strong detection capability.
- We propose an IRA unit, which can obtain spatial information of the feature maps at different scales at a finer granularity and perform adaptive feature refinement of the feature maps at channel levels.
- The proposed IRA-MRSNet achieves the SOTA performance on the CDD and SYSU-CD datasets, especially in the F1 score and overall accuracy values, and the number of parameters and the calculated amount are reduced significantly.
The remainder of this article is structured as follows: In Section 2, we present a detailed illustration of the proposed method. In Section 3, the comparative experiments are provided to evaluate our method, with a detailed analysis of the experimental results. In Section 4, the conclusions of this article are drawn.
2. Proposed Method
In this section, there is a detailed introduction to our method. First, we introduce the overall architecture of the IRA-MRSNet network. Then, the Multi-Res block, Attention Gates module, and IRA unit will be introduced in detail. Finally, we describe the loss function used during training.
2.1. The Overall Network Architecture
As shown in Figure 1, for HR remote sensing images’ CD, IRA-MRSNet is a new end-to-end network, whose network framework is an encoder-decoder structure. The Siamese structure and Multi-Res block show great strengths in HR remote sensing images’ CD. Referring to [46], the Siamese structure is used in the encoder structure, and the Multi-Res block is introduced to extract multi-scale feature information. The processing of the IRA-MRSNet network is as follows: First, the bi-temporal images are input to two branches in the encoder, and weight sharing is employed in both branches, which makes the feature maps of images maintain the same activation condition at the same position. Then, the Multi-Res block is used for feature extraction in both the encoder and the decoder, and to detect the differences between bi-temporal images more accurately, we connect the different absolute values between the two branches structure streams in the encoder before inputting them to the decoder. Next, we use the Attention Gates module before the skip connection. Although good detection results can be achieved after the above operation processing, there are still shortcomings in its accurate detection of the edge of the change regions. Therefore, we propose an IRA unit, which follows the decoder structure, to further obtain finer-grained multi-scale features, achieve accurate detection at the edge of the change regions, and obtain better detection results. Finally, we input the feature maps, obtained by the IRA unit, into the convolutional layer for the output CM.
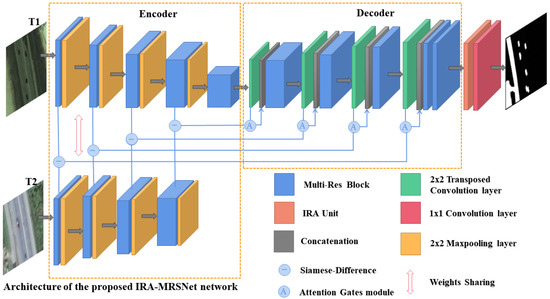
Figure 1.
The overall architecture of the IRA-MRSNet network.
The encoder of the IRA-MRSNet has five feature extraction stages. In the first stage, the size of the feature map is consistent with the input image size . From the second to fifth stage, the size of the feature map is reduced to the size of the previous stage. The decoder of the IRA-MRSNet uses four successive up-sampling steps, and the size of the feature map is doubled for each step in order. Meanwhile, the specific settings for the number of channels in each stage module are referenced in [44]. In addition, the number of channels of the IRA unit is 32, and its size is pixels.
2.2. Multi-Res Block
In order to fully perform the extraction of spectral information and spatial features in HR remote sensing images at different scales, we use Multi-Res block [44] to replace the ordinary convolutional block in feature extracting. The structure of Multi-Res block is shown in Figure 2. Concatenating the contiguous convolution kernels is performed to replace the more complex and demanding and convolution operations. Meanwhile, the Multi-Res block uses a gradual method to determine the number of filters, which can reduce the memory storage requirements during training. Furthermore, the Multi-Res block introduces a convolutional layer for residual concatenation, which can obtain some extra feature information. As Figure 2 shows, the number of channels of the three contiguous convolution kernels are C1, C2, and C3, respectively, and C denotes the number of channels of the convolution kernel.
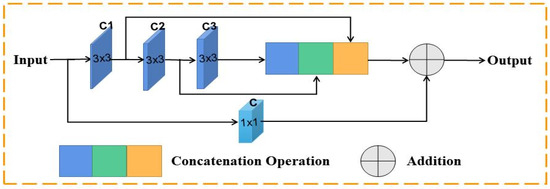
Figure 2.
Multi-Res block.
Referring to [44], the parameter is used to control the number of filters in the internal convolution layer of the Multi-Res block. The number of channels of C1, C2, and C3 are set to , and , respectively, and the value of C is the sum of the above three channels.
2.3. Attention Gates Module
During training, the Attention Gates module gradually suppresses feature responses in irrelevant regions and focuses on useful features. Therefore, we introduce the Attention Gates module in this article to focus on the features of change regions and suppress irrelevant change information. Figure 3 illustrates the structure of the Attention Gates module [45].
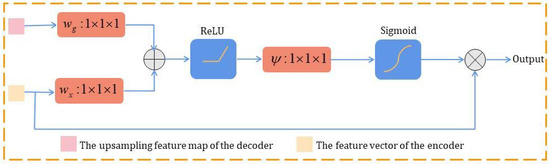
Figure 3.
Attention Gates module [45].
The Attention Gates module is a plug-and-play attention module that is characterized by setting a set of parameters , which contains linear transformations , , and bias terms , . The Attention Gates module can highlight features of the change regions with almost no additional computational effort, which can improve the accuracy of the generated CMs. Four Attention Gates modules are used in this article, and their corresponding number of channels are set to .
2.4. IRA Unit
Integrating the Multi-Res block and Attention Gates module into the HR remote sensing image CD network has an improved effect as a result of [46], but there is still improvement for the detection accuracy of the edge of the change regions. Therefore, as Figure 4 shows, this article propose an IRA unit, of which the Res2net+ module, SPC module [47], and CAM [48] are sub-modules. The IRA unit can capture and use the spatial information of feature maps at different scales at finer granularity. The IRA unit can also perform adaptive feature refinement of the feature maps at the channel level to achieve accurate detection of the edge of the change regions.
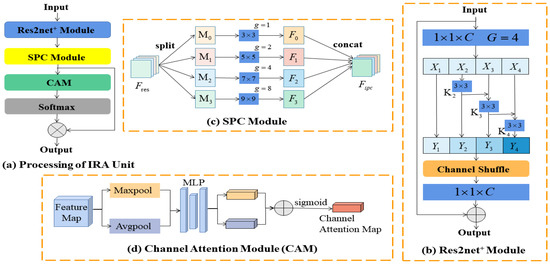
Figure 4.
IRA unit and its sub-modules.
The processing of the IRA unit is shown in Figure 4a, the Res2net+ module, the SPC module, and the CAM.
Figure 4b shows the internal architecture of the Res2net+ module. Referring to [49], the Res2net+ module is aimed at finer-grained multi-scale feature extraction. The feature map , the input of Res2net+ module, is processed by a group convolution with the convolution kernel and the channel number C (C = 32). Under the parameter of the group number G (G = 4), the feature map is split into 4 feature map subsets, denoted by , where . Each feature subset has the same spatial size but only of the number of channels, compared with the feature map . Except for , each has a corresponding convolution, denoted by . Meanwhile, the output of the feature subset and is summed and then fed into , and we use to denote the output of .
Due to the lack of information exchange among the output . Referring to [50], we concatenate all the output , perform a channel shuffle operation, and obtain the feature map by a set of convolution operations , resulting in a better fusion of feature information at different scales. In Res2net+ module, a residual connection is introduced to add and to get , which improves the semantic richness of the generated feature representation.
The internal architecture of the SPC module [47], is shown in Figure 4c. Increasing kernel sizes will cause a large increase in the parameters, so the SPC module introduces group convolution. First, the input of the feature map is split into four equal parts in the channel dimension, denoted by , where . Then, for each , group convolution processing with different kernel sizes is performed to learn spatial information at multiple scales independently and to establish a cross–channel interaction in a local manner. Next, to achieve less computational cost in the SPC module, the group size increases with the convolutional kernel size , and we set when . Finally, the obtained multi-scale feature maps are connected at the channel level to generate the feature map .
Figure 4d shows the internal architecture of the CAM [48], and its input is . First, the two different descriptors and are obtained by the average pooling operation and max pooling operation on . Next, both descriptors are fed into a shared multi-layer perceptron (MLP) network [48] to help produce the CAM module output, the channel attention map. Finally, after applying the shared network to each descriptor, we use the addition operation to merge the output feature vectors, and the weight relations of the different channels on are obtained by using a sigmoid function.
In the process of normalization, we use the SoftMax function to normalize the channel attention weights acquired by the CAM, then multiply the corrected attention vector by and use the result as the output of the IRA unit.
where [ ] represents the concatenation of feature maps, denotes the channel shuffle operation, denotes element-wise product.
2.5. Loss Function Definition
The sample imbalance issue is common in many DL tasks. The existing HR remote sensing CD datasets have the same problem of imbalance between the changed and unchanged samples, and changed samples only account for a small fraction of the total number of samples. A hybrid loss function was introduced in this article to weaken the effect of sample imbalance [46]; it was defined as follows:
where represents the binary cross-entropy loss, represents the dice coefficient loss, denotes the parameter to balance the two losses, and its value will be discussed in Section 3.4.4 of this article.
3. Experiments and Results
In this section, we design corresponding comparative and ablation experiments to validate the performance of our model. First, the commonly used datasets and the evaluation metrics are presented. Second, the typical CD methods are introduced for comparison. Next, the implementation details are introduced. Finally, we analyze and discuss the results of experiments.
3.1. Datasets and Evaluation Metrics
In this article, the CD datasets for our experiments are the two publicly available datasets, CDD [51] and SYSU-CD [52].
The CDD dataset is the satellite image pairs acquired by Google Earth, which contain seven pairs of images with a size of 4725 × 2700 pixels and our pairs of images with a size of 1900 × 1000 pixels, and its spatial resolution is 3–100 cm/pixel. As shown in Figure 5, the dataset includes not only changes of different objects, such as cars, roads, and buildings, but also seasonal changes of natural objects. It is worth noting that the seasonal changes of natural objects are treated as unchanged regions. Considering the GPU memory limitation, the original images were cropped into smaller image tiles with a size of pixels. The dataset contained 16,000 image tiles and was separated into training/validation/test in the ratio of 10:3:3.
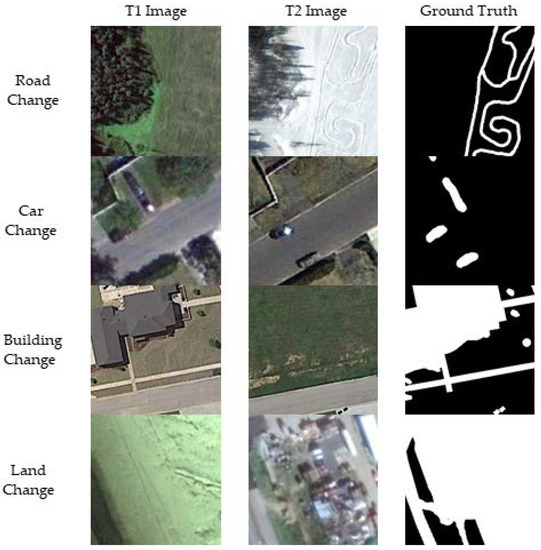
Figure 5.
CDD dataset with different object changes.
The SYSU-CD dataset contains 800 pairs of original aerial images of Hong Kong with a size of pixels, and the spatial resolution of the images is 50 cm/pixel. As Figure 6 shows, the SYSU-CD dataset contains change type objects, such as sea construction, high-rise buildings, roads, and vegetation. In addition, the SYSU-CD dataset greatly enhances the samples of high-rise building changes. Each original image pair was randomly cropped by the size of pixels, and 20,000 pairs of image tiles were obtained, where 12,000 pairs were the train sets, 4000 pairs were the validation sets, and 4000 pairs were the test sets.
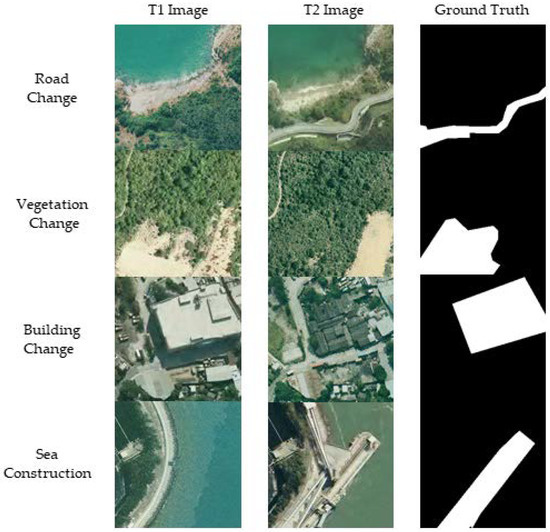
Figure 6.
SYSU-CD dataset with different object changes.
The four quantitative evaluation metrics are introduced to quantify the performance of our model, which include precision (P), recall (R), F1 score (F1), and overall accuracy (OA). In this article, F1 and OA are the main evaluation metrics. The four quantitative metrics can be expressed as follows:
where TP, FP, TN, and FN denote true positive, false positive, true negative, and false negative, respectively.
3.2. Comparison Methods
To better validate the effectiveness of our network, several typical CD networks were selected, and we evaluated their detection results on the two CD datasets.
FC-EF [33] is an early-fusion network based on UNet, where the bi-temporal images are connected together as the model input to obtain CM.
FC-Siam-conc [33] is a feature-level fusion network, which adopts the Siamese structure for the feature extraction operation of each branch and employs a concatenation strategy to process the dual branch features.
FC-Siam-diff [33] is a feature-level fusion network, which adopts the Siamese structure for the feature extraction operation of each branch and employs a difference strategy to process the dual branch features.
Unet++_MSOF [37] is an end-to-end CD method, which adopts the UNet++ network as the backbone network and uses a MSOF strategy to combine the feature maps from the multi-scale lateral outputs.
IFN [35] is a method that inputs the bitemporal images into the fully convolutional dual-stream structure for extracting deep feature information and proposes the DDN to combine different stages of CMs.
SNUNet-CD [42] is a Siamese network based on dense connections, which extracts rich feature information. The method proposes the ECAM to obtain the features most useful for CD. In our comparison experiments, the channel size of the SNUNet-CD method is 32.
3.3. Implementation Details
In this article, the model was trained on a single NVIDIA GeForce RTX 3090 GPU (Santa Clara, CA, USA) using the PyTorch framework. The batch size was set to 16 and initial learning rate was set to 0.001, using KaiMing normalization [53] to initialize the weights of the convolutional layer. Adam [54] was used to optimize our model. We trained the network for 150 epochs until the model reached convergence. During experiments, the parameter in the hybrid loss function was set to 1.
3.4. Experiment Results
3.4.1. Comparisons on CDD Dataset
To show the effect of IRA-MRSNet, we selected five typical test targets, such as buildings, roads, cars, small objects, and objects with complex features, and performed the subjective visual comparison analysis with several typical CD methods, as shown in Figure 7, Figure 8, Figure 9, Figure 10 and Figure 11, where changed regions are marked white and unchanged regions are marked black. The experimental comparison figures show that the CMs obtained by our proposed method (Figure 7j, Figure 8j, Figure 9j, Figure 10j and Figure 11j) are almost consistent with ground truth (Figure 7c, Figure 8c, Figure 9c, Figure 10c and Figure 11c). Meanwhile, in terms of detection accuracy of the edge of the changed regions, our proposed method performs better than other compared methods. As shown in Figure 7, IRA-MRSNet can better detect the internal structure and boundary of the building. In Figure 8, the CM obtained by IRA-MRSNet can accurately show the changes of the road, and it is largely in agreement with ground truth. At the same time, our method also achieves better detection performance in the small objects, such as the cars in Figure 9 and Figure 10; IRA-MRSNet can accurately show its shape and boundary. In Figure 11, IRA-MRSNet is better at showing the small roads and the building’s complete structure, despite them having complex objects.
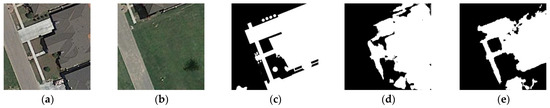
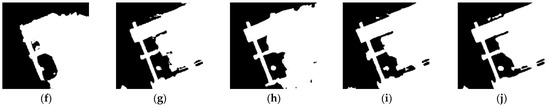
Figure 7.
Visual comparison of building target CD: (a) T1 image, (b) T2 image, (c) ground truth, (d) FC-EF, (e) FC-Siam-conc, (f) FC-Siam-diff, (g) Unet++_MSOF, (h) IFN, (i) SNUNet-CD/32, (j) IRA-MRSNet.
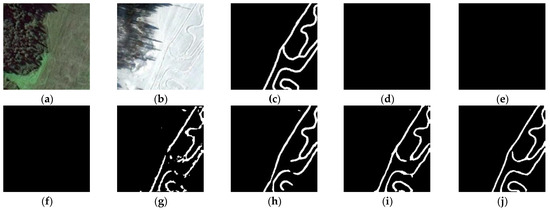
Figure 8.
Visual comparison of road target CD: (a) T1 image, (b) T2 image, (c) ground truth, (d) FC-EF, (e) FC-Siam-conc, (f) FC-Siam-diff, (g) Unet++_MSOF, (h) IFN, (i) SNUNet-CD/32, (j) IRA-MRSNet.
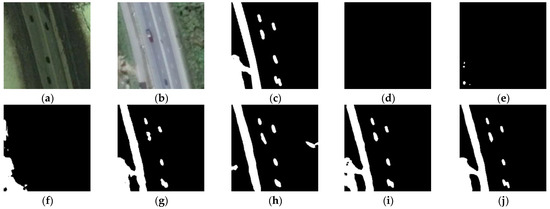
Figure 9.
Visual comparison of car target CD: (a) T1 image, (b) T2 image, (c) ground truth, (d) FC-EF, (e) FC-Siam-conc, (f) FC-Siam-diff, (g) Unet++_MSOF, (h) IFN, (i) SNUNet-CD/32, (j) IRA-MRSNet.
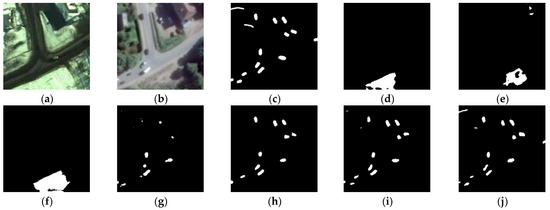
Figure 10.
Visual comparison of small objects CD: (a) T1 image, (b) T2 image, (c) ground truth, (d) FC-EF, (e) FC-Siam-conc, (f) FC-Siam-diff, (g) Unet++_MSOF, (h) IFN, (i) SNUNet-CD/32, (j) IRA-MRSNet.
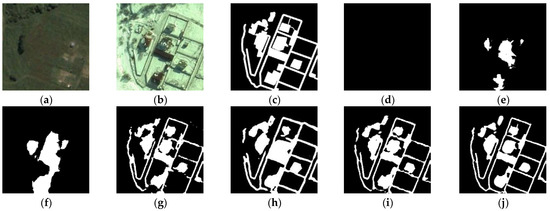
Figure 11.
Visual comparison of complex object CD: (a) T1 image, (b) T2 image, (c) ground truth, (d) FC-EF, (e) FC-Siam-conc, (f) FC-Siam-diff, (g) Unet++_MSOF, (h) IFN, (i) SNUNet-CD/32, (j) IRA-MRSNet.
Table 1 lists the quantitative results of the methods. FC-EF has the lowest quantitative evaluation metrics. FC-Siam-conc improves F1 and OA values by 4.17% and 0.65% for the comparison with FC-EF, which shows that the encoder using Siamese networks can effectively improve model accuracy. At the same time, FC-Siam-diff has F1 and OA metrics of 0.7032 and 0.9388, which shows that the Siamese structural differential connections in the encoder can obtain better CD results. The Unet++_MSOF improves F1 and OA values by 23.68% and 4.66% for the comparison with FC-Siam-diff, and the main factor for the significant increase in metric is that the MSOF strategy is used in its method to generate CMs. IFN uses the DDN in the decoder to generate CMs, and F1 and OA values obtained by IFN are 0.9030 and 0.9771, respectively. Compared with IFN, SNUNet-CD improves F1 and OA values by 5.96% and 1.37%, respectively. SNUNet-CD introduces the Unet++ network structure and proposes the ECAM, which makes the generated CMs more accurate.

Table 1.
Quantitative results on the CDD dataset.
It is worth noting that IRA-MRSNet outperforms the other compared methods, and its F1 and OA metrics reach 0.9647 and 0.9914, which are 0.21% and 0.06% higher than the second best SNUNet-CD/32. The main factors for obtaining the best results are listed here: First, our method adopts an encoder-decoder structure and uses Multi-Res block to replace the ordinary convolution block to extract features. Second, IRA-MRSNet introduces the Attention Gates module before the skip connection, which can reduce the semantic gap that was produced during the skip connections and highlight the important features. Third, this article proposes an IRA unit, which is followed by the decoder structure. The IRA unit enriches the feature space by obtaining the spatial information of feature maps from different scales at a finer granularity, resulting in the CD results have more accurate edge information.
According to the number of parameters of the methods in Table 1, the results show that FC-EF’s parameters are the lowest but its quantitative evaluation results are the worst. IFN’s parameters are the largest, reaching 35.72 M. Additionally, this value of SNUNet-CD/32 and Unet++_MSOF are 12.04 M and 11.80 M. It is worth noting that IRA-MRSNet has only 7.08 M parameters, which proves that our method can achieve the best result with fewer parameters.
In addition, the FLOPs of the methods are also shown in Table 1. By analysis, it can be concluded that the three fully convolutional networks present low FLOPs and perform poorly. IFN’s FLOPs are the largest, reaching 164.5 G. Additionally, the FLOPs value of SNUNet-CD/32 is 109.6 G, which is the second best method. In this article, IRA-MRSNet has the best performance, and its FLOPs are only 36.5 G, which indicates that our method can achieve the highest detection performance with lower calculation costs.
3.4.2. Comparisons on SYSU-CD Dataset
For the subjective visual comparison analysis, we selected four typical change types, as shown in Figure 12, Figure 13, Figure 14 and Figure 15, where changed regions are marked white and unchanged regions are marked black. The CMs of our method have fewer missed detections and false detections, and higher detection accuracy at the edge of the changed regions. As Figure 12 shows, IRA-MRSNet can better show the location of the changed vegetation regions, and the edge of the vegetation changed regions are smoother. In Figure 13, IRA-MRSNet better detects the changed road regions. At the same time, our method can achieve better detection performance on some small objects and on some large objects. In Figure 14, IRA-MRSNet better detects the boundary and location of ships, and in Figure 15, our method can detect the building with fewer missed detections and is generally consistent with ground truth.
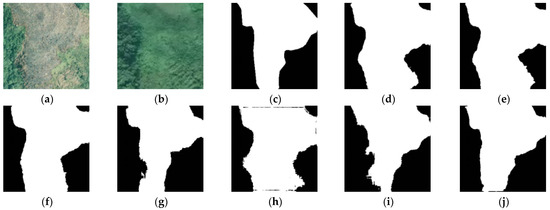
Figure 12.
Visual comparison of vegetation target CD: (a) T1 image, (b) T2 image, (c) ground truth, (d) FC-EF, (e) FC-Siam-conc, (f) FC-Siam-diff, (g) Unet++_MSOF, (h) IFN, (i) SNUNet-CD/32, (j) IRA-MRSNet.
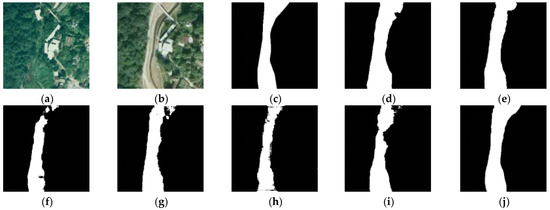
Figure 13.
Visual comparison of road target CD: (a) T1 image, (b) T2 image, (c) ground truth, (d) FC-EF, (e) FC-Siam-conc, (f) FC-Siam-diff, (g) Unet++_MSOF, (h) IFN, (i) SNUNet-CD/32, (j) IRA-MRSNet.
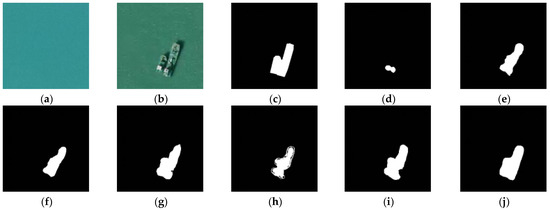
Figure 14.
Visual comparison of sea construction target CD: (a) T1 image, (b) T2 image, (c) ground truth, (d) FC-EF, (e) FC-Siam-conc, (f) FC-Siam-diff, (g) Unet++_MSOF, (h) IFN, (i) SNUNet-CD/32, (j) IRA-MRSNet.
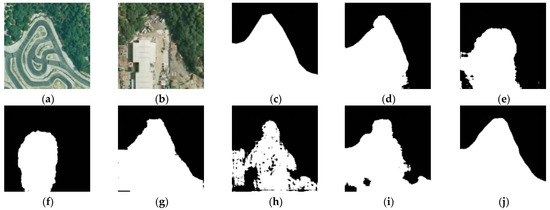
Figure 15.
Visual comparison of building target CD: (a) T1 image, (b) T2 image, (c) ground truth, (d) FC-EF, (e) FC-Siam-conc, (f) FC-Siam-diff, (g) Unet++_MSOF, (h) IFN, (i) SNUNet-CD/32, (j) IRA-MRSNet.
The quantitative results of P, R, F1, and OA for the methods are presented in Table 2. IRA-MRSNet also achieves the best performance metrics on the SYSU-CD dataset. For the F1 and OA metrics, the second best method is SNUNet-CD/32, but its R metric is 3.64% lower than IRA-MRSNet. For the R metric, the closest to IRA-MRSNet is FC-EF, but FC-EF has a poor performance for the P metric. IRA-MRSNet improves 9.35% on the P metric, compared to FC-EF. For the P metric, the closest to IRA-MRSNet is FC-Siam-diff, but FC-Siam-diff is 20.82%, far lower than our method on the R metric. It is worth noting that, unlike the CDD dataset, there are challenges brought by more complex scenes and difficulties caused by more different change types on the SYSU-CD dataset [52]. However, the results of our method are more balanced for all quantitative metrics when facing the dataset with complex scenes.
Table 2.
Quantitative results on the SYSU-CD dataset.
To better test the performance of IRA-MRSNet, we additionally conducted some experiments on the WHU-CD [55] and LEVIR-CD [56] datasets, as Table 3 and Table 4 show. The experimental results show that the F1 and OA metrics of IRA-MRSNet are slightly increased, when compared to SNUNet-CD/32 on the WHU-CD dataset, and while SNUNet-CD/32 performs better than IRA-MRSNet on the LEVIR-CD dataset, the number of parameters and the calculated amount of our method are reduced significantly.
Table 3.
Quantitative results on the WHU-CD dataset.
Table 4.
Quantitative results on the LEVIR-CD dataset.
3.4.3. Ablation Experiments
In order to successfully obtain high detection results in the CD task, the Attention Gates module and Multi-Res block are used in this article. To achieve accurate detection of the edge of the change region, an IRA unit was proposed in this article. Additionally, the corresponding ablation experiments were designed to prove the effect of the Attention Gates module and the IRA unit, respectively. Table 5 and Table 6 list the results of the ablation experiments of IRA-MRSNet on the CDD and SYSU-CD datasets, respectively.
Table 5.
Results of ablation experiments on the CDD dataset.
Table 6.
Results of ablation experiments on the SYSU-CD dataset.
As Table 5 shows, the values of F1 and OA of the ordinary Siamese Unet network are 0.9494 and 0.9877. When the ordinary convolutional block is replaced by the Multi-Res block on the basis of the Siamese Unet network, all the performance evaluation metrics are improved, and its results in i1 and OA are 0.9605 and 0.9904, so it is used as the base network in this article. When we add the IRA unit after the decoding structure on the base network model, it slightly improves the R metric compared to the base network. Meanwhile, when adding the Attention Gates module to the base network, the F1 and OA metrics are 0.9615 and 0.9906, which improve 0.1% and 0.02% for F1 and OA metrics, respectively, compared with the base network. When the Attention Gates module and the IRA unit are introduced to the base network, the F1 and OA values are the highest.
As Table 6 shows, the values of F1 and OA of the ordinary Siamese Unet network on the SYSU-CD dataset are 0.7467 and 0.8834. When the ordinary convolutional block is replaced by the Multi-Res Block on the basis of the Siamese Unet network, the F1 and OA metrics are 0.7750 and 0.8981. On the base network model, when we add the IRA unit after the decoder structure, the performance metrics are improved, compared with the base network, especially the F1 and OA values are improved by 1.53% and 0.66%, respectively. Meanwhile, when adding the Attention Gates module to the base network, the F1 and OA metrics are 0.7818 and 0.9022, which indicates that the operation also performs well on the SYSU-CD dataset. When the Attention Gates module and the IRA unit are added to the base network, the overall network performance on the SYSU-CD dataset is also further improved, and the F1 and OA values are 0.7998 and 0.9085.
This article also makes a visual comparison of each ablation module on the two CD datasets, as shown in Figure 16 and Figure 17. Figure 16 selects three representative sets of images from the CDD test set. According to the visual results, the CMs obtained from the base network of this article has good results (Figure 16d), but there are still some missed detections in the changed regions. After adding the IRA unit to the base network, the visual effect is enhanced (Figure 16e). On the base network model, when the Attention Gates module is added (Figure 16f), the visual result is better improved. When the Attention Gates module and the IRA unit are added to the base network, the CMs have the best visual effect in subjective terms (Figure 16g), with the edges of the change region being clearly defined, which is generally consistent with ground truth. Meanwhile, Figure 17 selects three representative sets of images from the SYSU-CD test set. Based on our observations, it can be concluded that the base network of this article also shows good results on the SYSU-CD dataset (Figure 17d), but it still has some false detections and missed detections in the changed regions. When adding the Attention Gates module to the base network, it performs better than the result of the base network (Figure 17e). The generated CMs also have further visual improvement after adding the IRA unit to the base network (Figure 17f). When the Attention Gates module and the IRA unit are added to the base network, the CMs have the best performance in visual (Figure 17g) and the fewest regions of false detection and missed detection.
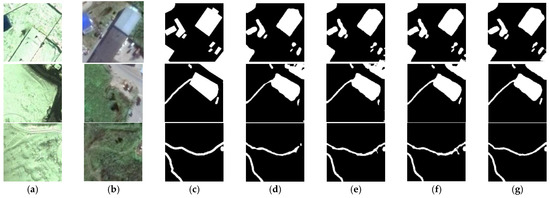
Figure 16.
Visual comparison results of ablation experiments on the CDD dataset: (a) T1 image, (b) T2 image, (c) ground truth, (d) base network, (e) IRA-MRSNet without the Attention Gates module, (f) IRA-MRSNet without the IRA Unit, (g) IRA-MRSNet.
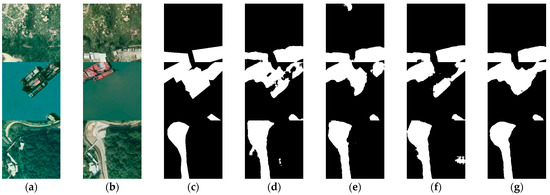
Figure 17.
Visual comparison results of ablation experiments on the SYSU-CD dataset: (a) T1 image, (b) T2 image, (c) ground truth, (d) base network, (e) IRA-MRSNet without the Attention Gates module, (f) IRA-MRSNet without the IRA Unit, (g) IRA-MRSNet.
3.4.4. Parameter Discussion
To further discuss the impact of the parameter in the loss function, we set the value of to 0, 0.25, 0.5, 0.75, and 1, respectively, and calculate their corresponding performance metrics. According to our observations in Figure 18 and Figure 19, when is 0, the values of each evaluation metric on the two CD datasets are relatively low. The F1 and OA metrics on the two CD datasets have improved correspondingly as the value of increases, which shows that the hybrid loss can improve the overall network performance of CD. When is 1, the highest quantitative results are obtained on both the CDD and SYSU-CD datasets. As a result, was set to 1 in our experiments.
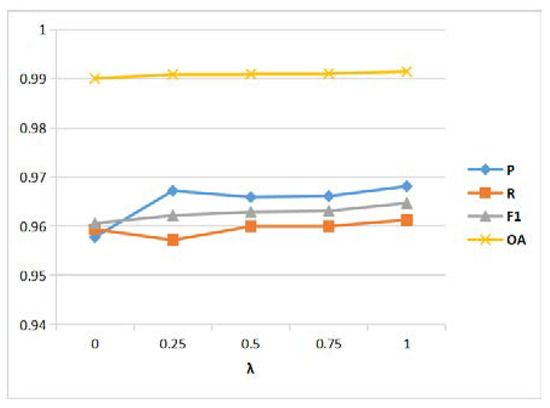
Figure 18.
Effect of parameter of loss function on the CDD dataset.

Figure 19.
Effect of parameter of loss function on the SYSU-CD dataset.
Figure 20 and Figure 21 show the loss curves of our method during the training phase on the CDD and SYSU-CD datasets, and the loss curves are at convergence.
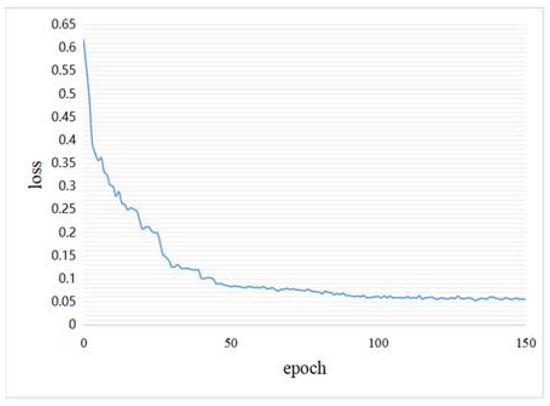
Figure 20.
Loss curve on the CDD dataset.
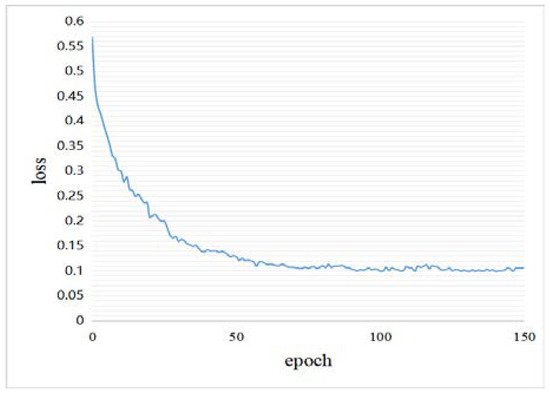
Figure 21.
Loss curve on the SYSU-CD dataset.
4. Conclusions
In this article, a new end-to-end CD network is proposed, called the Multi-Scale Residual Siamese Network fusing Integrated Residual Attention (IRA-MRSNet). The network adopts an encoder-decoder structure, and the Multi-Res block is used in the network structure to extract features. Meanwhile, the Attention Gates module is introduced to highlight important features before the skip connection. Furthermore, we propose an IRA unit for finer-grained multi-scale feature extraction and adaptive feature refinement of feature maps at the channel dimension, and experiments show that the IRA unit can make the generated CMs have more accurate edge information and achieve higher detection accuracy. The experimental results indicate that the proposed method outperforms other SOTA methods on the public HR remote sensing CD dataset, especially on the SYSU-CD dataset, and that the number of parameters and the calculated amount are reduced significantly. Future work will focus on unsupervised learning to enhance the application ability of CD.
Author Contributions
Methodology, J.L., X.Y. and L.H.; validation, J.L., L.C. and M.C.; writing—original draft preparation, J.L. and L.H.; writing—review and editing, J.L. and L.H. All authors have read and agreed to the published version of the manuscript.
Funding
This research was funded by the National Natural Science Foundation of China, grant number 61662033.
Data Availability Statement
Publicly datasets were used in this work. The datasets can be downloaded from https://drive.google.com/fifile/d/1GX656JqqOyBi_Ef0w65kDGVto-nHrNs9/edit (accessed on 25 June 2021), https://github.com/liumency/SYSU-CD (accessed on 21 March 2022), https://justchenhao.github.io/LEVIR/ (accessed on 6 August 2022) and https://study.rsgis.whu.edu.cn/pages/download/building_dataset.html (accessed on 11 August 2022).
Acknowledgments
We thank the reviewers for their helpful and valuable suggestions on this manuscript.
Conflicts of Interest
The authors declare no conflict of interest.
References
- Singh, A. Review Article Digital change detection techniques using remotely-sensed data. Int. J. Remote Sens. 1989, 10, 989–1003. [Google Scholar] [CrossRef]
- Khelifi, L.; Mignotte, M. Deep learning for change detection in remote sensing images: Comprehensive review and meta-analysis. IEEE Access 2020, 8, 126385–126400. [Google Scholar] [CrossRef]
- Brunner, D.; Lemoine, G.; Bruzzone, L. Earthquake damage assessment of buildings using VHR optical and SAR imagery. IEEE Trans. Geosci. Remote Sens. 2010, 48, 2403–2420. [Google Scholar] [CrossRef]
- Xian, G.; Homer, C.; Fry, J. Updating the 2001 National Land Cover Database land cover classification to 2006 by using Landsat imagery change detection methods. Remote Sens. Environ. 2009, 113, 1133–1147. [Google Scholar] [CrossRef]
- Lv, Z.Y.; Shi, W.; Zhang, X.; Benediktsson, J.A. Landslide inventory mapping from bitemporal high-resolution remote sensing images using change detection and multiscale segmentation. IEEE J. Sel. Top. Appl. Earth Obs. Remote Sens. 2018, 11, 1520–1532. [Google Scholar] [CrossRef]
- Sofifina, N.; Ehlers, M. Building change detection using high resolution remotely sensed data and GIS. IEEE J. Sel. Top. Appl. Earth Obs. Remote Sens. 2016, 9, 3430–3438. [Google Scholar] [CrossRef]
- Coppin, P.; Jonckheere, I.; Nackaerts, K.; Muys, B.; Lambin, E. Review ArticleDigital change detection methods in ecosystem monitoring: A review. Int. J. Remote Sens. 2004, 25, 1565–1596. [Google Scholar] [CrossRef]
- FichIRA, C.R.; Modica, G.; Pollino, M. Land Cover classification and change-detection analysis using multi-temporal remote sensed imagery and landscape metrics. Eur. J. Remote Sens. 2012, 45, 1–18. [Google Scholar] [CrossRef]
- Luo, H.; Liu, C.; Wu, C.; Guo, X. Urban change detection based on Dempster–Shafer theory for multitemporal very high-resolution imagery. Remote Sens. 2018, 10, 980. [Google Scholar] [CrossRef]
- Lu, D.; Mausel, P.; Brondizio, E.; Moran, E. Change detection techniques. Int. J. Remote Sens. 2004, 25, 2365–2401. [Google Scholar] [CrossRef]
- Chen, H.; Wu, C.; Du, B.; Zhang, L.; Wang, L. Change Detection in Multisource VHR Images via Deep Siamese Convolutional Multiple-Layers Recurrent Neural Network. IEEE Trans. Geosci. Remote Sens. 2020, 58, 2848–2864. [Google Scholar] [CrossRef]
- Hussain, M.; Chen, D.; Cheng, A.; Wei, H.; Stanley, D. Change detection from remotely sensed images: From pixel-based to object-based approaches. ISPRS J. Photogramm. Remote Sens. 2013, 80, 91–106. [Google Scholar] [CrossRef]
- Xiao, P.; Zhang, X.; Wang, D.; Yuan, M.; Feng, X.; Kelly, M. Change detection of built-up land: A framework of combining pixel-based detection and object-based recognition. ISPRS J. Photogramm. Remote Sens. 2016, 119, 402–414. [Google Scholar] [CrossRef]
- Celik, T. Unsupervised change detection in satellite images using principal component analysis and k-means clustering. IEEE Geosci. Remote Sens. Lett. 2009, 6, 772–776. [Google Scholar] [CrossRef]
- Bovolo, F.; Bruzzone, L. A theoretical framework for unsupervised change detection based on change vector analysis in the polar domain. IEEE Trans. Geosci. Remote Sens. 2007, 45, 218–236. [Google Scholar] [CrossRef]
- Deng, J.S.; Wang, K.; Deng, Y.H.; Qi, G.J. PCA-based land-use change detection and analysis using multitemporal and multi sensor satellite data. Int. J. Remote Sens. 2008, 29, 4823–4838. [Google Scholar] [CrossRef]
- Zhao, E.; Qian, Y.; Gao, C.; Huo, H. Characterization of land transitions patterns from multivariate time series using seasonal trend analysis and principal component analysis. Remote Sens. 2014, 6, 639–655. [Google Scholar]
- Wu, C.; Du, B.; Cui, X.; Zhang, L. A post-classification change detection method based on iterative slow feature analysis and Bayesian soft fusion. Remote Sens. Environ. 2017, 199, 241–255. [Google Scholar] [CrossRef]
- Huang, C.; Song, K.; Kim, S.; Townshend, J.R.; Davis, P.; Masek, J.G.; Goward, S.N. Use of a dark object concept and support vector machines to automate forest cover change analysis. Remote Sens. Environ. 2008, 112, 970–985. [Google Scholar] [CrossRef]
- Volpi, M.; Tuia, D.; Bovolo, F.; Kanevski, M.; Bruzzone, L. Supervised change detection in VHR images using contextual information and support vector machines. Int. J. Appl. Earth Obs. Geoinf. 2013, 20, 77–85. [Google Scholar] [CrossRef]
- Cao, G.; Li, Y.; Liu, Y.; Shang, Y. Automatic change detection in high-resolution remote-sensing images by means of level set evolution and support vector machine classification. Int. J. Remote Sens. 2014, 35, 6255–6270. [Google Scholar] [CrossRef]
- Lv, P.; Zhong, Y.; Zhao, J.; Zhang, L. Unsupervised Change Detection Based on Hybrid Conditional Random Field Model for High Spatial Resolution Remote Sensing Imagery. IEEE Trans. Geosci. Remote Sens. 2018, 56, 4002–4015. [Google Scholar] [CrossRef]
- Krizhevsky, A.; Sutskever, I.; Hinton, G.E. ImageNet classification with deep convolutional neural networks. Commun. ACM 2017, 60, 84–90. [Google Scholar] [CrossRef]
- Zeiler, M.D.; Fergus, R. Visualizing and understanding convolutional networks. In Proceedings of the European Conference on Computer Vision (ECCV), Zurich, Switzerland, 6–12 September 2014; pp. 818–833. [Google Scholar]
- Chen, L.-C.; Papandreou, G.; Kokkinos, I.; Murphy, K.; Yuille, A.L. Deeplab: Semantic image segmentation with deep convolutional nets, atrous convolution, and fully connected crfs. IEEE Trans. Pattern Anal. Mach. Intell. 2017, 40, 834–848. [Google Scholar] [CrossRef]
- Yuan, X.; Shi, J.; Gu, L. A review of deep learning methods for semantic segmentation of remote sensing imagery. Expert Syst. Appl. 2021, 169, 114417. [Google Scholar] [CrossRef]
- Zou, C.; Huang, X. Hyperspectral image super-resolution combining with deep learning and spectral unmixing. Signal Process. Image Commun. 2020, 84, 115833. [Google Scholar] [CrossRef]
- Ma, W.; Pan, Z.; Yuan, F.; Lei, B. Super-Resolution of Remote Sensing Images via a Dense Residual Generative Adversarial Network. Remote Sens. 2019, 11, 2578. [Google Scholar] [CrossRef]
- Hou, B.; Wang, Y.; Liu, Q. Change Detection Based on Deep Features and Low Rank. IEEE Geosci. Remote Sens. Lett. 2017, 14, 2418–2422. [Google Scholar] [CrossRef]
- Wang, D.; Chen, X.; Jiang, M.; Du, S.; Xu, B.; Wang, J. ADS-Net: An Attention-Based deeply supervised network for remote sensing image change detection. Int. J. Appl. Earth Obs. Geoinf. 2021, 101, 102348. [Google Scholar]
- Zheng, Z.; Wan, Y.; Zhang, Y.; Xiang, S.; Peng, D.; Zhang, B. CLNet: Cross-layer convolutional neural network for change detection in optical remote sensing imagery. ISPRS J. Photogramm. Remote Sens. 2021, 175, 247–267. [Google Scholar] [CrossRef]
- LeCun, Y.; Bottou, L.; Bengio, Y.; Haffner, P. Gradient-based learning applied to document recognition. Proc. IEEE 1998, 86, 2278–2324. [Google Scholar] [CrossRef]
- Daudt, R.C.; Le Saux, B.; Boulch, A. Fully convolutional siamese networks for change detection. In Proceedings of the IEEE International Conference on Image Processing (ICIP), Athens, Greece, 7–10 October 2018; pp. 4063–4067. [Google Scholar]
- Ronneberger, O.; Fischer, P.; Brox, T. U-Net: Convolutional Networks for Biomedical Image Segmentation. In Proceedings of the International Conference on Medical Image Computing and Computer Assisted Intervention (MICCAI), Munich, Germany, 5–9 October 2015; pp. 234–241. [Google Scholar]
- Zhang, C.; Yue, P.; Tapete, D.; Jiang, L.; Shangguan, B.; Huang, L.; Liu, G. A deeply supervised image fusion network for change detection in high resolution bi-temporal remote sensing images. ISPRS J. Photogramm. Remote Sens. 2020, 166, 183–200. [Google Scholar] [CrossRef]
- Zhou, Z.; Siddiquee, M.M.R.; Tajbakhsh, N.; Liang, J. Unet++: Redesigning skip connections to exploit multiscale features in image segmentation. IEEE Trans. Med. Imaging 2019, 39, 1856–1867. [Google Scholar] [CrossRef] [PubMed]
- Peng, D.; Zhang, Y.; Guan, H. End-to-end change detection for high resolution satellite images using improved UNet++. Remote Sens. 2019, 11, 1382. [Google Scholar] [CrossRef]
- Vaswani, A.; Shazeer, N.; Parmar, N. Attention is all you need. In Proceedings of the Thirty-fifth Conference on Neural Information Processing Systems (NIPS), Long Beach, CA, USA, 4–9 December 2017; pp. 5998–6008. [Google Scholar]
- Hu, J.; Shen, L.; Sun, G. Squeeze-and-excitation network. In Proceedings of the IEEE Conference on Computer Vision and Pattern Recognition (CVPR), Salt Lake City, UT, USA, 18–22 June 2018; pp. 7132–7141. [Google Scholar]
- Wang, X.; Girshick, R.; Gupta, A.; He, K. Non-local neural networks. In Proceedings of the IEEE Conference on Computer Vision and Pattern Recognition (CVPR), Salt Lake City, UT, USA, 18–22 June 2018; pp. 7794–7803. [Google Scholar]
- Chen, J.; Yuan, Z.; Peng, J.; Chen, L. DASNet: Dual Attentive Fully Convolutional Siamese Networks for Change Detection in High-Resolution Satellite Images. IEEE J. Sel. Top. Appl. Earth Obs. Remote Sens. 2021, 14, 1194–1206. [Google Scholar] [CrossRef]
- Fang, S.; Li, K.; Shao, J.; Li, Z. SNUNet-CD: A Densely Connected Siamese Network for Change Detection of VHR Images. IEEE Geosci. Remote Sens. Lett. 2021, 19, 8007805. [Google Scholar] [CrossRef]
- Szegedy, C.; Liu, W.; Jia, Y. Going deeper with convolutions. In Proceedings of the IEEE Conference on Computer Vision and Pattern Recognition (CVPR), Boston, MA, USA, 8–10 June 2015; pp. 1–9. [Google Scholar]
- Ibtehaz, N.; Rahman, M.S. MultiResUNet: Rethinking the U-Net architecture for multimodal biomedical image segmentation. Neural Netw. 2020, 121, 74–87. [Google Scholar] [CrossRef]
- Schlemper, J.; Oktay, O.; Schaap, M.; Heinrich, M.; Kainz, B.; Glocker, B.; Rueckert, D. Attention gated networks: Learning to leverage salient regions in medical images. Med. Image Anal. 2019, 53, 197–207. [Google Scholar] [CrossRef]
- Yang, X.; Hu, L.; Zhang, Y.; Li, Y. MRA-SNet: Siamese Networks of Multiscale Residual and Attention for Change Detection in High-Resolution Remote Sensing Images. Remote Sens. 2021, 13, 4528. [Google Scholar] [CrossRef]
- Zhang, H.; Zu, k.; Lu, J.; Zou, Y.; Meng, D. EPSANet: An Efficient Pyramid Split Attention Block on Convolutional Neural Network. In Proceedings of the IEEE Conference on Computer Vision and Pattern Recognition (CVPR), Honolulu, HI, USA, 21–26 July 2021. [Google Scholar]
- Woo, S.; Park, J.; Lee, J.-Y.; Kweon, I.S. CBAM: Convolutional Block Attention Module. In Proceedings of the Computer Vision ECCV 2018, Munich, Germany, 8–14 September 2018; pp. 3–19. [Google Scholar]
- Gao, S.H.; Cheng, M.M.; Zhao, K.; Zhang, X.Y.; Yang, M.H.; Torr, P. Res2net: A new multi-scale backbone architecture. IEEE Trans. Pattern Anal. Mach. Intell. 2019, 43, 652–662. [Google Scholar] [CrossRef]
- Zhang, X.; Zhou, X.; Lin, M. ShuffleNet: An Extremely Efficient Convolutional Neural Network for Mobile Devices. In Proceedings of the IEEE Conference on Computer Vision and Pattern Recognition (CVPR), Salt Lake City, UT, USA, 18–23 June 2018; pp. 6848–6856. [Google Scholar]
- Lebedev, M.; Vizilter, Y.V.; Vygolov, O.; Knyaz, V.; Rubis, A.Y. Change detection in remote sensing images using conditional adversarial networks. Int. Arch. Photogramm. Remote Sens. Spat. Inf. Sci. 2018, 42, 565–571. [Google Scholar] [CrossRef]
- Shi, Q.; Liu, M.; Li, S. A Deeply Supervised Attention Metric-Based Network and an Open Aerial Image Dataset for Remote Sensing Change Detection. IEEE Trans. Geosci. Remote Sens. 2022, 60, 5604816. [Google Scholar] [CrossRef]
- He, K.; Zhang, X.; Ren, S.; Sun, J. Delving deep into rectifiers: Surpassing human-level performance on imagenet classification. In Proceedings of the IEEE Conference on Computer Vision and Pattern Recognition (CVPR), Boston, MA, USA, 8–10 June 2015; pp. 1026–1034. [Google Scholar]
- Kingma, D.P.; Ba, J. Adam: A method for stochastic optimization. arXiv 2014, arXiv:1412.6980. [Google Scholar]
- Ji, S.; Wei, S.; Lu, M. Fully convolutional networks for multisource building extraction from an open aerial and satellite imagery dataset. IEEE Trans. Geosci. Remote Sens. 2019, 57, 574–586. [Google Scholar] [CrossRef]
- Chen, H.; Shi, Z. A Spatial-Temporal Attention-Based Method and a New Dataset for Remote Sensing Image Change Detection. Int. J. Remote Sens. 2020, 12, 1662. [Google Scholar] [CrossRef]


Publisher’s Note: MDPI stays neutral with regard to jurisdictional claims in published maps and institutional affiliations. |
© 2022 by the authors. Licensee MDPI, Basel, Switzerland. This article is an open access article distributed under the terms and conditions of the Creative Commons Attribution (CC BY) license (https://creativecommons.org/licenses/by/4.0/).