Article

Weighted Local Ratio-Difference Contrast Method for Detecting an Infrared Small Target against Ground–Sky Background

1
School of Intelligent Engineering, Zhengzhou University of Aeronautics, Zhengzhou 450015, China
2
Beijing Key Laboratory of Fractional Signals and Systems, School of Information and Electronics, Beijing Institute of Technology, Beijing 100081, China
*
Author to whom correspondence should be addressed.
Remote Sens. 2022, 14(22), 5636; https://doi.org/10.3390/rs14225636
Submission received: 19 September 2022 / Revised: 26 October 2022 / Accepted: 3 November 2022 / Published: 8 November 2022

Abstract

:
Fast and robust detection of infrared small targets in a single image has always been challenging. The background residue in complex ground–sky background images leads to high false alarm rates when traditional local contrast methods are used because of the complexity and variability of the ground–sky background imaging environment. A weighted local ratio-difference contrast (WLRDC) method is proposed in this paper to address this problem and detect infrared small targets in the ground–sky background. First, target candidate pixels are obtained using a simple facet kernel filter. Second, local contrast saliency maps and weighted mappings are calculated on the basis of the local ratio-difference contrast and the spatial dissimilarity of the target, respectively. Third, the final weighted mapping can be obtained through the multiplication fusion strategy. Finally, a simple threshold segmentation method is employed to extract the target. Experimental results on six real ground–sky infrared scenes showed that the proposed method outperforms existing state-of-the-art methods.

1. Introduction

Infrared small target detection is an important component of infrared search and tracking systems that has been utilized extensively in space surveillance, remote sensing, missile tracking, and other domains [1,2,3]. Fast and reliable detection of infrared small targets is crucial in these applications. However, small targets usually contain only a few pixels and lack detailed shape and texture feature information due to long-range target imaging [4,5,6]. Noise disturbances, including grassland, poles, trees, buildings, and high-brightness clutter on the ground, commonly found in the complex and changeable imaging environment of the ground–sky scene typically result in targets with extremely low signal-to-noise ratios (SNRs). Very low SNRs of targets increase their susceptibility to background interference from nearby ground objects. Therefore, detecting infrared small targets in ground–sky scenes is challenging.
Many different methods have been proposed for detecting infrared small targets in complex backgrounds. Existing methods can be typically divided into single-frame and sequential detection methods [7]. The sequential detection method requires reference to temporal characteristics of multiple successive frames. Background interference clutter is eliminated on the basis of consistency of motion of the moving target and high correlation of the background in adjacent frames [8]. However, background variation is easily caused by the jitter of the photoelectric tower itself in practice, thereby affecting the performance of the sequential detection method. Meanwhile, the computationally complex sequential detection method and requirement of high hardware performance limit its applicability to practical infrared search systems. Compared with the sequential detection method, the single-frame detection method can more easily obtain satisfactory real-time performance. Traditional single-frame detection methods include Top-Hat [9,10], Max-mean and Max-median filtering [11], two-dimensional least mean square (TDLMS) [12,13], and multi-scale directional filtering approaches [14]. Although these morphology filtering-based methods generally demonstrate satisfactory detection performance in infrared images with uniform background and are easy to implement, they usually cause high rates of false alarms in complex backgrounds. Notably, the method based on a human visual system (HVS) is introduced into the field of infrared small target detection. The background is usually a uniform area with some noise in the local region, while the target and the adjacent region are concentrated and discontinuous. Therefore, the region of interest can be extracted from the difference between features of the target and the background in the local region, and the most appropriate among the responses can be obtained using multi-scale calculations [15]. Chen et al. [16] proposed the initial local contrast method (LCM) for detecting infrared small targets. A series of extended LCM methods, such as an improved LCM (ILCM) [17], a novel local contrast measure (NLCM) [18], a multi-scale relative local contrast measure (RLCM) [19], and a multi-scale patch-based contrast measure (MPCM) [20], was subsequently proposed. Cui et al. [21] put forward a high-speed local contrast infrared small target detection method that achieves fast detection of infrared small targets using local contrast combined with a machine learning classifier to solve the problem of calculation inefficiency of LCM-based methods. Xia et al. [22] designed a multi-scale local contrast measure based on a local energy factor (LEF). Han et al. [23] subsequently proposed a weighted strengthened local contrast measure (WSLCM). Hence, these methods primarily utilize the gray difference between the target and the background in a local region to measure infrared small targets.
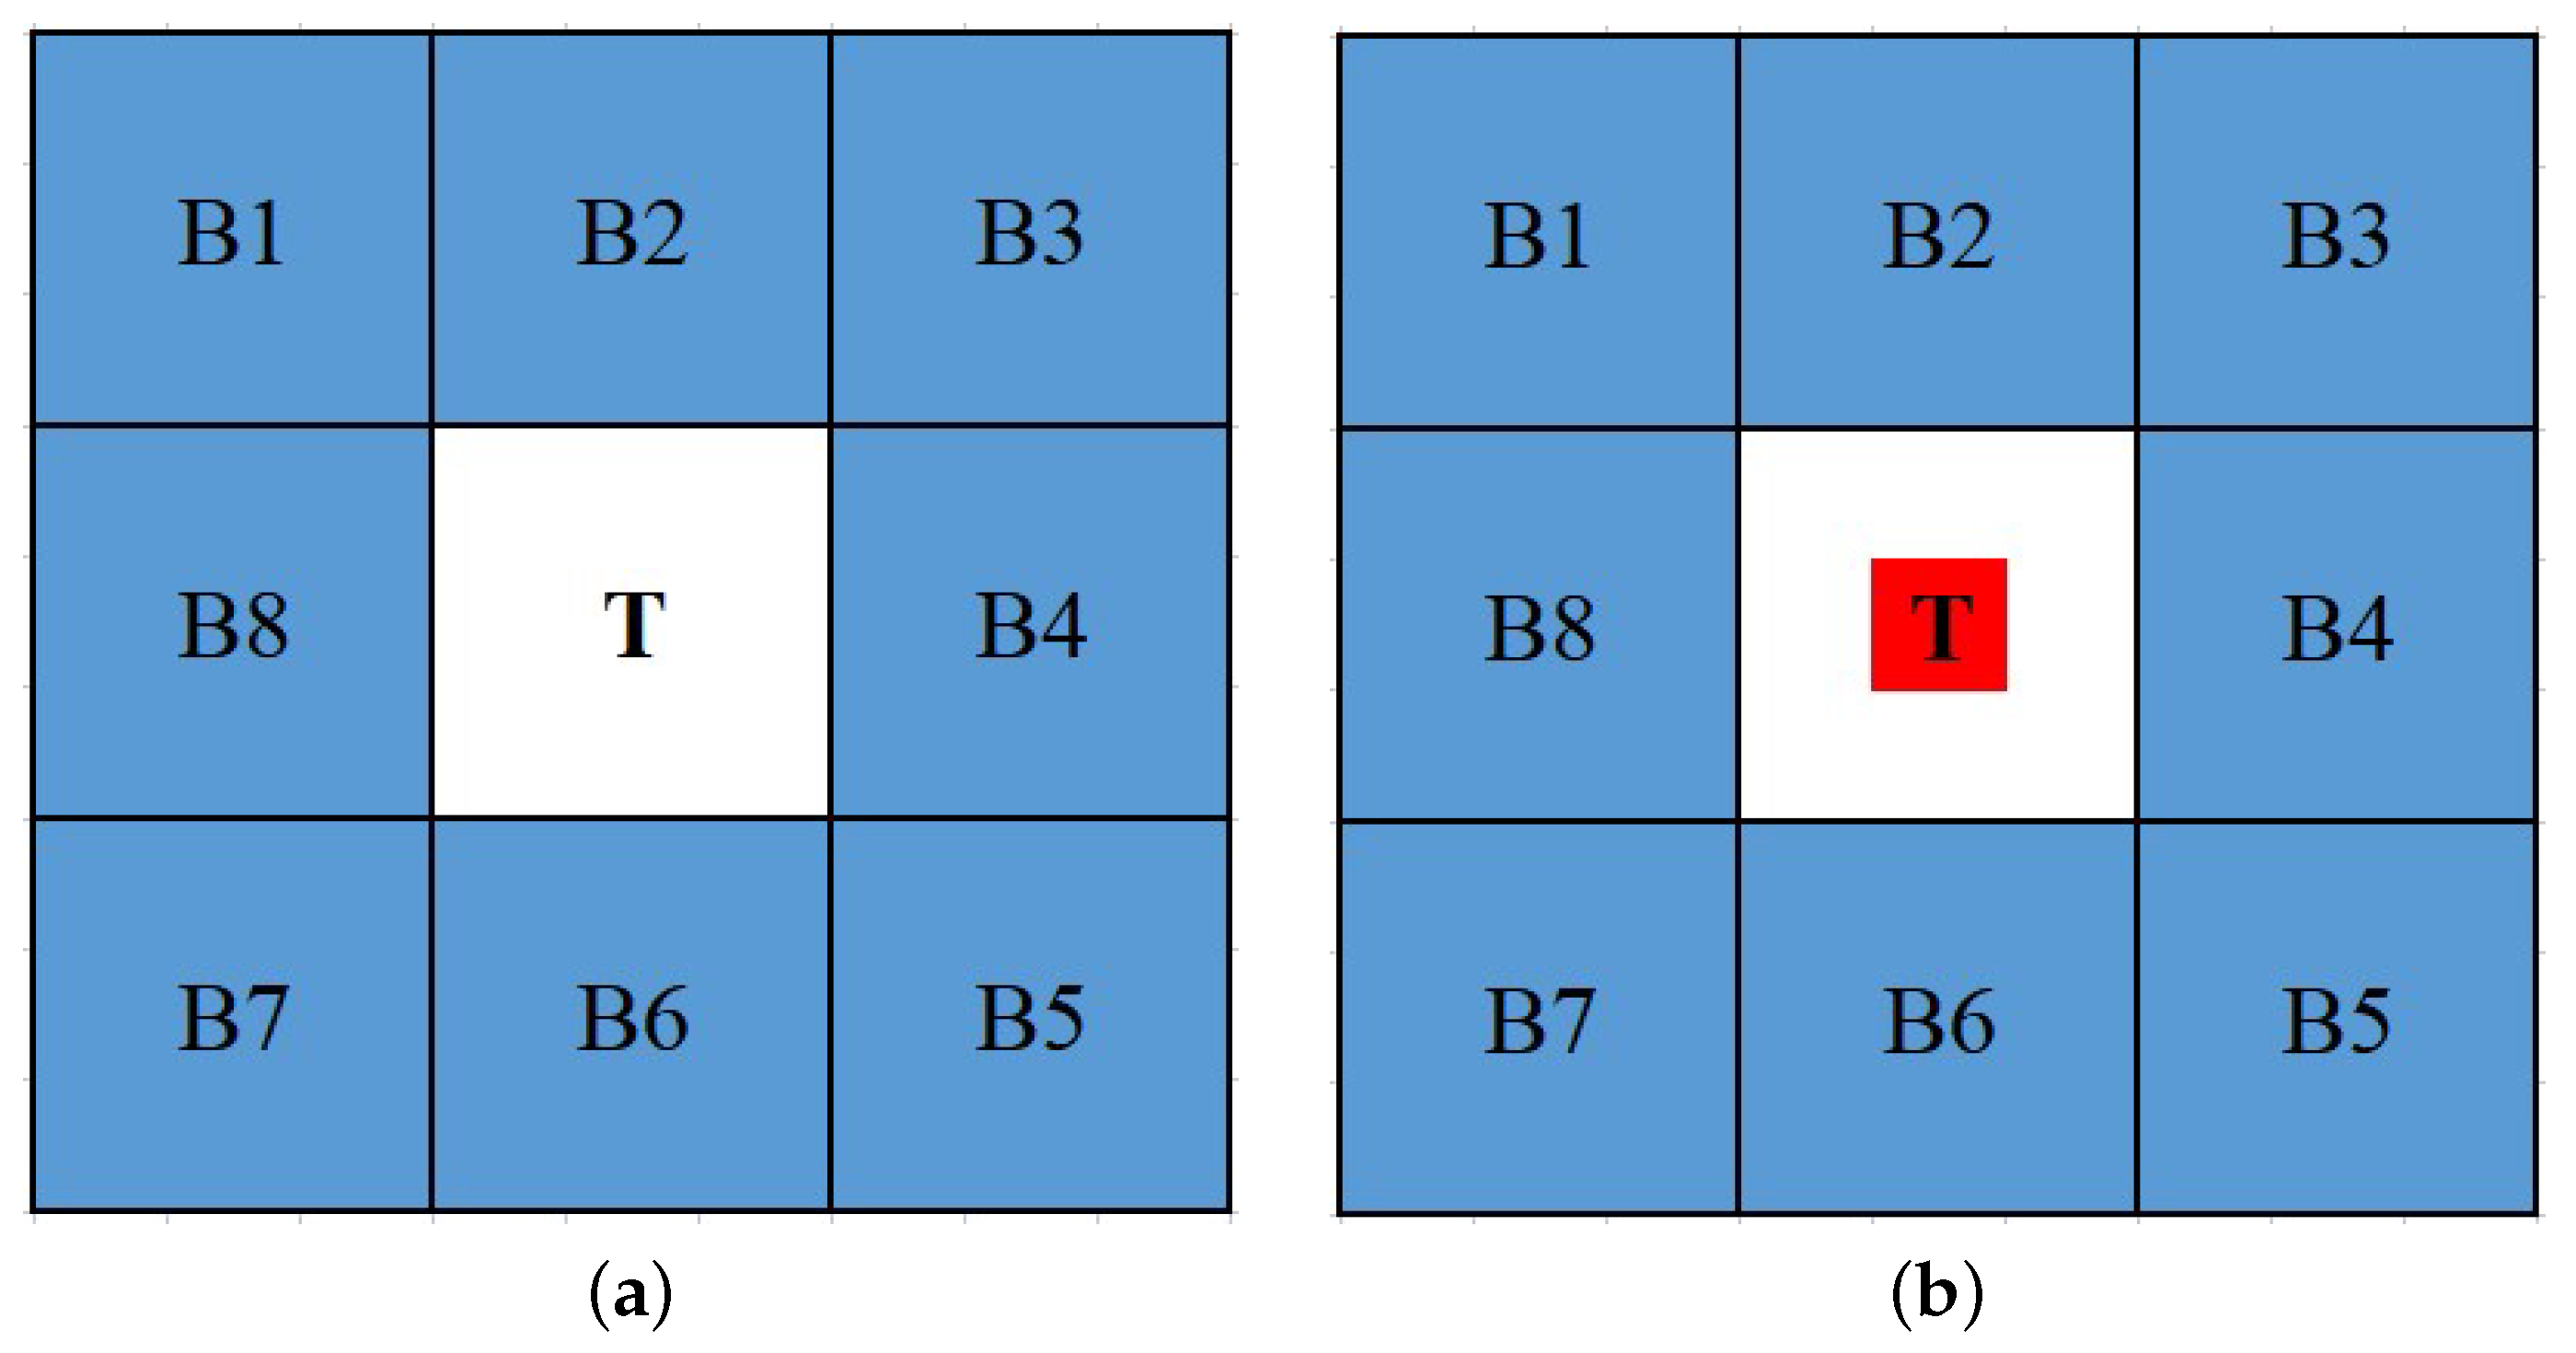
Some scholars have improved the window detection framework in LCM-based methods, as shown in Figure 1. For example, Han et al. [24] proposed a multi-scale triple-layer local contrast measurement (TLLCM) method utilizing a new window, and its triple-layer window detection framework is shown in Figure 1b. Wu et al. [25] put forward a double-neighborhood gradient measure for the detection of infrared small targets of different sizes through a designed double-neighborhood window and effective avoidance of the “expansion effect” of traditional multi-scale LCM-based methods. The double-neighborhood window is presented in Figure 1c. Lu et al. [26] devised a weighted double local contrast measure utilizing a new sliding window that further subdivides the central block in the window detection framework and fully considers the contrast information within the central block. This new sliding window is shown in Figure 1d. The improvement of the window detection framework allows the enhanced capture of energy in the central region and contrast with the adjacent background while avoiding multi-scale calculations and improving computational efficiency.
At present, methods based on matrix decomposition can successfully improve the detection performance of infrared small targets in complex scenes. The core idea of these kinds of methods is to transform the small target detection problem into a low-rank and sparse optimization problem according to sparse a priori characteristics of targets. Gao et al. [27] established an infrared patch image (IPI) model for infrared small target detection, expressed the small target detection as an optimization problem of low-rank sparse matrix recovery, and solved it effectively using stable principal component tracking. Wang et al. [28] then created a novel stable multi-subspace learning (SMSL) method by analyzing the background data structure. On the basis of the IPI model, Dai and Wu [29] designed an infrared patch tensor (IPT) model, exploited the target sparse prior and background non-local self-correlation prior, and modeled the target–background separation as a robust low-rank tensor recovery problem. On the basis of an infrared patch tensor (IPT) model, a novel non-convex low-rank constraint named partial sum of tensor nuclear norm (PSTNN) [30] with joint weighted 1 norm was employed to suppress the background and preserve the target efficiently. However, these methods are inefficient in the face of complex backgrounds with multiple or structural sparse targets and commonly result in high false alarm rates.
Many sequential detection methods based on multiple frames have been proposed to detect infrared small targets and achieve enhanced detection results in complex backgrounds with the improvement of computer performance. For instance, Deng et al. [31] and Zhao et al. [32] realized the detection of motion point targets by fusing the spatial and temporal local contrast information. Du et al. [33] proposed a new spatio-temporal local difference measurement method. Liu et al. [34] put forward an infrared video small target detection method based on the spatio-temporal tensor model. Pang et al. [35] established a novel spatio-temporal saliency method for detecting low-altitude slow infrared small targets in image sequences. These sequential detection methods use the information from anterior-posterior multiple frames to enhance the suppression of background clutter and extraction of targets. However, the output results of these sequential detection methods are usually lagging.
With the development of deep learning (DL) technology, many DL-based methods have been put forward to detect infrared small targets. Wang et al. [36] designed a YOLO-based feature extraction backbone network for infrared small target detection. Subsequently, an infrared small target detection method based on Generative Adversarial Network (GAN) was proposed in [37]. Dai et al. [38] incorporated a visual attention mechanism into a neural network to improve target detection performance. Kim et al. [39] utilized a GAN framework to obtain synthetic training datasets, and the detection performance was effectively improved. Zuo et al. [40] designed the attention fusion feature pyramid network specifically for small infrared target detection. The method based on deep learning has achieved some relatively good detection results in infrared small target detection. However, the above methods usually require rich infrared image data. Regrettably, there are few publicly available datasets to support the research of these methods.
A weighted local ratio-difference contrast (WLRDC) method is proposed in this paper to detect infrared small targets and improve the robust detection performance in ground–sky complex backgrounds. Specifically, the innovation of the proposed WLRDC method is as presented follows:
  • A local ratio-difference contrast (LRDC) method that can simultaneously enhance the target and suppress complex background clutter and noise is proposed by combining local ratio information and difference information. LRDC uses the mean of the Z max pixel gray values in the center block to effectively solve the problem of poorly enhancing the target at low contrast when the traditional LCM-based method is applied.
  • A simple and effective strategy of block difference product weighted (BDPW) mapping is designed on the basis of spatial dissimilarity of the target to improve the robustness of the WLRDC method. BDPW can further suppress background clutter residuals without increasing the computation complexity given that this strategy is also calculated using the gray of the center and adjacent blocks.
The rest of the paper is organized as follows: in Section 2, we present the related work. The proposed WLRDC method is described in Section 3. In Section 4, we conduct extensive experiments in various scenes to verify the effectiveness of the proposed method. Finally, the paper is discussed and summarized in Section 5 and Section 6, respectively.

2. Related Work

In recent years, some infrared small target detection methods based on LCM have been extensively investigated. Existing local contrast calculation types can usually be divided into three types: ratio, difference, and ratio-difference (RD) form. We briefly review the RD-based form of infrared small target detection method in this section because the proposed method is based on the RD form.
RLCM [19] is a typical method of the RD form method that uses the average gray of the K 1 and K 2 max pixels in the central and adjacent cell blocks for calculation to suppress the interference of various noises effectively. Guan et al. [41] utilized a multi-scale Gaussian filter combined with RD contrast and proposed an infrared small target detection method. Although the RD-based contrast method achieved relatively excellent detection performance compared to the traditional LCM-based method, the detection capability was weak in complex backgrounds. Moreover, the weighted function was developed to improve the detection capability and robustness of the method further. For instance, Han et al. [42] put forward a multi-directional two-dimensional least mean square product weighted RD-LCM method for infrared small target detection, which has better detection performance for different types of backgrounds and targets. Subsequently, Han et al. [43] also offered a weighted RD local feature contrast method with improved robustness to noise. With the combination of weighting function with the RD contrast, the detection performance of these methods was effectively improved.
The RD form of the contrast calculation method integrates the advantages of both the ratio and difference forms, enhances the target, and effectively suppresses background clutter. Although the weighting function is an excellent method for improving the detection performance, existing weighting functions are overly complex and increase the computational complexity. Therefore, rapidly and reliably detecting infrared dim and small targets in complex backgrounds remains an important challenge to overcome.

3. Materials and Methods

The overall target detection process of the proposed WLRDC method is shown in Figure 2. This process is mainly divided into the following stages: (1) preprocessing (facet kernel filtering and square calculation are used to enhance the target) and (2) detection (LRDC is first calculated from the local ratio-difference contrast and on the basis of spatial dissimilarity of the target to measure the BDPW) stages. WLRDC mapping is obtained from the fusion multiplication strategy of the LRDC and BDPW to extract the target easily using a simple threshold segmentation method.

3.1. Preprocessing: Target Enhancement

3.1.1. Facet Kernel Filtering

The target presents low contrast in the ground–sky scene due to the existence of high-brightness buildings, grass, roads, and other strong interference clutter in the ground–sky background. Here, facet kernel [44] filtering is employed to highlight the target area significantly different from the adjacent background by traversing the whole image. In this way, targets of different sizes and shapes can be effectively enhanced. The literature demonstrates the effectiveness of the facet kernel [45,46]. The target-enhanced image H is expressed as follows:
H = I ( x , y ) F
where ∗ represents the convolution operation, and F denotes the facet kernel.
The facet kernel model uses a bivariate cubic function to approximate the gray intensity surface formed by gray values of all pixels in its neighborhood. Here, the size used is 5 × 5, and its two-dimensional discrete orthogonal polynomial set Pi can be expressed as follows:
P i { 1 , r , c , r 2 c , r c , c 2 2 , r 3 17 5 r , ( r 2 2 ) c , r ( c 2 2 ) , c 3 17 5 c }
where r { 2 , 1 , 0 , 1 , 2 } and c { 2 , 1 , 0 , 1 , 2 } are the respective row and column coordinates in the 5 × 5 neighborhood. The pixel surface function f ( r , c ) in the neighborhood is expressed as follows:
f ( r , c ) = i = 1 10 K i · P i ( r , c )
where K i is the fitting coefficient of the polynomial that can be derived using the least square method as follows:
K i = r c P i ( r , c ) f ( r , c ) r c P i 2 ( r , c )
K i can be calculated using the convolution of f ( r , c ) and W i . W i is expressed as follows:
W i = P i ( r , c ) r c P i 2 ( r , c )
According to Equations (2) and (3), second-order partial derivatives of the central pixel (0,0) of the r × c window along the row and column directions can be obtained as follows:
2 f ( r , c ) r 2 = 2 K 4 , 2 f ( r , c ) c 2 = 2 K 6
Equation (6) shows that the sum of K 4 and K 6 can be calculated to enhance the target region effectively. K 4 and K 6 can be obtained from the convolution of W i with I ( x , y ) . Notably, the relative results of filtering for each region of the image remains unaffected because of the denominator term in Equation (7). Thus, we can further eliminate denominator coefficients and substitute P i ( r , c ) into Equation (5) to obtain kernel coefficients.
W 4 = 1 70 2 2 2 2 2 1 1 1 1 1 2 2 2 2 2 1 1 1 1 1 2 2 2 2 2 , W 6 = W 4 T
Therefore, F = 2 ( W 4 + W 6 ) . The weighted kernel coefficients are inverted to detect bright targets in the ground–sky background where the central region presents greater gray areas than the adjacent regions. Enabling the detection of bright targets where the central gray is greater than the adjacent gray leads to the positive weight of the central coefficients. The final facet kernel is expressed as follows:
F = 4 1 0 1 4 1 2 3 2 1 0 3 4 3 0 1 2 3 2 1 4 1 0 1 4

3.1.2. Square Calculation

The square of H is calculated to improve the energy of the target further and obtain the enhanced target response map R as follows:
R = H 2
Figure 3 shows that the target energy enhances but the noise also enhances after the calculation of the square for each pixel in H. However, the target is maximally salient in H. The square calculation will obtain greater energy relative to the noise.

3.2. Calculation of LRDC

We utilize local features of the target and background to calculate the local ratio-difference contrast; that is, the ratio and difference information of the central and eight directional adjacent blocks within the local region are applied to calculate the LRDC saliency map. Here, a sliding window with nine unit blocks is used to traverse the whole image, as shown in Figure 4. The LRDC is expressed as:
L R D C ( x , y ) = S Z m max ( D max D min )
where S Z is the mean of the Z maximum pixel gray values in the center block. D max and D min are the maximum and minimum values of D i , respectively; m max is the maximum of m i . Values of Z on different scales, which will be discussed in Section 5, can be obtained as follows:
S Z = 1 Z j = 1 Z G T j
m i = 1 L 2 j = 1 L 2 I i j , ( i = 1 , 2 , , 8 )
D i = ( S Z m i ) 2 , ( i = 1 , 2 , , 8 )
where Z, L, G T j , and I i j indicate the number of maximum pixel gray values in the center block, length of the block, jth maximum gray value of the center block T, and gray value of the jth pixel in the ith block, respectively.
We will now analyze the motivation for the design of the LRDC. The local ratio-difference contrast combination can simultaneously enhance the target and suppress complex backgrounds. Different from traditional local contrast methods, the proposed method utilizes the S Z / m i in the ratio calculation and is mainly based on the following facts:
  • False alarms easily occur when pixel-sized noises with high brightness (PNHB) appear in the background, the maximum gray value of the center block is used in the ratio calculation, and PNHB is easily taken as the target. S Z improves the accurate representation of gray features of the central block and avoids the weighting of PNHB in the calculation of LRDC.
  • Compared with the method that only uses the gray mean of the central block, our method uses the mean of Z maximum gray values in the center block S Z to expand the contrast between the target and the background further as well as enhance the target.
The difference calculation presents the advantage of effectively eliminating high-brightness backgrounds. The contrast is calculated using the difference between S Z of the central block and m i of adjacent blocks to reduce the effect of high-brightness backgrounds effectively. Section 3.1.2 demonstrated that the squared calculation enhances the energy of the target. Therefore, ( S Z m i ) 2 is used to calculate D i . Meanwhile, background clutter can be further attenuated with D max D min .

3.3. Calculation of BDPW

The weighted mapping mainly exploits spatial features of the target and the background. Targets exhibit discontinuities of features with surrounding backgrounds in local regions and minimal similarities to the background given that they usually satisfy a Gaussian distribution. Hence, the increased dissimilarity between the central and adjacent regions indicate a high probability that the central region is the target. The spatial dissimilarity between the central and adjacent blocks is used as the weighting function for the LRDC to suppress noise residuals in the LRDC further. Weighted mapping is defined as:
B D P W ( x , y ) = i = 1 8 ( S Z m i )
We will discuss the weighted enhancement mechanism of BDPW in different local regions.
  • If the central block is the target, then we can easily obtain the following because the target is the most significant in the local region:
    S Z max m i > 0 , ( i = 1 , 2 , , 8 )
    B D P W > 0
  • If the central block is the background, then we can easily obtain the following because the background is a uniform area with some noise in the local region:
    S Z max m i 0 , ( i = 1 , 2 , , 8 )
    B D P W 0
As shown in Equations (15) and (17), if the central region is the target, then the LRDC will obtain a large weight value. If the central region is the background, then the LRDC will obtain a negative weight value. Therefore, BDPW can realize the weighted enhancement of LRDC.

3.4. Multi-Scale Calculation of WLRDC

The local ratio-difference contrast (LRDC) and the block difference product weight (BDPW) are obtained by calculations. WLRDC is defined as:
W L R D C ( x , y ) = L R D C ( x , y ) × B D P W ( x , y )
The obtained WLRDC saliency map must be normalized to facilitate the subsequent threshold segmentation. The normalization result is expressed as follows:
W L R D C ( x , y ) = L R D C ( x , y ) × B D P W ( x , y ) max L R D C ( x , y ) × B D P W ( x , y )
The sliding detection window is the vital component of the LCM-based method. Ideally, the detection window should be the same size as the target size for a more accurate measurement of local contrast. In practical applications, the dataset may contain targets of multiple sizes. However, the size of the detection window is fixed. To solve this problem, a multi-scale calculation method was adopted in [16,17,18,19,20]. Typically, the detection window is set to 3 × 3, 5 × 5, 7 × 7 and 9 × 9. Multi-scale operation is necessary because the size of targets in infrared images cannot be determined in advance. Multi-scale WLRDC is defined as:
W L R D C = max { W L R D C n ( x , y ) } , n = 1 , 2 , , s
where n and s represent the nth scale and the total number of scales, respectively.

3.5. Target Extraction

The real target is properly enhanced according to the previous calculations and is most significant in the WLRDC saliency map. Thus, the target can be extracted using the following threshold segmentation operation:
T h = μ + k σ
where μ and σ are the mean and standard deviation of the WLRDC saliency map, respectively, and k is an adjustable parameter.
In summary, the whole process of WLRDC calculation is described in Algorithm 1.
Algorithm 1 Detection steps of the proposed WLRDC method.
  • Input: Infrared image I, size of sliding window block L × L, facet kernel, and parameters Z, k and s
  • Output: Detection result
  1:
Calculate the facet kernel filter map H using (1).
  2:
Calculate the enhanced target response map R using (9).
  3:
for 1 to s do
  4:
   Calculate the S Z , m i and D i by (11)–(13), respectively.
  5:
   Calculate the LRDC saliency map using (10).
  6:
   Calculate the weighted mapping BDPW using (14).
  7:
   Obtain WLRDC mapping by fusing LRDC and BDPW.
  8:
end for
  9:
Obtain maximum pooling for multi-scale WLRDC using (21).
10:
Obtain the final detection result using (22).

3.6. Complexity Analysis

We briefly analyze the computation complexity of the proposed method in this section. Suppose the size of the input infrared image is M × N. The preprocessing process consists of facet kernel filtering (kernel operator size is q × p) and square calculation with a computation complexity of O ( q p M N ) and O ( M N ) , respectively. The saliency map needs to be computed pixel-by-pixel in the target detection stage, and the computation complexity of the whole process is O ( n 2 M N ) , where n ( n = 1 , 2 , , s ) is the scale of the sliding window. The total computational complexity of the multi-scale target detection stage is O ( s 3 M N ) . In conclusion, the whole computation complexity of the proposed method is O ( q p M N + s 3 M N ) .

4. Experimental Results and Analysis

A series of evaluation metrics is used to evaluate the detection performance of different methods in this section to validate the effectiveness and robustness of the proposed method. Six real scenes were utilized in the experiments, and the proposed method was compared with the baseline methods. We adjust the parameters of the baseline method in the next experiments to achieve the optimal detection results. Finally, we analyze the computational efficiency of the proposed and baseline methods.

4.1. Experimental Setup

4.1.1. Datasets

In this paper, we use the public dataset from the ATR Key Laboratory of the National University of Defense Technology and the 25th Institute of the Second Research Institute of China Aerospace Science [47]. The dataset contains multiple image sequences with complex and variable imaging backgrounds, including cluttered grass, high-brightness ground, and forests. The sensor used for dataset acquisition was a cooled mid-wave infrared camera. We choose six typical ground–sky scenes for analysis to validate the efficiency and robustness of the proposed method. Note that the background in Scene 1 contains high-brightness dotted noise similar to the real target. Some targets in Scenes 4 and 5 are mixed with the high-luminance ground background, thereby significantly increasing the difficulty of detection. A detailed description of all datasets is presented in Table 1. Each scene contains one target and is marked with a red box.

4.1.2. Evaluation Criteria

Several evaluation metrics commonly used in the field of infrared small target detection are introduced to evaluate the performance of different infrared small target detection methods quantitatively. Signal-to-noise ratio gain (SNRG) is usually used to describe the target enhancement ability of methods and related to the SNR before and after image processing. SNR is expressed as follows:
S N R = ( I m a x I m e a n ) / σ
where I m a x is the maximum gray value of the image, I m e a n is the mean value of the image, and σ is the standard deviation. The SNRG is defined as follows:
S N R G = 20 × l o g 10 ( S N R o u t / S N R i n )
where S N R o u t and S N R i n represent the SNR of the original image and the output result, respectively.
Background suppression factor (BSF) is used to describe the background suppression ability of the corresponding method as follows:
B S F = C i n C o u t
where C i n and C o u t represent the standard deviation of the original image and the output result, respectively. Receiver operating characteristic (ROC) curve is used as a common evaluation index to quantify the effectiveness of methods at the pixel level. The ROC curve represents the relationship between the probabilities of detection ( P d ) and false alarm ( P f ). P d and P f are expressed as follows:
P d = n t N t , P f = n f N
where n t , N t , n f , and N represent the number of true pixels detected in the target image, number of target pixels in the original image, number of false alarm pixels, and the total number of pixels, respectively.

4.1.3. Baseline Methods

We choose eight existing advanced approaches as baseline methods to demonstrate the effectiveness and robustness of the proposed method. Among them, Top-Hat [9] is based on filtering methods. The HVS-based methods include a multi-scale relative local contrast measure (RLCM) [19], a multi-scale patch-based contrast measure (MPCM) [20], a tri-layer local contrast measure (TLLCM) [24], a multi-scale local contrast measure based on local energy factor (LEF) [22], and a weighted strengthened local contrast measure (WSLCM) [23]. Infrared patch image (IPI) [27] and partial sum of tensor nuclear norm (PSTNN) [30] are low-rank sparse decomposition-based methods. Parameter settings of the baseline method were obtained from experimental analysis and discussions in the paper of the original authors. Parameter settings of all methods are listed in Table 2.

4.2. Comparison with State-of-the-Art Methods

The results of different methods were processed independently in six groups of real ground–sky backgrounds to more clearly illustrate the detection capability of the proposed method clearly. The findings of the visualization of different methods are illustrated in Figure 5, Figure 6 and Figure 7. Targets are marked with a red box, unmarked areas indicate that no target is detected, and a close-up depiction of the target is shown in the bottom right corner of the image. The corresponding three-dimensional (3D) display diagram is presented below the detection result of each method to show the effectiveness and robustness of the proposed method intuitively. As shown in Figure 5, Figure 6 and Figure 7, the traditional Top-Hat method properly suppresses regions with a uniform background but poorly suppresses regions with strong interference background, thereby resulting in poor detection results. LCM-based methods focus on increasing the target background contrast and suppressing background clutter. However, accurately segmenting targets is difficult when targets are mixed in the strong interference background clutter. The method based on low-rank sparse decomposition focuses on how to separate the target from the background and can easily lead to false alarms when suspicious target areas exist in the background. The proposed method suppresses suspicious target regions through spatial dissimilarity weighting of the local contrast and achieves accurate segmentation of the target.
Strong interference clutter in Scene 1 is widely distributed, and the detection results of baseline methods all contain background noise residuals. Among them, the TLLCM method failed to detect the target. The background of Scenes 2–4 depicts messy grass and high-brightness ground. The 3D distribution demonstrates that a small amount of background noise is still retained in the WSLCM detection results. The increased background clutter in the detection results lead to a high false alarm rate although other baseline methods can detect the target. In particular, the target in Scene 4 is undetected by RLCM, TLLCM, and PSTNN due to the close proximity of the target to the high-brightness background, while the proposed method accurately detects the target. The background in Scene 5 is uniform despite the presence of suspicious targets. The suspicious target also exists although the real target is identified in the detection results of the baseline method. Specifically, the TLLCM only retains the false target and misses the real target. The background in Scene 6 contains trees and strong-interference ground clutter. Moreover, the 3D distribution shows that that IPI and PSTNN result in high false alarm rates when strong edges or sparse points exist in the background. Although LCM-based methods can successfully detect targets, many significant background residuals are observed in the detection results because the local contrast measurement poorly describes the suspected non-target region and results in a high false alarm rate in the presence of strong interference. These visualization results indicate that background clutter is nearly nonexistent in the detection results of the proposed method, and the target is accurately extracted compared with those of baseline methods. Moreover, experiments based on six groups of ground–sky scenes verified the robustness of the proposed method.
SNRG and BSF were used to evaluate the target enhancement and background suppression abilities of the proposed and baseline methods. High values of SNRG and BSF indicate the enhanced performance of the corresponding method. Table 3 and Table 4 show the SNRG and BSF of different methods in six different ground–sky backgrounds, where numbers in bold font indicate the maximum value of SNRG and BSF in each scene and underlined numbers denote the second highest values. The proposed method achieved the maximum SNRG and BSF in Scenes 2–5. Notably, high SNRG and BSF values are mainly concentrated in TLLCM, LEF, WSLCM, and the proposed method. These methods can improve the target enhancement and background suppression by combining local contrast measurements with weighting functions. The LEF and IPI methods present the maximum SNRG and BSF values in Scenes 1 and 6, respectively, but the background clutter that still exists in the detection results leads to inaccurate segmentation of the target.
Figure 8 shows the ROC curves of different methods in six real groups of ground–sky scenes. A method typically exhibits satisfactory detection performance when the ROC curve is close to the upper left corner. The proposed method achieved the best detection performance in each of the six real scenes compared with the baseline method. Meanwhile, the detection performance of PSTNN is poor and its false alarm rate is high mainly due to the complex background of the dataset used in the experiments and the susceptibility of PSTNN to treat strong interference clutter and suspicious targets as sparse points. Notably, the classical Top-Hat method achieved satisfactory detection performance in the test due to the appropriate match achieved between the selected structural elements and the target. In addition, although all LCM-based methods present high detection rates, they also show high false alarm rates mainly due to the presence of some high-brightness spots in the ground background that exhibit high contrast in the local background, thereby creating a false perception of the target. The proposed method achieves high detection performance in six scenes, especially when weighted mapping is used to suppress false alarm targets further.
All experimental programs were compiled using MATLAB R2018a and conducted on a computer with a 2.3 GHz Intel i5-GTX 950 M GPU and 8 G of memory. We tested the time consumption of different methods in six scenes to verify the computational efficiency of the proposed method. The time consumption of a single-frame for different methods in Scenes 1–6 are listed in Table 5, where the numbers in bold font indicate the minimum time consumption (maximum calculation efficiency) and underlined numbers indicate the calculation efficiency that ranks second. Methods based on morphology and local contrast measures are more computationally efficient than those based on low-rank sparse decomposition because morphology, and LCM-based methods only compute the pixel gray matrix for local regions of the image without additional computational complexity. However, methods based on low-rank sparse decomposition lead to low computational efficiency because they require singular value decomposition in every iteration. Table 5 demonstrates that MPCM and LEF achieve the highest and lowest computational efficiencies, respectively. The MPCM calculates local contrast measurements by simultaneously traversing the image through eight patches, thereby minimizing the computation time. The LEF consumes a significant amount of time in calculating the local energy factor, thereby increasing the time consumption costs. LCM-based RLCM, TLLCM, and WSLCM methods are time-consuming due to their need to traverse the whole image when calculating local contrast measures. IPI and PSTNN are methods based on low-rank sparse decomposition, with PSTNN demonstrating the minimum consumption of time. The proposed method ranks second in terms of computational efficiency because WLRDC needs to traverse the image Z times when calculating S Z and perform multi-scale calculations, thereby seriously affecting the computational efficiency.

5. Discussion

5.1. Discussion of Detection Performance

Because the imaging environment is complex and variable and the ground–sky background usually contains substantial interference clutter and noise, the detection of infrared small targets in the ground–sky scene is extremely difficult. Traditional Top-Hat filtering is extremely sensitive to edges and noise, resulting in inability to segment targets accurately, especially in complex ground–sky scenes. Strong interference clutter is widely distributed in the ground–sky scenes, and small targets are in a complex background leading to low contrast. Therefore, MPCM and RLCM methods that only use local contrast calculation are easy-to-miss targets. IPI and PSTNN are quite sensitive to point noise. For example, it incorrectly includes background clutter and sparse point noise into the target image in Figure 5, resulting in a high false alarm rate. The TLLCM, LEF. and WSLCM methods recently proposed combine local contrast and weighted mapping, and the anti-interference capability is significantly improved. However, the detection results of these methods are frequently full of noise and background clutter interference, leading to a huge challenge in separating the real target in postprocessing.
In this paper, we innovatively adopt S Z / m i to solve the problem of difficult target enhancement in low contrast conditions. Meanwhile, D m a x D m i n is used to eliminate complex background clutter and noise. Based on the local dissimilarity of the targets, a weighting function is proposed, which further suppresses the residual noise and extracts the targets accurately by fusing with LRDC. Since the proposed method requires pixel-by-pixel computation of gray features, especially in terms of a large dataset, when the image resolution increases, the computation increases as well. We perform a complexity analysis of the proposed method in Section 3.6. The real-time performance is also related to the hardware of the computer. In addition, the proposed method has low computational complexity and can be accelerated by GPU or field-programmable gate array (FPGA).

5.2. Discussion of the Key Parameter Z

We briefly discuss the selection of the key parameter Z in the proposed method in this section. Z in Equation (10) is the key parameter that directly determines the quality of the generated target saliency map. Many simulation experiments were performed at different scales to select the optimal Z values separately. First, we selected images with different sizes of targets as the test dataset. Note that sizes of targets should be less than or equal to 3 × 3, 5 × 5, 7 × 7, and 9 × 9. Second, simulation experiments were carried out at different scales with the corresponding settings of different Z values. We used ROC curves to measure the detection performance of the proposed method at different Z values. Figure 9 shows the ROC curves of the target under different sliding windows.
As shown in Figure 9, for smaller targets (3 × 3), we recommend Z be set from 4 to 6; for medium targets (5 × 5), we recommend Z be set from 9 to 13, and for larger targets (7 × 7 or 9 × 9), we recommend Z be set from 11 to 15. A large Z value indicates large time consumption because the Z value directly affects the computational efficiency of the proposed method. Therefore, the Z values are set to 4 (sliding window size is 3 × 3), 9 (sliding window size is 5 × 5), and 11 (sliding window size is 7 × 7 and 9 × 9).

6. Conclusions

In this paper, a weighted local ratio-difference contrast method was developed to detect infrared small targets in ground–sky background. First, facet kernel filtering and square calculation were used to obtain the enhanced target candidate pixels. Second, we used the local ratio-difference contrast and spatial dissimilarity of the target during the calculation of the WLRDC saliency map to suppress the complex background and enhance the real target. Finally, the effectiveness of the proposed method was verified in six real ground–sky scenes. The experimental results demonstrated that the proposed method can achieve efficient infrared small target detection in the ground–sky background and present clear advantages in a series of evaluation indexes.
However, the drawback of the proposed single-frame method is that the detection performance is poor when suspicious targets are presented in the background. In our future work, we will consider using temporal features of multi–frame images combined with local contrast to further suppress strong interference clutter in complex backgrounds. In addition, we will also verify the detection performance of the proposed method in multi–target scenarios.

Author Contributions

H.W. proposed the original idea, conducted the experiments, and wrote the manuscript. P.M., D.P., W.L. and J.Q. were involved in writing and revising the manuscript. X.G. helped with data collection. All authors have read and agreed to the published version of the manuscript.

Funding

This work was supported in part by the National Natural Science Foundation of China under Grant U1833203, in part by the Aviation Science Foundation under Grant 2020Z019055001, and the Graduate Education Innovation Program Fund of Zhengzhou University of Aeronautics (2022CX55).

Institutional Review Board Statement

Not applicable.

Informed Consent Statement

Not applicable.

Data Availability Statement

Not applicable.

Acknowledgments

The author would like to thank Dongdong Pang, a postdoctoral fellow at the Beijing Institute of Technology, for his constructive advice on the revision of the manuscript.

Conflicts of Interest

The authors declare no conflict of interest.

References

  1. Zhang, T.; Wu, H.; Liu, Y.; Peng, L.; Yang, C.; Peng, Z. Infrared Small Target Detection Based on Non-Convex Optimization with Lp-Norm Constraint. Remote Sens. 2019, 11, 559. [Google Scholar] [CrossRef] [Green Version]
  2. Chen, Y.; Xin, Y. An Efficient Infrared Small Target Detection Method Based on Visual Contrast Mechanism. IEEE Geosci. Remote Sens. Lett. 2016, 13, 962–966. [Google Scholar] [CrossRef]
  3. Han, J.; Yong, M.; Huang, J.; Mei, X.; Ma, J. An Infrared Small Target Detecting Algorithm Based on Human Visual System. IEEE Geosci. Remote Sens. Lett. 2015, 13, 452–456. [Google Scholar] [CrossRef]
  4. Pang, D.D.; Shan, T.; Li, W.; Ma, P.G.; Tao, R.; Ma, Y.R. Facet Derivative-Based Multidirectional Edge Awareness and Spatial–Temporal Tensor Model for Infrared Small Target Detection. IEEE Trans. Geosci. Remote Sens. 2022, 60, 1–15. [Google Scholar] [CrossRef]
  5. Li, Z.Z.; Chen, J.; Hou, Q.; Fu, H.X.; Dai, Z.; Jin, G.; Li, R.Z.; Liu, C.J. Sparse representation for infrared dim target detection via a discriminative over-complete dictionary learned online. Sensors 2014, 14, 9451–9470. [Google Scholar] [CrossRef] [PubMed]
  6. Deng, H.; Wei, Y.; Tong, M. Small target detection based on weighted self-information map. Infrared Phys. Technol. 2013, 60, 197–206. [Google Scholar] [CrossRef]
  7. Zhou, F.; Wu, Y.; Dai, Y.; Wang, P. Detection of Small Target Using Schatten 1/2 Quasi-Norm Regularization with Reweighted Sparse Enhancement in Complex Infrared Scenes. Remote Sens. 2019, 11, 2058. [Google Scholar] [CrossRef] [Green Version]
  8. Lu, Y.; Dong, L.; Zhang, T.; Xu, W. A Robust Detection Algorithm for Infrared Maritime Small and Dim Targets. Sensors 2020, 20, 1237. [Google Scholar] [CrossRef] [PubMed] [Green Version]
  9. Zhou, J.; Lv, H.; Zhou, F. Infrared small target enhancement by using sequential top-hat filters. Proc. Int. Symp. Optoelectron. Technol. Appl. 2014, 9301, 417–421. [Google Scholar]
  10. Zeng, M.; Li, J.; Peng, Z. The design of top-hat morphological filter and application to infrared target detection. Infrared Phys. Technol. 2006, 48, 67–76. [Google Scholar] [CrossRef]
  11. Deshpande, S.D.; Meng, H.E.; Ronda, V.; Chan, P. Max-mean and Max-median filters for detection of small-targets. Proc. SPIE Int. Soc. Opt. Eng. 1999, 3809, 74–83. [Google Scholar]
  12. Fan, H.; Wen, C. Two-Dimensional Adaptive Filtering Based on Projection Algorithm. IEEE Trans. Signal Process. 2004, 52, 832–838. [Google Scholar] [CrossRef]
  13. Zhao, Y.; Pan, H.; Du, C.; Peng, Y.; Zheng, Y. Bilateral two dimensional least mean square filter for infrared small target detection. Infrared Phys. Technol. 2014, 65, 17–23. [Google Scholar] [CrossRef]
  14. Peng, L.B.; Zhang, T.F.; Liu, Y.H.; Li, M.H.; Peng, Z.M. Infrared dim target detection using shearlet’s kurtosis maximization under non-uniform background. Symmetry 2019, 11, 723. [Google Scholar] [CrossRef] [Green Version]
  15. Nie, J.Y.; Qu, S.C.; Wei, Y.T.; Zhang, L.M.; Deng, L.Z. An Infrared Small Target Detection Method Based on Multiscale Local Homogeneity Measure. Infrared Phys. Technol. 2018, 90, 186–194. [Google Scholar] [CrossRef]
  16. Chen, C.L.; Li, H.; Wei, Y.T.; Xia, T.; Tang, Y.Y. A local contrast method for small infrared target detection. IEEE Trans. Geosci. Remote Sens. 2013, 52, 574–581. [Google Scholar] [CrossRef]
  17. Han, J.H.; Ma, Y.; Zhou, B.; Fan, F.; Liang, K.; Fang, Y. A robust infrared small target detection algorithm based on human visual system. IEEE Geosci. Remote Sens. Lett. 2014, 11, 2168–2172. [Google Scholar]
  18. Qin, Y.; Li, B. Effective infrared small target detection utilizing a novel local contrast method. IEEE Geosci. Remote Sens. Lett. 2016, 13, 1890–1894. [Google Scholar] [CrossRef]
  19. Han, J.H.; Liang, K.; Zhou, B.; Zhu, X.Y.; Zhao, J.; Zhao, L.L. Infrared small target detection utilizing the multi-scale relative local contrast measure. IEEE Geosci. Remote Sens. Lett. 2018, 15, 612–616. [Google Scholar] [CrossRef]
  20. Wei, Y.T.; You, X.G.; Li, H. Multiscale patch-based contrast measure for small infrared target detection. Pattern Recogn. 2016, 58, 216–226. [Google Scholar] [CrossRef]
  21. Cui, Z.; Yang, J.; Jiang, S.; Li, J. An infrared small target detection algorithm based on high-speed local contrast method. Infrared Phys. Technol. 2016, 76, 474–481. [Google Scholar] [CrossRef] [Green Version]
  22. Xia, C.Q.; Li, X.R.; Zhao, L.Y.; Shu, R. Infrared Small Target Detection Based on Multiscale Local Contrast Measure Using Local Energy Factor. IEEE Geosci. Remote Sens. Lett. 2020, 17, 157–161. [Google Scholar] [CrossRef]
  23. Han, J.H.; Moradi, S.; Faramarzi, I.; Zhang, H.H.; Zhao, Q.; Zhang, X.J.; Li, N. Infrared Small Target Detection Based on the Weighted Strengthened Local Contrast Measure. IEEE Geosci. Remote Sens. Lett. 2021, 18, 1670–1674. [Google Scholar] [CrossRef]
  24. Han, J.; Moradi, S.; Faramarzi, I.; Liu, C.; Zhang, H.; Zhao, Q. A local contrast method for infrared small-target detection utilizing a tri-layer window. IEEE Geosci. Remote Sens. Lett. 2019, 17, 1822–1826. [Google Scholar] [CrossRef]
  25. Wu, L.; Ma, Y.; Fan, F.; Wu, M.H.; Huang, J. A Double-Neighborhood Gradient Method for Infrared Small Target Detection. IEEE Geosci. Remote Sens. Lett. 2021, 18, 1476–1480. [Google Scholar] [CrossRef]
  26. Lu, X.F.; Bai, X.F.; Li, S.X.; Hei, X.H. Infrared Small Target Detection Based on the Weighted Double Local Contrast Measure Utilizing a Novel Window. IEEE Geosci. Remote Sens. Lett. 2022, 19, 1–5. [Google Scholar] [CrossRef]
  27. Gao, C.Q.; Meng, D.Y.; Yang, Y.; Wang, Y.T.; Zhou, X.F.; Hauptmann, A.G. Infrared patch-image model forsmall target detection in a single image. IEEE Trans. Image Process. 2013, 22, 4996–5009. [Google Scholar] [CrossRef] [PubMed]
  28. Wang, X.Y.; Peng, Z.M.; Kong, D.H.; He, Y.M. Infrared dim and small target detection based on stable multi-subspace learning in heterogeneous scenes. IEEE Trans. Geosci. Remote Sens. 2017, 55, 5481–5493. [Google Scholar] [CrossRef]
  29. Dai, Y.M.; Wu, Y. Reweighted Infrared Patch-Tensor Model With Both Nonlocal and Local Priors for Single-Frame Small Target Detection. IEEE J. Sel. Top. Appl. Earth Obs. Remote. Sens. 2017, 10, 3752–3767. [Google Scholar] [CrossRef] [Green Version]
  30. Zhang, L.; Peng, Z. Infrared small target detection based on partial sum of the tensor nuclear norm. Remote Sens. 2019, 11, 382. [Google Scholar] [CrossRef] [Green Version]
  31. Deng, L.Z.; Zhu, H.; Tao, C.; Wei, Y.T. Infrared moving point target detection based on spatial–temporal local contrast filter. Infrared Phys. Technol. 2016, 76, 168–173. [Google Scholar] [CrossRef]
  32. Zhao, B.; Xiao, S.; Lu, H.; Wu, D. Spatial-temporal local contrast for moving point target detection in space-based infrared imaging system. Infrared Phys. Technol. 2018, 95, 53–60. [Google Scholar] [CrossRef]
  33. Du, P.; Askar, H. Infrared Moving Small-Target Detection Using Spatial-Temporal Local Difference Measure. IEEE Geosci. Remote Sens. Lett. 2019, 17, 1817–1821. [Google Scholar] [CrossRef]
  34. Liu, H.K.; Zhang, L.; Huang, H. Small Target Detection in Infrared Videos Based on Spatio-Temporal Tensor Model. IEEE Trans. Geosci. Remote Sens. 2020, 58, 8689–8700. [Google Scholar] [CrossRef]
  35. Pang, D.D.; Shan, T.; Ma, P.G.; Li, W.; Liu, S.H.; Tao, R. A Novel Spatiotemporal Saliency Method for Low-Altitude Slow Small Infrared Target Detection. IEEE Geosci. Remote Sens. Lett. 2022, 19, 1–5. [Google Scholar] [CrossRef]
  36. Wang, K.D.; Li, S.Y.; Niu, S.S.; Zhang, K. Detection of Infrared Small Targets Using Feature Fusion Convolutional Network. IEEE Access. 2019, 7, 146081–146092. [Google Scholar] [CrossRef]
  37. Wang, H.; Zhou, L.; Wang, L. Miss Detection vs. False Alarm: Adversarial Learning for Small Object Segmentation in Infrared Images. In Proceedings of the 2019 IEEE/CVF International Conference on Computer Vision (ICCV), Seoul, Korea, 27 October–2 November 2019; pp. 8508–8517. [Google Scholar]
  38. Dai, Y.M.; Wu, Y.Q.; Zhou, F.; Barnard, K. Attentional Local Contrast Networks for Infrared Small Target Detection. IEEE Trans. Geosci. Remote Sens. 2021, 59, 9813–9824. [Google Scholar] [CrossRef]
  39. Kim, J.H.; Hwang, Y. GAN-Based Synthetic Data Augmentation for Infrared Small Target Detection. IEEE Trans. Geosci. Remote Sens. 2022, 60, 1–12. [Google Scholar] [CrossRef]
  40. Zuo, Z.; Tong, X.; Wei, J.; Su, S.; Wu, P.; Guo, R.; Sun, B. AFFPN: Attention Fusion Feature Pyramid Network for Small Infrared Target Detection. Remote Sens. 2022, 14, 3412. [Google Scholar] [CrossRef]
  41. Guan, X.W.; Peng, Z.M.; Huang, S.Q.; Chen, Y.P. Gaussian Scale-Space Enhanced Local Contrast Measure for Small Infrared Target Detection. IEEE Geosci. Remote Sens. Lett. 2020, 17, 327–331. [Google Scholar] [CrossRef]
  42. Han, J.H.; Liu, S.B.; Qin, G.; Zhao, Q.; Zhang, H.H.; Li, N.N. A Local Contrast Method Combined With Adaptive Background Estimation for Infrared Small Target Detection. IEEE Geosci. Remote Sens. Lett. 2019, 16, 1442–1446. [Google Scholar] [CrossRef]
  43. Han, J.H.; Xu, Q.Y.; Saed, M.; Fang, H.Z.; Yuan, X.Y.; Qi, Z.M.; Wan, J.Y. A Ratio-Difference Local Feature Contrast Method for Infrared Small Target Detection. IEEE Geosci. Remote Sens. Lett. 2022, 19, 1–5. [Google Scholar] [CrossRef]
  44. Du, P.; Askar, H. Infrared Small Target Detection Based on Facet-Kernel Filtering Local Contrast Measure; Springer: Singapore, 2019. [Google Scholar]
  45. Qi, S.; Xu, G.; Mou, Z.; Huang, D.; Zheng, X. A fast-saliency method for real-time infrared small target detection. Infrared Phys. Technol. 2016, 77, 440–450. [Google Scholar] [CrossRef]
  46. Yang, P.; Dong, L.L.; Xu, W.H. Infrared Small Maritime Target Detection Based on Integrated Target Saliency Measure. IEEE J. Sel. Top. Appl. Earth Obs. Remote Sens. 2021, 14, 2369–2386. [Google Scholar] [CrossRef]
  47. Hui, B.W.; Song, Z.Y.; Fan, H.Q.; Zhong, P.; Hu, W.D.; Zhang, X.F.; Lin, J.G.; Su, H.Y.; Jin, W.; Zhang, Y.J.; et al. A dataset for infrared image dim-small aircraft target detection and tracking under ground/air background. China Sci. Data 2020, 5, 291–302. [Google Scholar]
Figure 1. Window detection framework: (a) traditional window detection framework; (b) triple-layer window detection framework; (c) double neighbor window detection framework; (d) double-layer nested window.
Remotesensing 14 05636 g001aRemotesensing 14 05636 g001b
Figure 2. The overall target detection process of the proposed WLRDC method. The detection process includes facet kernel filtering, calculation of LRDC and BDPW, and WLRDC obtained by fusing the LRDC and BDPW.
Remotesensing 14 05636 g002
Figure 3. Target enhancement process. (a) original image; (b) result of facet kernel filtering; (c) result of square calculation. Red boxes indicate the targets.
Remotesensing 14 05636 g003
Figure 4. Structure of the nested sliding window, where L is the length of the block.
Remotesensing 14 05636 g004
Figure 5. Detection results and 3D distribution of different methods in Scenes 1 and 2. The target is marked with a red box, and a close-up of the target is shown in the lower right corner. Unmarked areas indicate the absence of detection of the target.
Remotesensing 14 05636 g005
Figure 6. Detection results and 3D distribution of different methods in Scenes 3 and 4. The target is marked with a red box, and a close-up of the target is shown in the lower right corner. Unmarked areas indicate the absence of detection of the target.
Remotesensing 14 05636 g006
Figure 7. Detection results and 3D distribution of different methods in Scenes 5 and 6. The target is marked with a red box, and a close-up of the target is shown in the lower right corner. Unmarked areas indicate the absence of detection of the target.
Remotesensing 14 05636 g007
Figure 8. ROC curves of different methods in six real scenes.
Remotesensing 14 05636 g008
Figure 9. The ROC curves for different Z values in four windows: sliding window of (a) 3 × 3; (b) 5 × 5; (c) 7 × 7; and (d) 9 × 9.
Remotesensing 14 05636 g009
Table 1. Details of the six test datasets.
DataNumber of FramesImage ResolutionBackground DescriptionTarget Type
Scene 1259 256 × 256Ground–sky background, high voltage towers, and strong radiation buildingsUAV
Scene 2151256 × 256Ground–sky background, high-brightness roads, and forestsUAV
Scene 3131256 × 256Ground–sky background, grasslands, and strong radiation groundUAV
Scene 475256 × 256Ground–sky background, trees, and high-brightness groundUAV
Scene 5100256 × 256Ground–sky background, telegraph poles, and high-brightness groundUAV
Scene 6150256 × 256Ground–sky background, forests, and strong ground disturbance clutterUAV
Table 2. Parameter settings of the different methods.
MethodsParameter Settings
Top-Hat [9]Structure size: square, local window size: 3 × 3
RLCM [19] ( k 1 , k 2 ) = (2,4), (5,9) and (9,16)
MPCM [20]Local window size: N = 3,5,7,9. mean filter size: 3 × 3
IPI [27]Patch size: 50 × 50, sliding step: 10, λ = 1/ m i n ( m , n ) ε = 10−7
TLLCM [24]Window size: 3 × 3, s = 5,7,9
LEF [22]P = 1,3,5,7,9, α = 0.5, and h = 0.2
PSTNN [30]Patch size: 40 × 40, sliding step: 40, λ = 1 / m i n ( m , n ) , ε = 10−7
WSLCM [23]K = 9,  λ = 0.6∼0.9
ProposedLocal window size: L = 3,5,7,9,   K = 4,9,11
Table 3. Average SNRG values of different methods in six real scenes.
MethodsScene 1Scene 2Scene 3Scene 4Scene 5Scene 6
Top-Hat [9]30.32123.56820.40410.1056.05915.975
RLCM [19]26.04630.58728.37321.3958.47618.487
MPCM [20]30.79638.53337.94224.48518.99622.243
IPI [27]35.46538.99434.06423.76616.04931.107
TLLCM [24]33.30241.84039.91030.09917.97629.228
LEF [22]38.44540.83137.87828.63718.81830.620
PSTNN [30]35.57338.40729.37326.28517.01724.576
WSLCM [23]36.35342.12240.45631.29319.41430.478
Proposed38.02342.84742.55033.96620.63630.793
Table 4. Average BSF values of different methods in six real scenes.
MethodsScene 1Scene 2Scene 3Scene 4Scene 5Scene 6
Top-Hat [9]24.1677.2645.4682.9202.0095.958
RLCM [19]15.73515.61513.40210.7472.7197.868
MPCM [20]28.89745.04943.42115.2949.95712.717
IPI [27]43.06041.81825.87113.5896.41433.793
TLLCM [24]33.96757.37750.02927.9648.15928.127
LEF [22]60.30651.20139.70323.6858.87532.058
PSTNN [30]43.87239.17916.29518.0377.14616.031
WSLCM [23]50.16559.10553.18032.6439.44332.262
Proposed57.18364.30167.94943.33010.75332.355
Table 5. Average time consumption of a single frame for all methods in six real scenes. (Unit: s).
MethodsScene 1Scene 2Scene 3Scene 4Scene 5Scene 6
Top-Hat [9]0.5940.5640.5440.5440.5420.547
RLCM [19]4.2974.4234.4784.3874.5364.371
MPCM [20]0.1620.1380.1330.1260.1310.122
IPI [27]9.2668.8268.9399.3279.8638.922
TLLCM [24]1.5351.2771.4321.4761.2851.233
LEF [22]19.25219.61220.74419.43020.15619.443
PSTNN [30]0.2990.2570.3020.3150.2670.324
WSLCM [23]5.2694.8075.4784.6265.4445.294
Proposed0.2160.2170.2170.2190.2210.220
Publisher’s Note: MDPI stays neutral with regard to jurisdictional claims in published maps and institutional affiliations.

