
Glacier Changes in India’s Dhauliganga Catchment over the Past Two Decades
 , , and
Abstract
:
1. Introduction
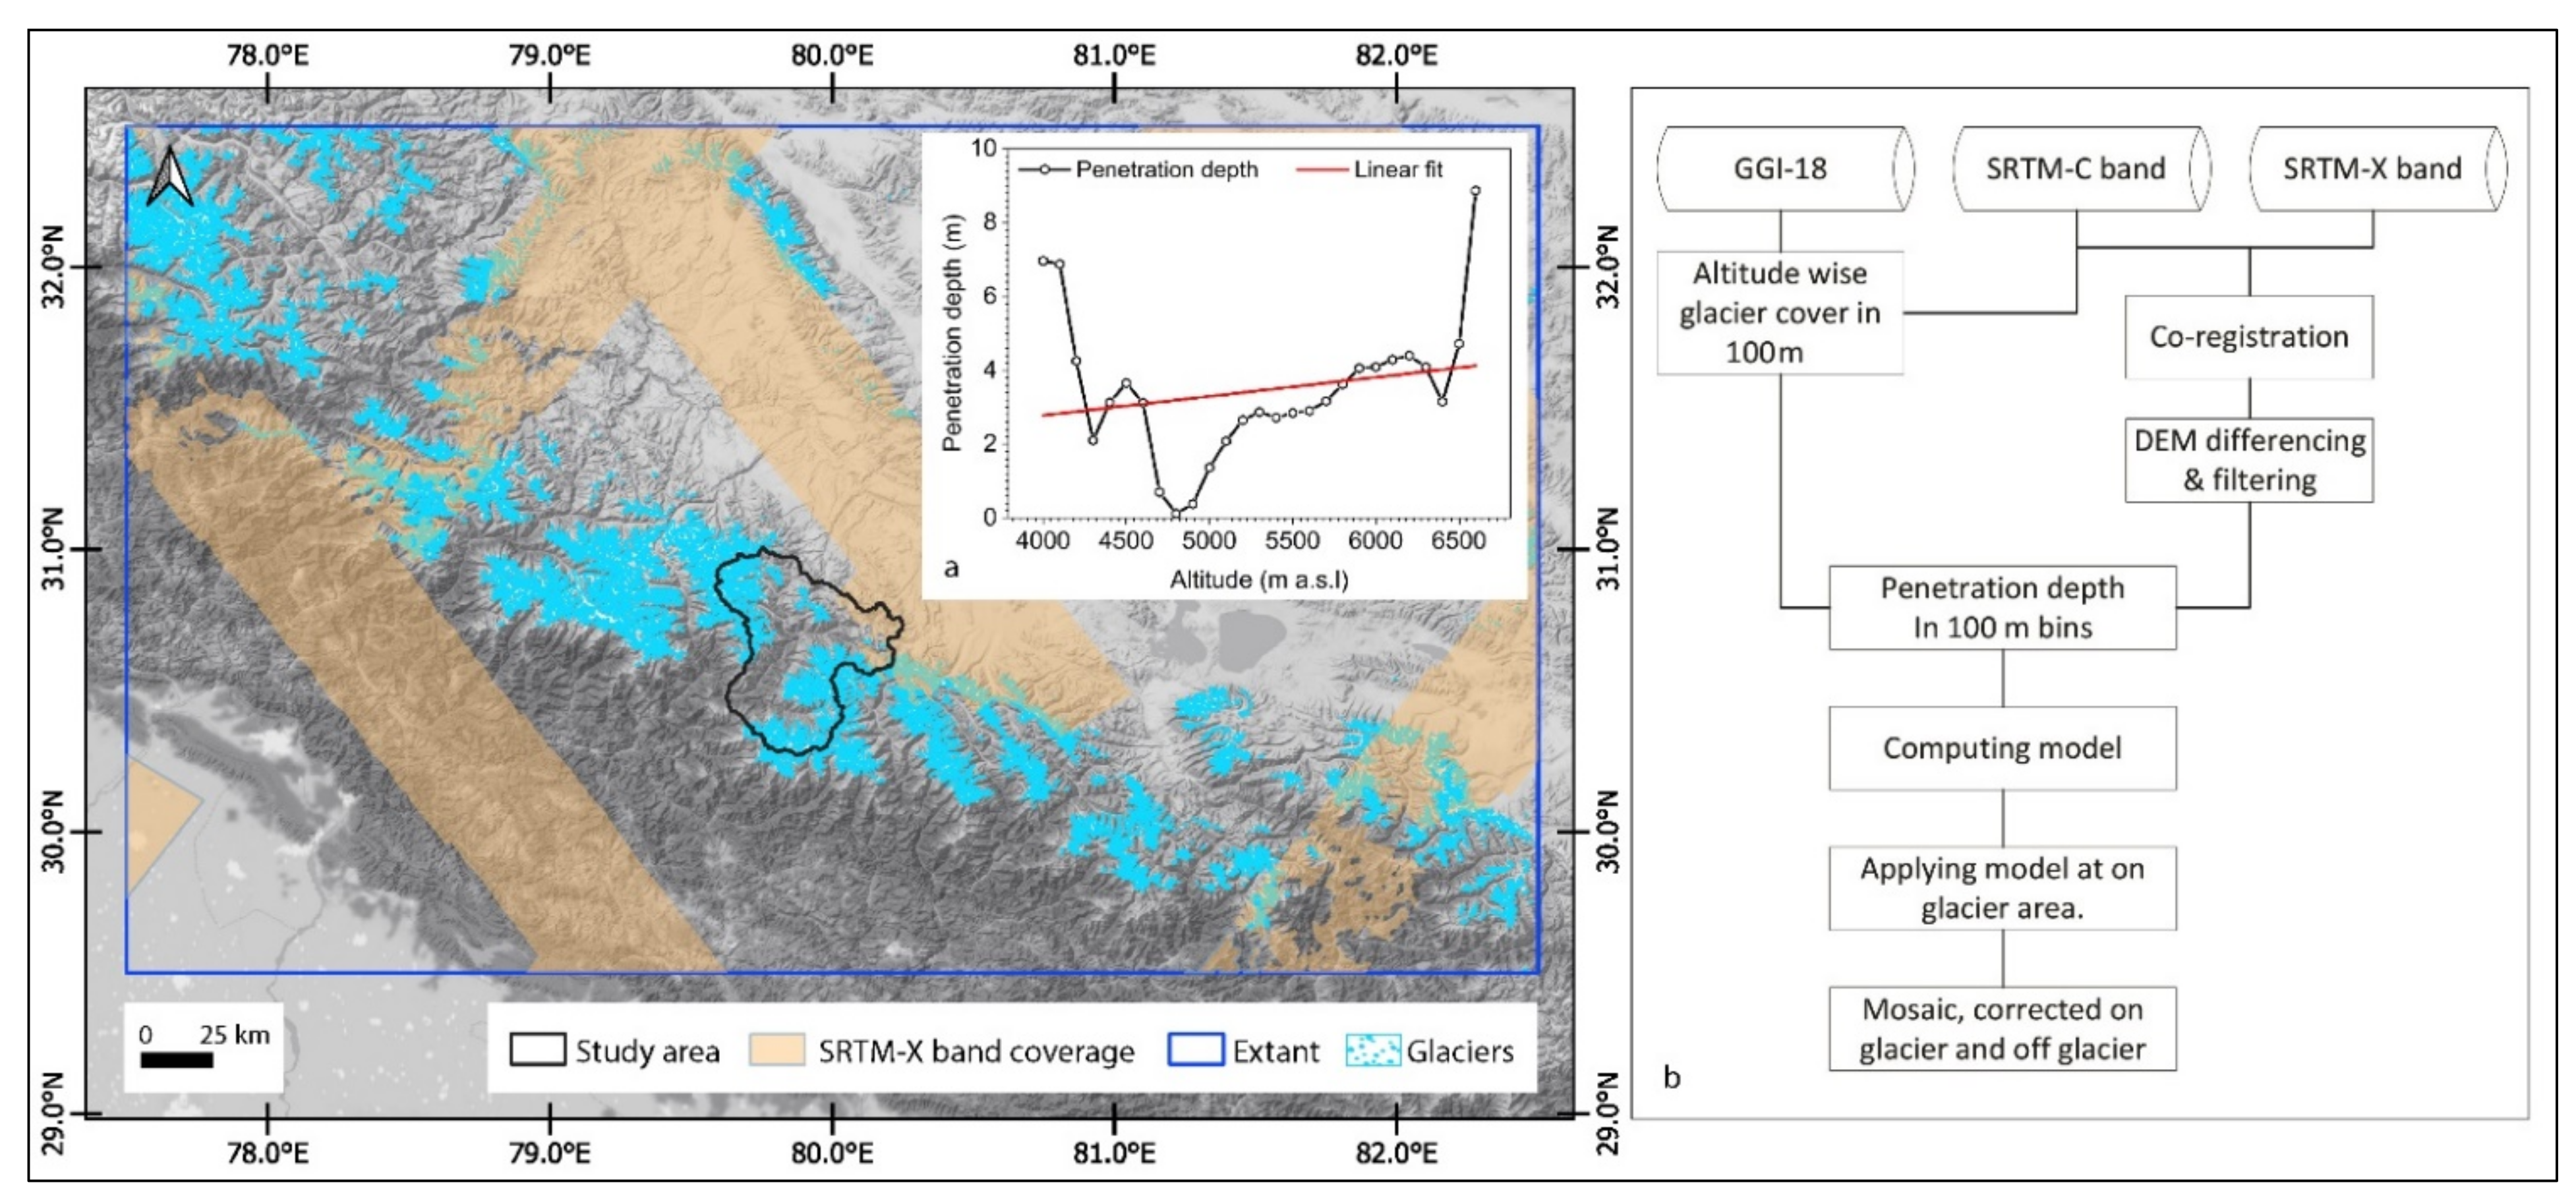
2. Study Area
3. Materials and Methods
3.1. Materials
3.1.1. Landsat Images
3.1.2. DEM Data
3.1.3. ICESat-2 Data
3.1.4. Datasets of Surface Elevation Difference
3.1.5. Climate Data
3.2. Methods
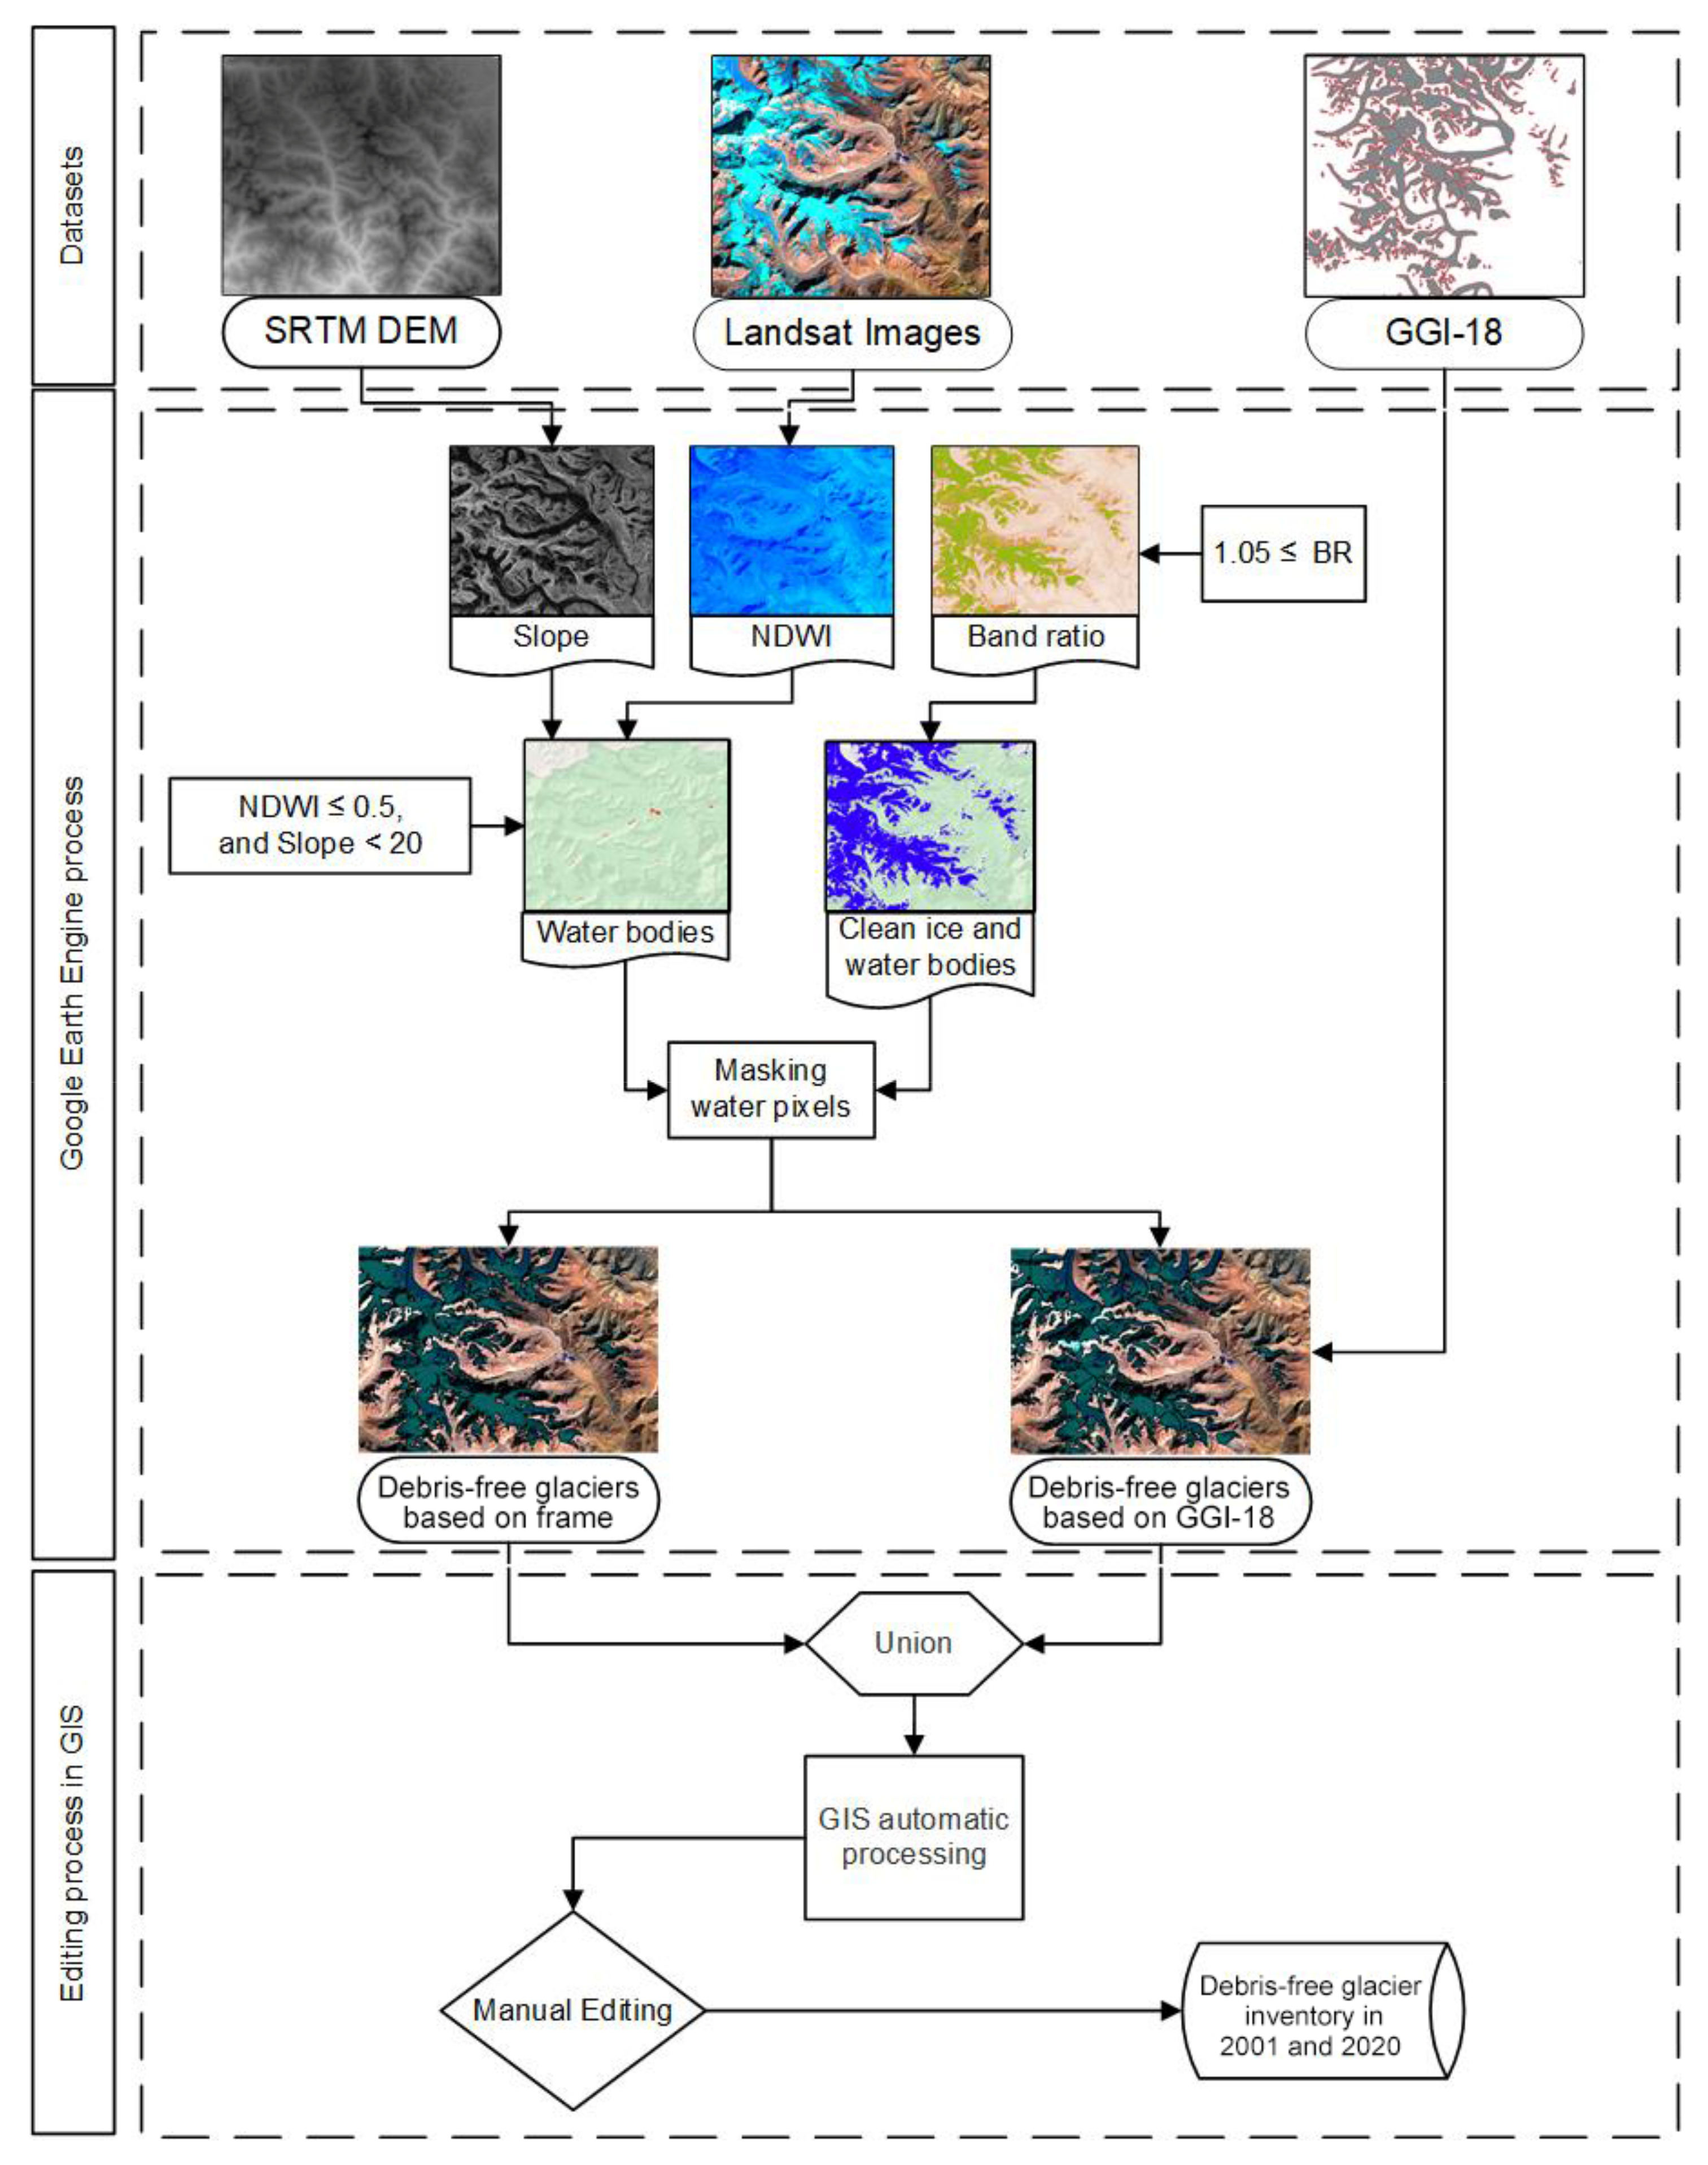
3.2.1. Glacier Outline Extraction
GEE-Based Process
Editing Process in GIS
- (1)
- Union of both shapefiles.
- 2)
- The “Explode multipart feature” function was then applied so that merged small polygons on the edges could divide into small individual polygons.
- (3)
- We selected polygons with no Glacier ID and areas less than 0.1 km2 to merge these small polygons with the nearest glacier.
- (4)
- The “Eliminate” function was applied to merge these selected polygons with the nearest glacier polygon.
- (5)
- The “Dissolve” function was applied using Glacier ID to merge the small polygons.
- (6)
- We manually removed the extraneous noise caused by cloud cover and seasonal snow cover.
Mapping Challenges and Solutions
Calculation of Glacier Area Change
3.2.2. Glacier Mass Balance Analysis
Geoid Transformation
Penetration Depth Correction
Co-Registration
Elevation Differencing
Glacier Mass Balance Calculation
3.2.3. Uncertainty Assessment
Glacier Area
Elevation Change
Mass Balance Change
4. Results and Discussion
4.1. Glacier Area
4.1.1. Uncertainty Assessment in Glacier Area
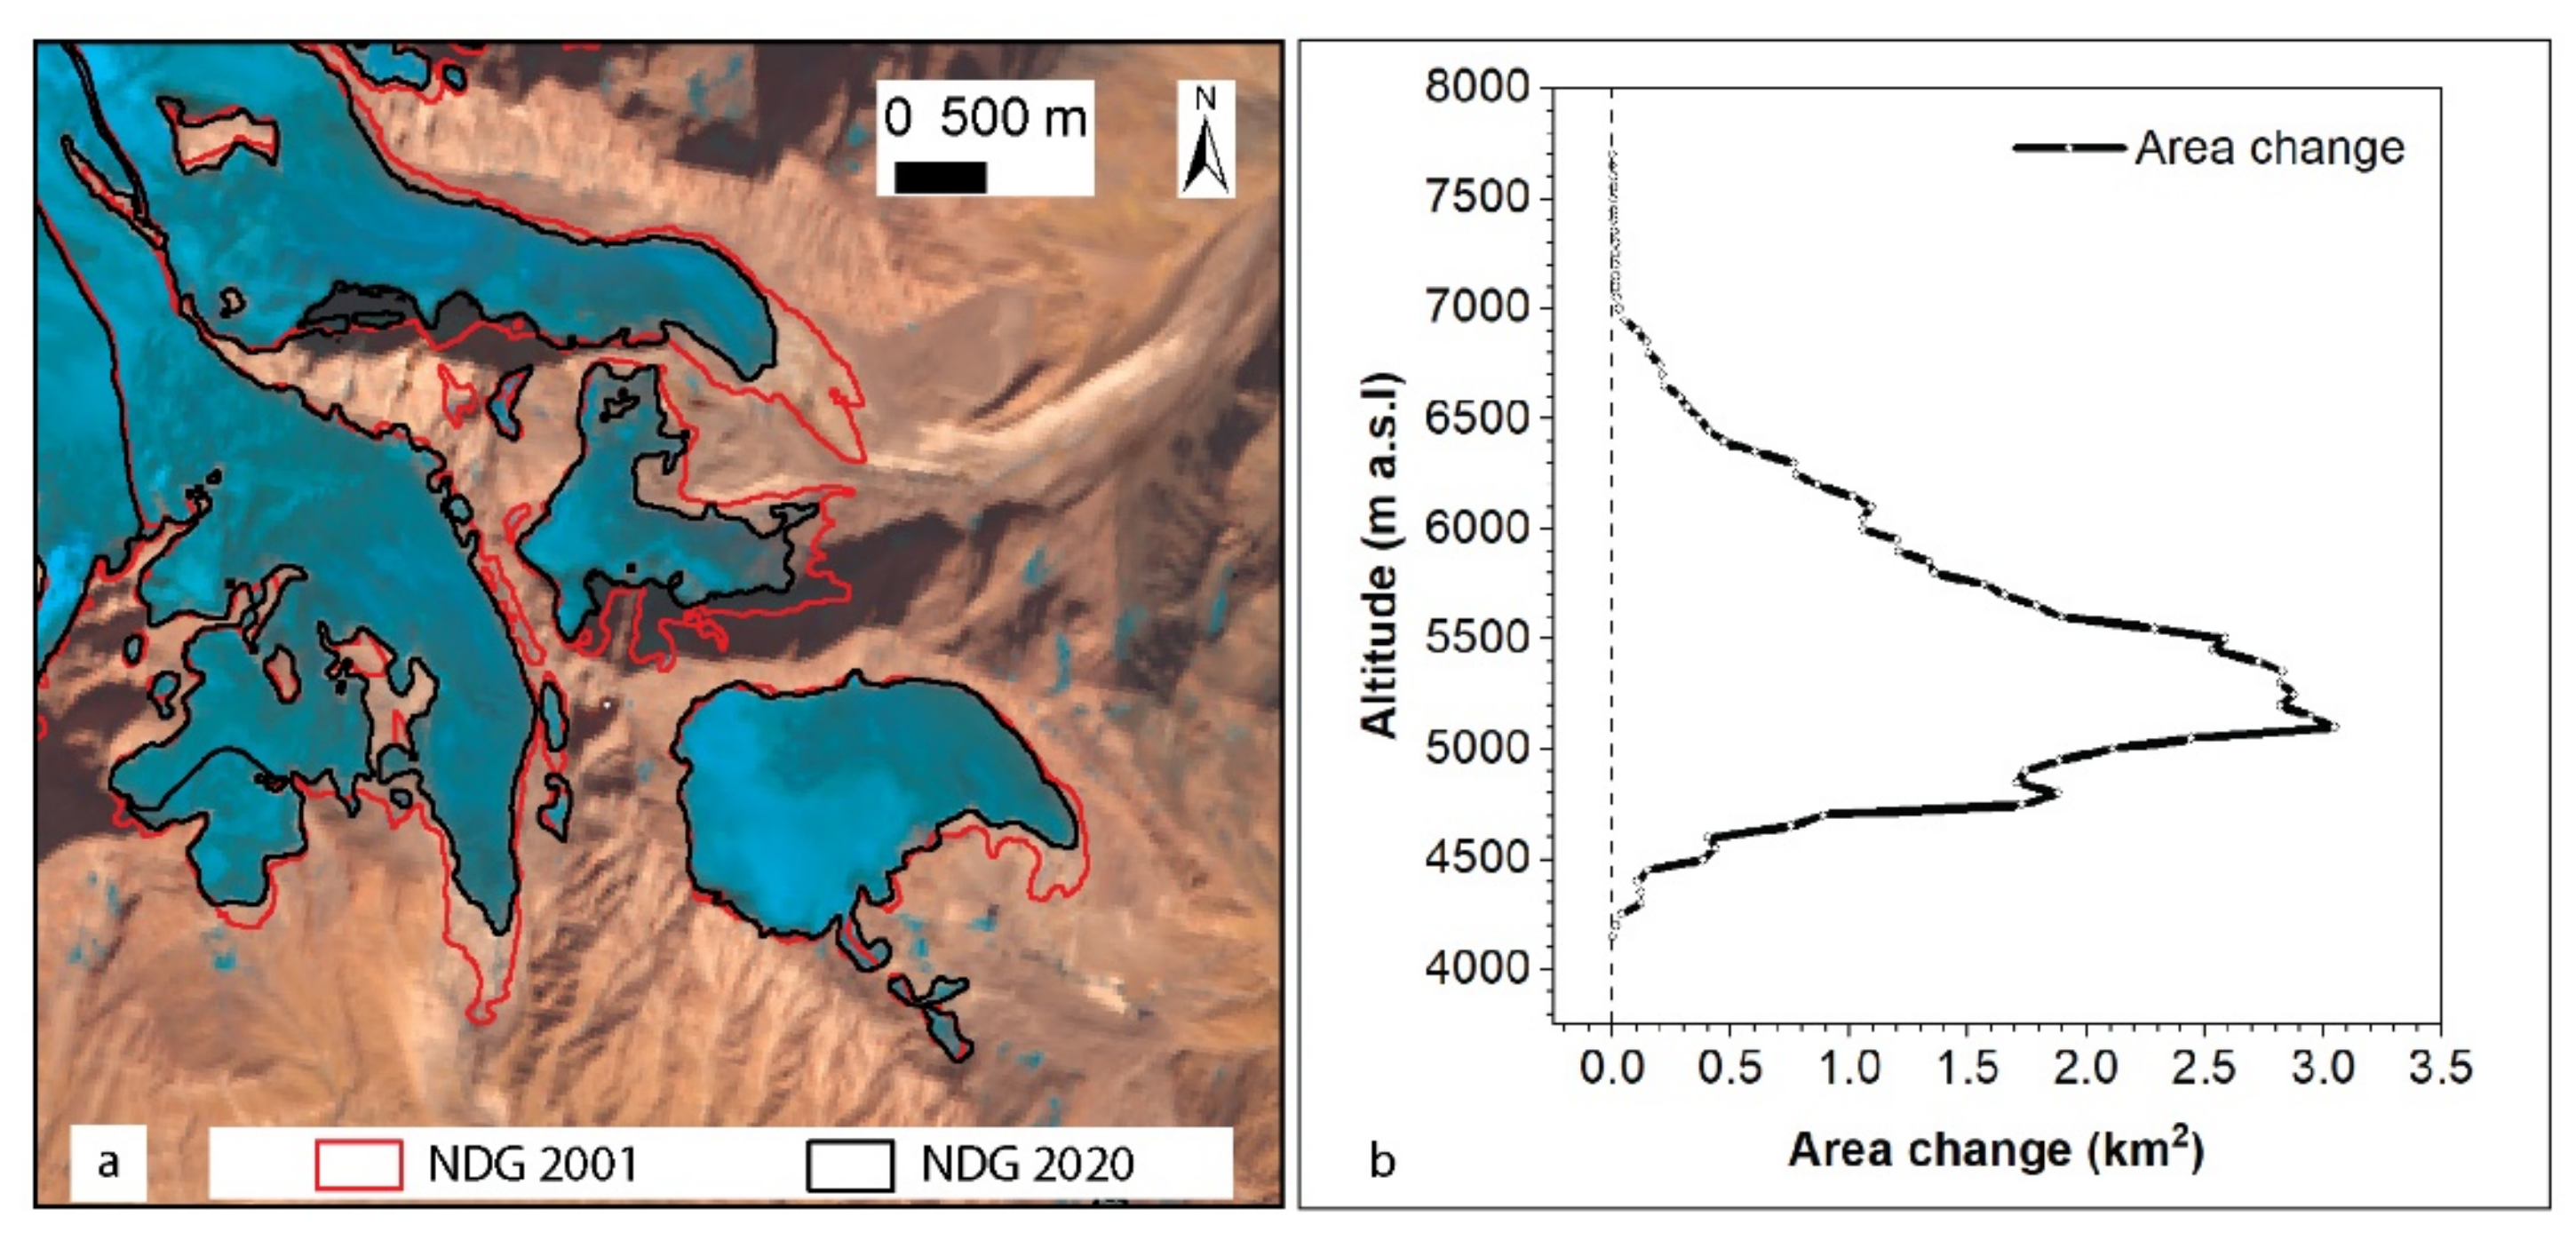
4.1.2. Glacier Area Change
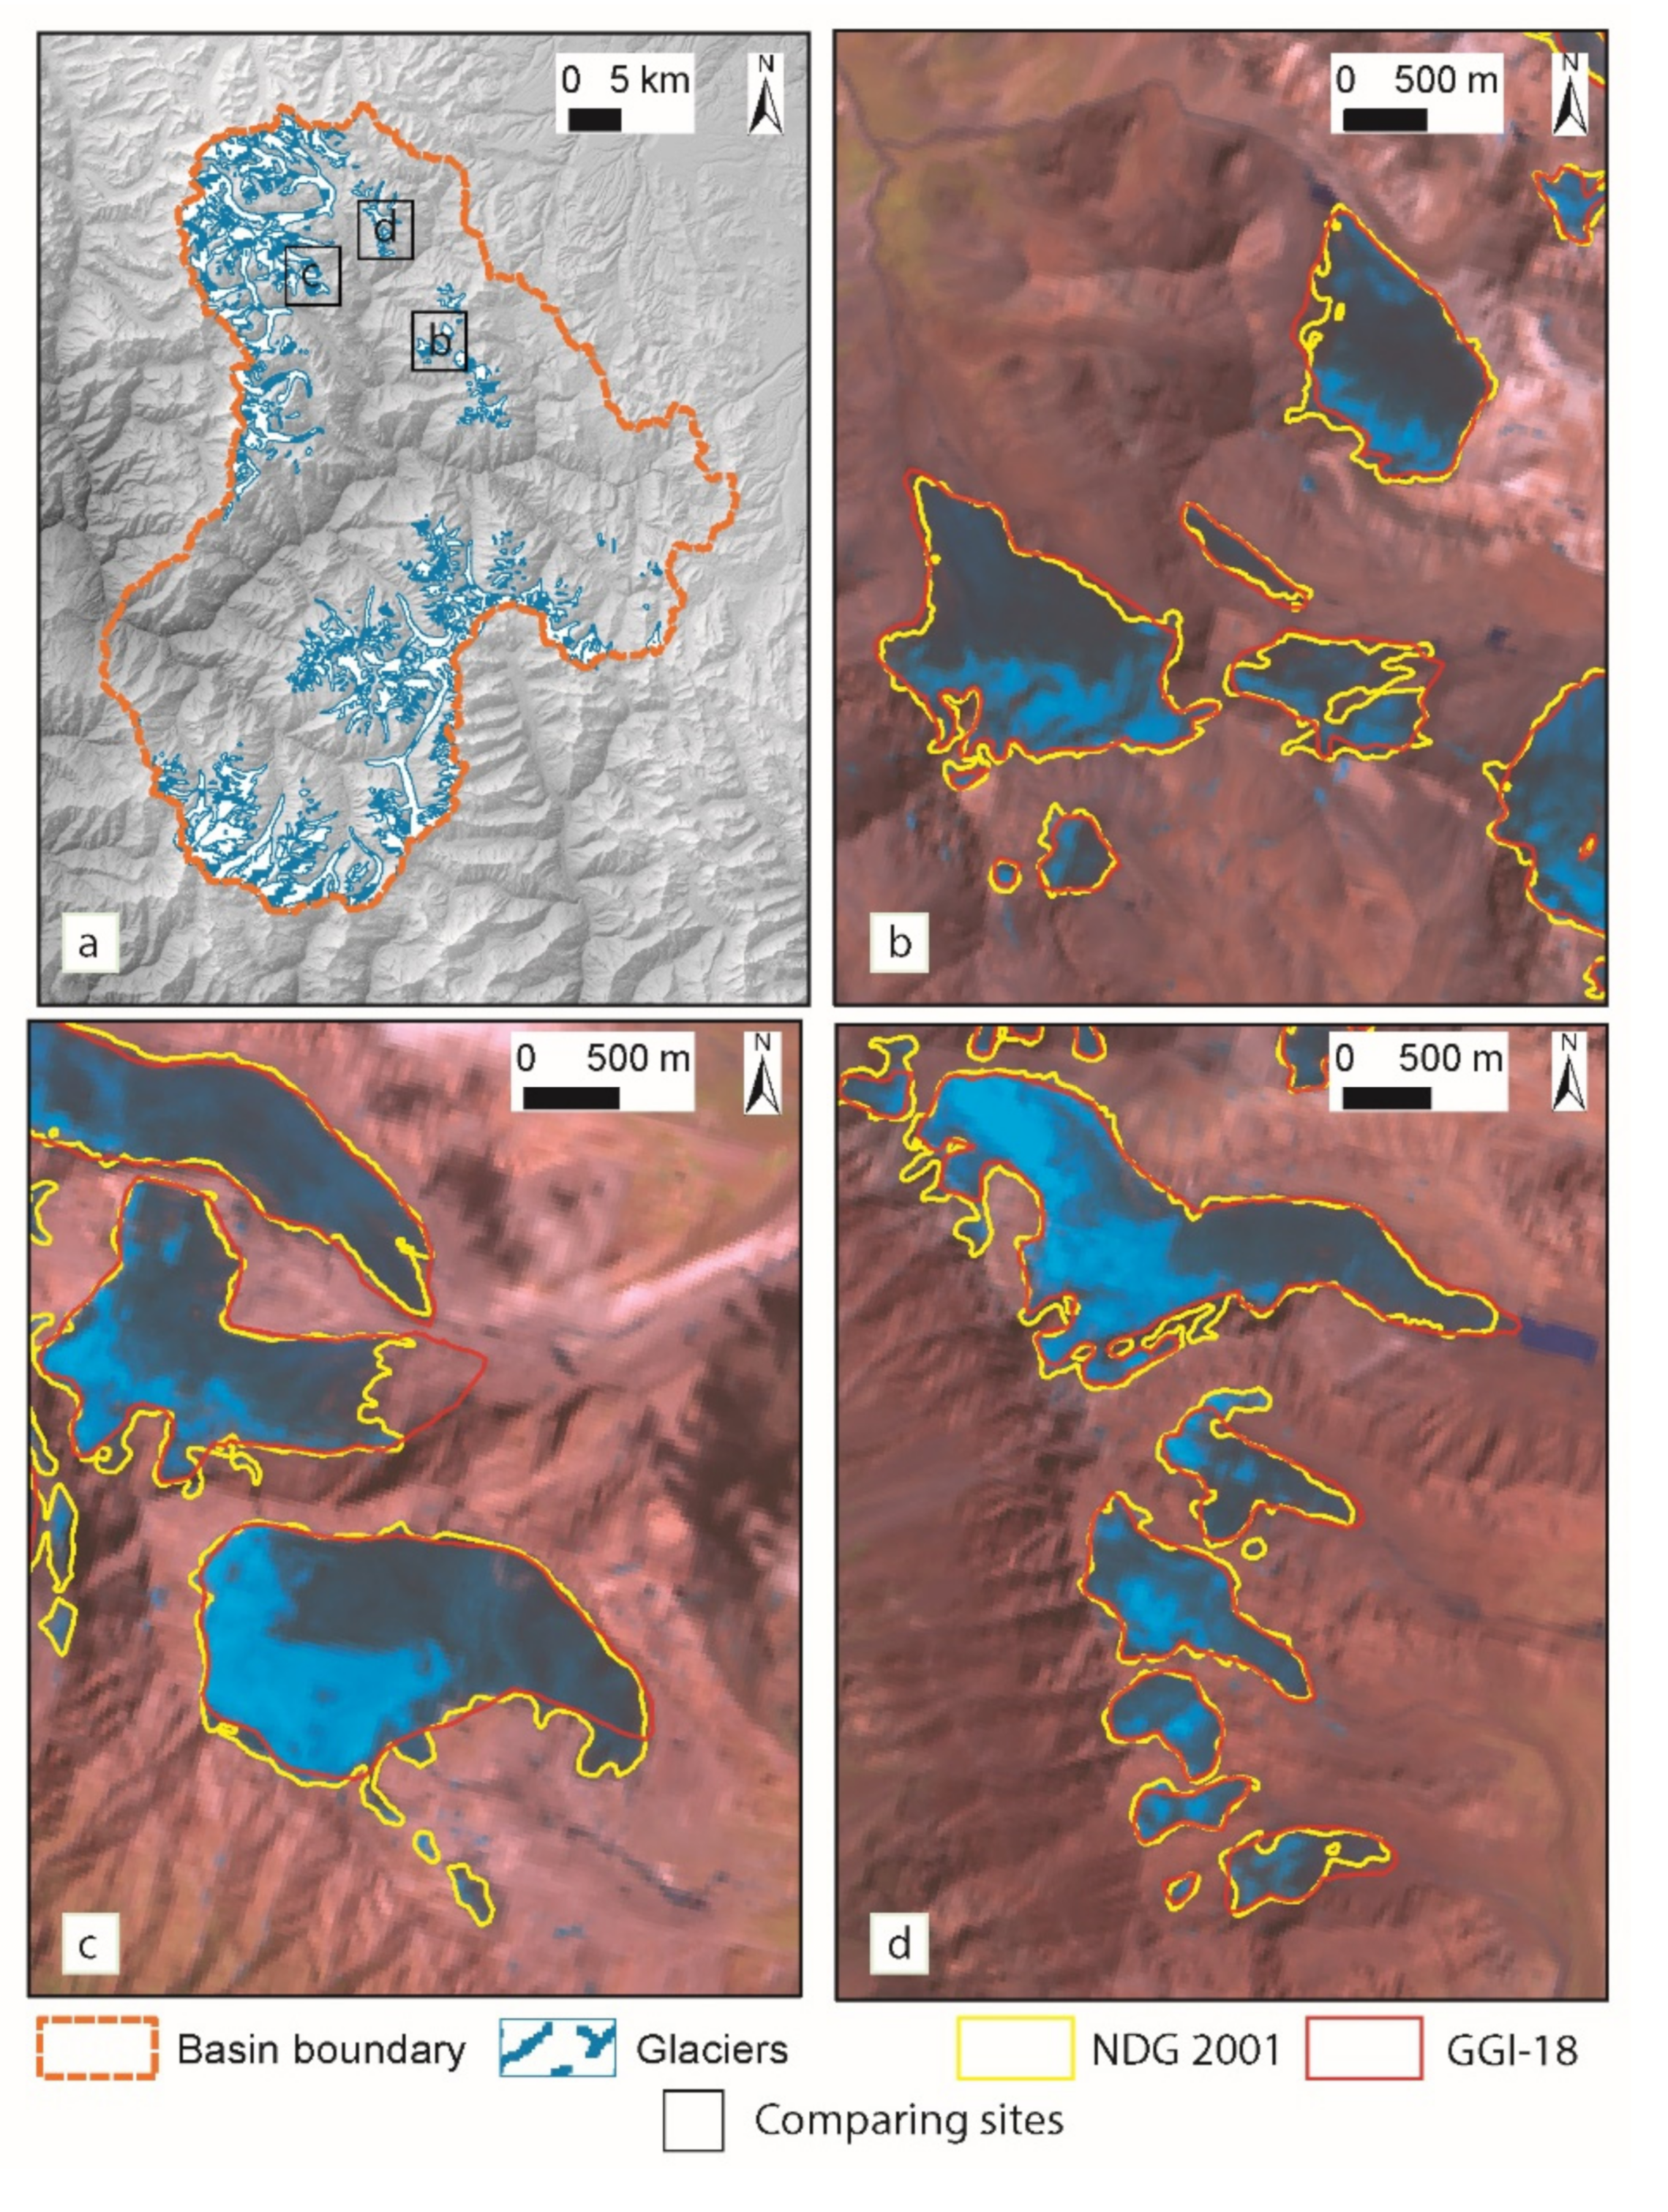
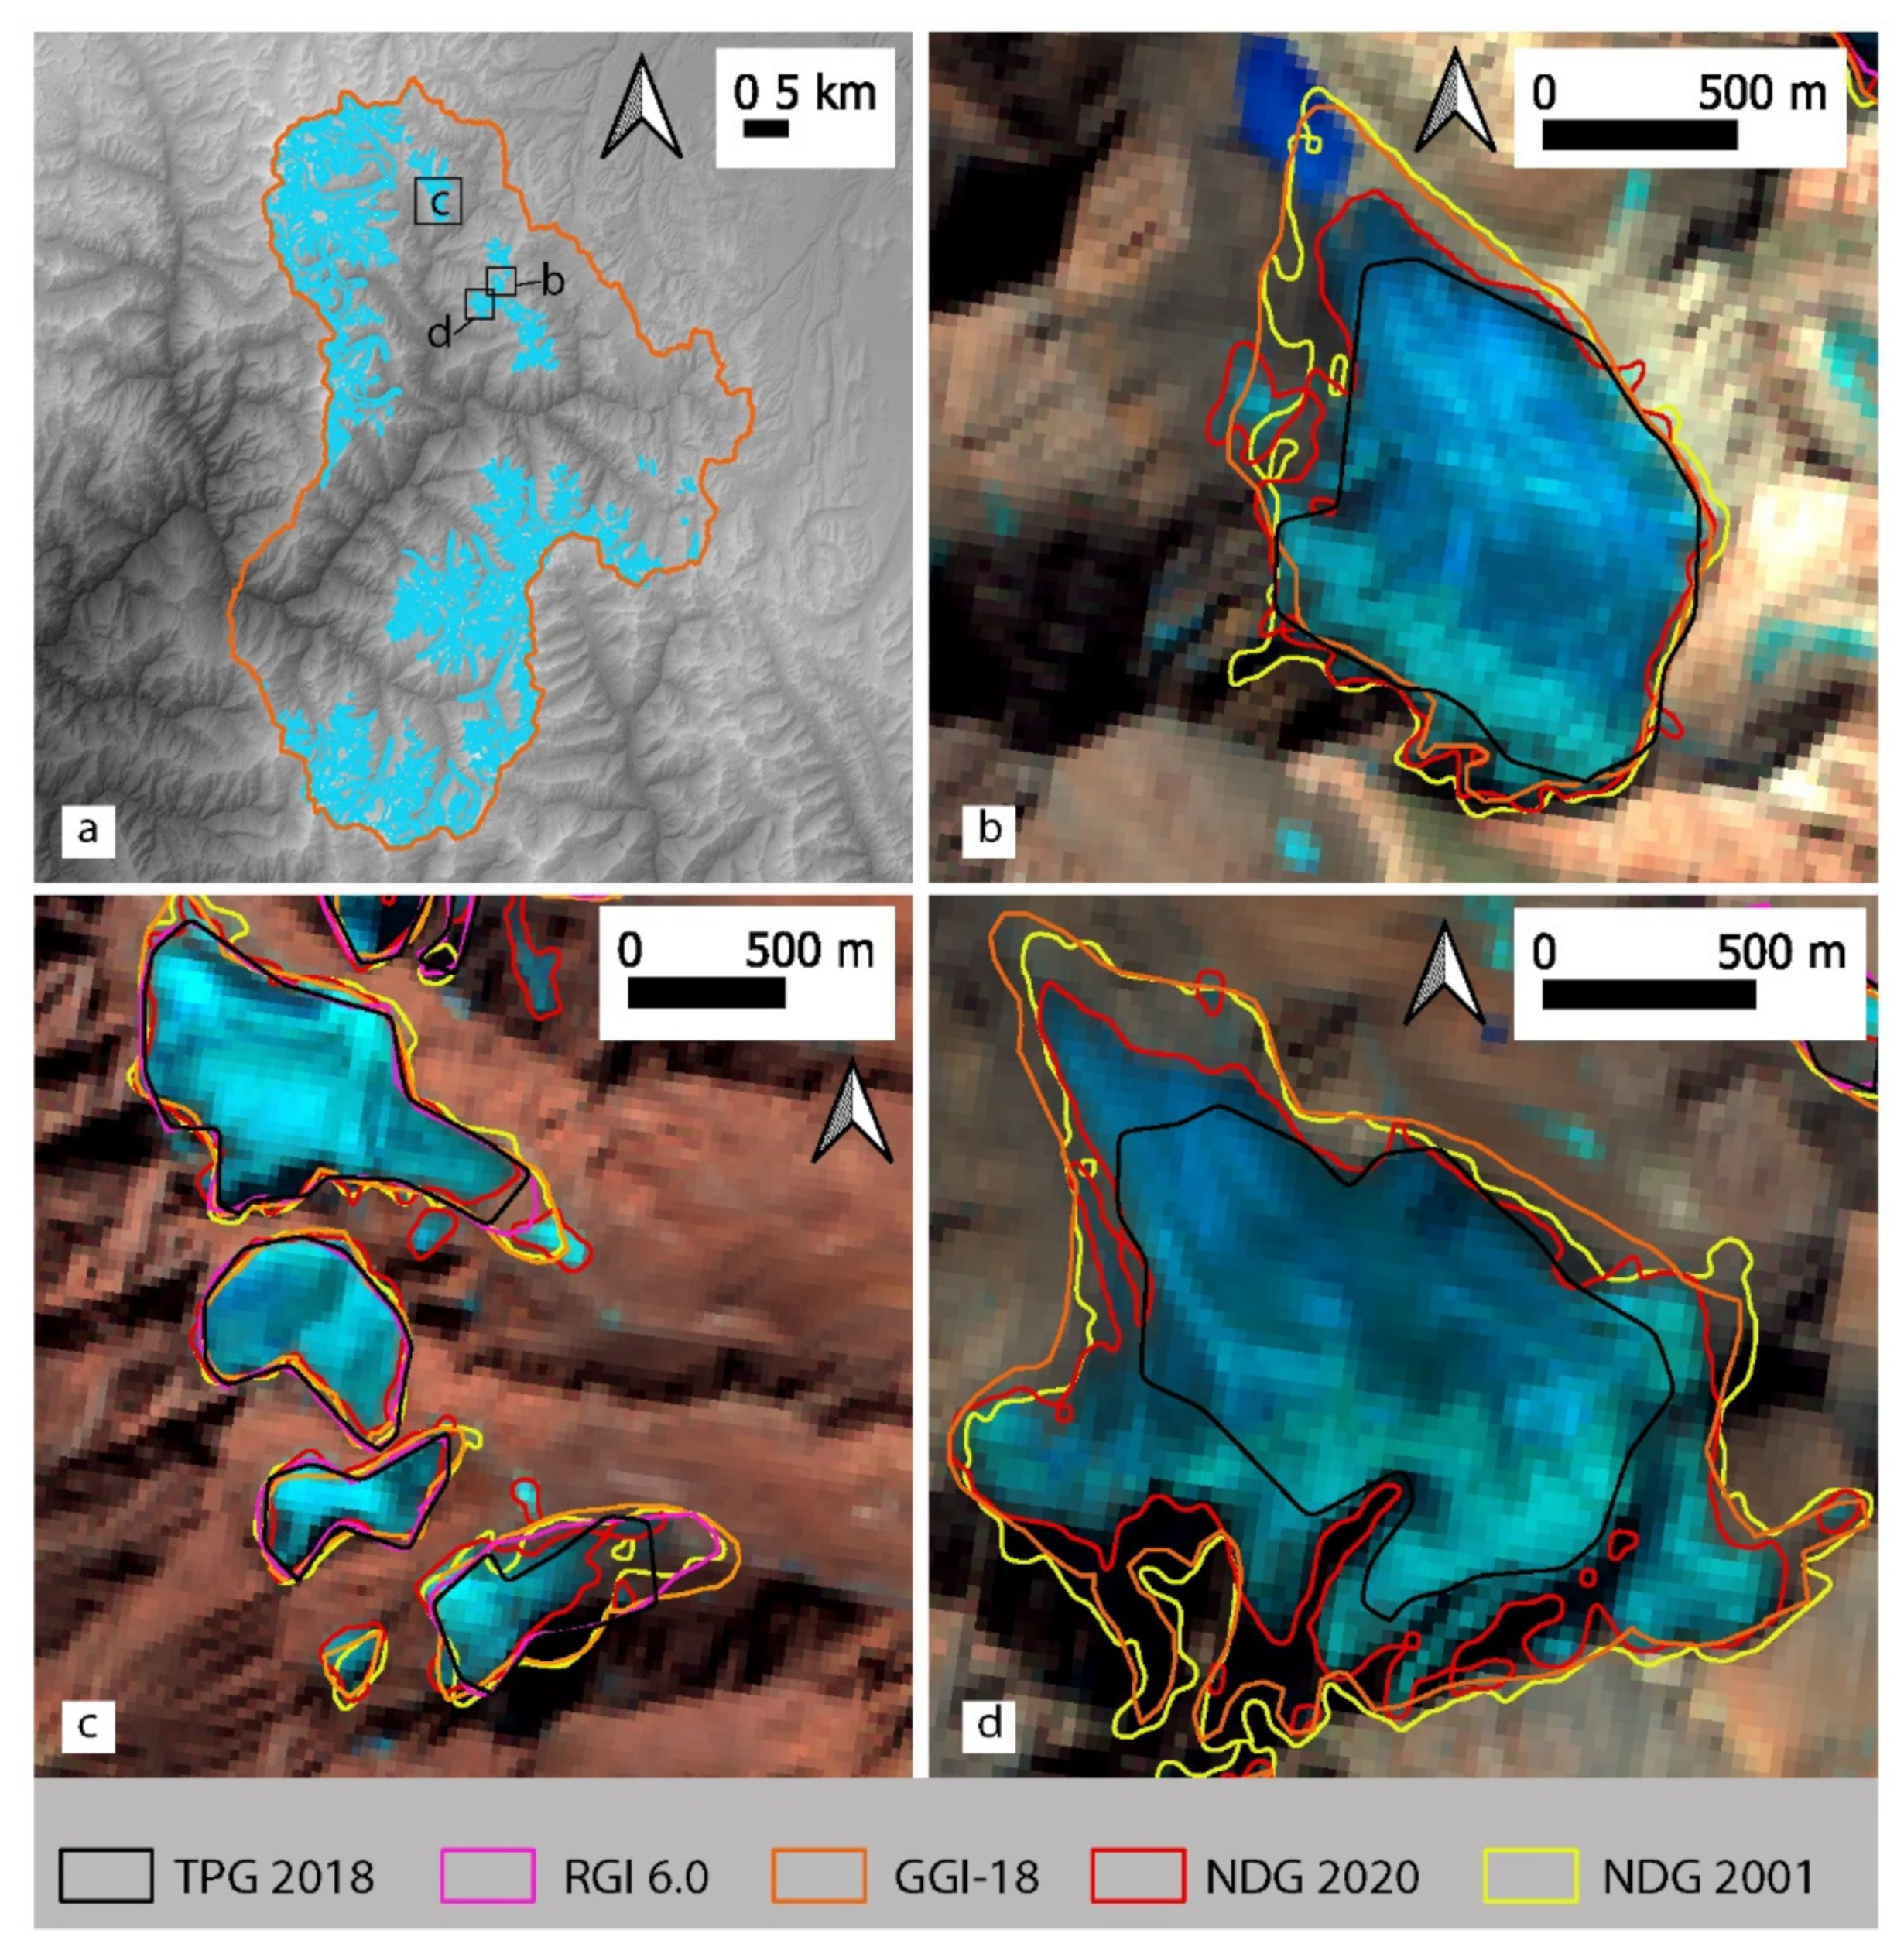
4.1.3. Comparison with Other Studies

| Specific Areas | Regions | Time Interval | Glacier Area Change (km2) | Glacier Area Change (%) | Glacier Area Change Rate (%a−1) | Source |
|---|---|---|---|---|---|---|
| Alps | Alps | 2003–2015/16 | –300 | –15% | –1.30% | [53] |
| Columbia Icefield | Canadian Rockies | 1985–2018 | –42.56 | –18% | –1.10% | [54] |
| Greater Caucasus | Greater Caucasus | 2000–2020 | –320.6 | –23.2% | −1.16% | [55] |
| Western Lenglongling Mountains | Northeastern Tibetan Plateau | 1972–2007 | –24.4 | –28.30% | –0.81% | [60] |
| Eastern Nyainqentanglha Range | Southeastern Tibetan Plateau | 1975–2013 | –3326.26 | –37.69% | –1.32% | [56] |
| Shyok basin, | East Karakoram | 1990–2014 | –7.8 | –0.19% | –0.01% | [57] |
| Hunza basin | Western Karakoram | 1973–2014 | –28.86 | –1.36% | –0.03% | [58] |
| Chandra, Bhaga, Miyar, & Parvati | Western Himalaya | 1971–2018 | –132.8 | –10.20% | –0.22% | [61] |
| Koshi River basin, Central Himalaya | Central Himalaya | 1976–2009 | –775.4 | –19.40% | –0.49% | [59] |
| Dhauliganga Catchment | Central Himalaya | 2001–2020 | –58.95 | –12.35% | –0.65% | This study |
4.2. Elevation Changes and Mass Balance
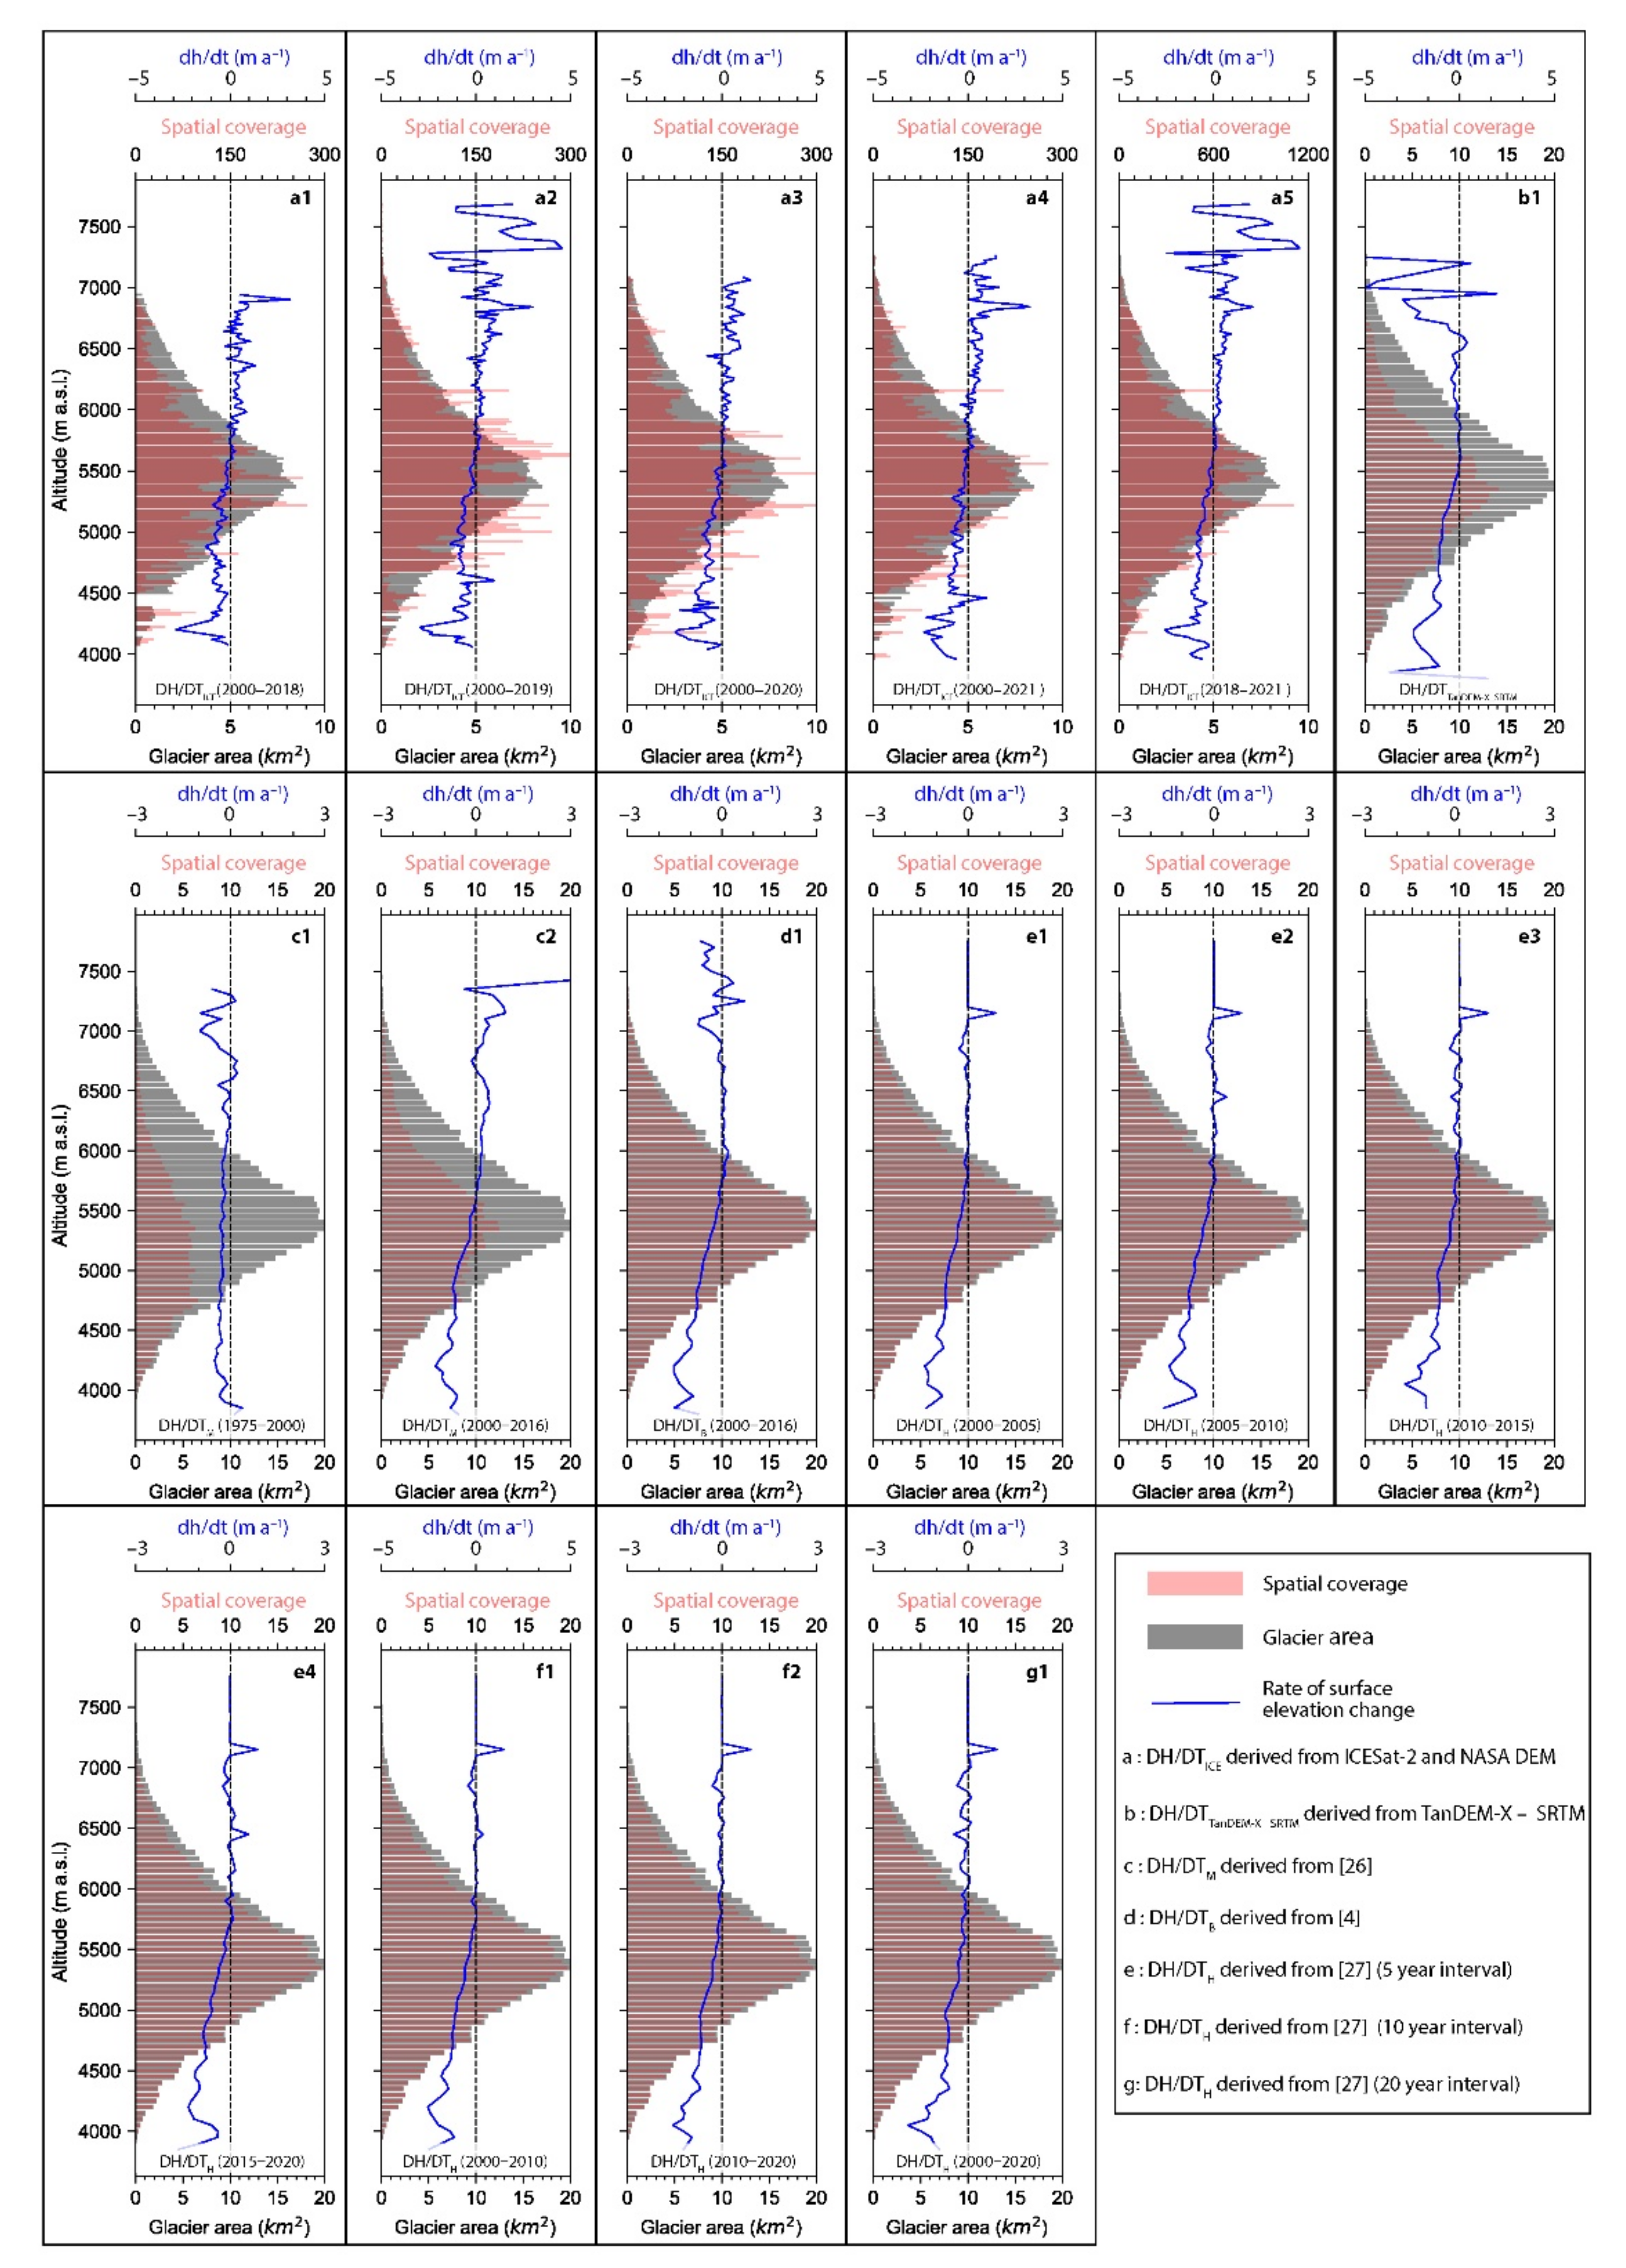
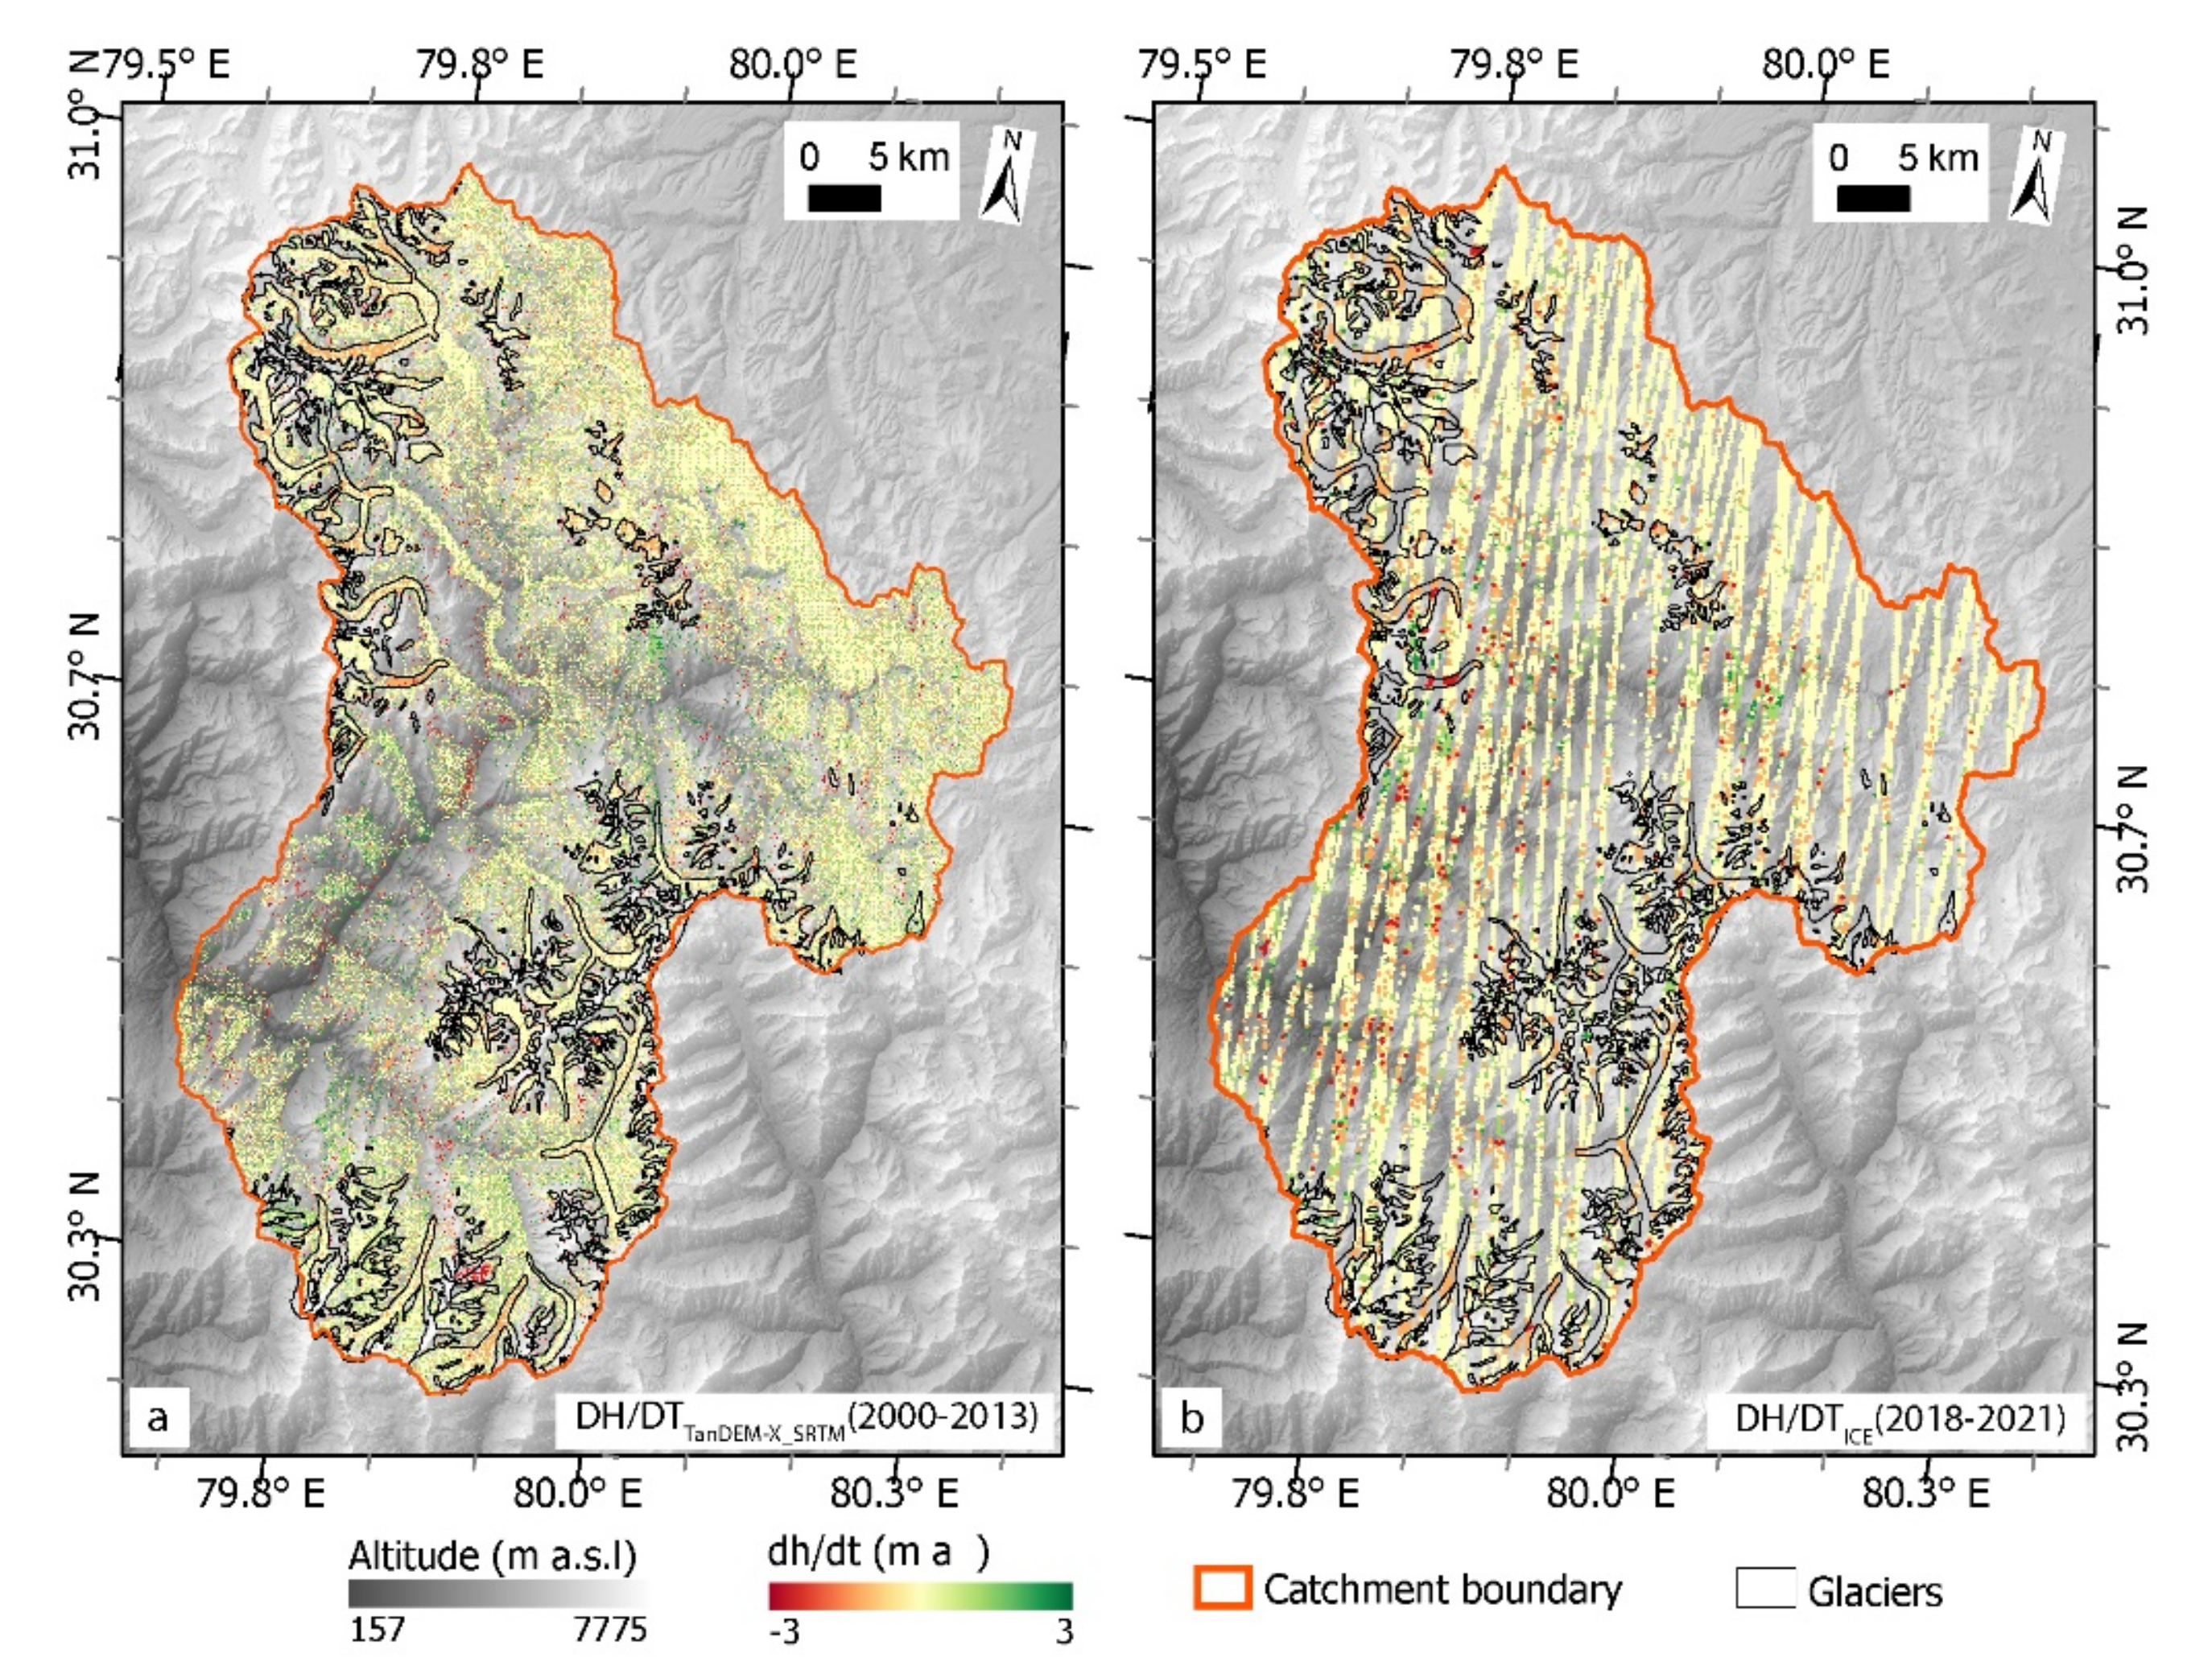
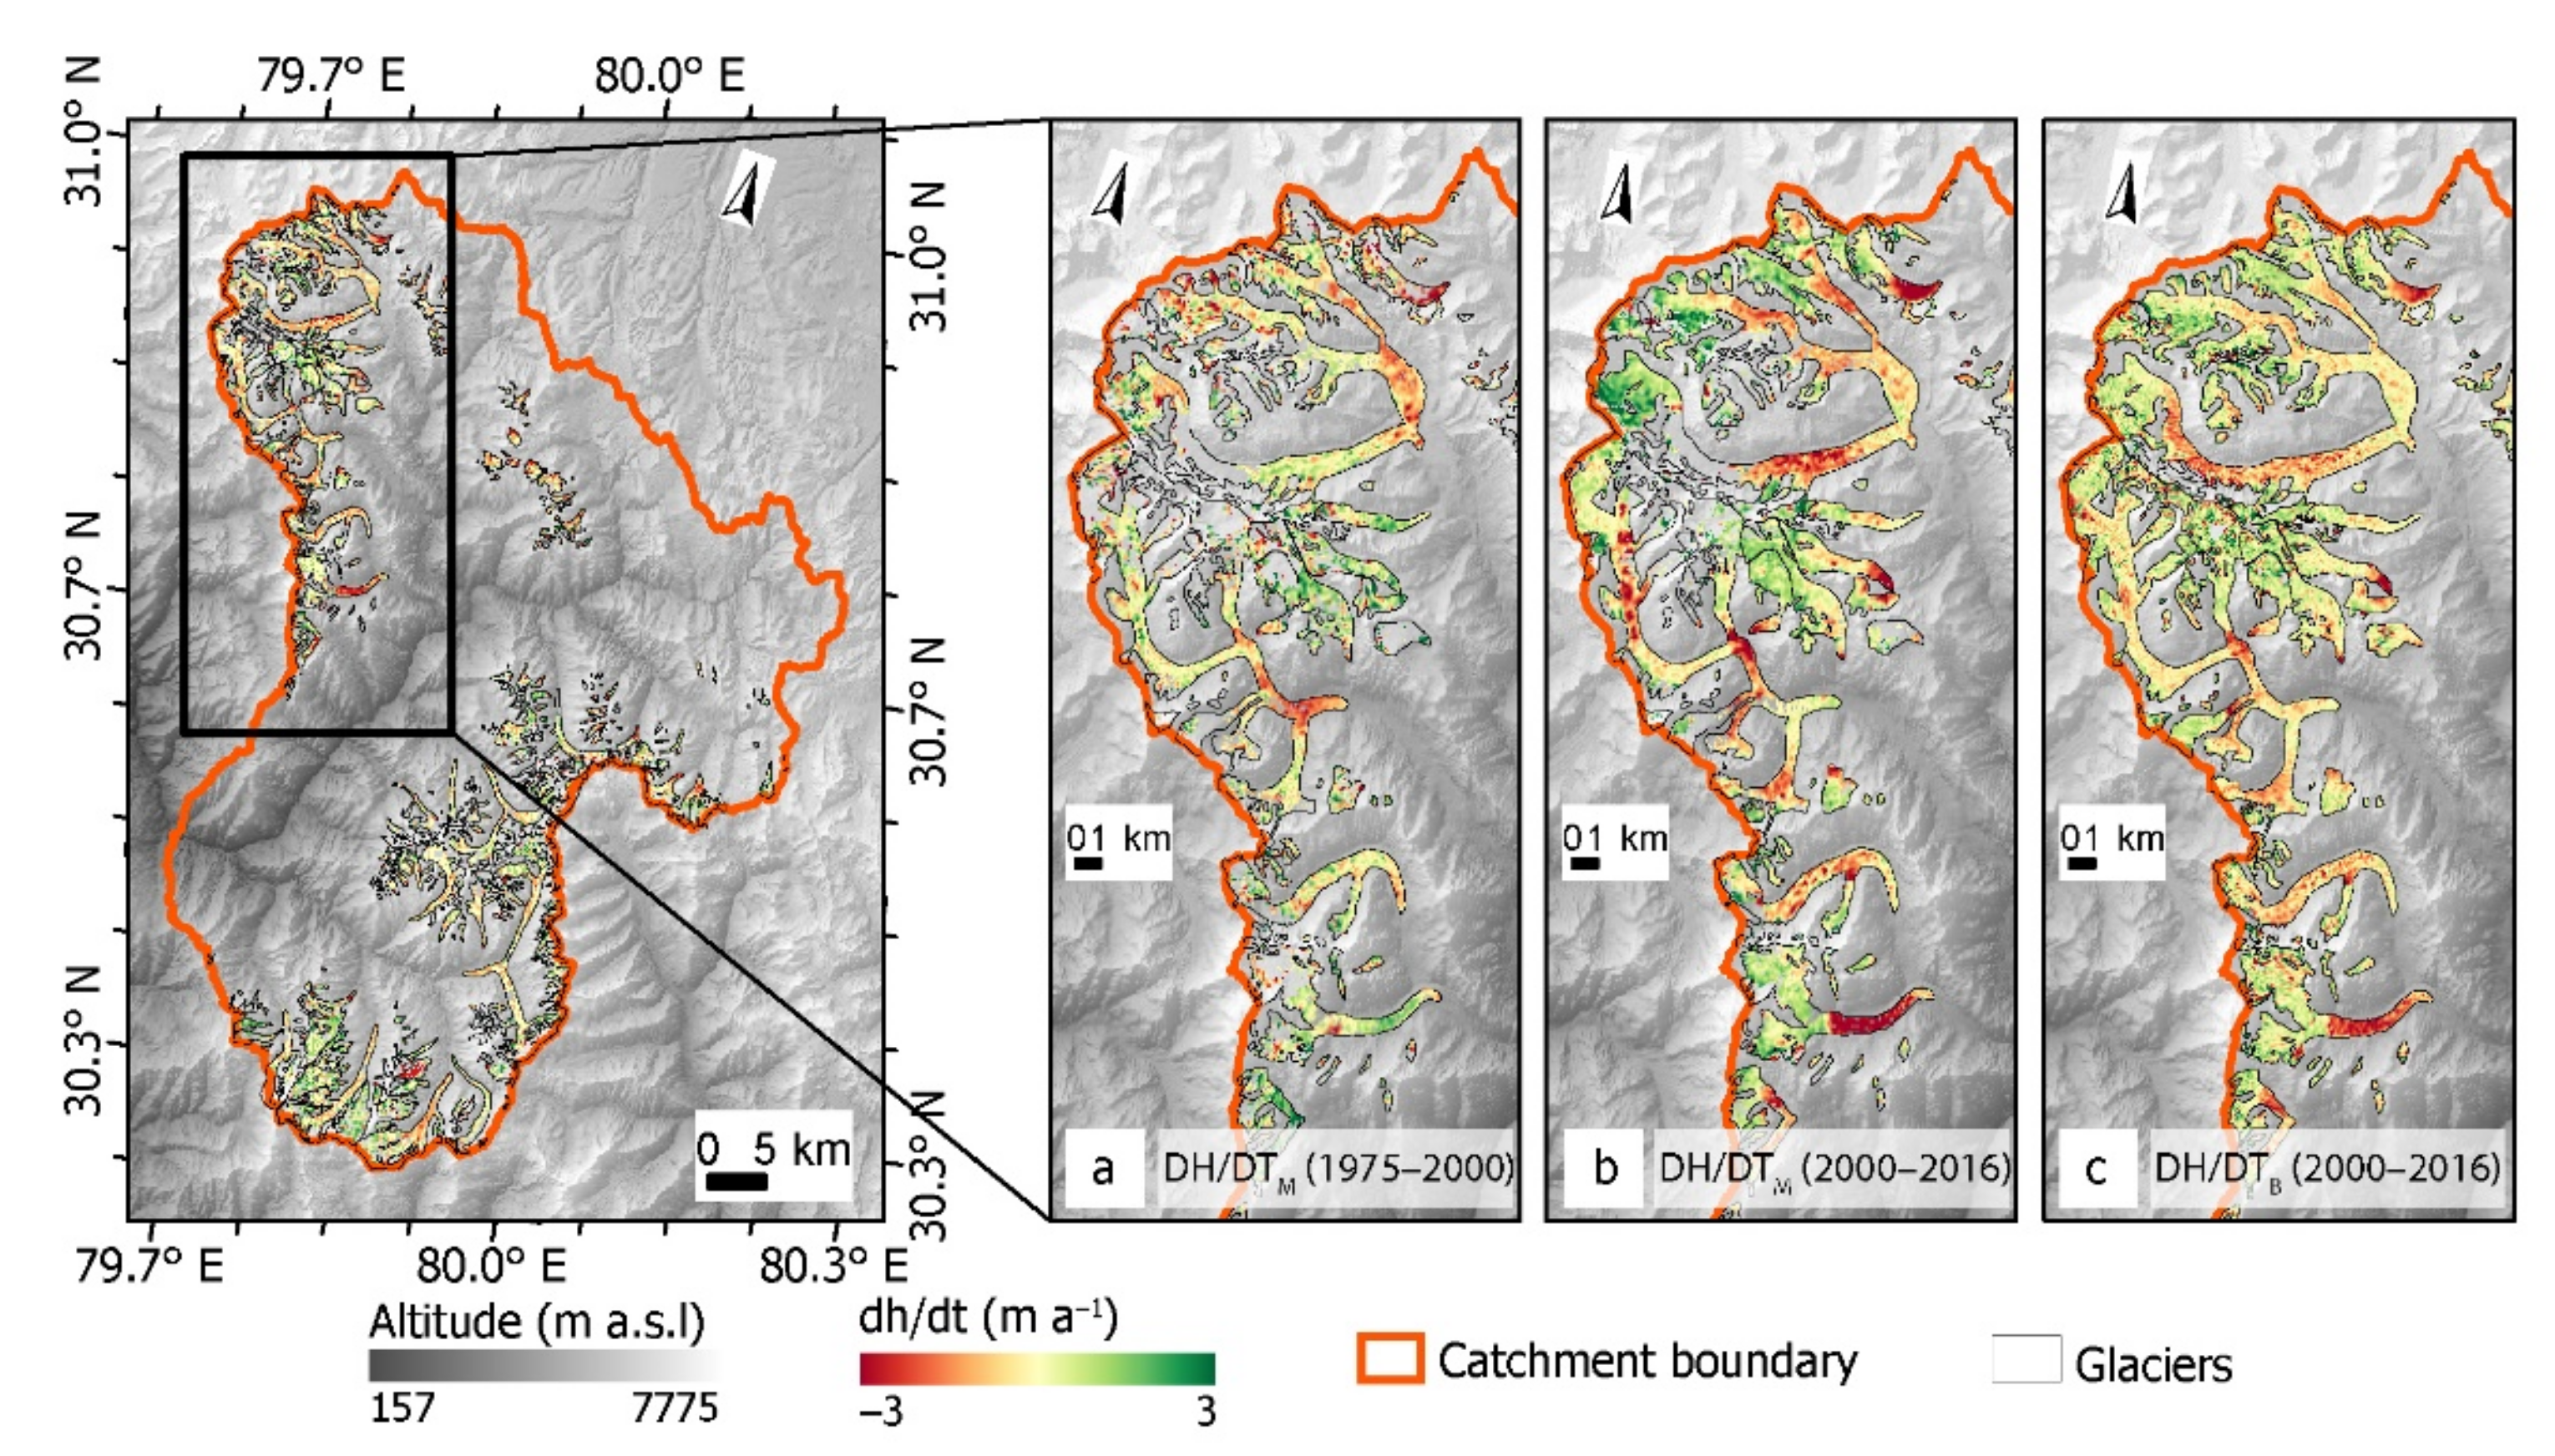
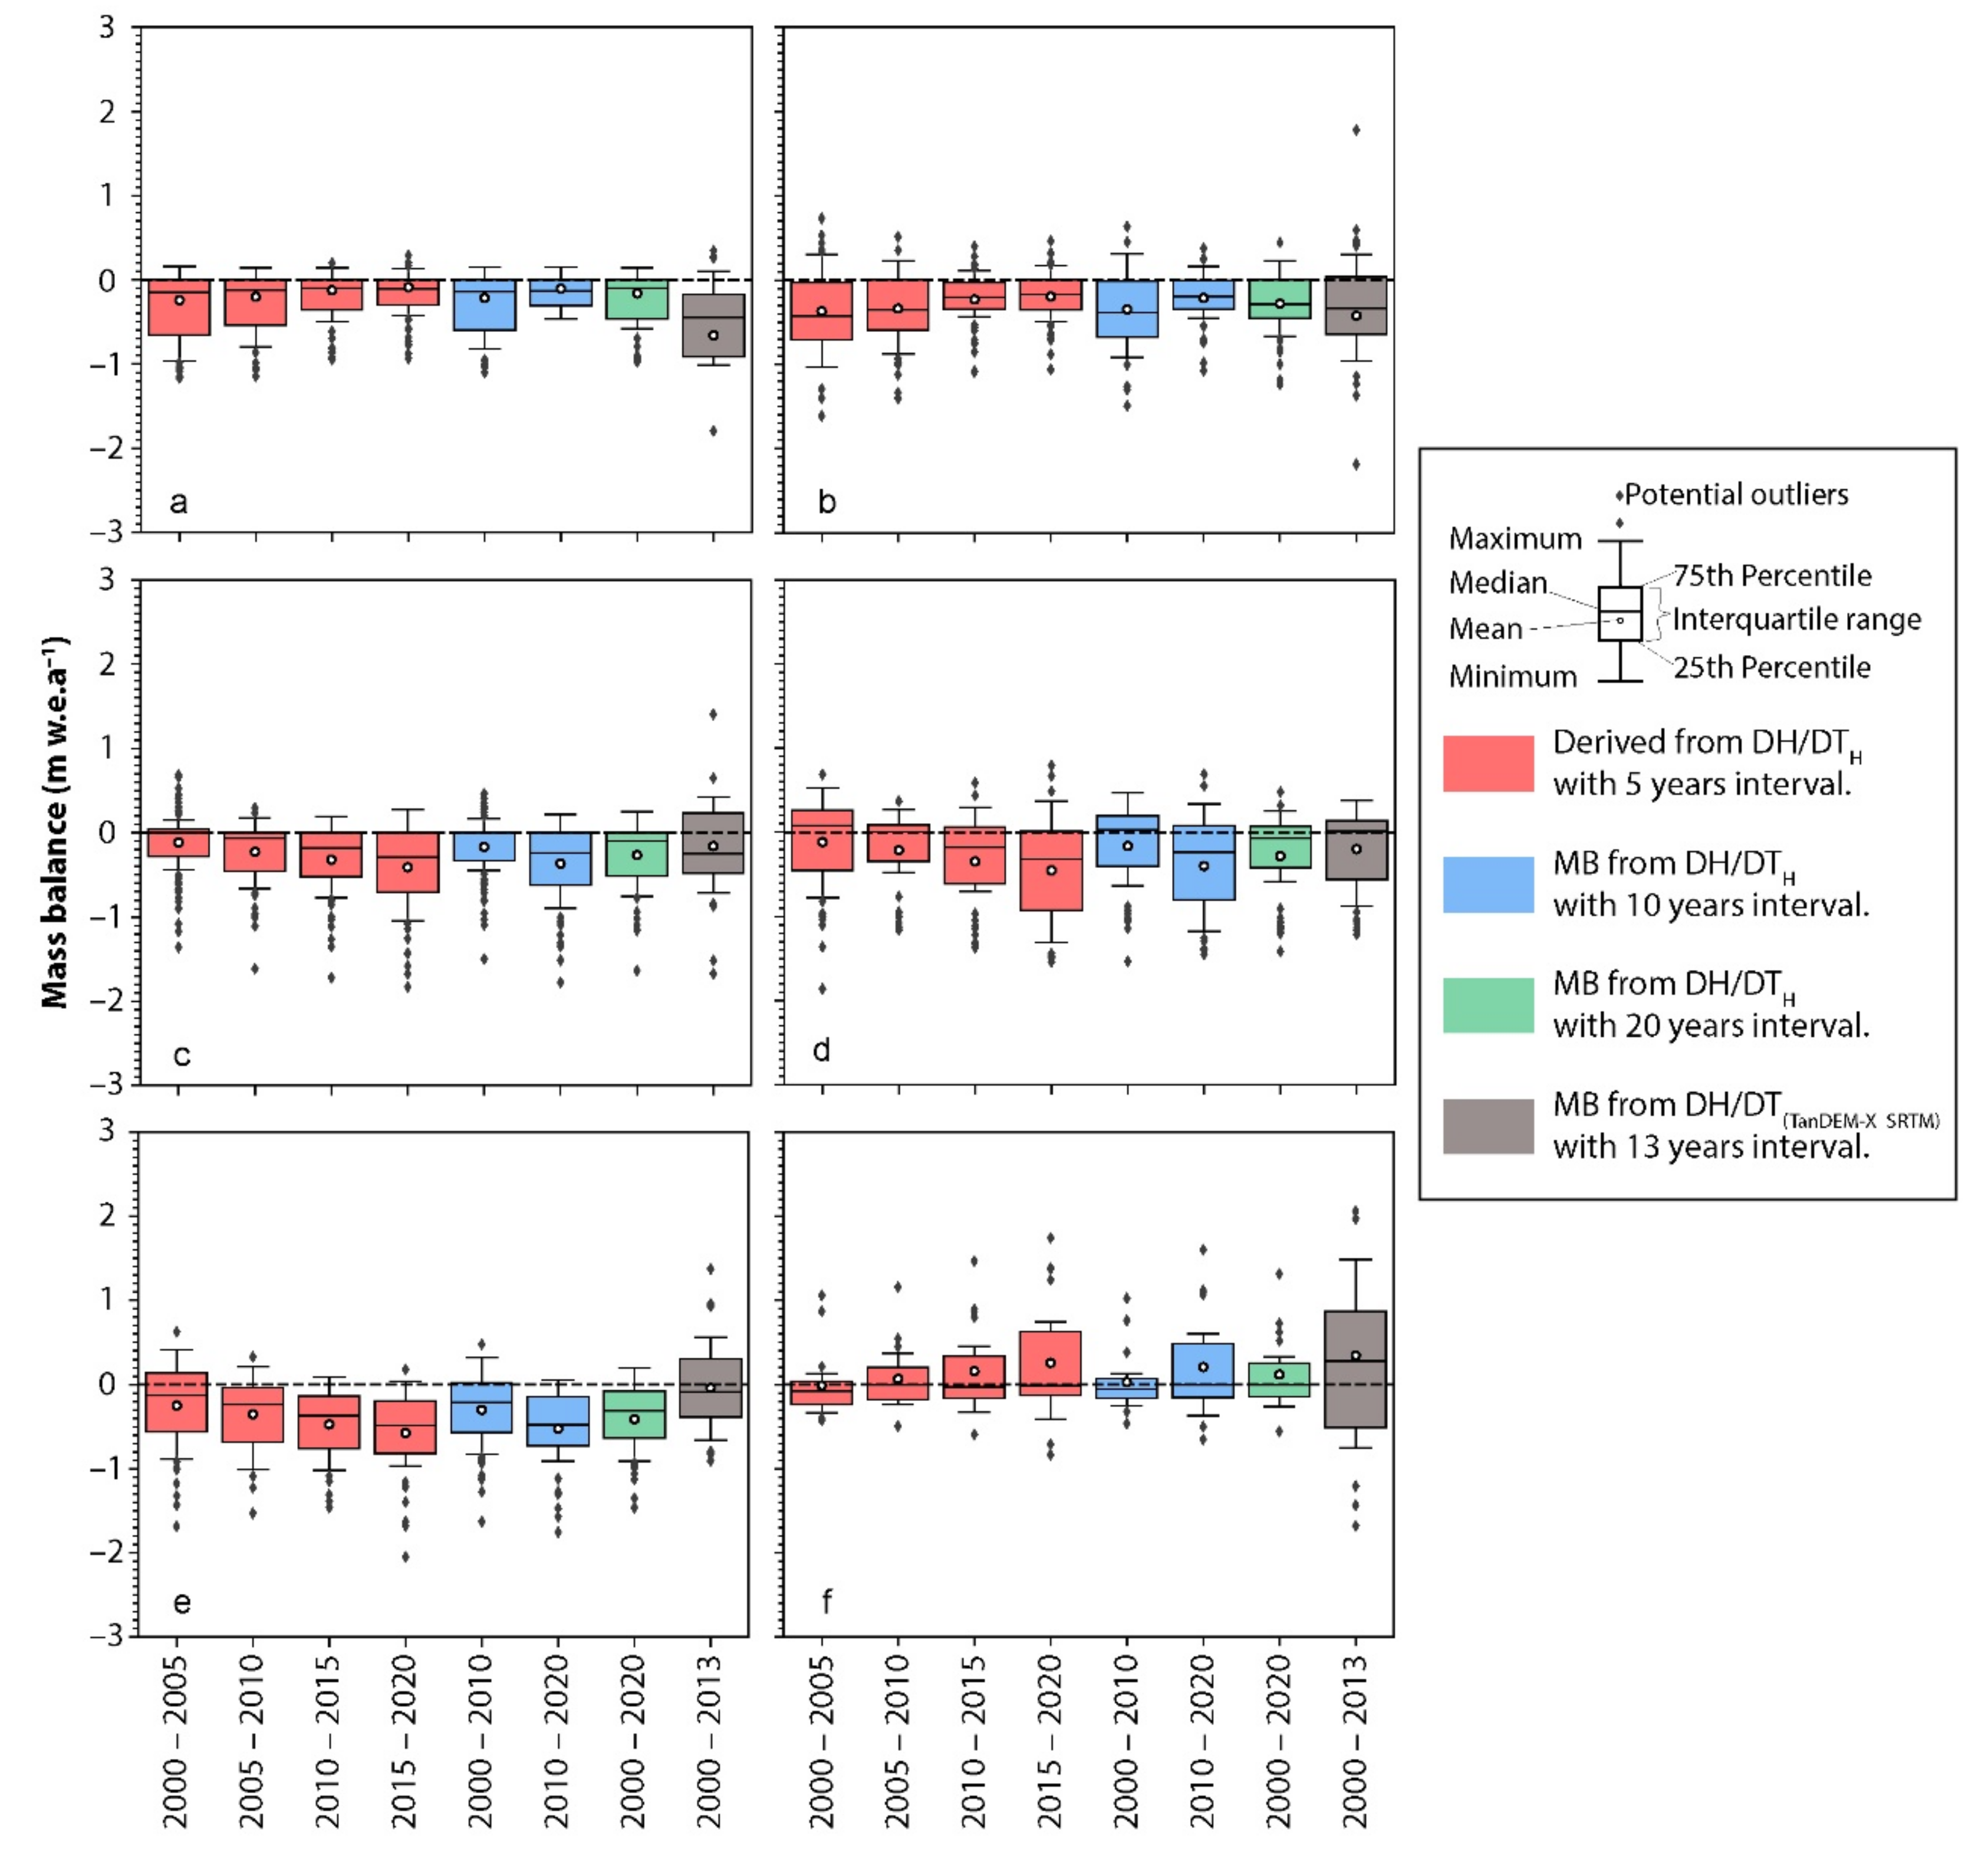
4.2.1. Elevation and Mass Balance Changes
4.2.2. Typical Individual Glacier Mass Balance
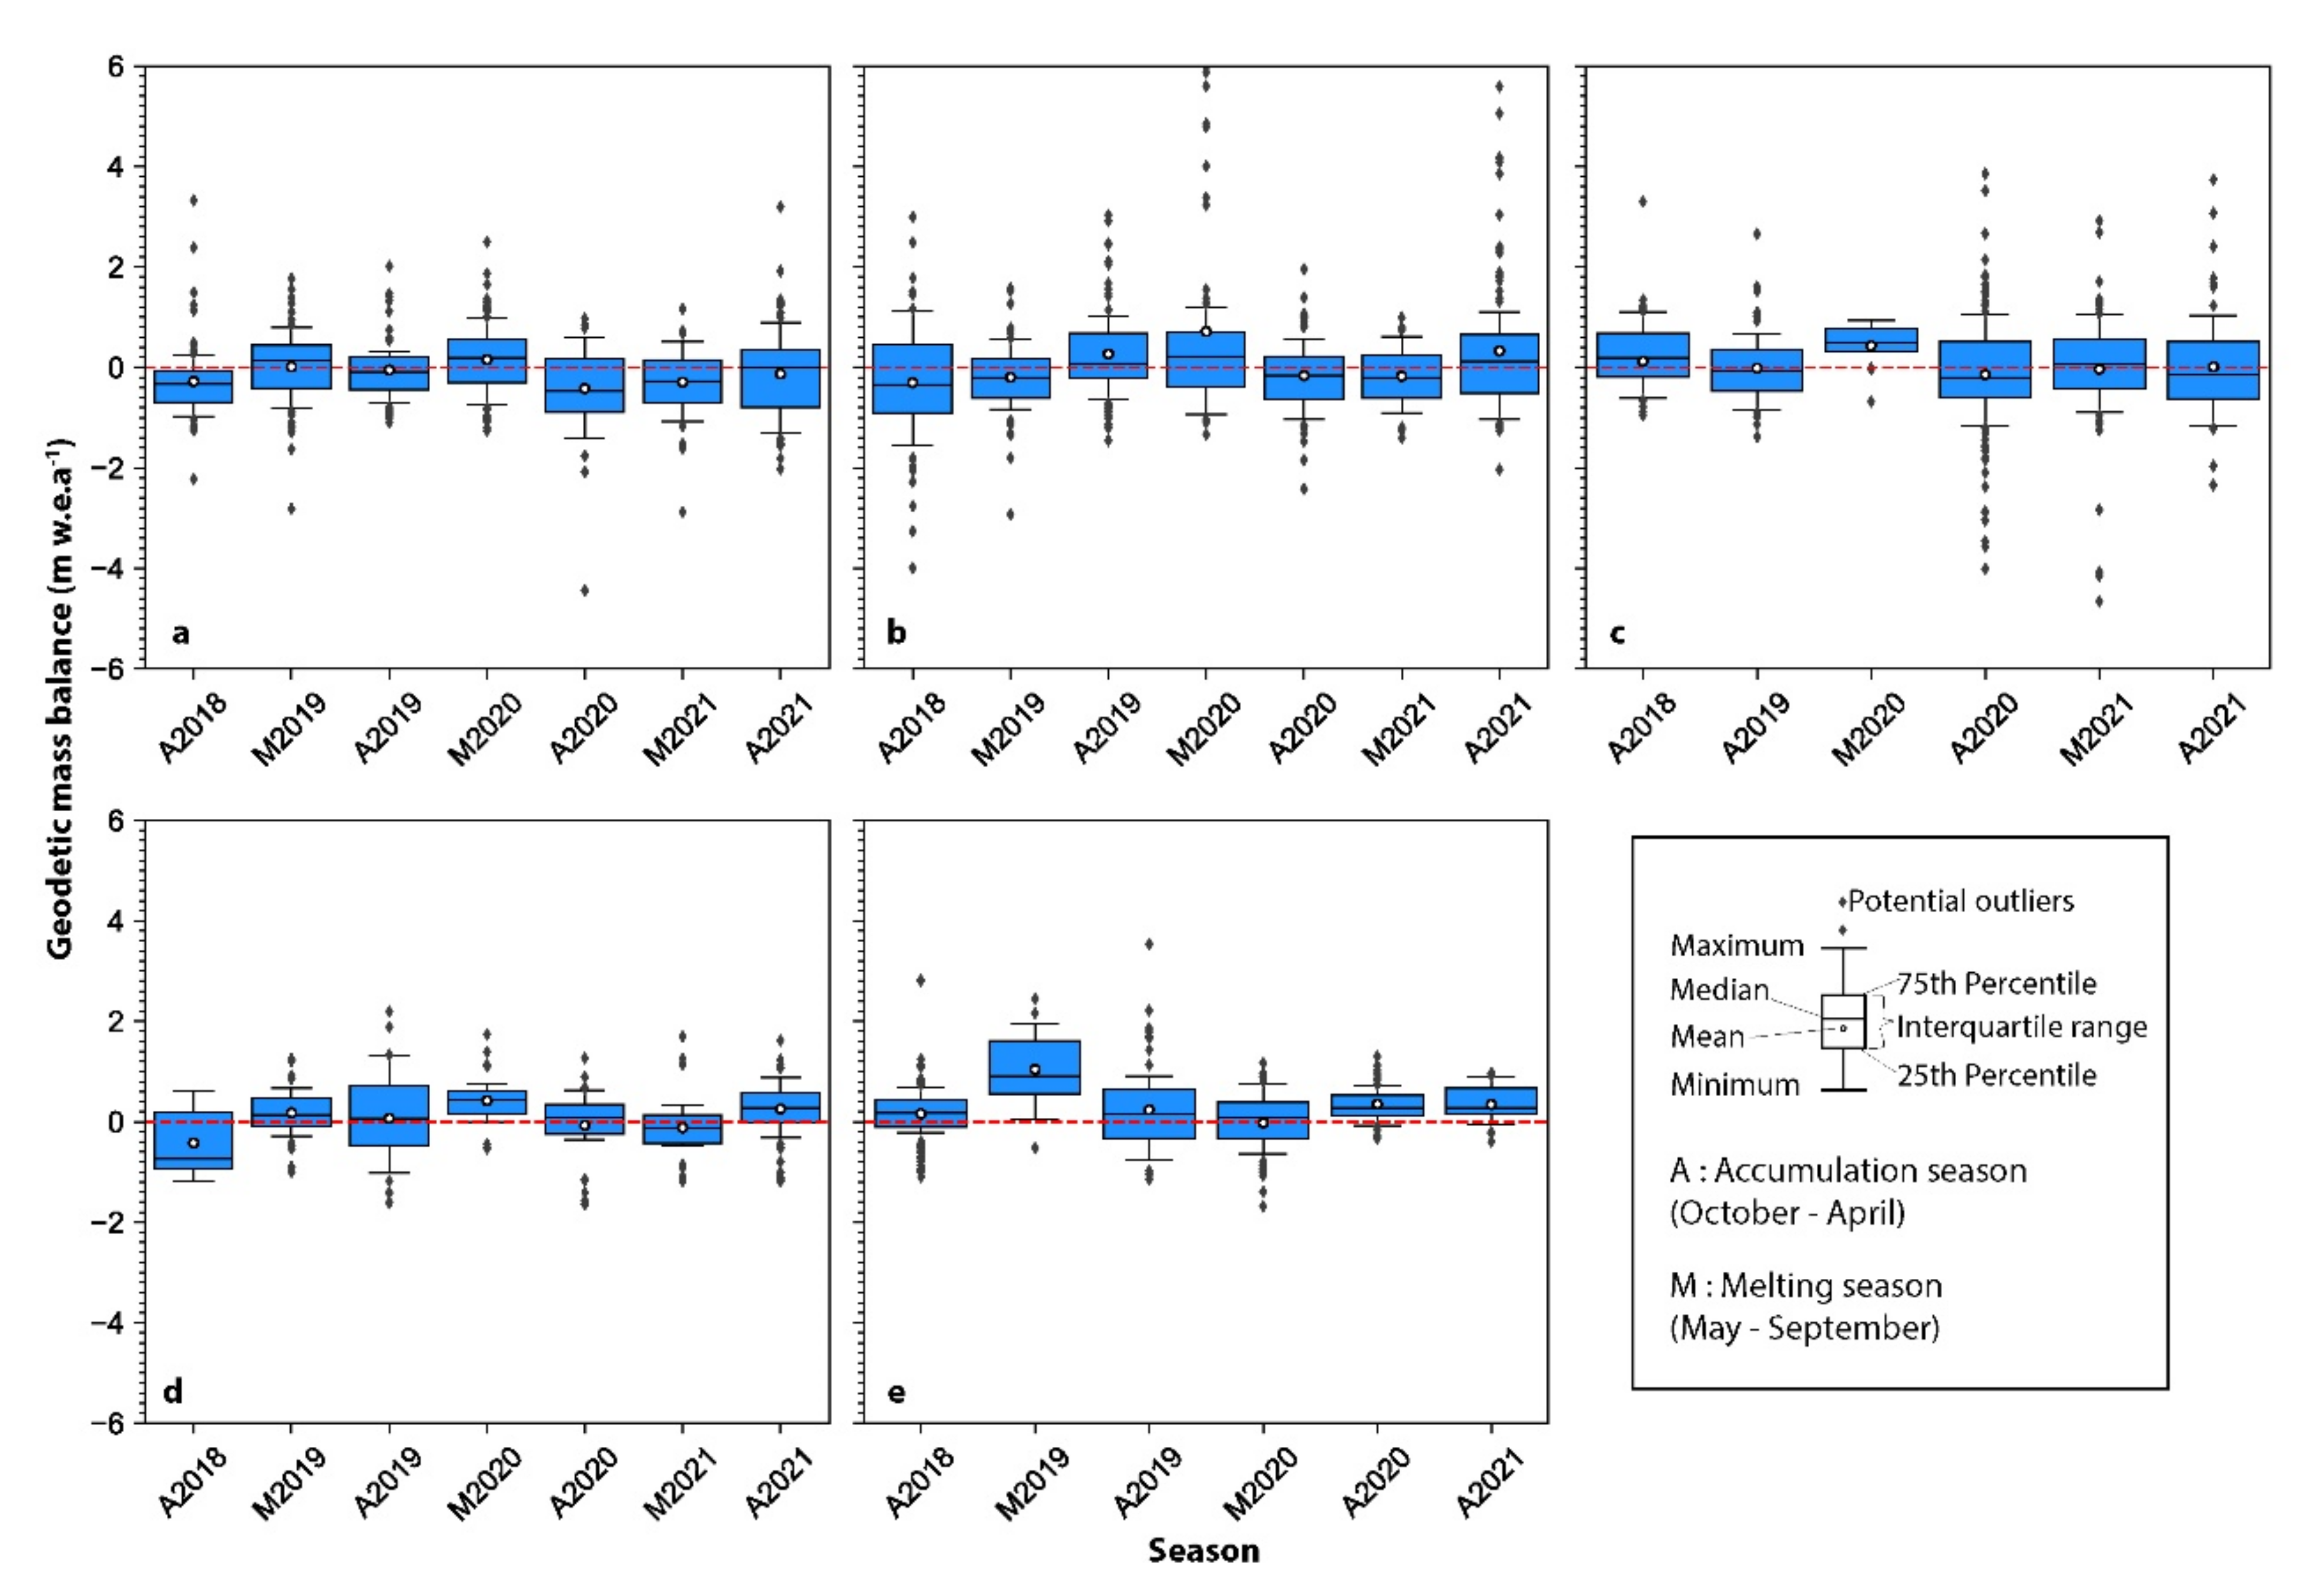
4.2.3. Seasonal Glacier Analysis of Selected Glaciers Based on ICESat-2
5. Conclusions
Supplementary Materials
Author Contributions
Funding
Data Availability Statement
Acknowledgments
Conflicts of Interest
References
- Consortium, R. Randolph Glacier Inventory—A Dataset of Global Glacier Outlines: Version 6.0: Technical Report, Global Land Ice Measurements from Space; RGI Consortium: Boulder, CO, USA, 2017. [Google Scholar]
- Yao, T.; Thompson, L.G.; Mosbrugger, V.; Zhang, F.; Ma, Y.; Luo, T.; Xu, B.; Yang, X.; Joswiak, D.R.; Wang, W.; et al. Third Pole Environment (TPE). Environ. Dev. 2012, 3, 52–64. [Google Scholar] [CrossRef]
- Ye, Q.; Zong, J.; Tian, L.; Cogley, J.G.; Song, C.; Guo, W. Glacier changes on the Tibetan Plateau derived from Landsat imagery: Mid-1970s–2000–13. J. Glaciol. 2017, 63, 273–287. [Google Scholar] [CrossRef] [Green Version]
- Brun, F.; Berthier, E.; Wagnon, P.; Kaab, A.; Treichler, D. A spatially resolved estimate of High Mountain Asia glacier mass balances from 2000 to 2016. Nat. Geosci. 2017, 10, 668–673. [Google Scholar] [CrossRef] [PubMed] [Green Version]
- Gardner, A.S.; Moholdt, G.; Cogley, J.G.; Wouters, B.; Arendt, A.A.; Wahr, J.; Berthier, E.; Hock, R.; Pfeffer, W.T.; Kaser, G.; et al. A Reconciled Estimate of Glacier Contributions to Sea Level Rise: 2003 to 2009. Science 2013, 340, 852–857. [Google Scholar] [CrossRef] [Green Version]
- Jakob, L.; Gourmelen, N.; Ewart, M.; Plummer, S. Spatially and temporally resolved ice loss in High Mountain Asia and the Gulf of Alaska observed by CryoSat-2 swath altimetry between 2010 and 2019. Cryosphere 2021, 15, 1845–1862. [Google Scholar] [CrossRef]
- Pritchard, H.D. Asia’s shrinking glaciers protect large populations from drought stress. Nature 2019, 569, 649–654. [Google Scholar] [CrossRef]
- Richardson, S.D.; Reynolds, J.M. An overview of glacial hazards in the Himalayas. Quatern. Int. 2000, 65, 31–47. [Google Scholar] [CrossRef]
- Guo, W.; Liu, S.; Xu, J.; Wu, L.; Shangguan, D.; Yao, X.; Wei, J.; Bao, W.; Yu, P.; Liu, Q.; et al. The second Chinese glacier inventory: Data, methods and results. J. Glaciol. 2017, 61, 357–372. [Google Scholar] [CrossRef] [Green Version]
- Nuimura, T.; Sakai, A.; Taniguchi, K.; Nagai, H.; Lamsal, D.; Tsutaki, S.; Kozawa, A.; Hoshina, Y.; Takenaka, S.; Omiya, S.; et al. The GAMDAM glacier inventory: A quality-controlled inventory of Asian glaciers. Cryosphere 2015, 9, 849–864. [Google Scholar] [CrossRef] [Green Version]
- Sakai, A. Brief communication: Updated GAMDAM glacier inventory over high-mountain Asia. Cryosphere 2019, 13, 2043–2049. [Google Scholar] [CrossRef]
- Shi, Y.; Liu, S.; Ye, B.; Liu, C.; Wang, Z. Concise Glacier Inventory of CHINA; Shanghai Popular Science Press: Shanghai, China, 2008; pp. 145–146. [Google Scholar]
- Sharma, A.; Singh, S.; Kulkarni, A. Glacier inventory in Indus, Ganga and Brahmaputra basins of the Himalaya. Natl. Acad. Sci. Lett. 2013, 36, 497–505. [Google Scholar] [CrossRef]
- Bolch, T.; Kulkarni, A.; Kaab, A.; Huggel, C.; Paul, F.; Cogley, J.G.; Frey, H.; Kargel, J.S.; Fujita, K.; Scheel, M.; et al. The State and Fate of Himalayan Glaciers. Science 2012, 336, 310–314. [Google Scholar] [CrossRef] [Green Version]
- Jacob, T.; Wahr, J.; Pfeffer, W.T.; Swenson, S. Recent contributions of glaciers and ice caps to sea level rise. Nature 2012, 482, 514–518. [Google Scholar] [CrossRef]
- Wang, Q.; Yi, S.; Sun, W. Continuous Estimates of Glacier Mass Balance in High Mountain Asia Based on ICESat-1,2 and GRACE/GRACE Follow-On Data. Geophys. Res. Lett. 2021, 48, e2020GL090954. [Google Scholar] [CrossRef]
- Maurer, J.; Schaefer, J.; Rupper, S.; Corley, A. Acceleration of ice loss across the Himalayas over the past 40 years. Sci. Adv. 2019, 5, eaav7266. [Google Scholar] [CrossRef] [Green Version]
- Kääb, A.; Treichler, D.; Nuth, C.; Berthier, E. Brief Communication: Contending estimates of 2003–2008 glacier mass balance over the Pamir–Karakoram–Himalaya. Cryosphere 2015, 9, 557–564. [Google Scholar] [CrossRef] [Green Version]
- Hock, R.; Rasul, G.; Adler, C.; Cáceres, B.; Gruber, S.; Hirabayashi, Y.; Jackson, M.; Kääb, A.; Kang, S.; Kutuzov, S. High mountain areas. In IPCC Special Report on the Ocean and Cryosphere in a Changing Climate; Intergovernmental Panel on Climate Change: Geneva, Switzerland, 2019. [Google Scholar]
- Mishra, A. Changing Climate of Uttarakhand, India. J. Geol. Geosci. 2014, 3. [Google Scholar] [CrossRef]
- Pandey, P.; Chauhan, P.; Bhatt, C.M.; Thakur, P.K.; Kannaujia, S.; Dhote, P.R.; Roy, A.; Kumar, S.; Chopra, S.; Bhardwaj, A.; et al. Cause and Process Mechanism of Rockslide Triggered Flood Event in Rishiganga and Dhauliganga River Valleys, Chamoli, Uttarakhand, India Using Satellite Remote Sensing and in situ Observations. J. Indian Soc. Remote 2021, 49, 1011–1024. [Google Scholar] [CrossRef]
- Shugar, D.H.; Jacquemart, M.; Shean, D.; Bhushan, S.; Upadhyay, K.; Sattar, A.; Schwanghart, W.; McBride, S.; Vries, M.V.W.d.; Mergili, M.; et al. A massive rock and ice avalanche caused the 2021 disaster at Chamoli, Indian Himalaya. Science 2021, 373, 300–306. [Google Scholar] [CrossRef]
- Shrestha, A.B.; Steiner, J.; Nepal, S.; Maharjan, S.B.; Jackson, M.; Rasul, G.; Bajracharya, B. Understanding the Chamoli flood: Cause, Process, Impacts, and Context of Rapid Infrastructure Development. Available online: https://www.icimod.org/article/understanding-the-chamoli-flood-cause-process-impacts-and-context-of-rapid-infrastructure-development/?utm_source=Cryosphere&utm_campaign=163e11156b-EMAIL_CAMPAIGN_2020_02_14_10_15_COPY_01&utm_medium=email&utm_term=0_d17c66005e-163e11156b-98079682 (accessed on 22 February 2022).
- Kumar, V.; Shukla, T.; Mehta, M.; Dobhal, D.P.; Bisht, M.P.S.; Nautiyal, S. Glacier changes and associated climate drivers for the last three decades, Nanda Devi region, Central Himalaya, India. Quatern. Int. 2021, 575, 213–226. [Google Scholar] [CrossRef]
- Raj, K.B.G.; Kumar, K.V. Inventory of Glacial Lakes and its Evolution in Uttarakhand Himalaya Using Time Series Satellite Data. J. Indian Soc. Remote 2016, 44, 959–976. [Google Scholar] [CrossRef]
- Maurer, J.; Rupper, S.; Schaefer, J. High Mountain Asia Gridded Glacier Thickness Change from Multi-Sensor DEMs. NASA National Snow and Ice Data Center Distributed Active Archive Center, Version 1; National Snow and Ice Data Center: Boulder, CO, USA, 2018. [Google Scholar] [CrossRef]
- Hugonnet, R.; McNabb, R.; Berthier, E.; Menounos, B.; Nuth, C.; Girod, L.; Farinotti, D.; Huss, M.; Dussaillant, I.; Brun, F.; et al. Accelerated global glacier mass loss in the early twenty-first century. Nature 2021, 592, 726–731. [Google Scholar] [CrossRef] [PubMed]
- Muñoz Sabater, J. ERA5-Land Monthly Averaged Data From 1981 to Present; Copernicus Climate Change Service (C3S), Climate Data Store (CDS): Frascati, Italy, 2019. [Google Scholar]
- Muñoz Sabater, J. ERA5-Land Monthly Averaged Data from 1950 to 1980; Copernicus Climate Change Service (C3S), Climate Data Store (CDS): Frascati, Italy, 2021. [Google Scholar]
- NASA, Earth Data. NASADEM Merged DEM Global 1 arc Second V001; NASA: Washington, DC, USA, 2020. [Google Scholar]
- Lachaise, M.; Bachmann, M.; Fritz, T.; Huber, M.; Schweißhelm, B.; Wessel, B. The TanDEM-X Change DEM: The New Temporal DEM of the TanDEM-X Mission. In Proceedings of the 13th European Conference on Synthetic Aperture Radar, online, 29 March 2021–1 April 2021. [Google Scholar]
- Wessel, B.; Huber, M.; Wohlfart, C.; Marschalk, U.; Kosmann, D.; Roth, A. Accuracy assessment of the global TanDEM-X Digital Elevation Model with GPS data. ISPRS J. Photogramm. Remote Sens. 2018, 139, 171–182. [Google Scholar] [CrossRef]
- Farr, T.G.; Rosen, P.A.; Caro, E.; Crippen, R.; Duren, R.; Hensley, S.; Kobrick, M.; Paller, M.; Rodriguez, E.; Roth, L.; et al. The Shuttle Radar Topography Mission. Rev. Geophys. 2007, 45. [Google Scholar] [CrossRef] [Green Version]
- Werner, M. Shuttle radar topography mission (SRTM) mission overview. Frequenz 2001, 55, 75–79. [Google Scholar] [CrossRef]
- Brunt, K.M.; Neumann, T.A.; Larsen, C.F. Assessment of altimetry using ground-based GPS data from the 88S Traverse, Antarctica, in support of ICESat-2. Cryosphere 2019, 13, 579–590. [Google Scholar] [CrossRef] [Green Version]
- Markus, T.; Neumann, T.; Martino, A.; Abdalati, W.; Brunt, K.; Csatho, B.; Farrell, S.; Fricker, H.; Gardner, A.; Harding, D.; et al. The Ice, Cloud, and land Elevation Satellite-2 (ICESat-2): Science requirements, concept, and implementation. Remote Sens. Environ. 2017, 190, 260–273. [Google Scholar] [CrossRef]
- Pratibha, S.; Kulkarni, A. Decadal change in supraglacial debris cover in Baspa basin, Western Himalaya. Curr. Sci. India 2018, 114, 792–799. [Google Scholar] [CrossRef]
- Alifu, H.; Tateishi, R.; Johnson, B. A new band ratio technique for mapping debris-covered glaciers using Landsat imagery and a digital elevation model. Int. J. Remote Sens. 2015, 36, 2063–2075. [Google Scholar] [CrossRef]
- Alifu, H.; Johnson, B.A.; Tateishi, R. Delineation of Debris-Covered Glaciers Based on a Combination of Geomorphometric Parameters and a TIR/NIR/SWIR Band Ratio. IEEE J. Sel. Top. Appl. Earth Obs. Remote Sens. 2016, 9, 781–792. [Google Scholar] [CrossRef]
- Alifu, H.; Hirabayashi, Y.; Johnson, B.; Vuillaume, J.; Kondoh, A.; Urai, M. Inventory of Glaciers in the Shaksgam Valley of the Chinese Karakoram Mountains, 1970’2014. Remote Sens. 2018, 10, 1166. [Google Scholar] [CrossRef] [Green Version]
- Zhang, M.; Wang, X.H.; Shi, C.L.; Yan, D.J. Automated Glacier Extraction Index by Optimization of Red/SWIR and NIR/SWIR Ratio Index for Glacier Mapping Using Landsat Imagery. Water 2019, 11, 1223. [Google Scholar] [CrossRef] [Green Version]
- McFeeters, S.K. The use of the Normalized Difference Water Index (NDWI) in the delineation of open water features. Int. J. Remote Sens. 1996, 17, 1425–1432. [Google Scholar] [CrossRef]
- Raup, B.; Racoviteanu, A.; Khalsa, S.J.S.; Helm, C.; Armstrong, R.; Arnaud, Y. The GLIMS geospatial glacier database: A new tool for studying glacier change. Global Planet Chang. 2007, 56, 101–110. [Google Scholar] [CrossRef]
- Ke, L.H.; Song, C.Q.; Yong, B.; Lei, Y.B.; Ding, X.L. Which heterogeneous glacier melting patterns can be robustly observed from space? A multi-scale assessment in southeastern Tibetan Plateau. Remote Sens. Environ. 2020, 242, 111777. [Google Scholar] [CrossRef]
- Gardelle, J.; Berthier, E.; Arnaud, Y. Impact of resolution and radar penetration on glacier elevation changes computed from DEM differencing. J. Glaciol. 2017, 58, 419–422. [Google Scholar] [CrossRef] [Green Version]
- Shean, D.E.; Alexandrov, O.; Moratto, Z.M.; Smith, B.E.; Joughin, I.R.; Porter, C.; Morin, P. An automated, open-source pipeline for mass production of digital elevation models (DEMs) from very-high-resolution commercial stereo satellite imagery. ISPRS J. Photogramm. Remote Sens. 2016, 116, 101–117. [Google Scholar] [CrossRef] [Green Version]
- Nuth, C.; Kääb, A. Co-registration and bias corrections of satellite elevation data sets for quantifying glacier thickness change. Cryosphere 2011, 5, 271–290. [Google Scholar] [CrossRef] [Green Version]
- Wang, Y.; Ye, Q. arcPycor: An open-source automated GIS tool to co-register elevation datasets. J. Mt. Sci. 2021, 18, 923–931. [Google Scholar] [CrossRef]
- Huss, M. Density assumptions for converting geodetic glacier volume change to mass change. Cryosphere 2013, 7, 877–887. [Google Scholar] [CrossRef] [Green Version]
- Das, S.; Sharma, M.C. Glacier changes between 1971 and 2016 in the Jankar Chhu Watershed, Lahaul Himalaya, India. J. Glaciol. 2019, 65, 13–28. [Google Scholar] [CrossRef] [Green Version]
- Molg, N.; Bolch, T.; Rastner, P.; Strozzi, T.; Paul, F. A consistent glacier inventory for Karakoram and Pamir derived from Landsat data: Distribution of debris cover and mapping challenges. Earth Syst. Sci. Data 2018, 10, 1807–1827. [Google Scholar] [CrossRef] [Green Version]
- Ye, Q.H.; Bolch, T.; Naruse, R.; Wang, Y.Z.; Zong, J.B.; Wang, Z.Y.; Zhao, R.; Yang, D.Q.; Kang, S.C. Glacier mass changes in Rongbuk catchment on Mt. Qomolangma from 1974 to 2006 based on topographic maps and ALOS PRISM data. J. Hydrol. 2015, 530, 273–280. [Google Scholar] [CrossRef]
- Paul, F.; Rastner, P.; Azzoni, R.S.; Diolaiuti, G.; Fugazza, D.; Le Bris, R.; Nemec, J.; Rabatel, A.; Ramusovic, M.; Schwaizer, G.; et al. Glacier shrinkage in the Alps continues unabated as revealed by a new glacier inventory from Sentinel-2. Earth Syst. Sci. Data 2020, 12, 1805–1821. [Google Scholar] [CrossRef]
- Intsiful, A.; Ambinakudige, S. Glacier Cover Change Assessment of the Columbia Icefield in the Canadian Rocky Mountains, Canada (1985–2018). Geosciences 2020, 11, 19. [Google Scholar] [CrossRef]
- Tielidze, L.G.; Nosenko, G.A.; Khromova, T.E.; Paul, F. Strong acceleration of glacier area loss in the Greater Caucasus between 2000 and 2020. Cryosphere 2022, 16, 489–504. [Google Scholar] [CrossRef]
- Ji, Q.; Yang, T.-b.; He, Y.; Chen, J.; Wang, K. Glacier changes in the eastern Nyainqêntanglha Range of Tibetan Plateau from 1975 to 2013. J. Mt. Sci. 2016, 13, 682–692. [Google Scholar] [CrossRef]
- Negi, H.S.; Kumar, A.; Kanda, N.; Thakur, N.K.; Singh, K.K. Status of glaciers and climate change of East Karakoram in early twenty-first century. Sci. Total Environ. 2021, 753, 141914. [Google Scholar] [CrossRef]
- Qureshi, M.A.; Yi, C.; Xu, X.; Li, Y. Glacier status during the period 1973–2014 in the Hunza Basin, Western Karakoram. Quatern. Int. 2017, 444, 125–136. [Google Scholar] [CrossRef]
- Donghui, S.; Shiyin, L.; Yongjian, D.; Lizong, W.; Wei, D.; Wanqin, G.; Yuan, W.; Junli, X.; Xiaojun, Y.; Zhilong, G.; et al. Glacier changes in the Koshi River basin, central Himalaya, from 1976 to 2009, derived from remote-sensing imagery. Ann. Glaciol. 2017, 55, 61–68. [Google Scholar] [CrossRef] [Green Version]
- Pan, B.; Cao, B.; Wang, J.; Zhang, G.; Zhang, C.; Hu, Z.; Huang, B. Glacier variations in response to climate change from 1972 to 2007 in the western Lenglongling mountains, northeastern Tibetan Plateau. J. Glaciol. 2017, 58, 879–888. [Google Scholar] [CrossRef] [Green Version]
- Patel, L.K.; Sharma, A.; Sharma, P.; Singh, A.; Thamban, M. Glacier area changes and its relation to climatological trends over Western Himalaya between 1971 and 2018. J. Earth Syst. Sci. 2021, 130, 217. [Google Scholar] [CrossRef]
- Zhou, Y.; Chen, J.; Cheng, X. Glacier Velocity Changes in the Himalayas in Relation to Ice Mass Balance. Remote Sens. 2021, 13, 3825. [Google Scholar] [CrossRef]
- Bandyopadhyay, D.; Singh, G.; Birajdar, F.J.C.S. Remote sensing analysis of changes in Chorabari glacier, Central Himalaya, India. Curr. Sci. 2018, 114, 771–775. [Google Scholar] [CrossRef]
- Garg, P.K.; Shukla, A.; Jasrotia, A.S. Influence of topography on glacier changes in the central Himalaya, India. Global Planet Chang. 2017, 155, 196–212. [Google Scholar] [CrossRef]
- Patel, L.; Sharma, P.; Fathima, T.; Thamban, M. Geospatial observations of topographical control over the glacier retreat, Miyar basin, Western Himalaya, India. Environ. Earth Sci. 2018, 77, 190. [Google Scholar] [CrossRef]

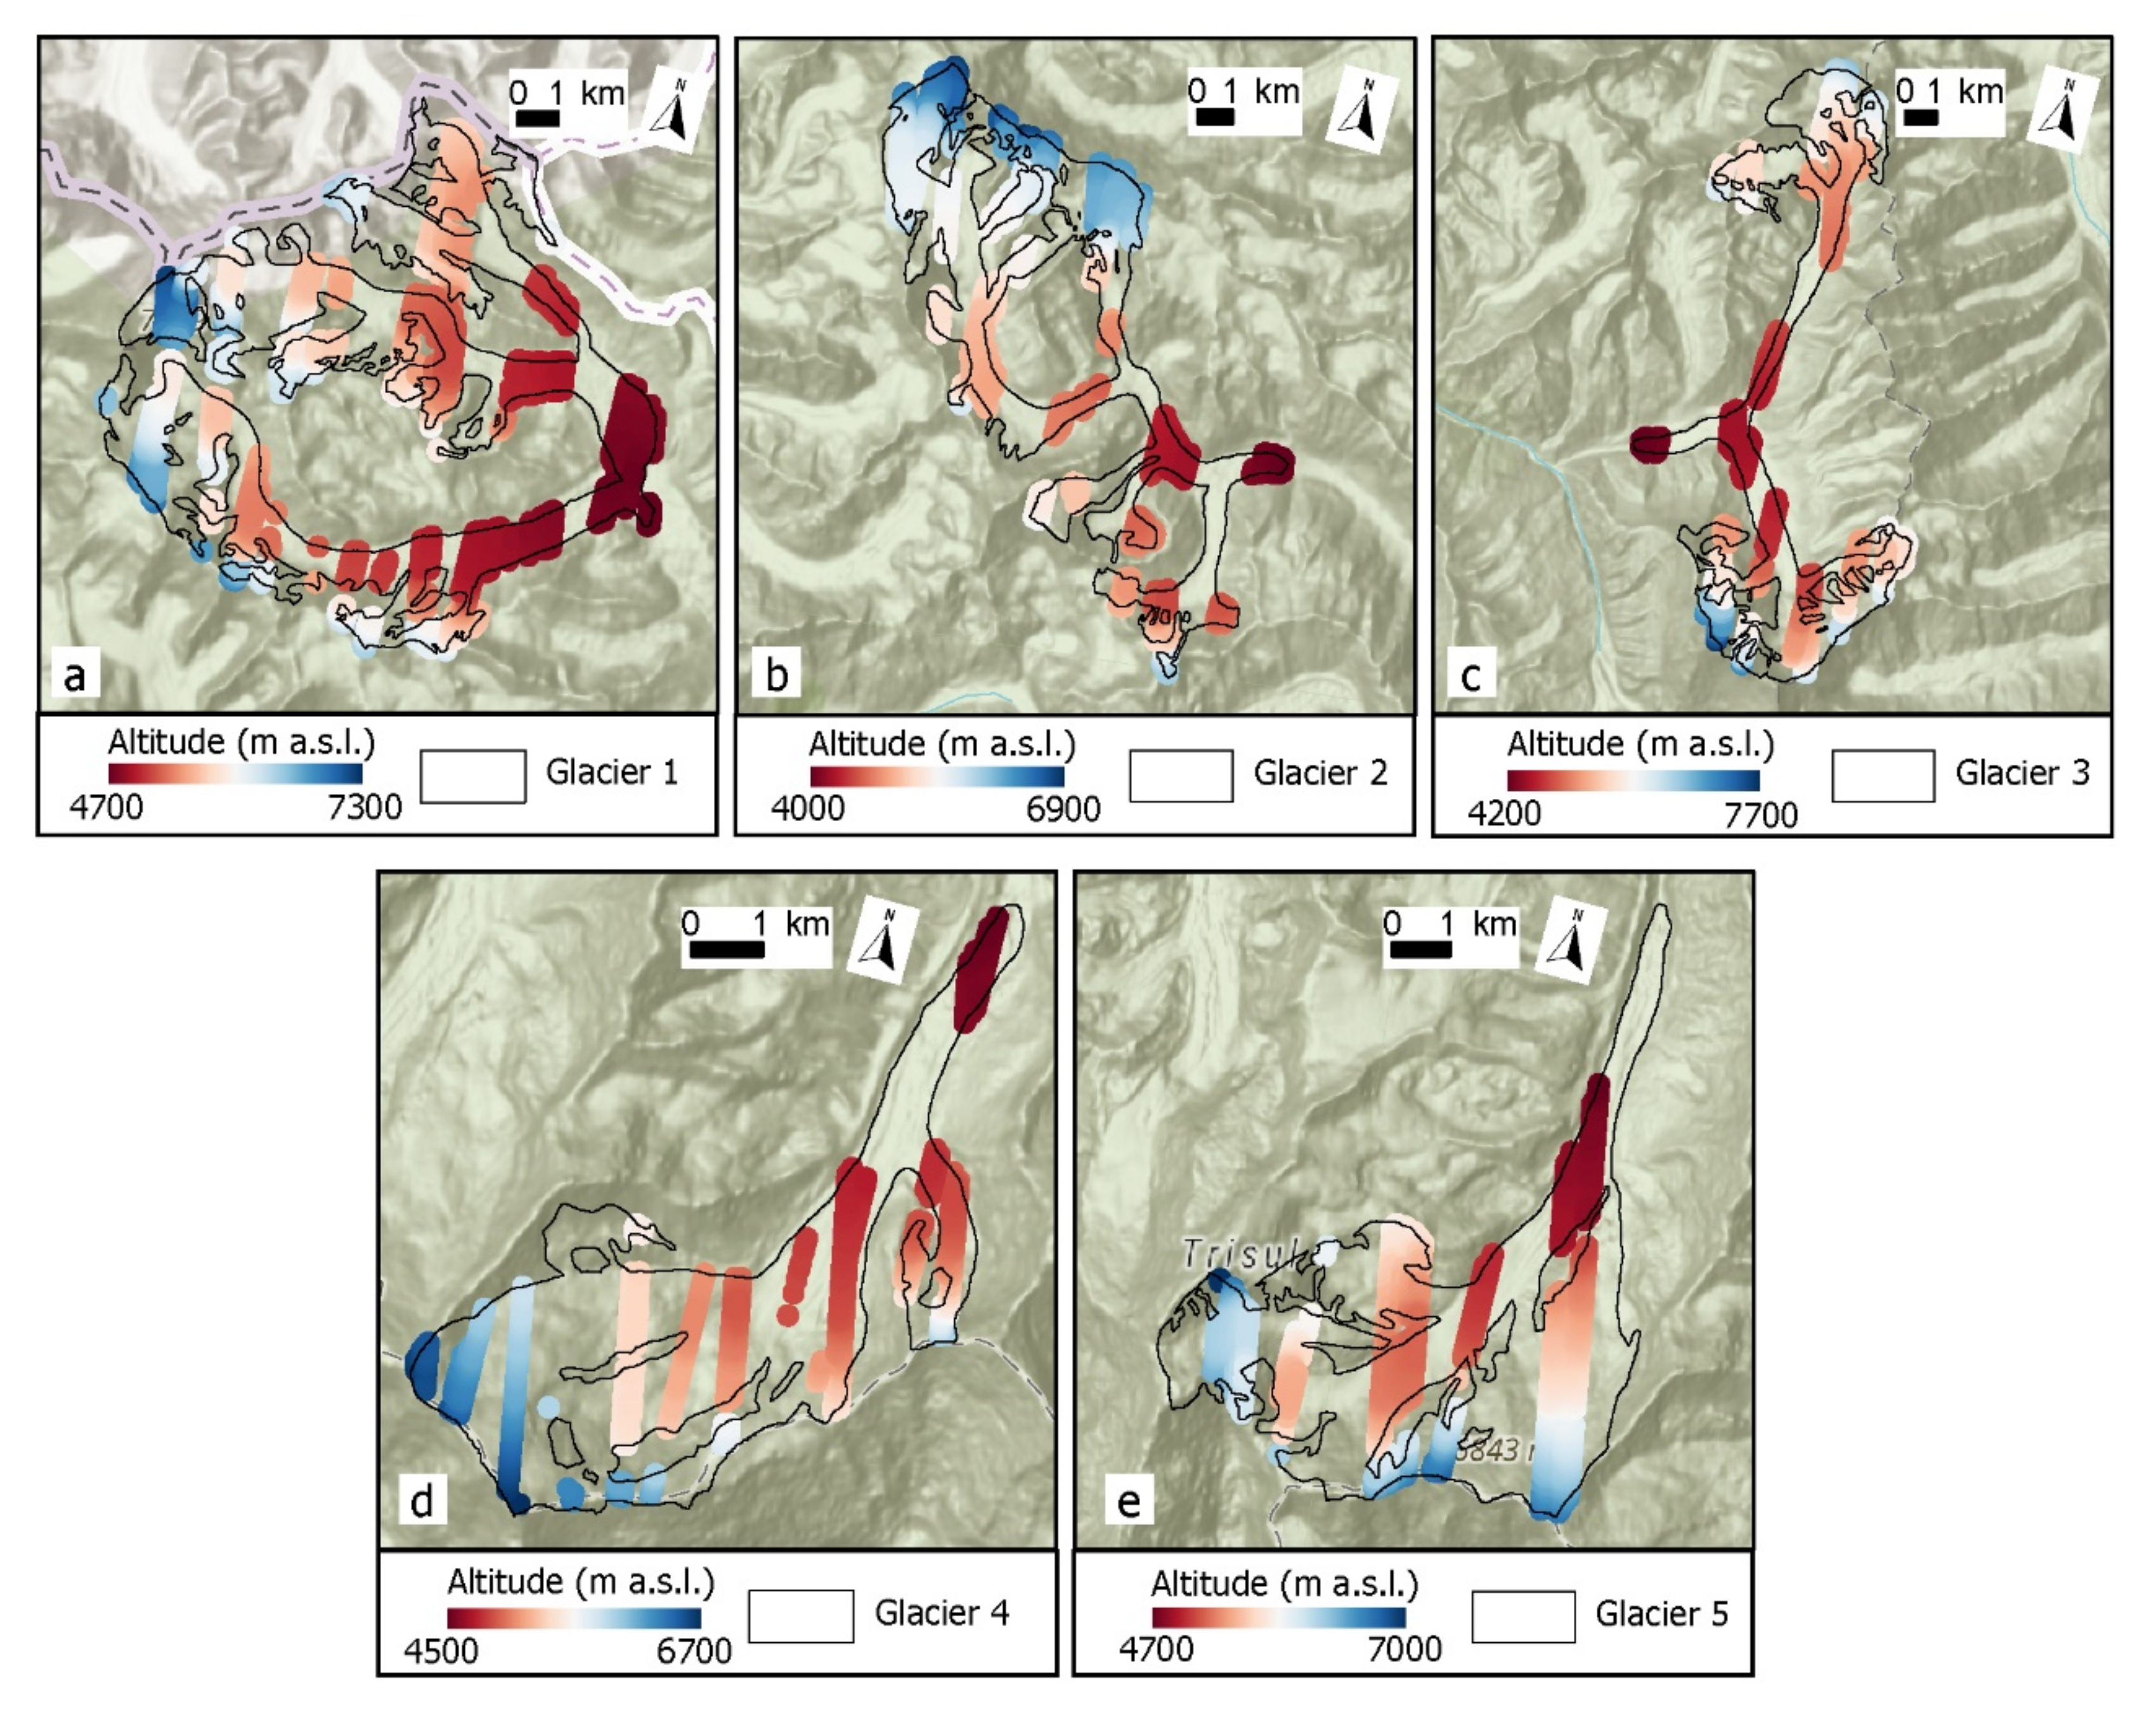
| Glacier Number | Glaciers Name | GGI-18 GLIMS ID | Aspect | Glacier Area (km2) | Number of ICESat-2 Footprints |
|---|---|---|---|---|---|
| Glacier 1 | Raikana Glacier | G079664E30918N | East | 61.05 | 7664 |
| Ganesh Glacier | |||||
| Uttari Rikana Glacier | |||||
| Puribi Kamet Glacier | |||||
| Glacier 2 | Bankund Glacier | G079652E30828N | East | 45.55 | 5268 |
| Glacier 3 | Rishi Glacier | G079986E30444N | West | 38.71 | 3578 |
| Uttari Nanda Devi Glacier | |||||
| Glacier 4 | Mrigthuni Dakkhni Rishi Glacier | G079897E30298N | North | 20.66 | 1872 |
| Glacier 5 | Trisul Glacier | G079897E30298N | North | 28.66 | 2997 |
| Glacier 6 | Ronti Glacier | G079733E30379N | North | 0.47 | * |
| Datasets | Time | Spatial Resolution | Source/Reference |
|---|---|---|---|
| Landsat 5 TM | 9 October 1994 | 30 m | https://earthexplorer.usgs.gov/ (accessed on 23 April 2021) |
| Landsat 7 ETM+ | 8 October 2001 | 30 m | https://earthexplorer.usgs.gov/ (accessed on 23 April 2021) |
| Landsat 8 OLI | 16 October 2020 | 30 m | https://earthexplorer.usgs.gov/ (accessed on 23 April 2021) |
| SRTM-C band | 11–22 February 2000 | 30 m | https://search.earthdata.nasa.gov/ (accessed on 2 May 2021) |
| SRTM-X band | 11–22 February 2000 | 90 m | https://geoservice.dlr.de/ (accessed on 15 May 2021) |
| NASA DEM | 11–22 February 2000 | 30 m | https://search.earthdata.nasa.gov/ (accessed on 5 April 2022) |
| TanDEM-X | December 2010 to 2015 | 90 m | https://geoservice.dlr.de/ (accessed on 15 May 2021) |
| ICESat-2 ATL06 | 25 October 2018–20 December 2021 | ~17 m | https://search.earthdata.nasa.gov/ (accessed on 5 April 2022) |
| DH/DTM | 1975–2016 | 30 m | [26] |
| DH/DTB | 2000–2016 | 30 m | [4] |
| DH/DTH | 2000–2020 | 100 m | [27] |
| Climate data | 1950–2021 | 9 km | [28,29] |
| Dataset | Horizontal Reference | Vertical Datum | Period |
|---|---|---|---|
| NASA DEM | WGS 1984 | EGM96 Geoid | 2000 |
| TanDEM-X | WGS 1984 | Ellipsoid WGS 1984 | 2013 |
| SRTM-C band | WGS 1984 | EGM96 Geoid | 2000 |
| SRTM-X band | WGS 1984 | Ellipsoid WGS 1984 | 2000 |
| Glacier Inventory | Total Glacier Area (km2) | Buffer Area (km2) | Glacier Area Uncertainty (%) |
|---|---|---|---|
| NGI2001 | 477.47 | 35.23 | 6.87% |
| NGI2020 | 418.52 | 36.18 | 7.96% |
| TPG2018 | 297.40 | 19.58 | 6.18% |
| RGI6.0 | 436.24 | 26.02 | 5.63% |
| GGI-18 | 518.50 | 34.06 | 6.16% |
| Glacier Inventories (A1–A0) | A0 (km2) | A0 (%) | A1 (km2) | A1 (%) | ∆A (km2) | AP (%) |
|---|---|---|---|---|---|---|
| NDG2020–NDG2001 | 477.47 | 16% | 418.52 | 14% | –58.95 | –12% |
| NDG 2020–TPG 2018 | 297.40 | 10% | 418.52 | 14% | 121.12 | 41% |
| NDG2020–GGI-18 | 518.50 | 18% | 418.52 | 14% | –99.98 | –19% |
| NDG2020–RGI 6.0 | 436.24 | 15% | 418.52 | 14% | –17.72 | –4% |
| TPG 2018–NDG 2001 | 477.47 | 16% | 297.40 | 10% | –180.07 | –38% |
| GGI-18–NDG2001 | 477.47 | 16% | 518.50 | 18% | 41.03 | 9% |
| RGI 6.0–NDG2001 | 477.47 | 16% | 436.24 | 15% | –41.23 | –9% |
| Datasets | Time Period | Mean Elevation Change (m a−1) | Geodetic Mass Balance (m w.e.a−1) | Mass Balance (Gt a−1) | On Glacier Observation | On Glacier Observed Area (%) | Off-Glacier Observation (Stable Terrain) |
|---|---|---|---|---|---|---|---|
| TanDEM-X- SRTM | 2000–2013 | –0.32 ± 0.05 | –0.27 ± 0.10 | –0.12 | 517.06 | 100% | 700.35 |
| ICESat-2 | 2000–2018 | –0.28 ± 0.09 | –0.24 ± 0.005 | –0.09 | 10,724 | − | 46,706 |
| ICESat-2 | 2000–2019 | –0.31 ± 0.07 | –0.27 ± 0.004 | –0.10 | 14,251 | − | 63,489 |
| ICESat-2 | 2000–2020 | –0.25 ± 0.03 | –0.22 ± 0.002 | –0.11 | 15,429 | − | 48,277 |
| ICESat-2 | 2000–2021 | –0.27 ± 0.09 | –0.23 ± 0.005 | –0.10 | 13,074 | − | 47,800 |
| ICESat-2 | 2018–2021 | –0.26 ± 0.07 | –0.22 ± 0.004 | –0.10 | 52,736 | − | 204,369 |
| DH/DTB | 2000–2016 | –0.31 ± 0.0005 | –0.26 ± 0.001 | –0.12 | 495.41 | 96% | 1770.58 |
| DH/DTM | 1975–2000 | –0.26 ± 0.002 | –0.22 ± 0.002 | –0.10 | 176.88 | 34% | 307.95 |
| DH/DTM | 2000–2016 | –0.29 ± 0.004 | –0.25 ± 0.003 | –0.08 | 300.7 | 58% | 400.55 |
| DH/DTH | 2000–2005 | –0.33 ± 0.001 | –0.28 ± 0.0001 | –0.13 | 471.3 | 91% | 1702.4 |
| DH/DTH | 2005–2010 | –0.34 ± 0.0018 | –0.29 ± 0.0001 | –0.14 | 471.3 | 91% | 1702.4 |
| DH/DTH | 2010–2015 | –0.32 ± 0.0013 | –0.28 ± 0.0001 | –0.13 | 471.3 | 91% | 1702.4 |
| DH/DTH | 2015–2020 | –0.33 ± 0.0014 | –0.28 ± 0.0001 | –0.13 | 471.3 | 91% | 1702.4 |
| DH/DTH | 2000–2010 | –0.33 ± 0.0012 | –0.28 ± 0.0001 | –0.13 | 471.3 | 91% | 1702.4 |
| DH/DTH | 2010–2020 | –0.33 ± 0.0013 | –0.28 ± 0.0001 | –0.13 | 471.3 | 91% | 1702.4 |
| DH/DTH | 2000–2020 | –0.33 ± 0.0013 | –0.28 ± 0.0001 | –0.13 | 471.3 | 91% | 1702.4 |
| Glaciers | Change Rate | Time Interval | |||||||
|---|---|---|---|---|---|---|---|---|---|
| 2000–2005 | 2005–2010 | 2010–2015 | 2015–2020 | 2000–2010 | 2010–2020 | 2000–2020 | 2000–2013 | ||
| Glacier 1 | dh/dt (m a−1) | –0.58 | –0.51 | –0.39 | –0.32 | –0.54 | –0.35 | –0.45 | –0.58 |
| MB (m w.e.a−1) | –0.49 | –0.44 | –0.33 | –0.28 | –0.46 | –0.3 | –0.38 | –0.5 | |
| MC (Gt. a−1) | –0.028 | –0.025 | –0.018 | –0.015 | –0.026 | –0.017 | –0.022 | –0.029 | |
| Glacier 2 | dh/dt (m a−1) | –0.08 | –0.26 | –0.46 | –0.63 | –0.17 | –0.54 | –0.36 | –0.09 |
| MB (m w.e.a−1) | –0.07 | –0.22 | –0.39 | –0.53 | –0.14 | –0.46 | –0.3 | –0.08 | |
| MC (Gt. a−1) | –0.002 | –0.006 | –0.011 | –0.015 | –0.004 | –0.013 | –0.009 | 0.000 | |
| Glacier 3 | dh/dt (m a−1) | –0.31 | –0.41 | –0.61 | –0.75 | –0.36 | –0.68 | –0.52 | –0.38 |
| MB (m w.e.a−1) | –0.26 | –0.35 | –0.52 | –0.64 | –0.3 | –0.58 | –0.44 | –0.32 | |
| MC (Gt. a−1) | –0.005 | –0.006 | –0.01 | –0.012 | –0.006 | –0.011 | –0.008 | –0.006 | |
| Glacier 4 | dh/dt (m a−1) | –0.56 | –0.5 | –0.33 | –0.27 | –0.52 | –0.3 | –0.41 | –0.46 |
| MB (m w.e.a−1) | –0.47 | –0.43 | –0.28 | –0.23 | –0.44 | –0.26 | –0.35 | –0.39 | |
| MC (Gt. a−1) | –0.021 | –0.019 | –0.012 | –0.01 | –0.019 | –0.011 | –0.015 | –0.016 | |
| Glacier 5 | dh/dt (m a−1) | –0.18 | –0.37 | –0.53 | –0.69 | –0.27 | –0.61 | –0.44 | –0.29 |
| MB (m w.e.a−1) | –0.16 | –0.31 | –0.45 | –0.58 | –0.23 | –0.52 | –0.37 | –0.24 | |
| MC (Gt. a−1) | –0.004 | –0.01 | –0.015 | –0.02 | –0.007 | –0.018 | –0.012 | –0.006 | |
| Glacier 6 | dh/dt (m a−1) | –0.05 | 0.08 | 0.22 | 0.37 | 0.01 | 0.3 | 0.15 | 0.31 |
| MB (m w.e.a−1) | –0.04 | 0.06 | 0.19 | 0.32 | 0.01 | 0.25 | 0.13 | 0.27 | |
| MC (Gt. a−1) | –0.00001 | 0.00007 | 0.00016 | 0.00025 | 0.00003 | 0.0002 | 0.00012 | 0.00021 | |
| Glaciers | Change Rate | A2018 | M2019 1 | A2019 1 | M2020 | A2020 | M2021 | A2021 |
|---|---|---|---|---|---|---|---|---|
| Glacier 1 | dh/dt (m a−1) | –0.62 | –0.27 | –0.23 | –0.08 | –0.65 | –0.39 | –0.40 |
| MB (m w.e.a−1) | –0.53 | –0.23 | –0.19 | –0.07 | –0.55 | –0.33 | –0.34 | |
| MC (Gt. a−1) | –0.018 | –0.006 | –0.004 | 0.000 | –0.023 | –0.013 | –0.018 | |
| Counts | 1579 | 538 | 1105 | 1170 | 1157 | 919 | 1196 | |
| Glacier 2 | dh/dt (m a−1) | –0.47 | –0.38 | –0.05 | 0.06 | –0.36 | –0.11 | –0.09 |
| MB (m w.e.a−1) | –0.40 | –0.32 | –0.04 | 0.05 | –0.30 | –0.09 | –0.08 | |
| MC (Gt. a−1) | –0.011 | –0.005 | 0.004 | 0.005 | –0.004 | –0.002 | 0.003 | |
| Counts | 702 | 763 | 722 | 670 | 1051 | 230 | 1130 | |
| Glacier 3 2 | dh/dt (m a−1) | –0.27 | − | –0.37 | 0.47 | –0.38 | –0.17 | –0.30 |
| MB (m w.e.a−1) | –0.23 | –0.32 | 0.40 | –0.32 | –0.15 | –0.25 | ||
| MC (Gt. a−1) | 0.001 | –0.002 | 0.002 | –0.012 | –0.004 | –0.004 | ||
| Counts | 610 | 641 | 42 | 966 | 854 | 465 | ||
| Glacier 4 | dh/dt (m a−1) | –0.88 | 0.01 | –0.57 | 0.58 | –0.30 | –0.63 | –0.16 |
| MB (m w.e.a−1) | –0.75 | 0.01 | –0.48 | 0.49 | –0.25 | –0.53 | –0.13 | |
| MC (Gt. a−1) | –0.002 | 0.001 | –0.002 | 0.001 | –0.002 | –0.001 | 0.003 | |
| Counts | 12 | 183 | 446 | 121 | 282 | 258 | 570 | |
| Glacier 5 3 | dh/dt (m a−1) | –0.06 | 1.03 | –0.13 | –0.35 | 0.33 | − | 0.36 |
| MB (m w.e.a−1) | –0.05 | 0.87 | –0.11 | –0.30 | 0.28 | 0.31 | ||
| MC (Gt. a−1) | 0.001 | 0.004 | 0.003 | –0.001 | 0.005 | 0.001 | ||
| Counts | 1026 | 29 | 456 | 1243 | 174 | 69 |
Publisher’s Note: MDPI stays neutral with regard to jurisdictional claims in published maps and institutional affiliations. |
© 2022 by the authors. Licensee MDPI, Basel, Switzerland. This article is an open access article distributed under the terms and conditions of the Creative Commons Attribution (CC BY) license (https://creativecommons.org/licenses/by/4.0/).
Share and Cite
Ali, N.; Ye, Q.; Zhang, X.; Ji, X.; Hu, Y.; Zhu, L.; Ali, A. Glacier Changes in India’s Dhauliganga Catchment over the Past Two Decades. Remote Sens. 2022, 14, 5692. https://doi.org/10.3390/rs14225692
Ali N, Ye Q, Zhang X, Ji X, Hu Y, Zhu L, Ali A. Glacier Changes in India’s Dhauliganga Catchment over the Past Two Decades. Remote Sensing. 2022; 14(22):5692. https://doi.org/10.3390/rs14225692
Chicago/Turabian StyleAli, Nauman, Qinghua Ye, Xueqin Zhang, Xinhui Ji, Yafan Hu, Liping Zhu, and Arslan Ali. 2022. "Glacier Changes in India’s Dhauliganga Catchment over the Past Two Decades" Remote Sensing 14, no. 22: 5692. https://doi.org/10.3390/rs14225692